


Languages
Pages
Legal


Acknowledgements
Dave Heineman
Governor of Nebraska
Catherine Lang
Commissioner of Labor
Phillip Baker
Research Administrator
Scott Hunzeker
Research Supervisor
Ben Kuspa
Research Analyst
Lindsay Burford
Research Analyst
Ryan Caldwell
Research Analyst
Betty Leishman
Research Analyst
Mary Findlay
Research Analyst
Jacob Liudahl
Research Analyst
Jodie Meyer
Research Analyst
Trevor Nelson
Research Analyst
Billee Eastman
Staff Assistant
The Nebraska Department of Labor would also like to thank all the employers of Nebraska who participated in
this and other studies to the benefit of our state.
Contact Nebraska Labor Market Information:
550 South 16th Street, P.O. Box 94600
Lincoln, NE 68509-4600
Phone: 1-800-876-1377
E-Mail: [email protected]
More information is available online at http://neworks.nebraska.gov.
Published August, 2011.
This workforce solution was funded by a grant awarded by the U.S. Department of Labor’s Employment and Training Administration.
The solution was created by the grantee and does not necessarily reflect the official position of the U.S. Department of Labor. The
Department of Labor makes no guarantees, warranties, or assurances of any kind, express or implied, with respect to such
information, including any information on linked sites and including, but not limited to, accuracy of the information or its
completeness, timeliness, usefulness, adequacy, continued availability, or ownership. This solution is copyrighted by the institution
that created it. Internal use by an organization and/or personal use by an individual for non-commercial purposes is permissible. All
other uses require the prior authorization of the copyright owner.

Page 3 of 31 New Hires in Nebraska
Table of Contents
Introduction Page 4
New Hires Sampling and Methodology Page 4
Demographic Characteristics of New Hires Page 5
Pay and Benefits Page 5
New Hires Occupations Page 7
New Hires Skills & Education Page 7
New Hires and Green Jobs Page 8
Appendix A: Data Tables Page 11
Appendix B: Sample Survey Form Page 28

Page 4 of 31 New Hires in Nebraska
Introduction
During the end of 2009, Nebraska had a labor force
of approximately 900,000 individuals working over a
million jobs. Of these jobs, about a tenth of them
were filled by newly hired individuals, a percentage
that holds true over most periods of employment.
These new hires represent a significant investment
for employers in both time and money. Finding the
right employees can reduce turnover and lead to a
more stable, skilled workforce.
As part of the Labor Market Information
Improvement initiative, Nebraska elected to study
the characteristics of newly hired workers in the
workforce. The goal of this study was to collect
information about a sample of new hires to
determine the demographic characteristics,
industry and occupational composition, pay, and
benefits. In addition to this information, data on the
sampled employees’ skills, ideal candidate skills,
and pre-determined skills was collected so as to
better understand what employers would like to
see in candidates and how the workforce
development system can better prepare potential
job candidates.
New Hires Sampling and Methodology
The definition of a new hire for the purposes of this
study is an individual who had a new employer-
employee relationship for the sampling quarter.
Respondents were identified based on the quarterly
wage files for the third quarter of 2009 through the
first quarter of 2010. An individual was assumed to
be a new hire if wages existed during the fourth
quarter of 2009 and no matching wages were found
at the same employer during the prior quarter of
2009.
To further refine the sample pool, new hires were
also matched to the following quarter. If the hire
also had a wage record in the first quarter of 2010
and earned at least $3,217 (a wage of $8.25 per
hour for 30 hours over 13 weeks) in either the
fourth quarter of 2009 or the first quarter of 2010,
they were included in the sampling frame. These
records were then matched to those people who
had either received Workforce Investment Act
funding for training purposes or those who had
registered at some point with Nebraska Department
of Labor’s Staff Assisted Services. These hires were
given preference for sample selection.
The sample consisted of 2,747 new hires from 958
businesses. A maximum of four questionnaires was
set for each business in order to prevent distortion
of results or an undue strain for employers. Data
collection was completed over two waves during
November of 2010 through February of 2011.
Employers were contacted by phone before mailing
for address verification and to get a proper contact
name or title. The employer was able to respond
using either the mailed form, an online application,
phone, or fax. A total of 1,304 responses were
received, a 47.5% response rate. Most businesses
elected to respond by mail with 67.5% of the
responses. Online completion was the second
highest preferred method with 27.8% of responses.
Phone and fax responses together constituted only
4.8% of responses.
67%
28%
4% 1%
Response Method
Online
Fax
Phone

Page 5 of 31 New Hires in Nebraska
Demographic Characteristics of New Hires
The demographic composition of new hires in
Nebraska is similar to that of the Nebraska’s
workforce with some exceptions. Within the
sample, there were more males (58.2%) than
females at (41.8%) compared to the workforce at
the same time which had an almost equal amount
of males and females (49.8% males and 50.2%
females).1 There was also a higher concentration of
employees identified as Hispanic than expected.
Employers said 14.1% of new hires were Hispanic
while only 6.5% of the workforce during the same
time period was Hispanic.2 The vast majority of the
sampled new hires were Caucasian at 87.1%,
followed by Black/African-American with 6.5%.
Asian, American Indian or Alaskan Native, and Other
made up the balance of the employees.
The mean age of the new hires in the study was
37.9 years old,3 younger than the mean age of the
workforce at 40.6 years old. More of the new hires
fell in the younger age categories. The largest group
was those in the 25-29 age group; they made up
16.4% of all new hires. As the age groups
progressed into the older ranges, the percentages
Table 1: New Hires Age Compared to Nebraska Workforce
Age New Hires Workforce*
24 or younger 13.8% 17.2%
25-34 31.1% 22.3%
35-44 24.3% 19.6%
45-54 19.9% 21.9%
55-64 9.8% 14.5%
65 or older 1.1% 4.5%
Mean 37.9 40.6**
*Data from US Census Bureau
**Mean calculated using midpoint of ranges
1 Nebraska Q4 2009 Local Employment Dynamics
2 Nebraska Q4 2009 Local Employment Dynamics
3 When a birth date was given, the age was calculated
based on the age of as of 1/1/2011.
decreased. The 50-54, 55-59, and 60 or older age
groups were all in the single digit percentage range.
It is worth noting that these characteristics were
reported by the employer rather than the
employee, which may have led to some
inaccuracies. There was a higher percentage of non-
response and “do not know” responses to
demographics questions than any questions in the
survey. Non-responses were not included in percent
calculations.
Pay and Benefits
On the whole, pay for new hires was much lower
than the average pay for the workforce. This was
not unexpected, but it was reflective of the
occupation and experience level found in the new
hires. The average annual pay for all new hires as
reported by employers was $25,928 (based on a 40
hour work week). The average annual income
across all industries during the same time period
was $36,657.4 About two-thirds (66.1%) of new
hires earned less than that average as they earned
between $15,000 and $24,999. No new hires in our
sample earned less than $15,000 due to the wage
restrictions applied during the sampling process and
the assumption of full-time employment. Pay for
new hires was higher than the Occupational
Employment Statistic’s tenth percentile wages,
which is what the lowest paid 10% of individuals in
any given industry are expected to earn. The tenth
percentile wage for the workforce in the fourth
quarter of 2009 was $15,975, which was on the
lowest end of wages earned by new hires. This put
the average new hires wage approximately halfway
between the tenth percentile wage and average
wage for the entire workforce.
When income was analyzed by industry, some
industries had a much higher discrepancy between
4 Occupation Employment Statistics, Q4 2009, All
Occupations, Statewide

Page 6 of 31 New Hires in Nebraska
new hires wages and the average industry wage.
Both the Financial Activities industry and the
Professional & Business Services industry had
average wages that exceeded the new hires’ wages
by 70% or more. The occupations reported within
these industries as new hires were more likely to be
lower paid jobs and these lower paid jobs were not
offset by the actual staffing pattern usually present
in the entire workforce. In the Financial Activities
super sector, 35.7% of the jobs reported were for
Customer Service Representatives, an occupation
that has typically has lower wages compared to
other occupations in the same industry. In the
Professional & Business Services industry, the top
two occupations reported were for Security Guards
and Janitors and Cleaners, Except Maids and
Housekeeping Cleaners. These jobs have a lower
barrier to entry and a higher turnover rate than
more lucrative positions, which is why more of
them are found in a new hires subset of the total
workforce.
The only industry that had a higher average new
hires wage than the average wage reported by OES
is in the Leisure and Hospitality Industry. The
sampled new hires in this industry earned 7.3%
more than the average wage in the workforce.
Looking at the occupation distribution, this outlier
seems to again be a result of a non-representative
distribution of staffing in the industry. There were
39 total occupations that reported wages in this
industry and 50% of them were in the occupations
related to food preparation or serving. The actual
estimated employment for the Leisure and
Hospitality industry is composed of 72.1% food
service workers who earn an average wage that is
lower than the average new hires’ wage.
Although most people were reported as being paid
by a regular interval, usually by the hour, some
individuals were paid by piece. Heavy and Tractor-
Trailer Truck Drivers had wages that were usually
reported by miles driven. The low end of the pay
scale was $0.30 per mile and the highest was $0.43
per mile with a mean of $0.35 per mile.
Additionally, some businesses reported that
workers either worked on commission or received
tips as part of their pay, for these occupations no
wage was calculated. Other businesses reported
that bonuses were available on a periodic basis, but
only base pay was taken into account.
Table 2: New Hires’ Wages
Selection (N=) Percentage
$15,000 to $19,999 28.7%
$20,000 to $24,999 37.4%
$25,000 to $29,999 13.6%
$30,000 to $34,999 6.9%
$35,000 to $39,999 5.2%
$40,000 to $44,999 3.0%
$45,000 to $49,999 1.8%
$50,000 or more 3.4%
Mean $25,928
Median $22,880

Page 7 of 31 New Hires in Nebraska
New Hires’ Occupations
Employers were asked to supply both a job title and
a list of worker responsibilities for the new hire in
question. This information was used to code each
occupation using the Standard Occupation
Classification (SOC) system used by the Bureau of
Labor Statistics. There are twenty-three major
occupational categories in the SOC system and the
survey had respondents from every category except
for Military Occupations. The occupational category
with the largest number of employees was
Production Occupations at 16%, followed by Office
and Administrative Support Occupations with 15.6%
and Transportation and Material Moving
Occupations with 13.7%. Five other major
occupational categories had over 5% of the
employees: Healthcare Support Occupations (5.4%);
Installation, Maintenance, and Repair Occupations
(6.9%); Sales and Related Occupations (6.6%);
Construction and Extraction Occupations (6%); and
Healthcare Practitioners and Technical Occupations
(5.4%). A few of the occupational categories
contained less than 1% of the employees that were
surveyed: Arts, Design, Entertainment, Sports, and
Media Occupations; Computer and Mathematical
Occupations; Architectures and Engineering
Occupations; Life, Physical, and Social Science
Occupations; and Legal Occupations.
Unequal distribution among occupational
categories was to be expected as there are far more
employees in certain occupational categories than
others. New hires also seemed to gravitate to
occupations with lower barriers to entry – those
that had lower required education levels and fewer
skill requirements. These occupations also may
$0 $10,000 $20,000 $30,000 $40,000 $50,000
Public Administration
Other Services
Leisure & Hospitality
Education & Health Services
Professional & Business Services
Financial Activities
Trade, Transportation, & Utilities
Manufacturing
Construction
Natural Resources & Mining
All Industries
Average New Hires Pay vs. Average Workforce Pay by Industry
OES Average Wage New Hires Average Wage OES 10th Percentile

Page 8 of 31 New Hires in Nebraska
have a higher turnover rate than those that were
not reported as often.
The top five occupations found were Nursing
Assistants, Heavy and Tractor-Trailer Truck Drivers,
Customer Service Representatives, Industrial Truck
and Tractor Operators, and Retail Salespersons – all
occupations which require limited experience and
training. For the list of top reported occupations
and the full list of reported occupations, please see
tables A14 and A23 in the appendix.
New Hires’ Skills & Education
Employers were asked to list the five most
important skills that the employee in question
possessed and to list the five most important skills
required for the position the employee held.
Responses were coded to a skills list initially based
on the O*Net skills structure. The list was expanded
to accommodate the additional codes required for
all responses. A total of 67 codes were utilized.
These codes were grouped into seven different
categories: Basic Skills, Education/Experience,
Management Skills, Personal Traits/Skills, Social
Skills, Systems Skills, and Technical Skills.
Results are fairly comparable when examining the
major skills categories for both skills possessed by
new hires and the skills required for the position
they occupied. As shown in Table 3, the categories
of Education/Experience, Social Skills, and Personal
Traits/Skills were all in the top three rankings and
constituted approximately two-thirds of all
responses for both skills possessed and skills
required. Notable skills under the
Education/Experience included Job-Specific Skills or
Knowledge, License or Certification (Any), and Prior
Work Experience. For the Social Skills category, the
top three skills were Teamwork/Coordination,
Service Oriented/Customer Service, and Good
Attitude. The Personal Traits/Skills category did not
have as many standout skills, but it contained a
larger number of skills that referenced traits such as
accuracy, reliability, work ethic, organization, and
physical traits such as physical fitness or
appearance requirements. The Basic Skills category
ranked fourth for both skills possessed (15.5%) and
skills required for the position (18.2%), just slightly
behind the top three categories.
The skills categories with the lowest percentage of
responses were Technical Skills, Systems Skills, and
Management Skills. These categories had fewer
skills in them and the skills typically required a
higher level of training. The most highly mentioned
skills in these categories were Basic Computer
Proficiency, Problem Solving, Judgment and
Decision Making/Self Motivation/Independence,
and Time Management. A complete listing of skills
can be found in tables A21 and A22 in the appendix.
Table 3: Skills Possessed By and Required Of New Hires
Skill Category
Skills Possessed (N=3062)
Top Skill Possessed
(N=928)
Skills Required (N=3490)
Top Skill Required (N=985)
Basic Skills 15.5% 12.7% 18.2% 15.8%
Education/Experience 24.2% 33.0% 24.5% 35.5%
Management Skills 1.5% 1.0% 2.0% 0.9%
Personal Traits/Skills 20.4% 15.1% 18.6% 14.9%
Social Skills 24.4% 23.8% 23.0% 21.9%
Systems Skills 3.2% 1.0% 4.0% 1.1%
Technical Skills 7.7% 6.5% 8.2% 7.3%
No Category 3.0% 7.0% 1.5% 2.4%

Page 9 of 31 New Hires in Nebraska
When looking at the top-ranked skill deemed to be
the most important by the employer, the
Education/Experience category contained the most
responses for both skills possessed by new hires
and the skills required for the position. Job-Specific
Skills or Knowledge (13.4% possessed and 17.1%
required) and License or Certification (Any) (12.7%
possessed and 12.1% required) are the two skills
that were most frequently mentioned in this
category. The Social Skills category was second in
the ranking of importance for both possessed and
required skills and was about equivalent to the
share it held among all skills listed. Personal
Traits/Skills was still the third most often mentioned
category, but its share was slightly lower among the
top skill group compared to overall, suggesting that
while these characteristics are important, they
remain secondary when compared to
Education/Experience and Social Skills.
Educational attainment and requirements were
another focus of the survey. Employers were asked
to list what education the new hire had received
and also what was the minimum requirement for
the position they filled. The most common response
for the education and training that the new hire
possessed was on-the-job training (OJT) (61.2%) and
some form of formal education (52.2%). Most
positions also required OJT (53.5%) and formal
education (55%). About a third of employers listed
work experience as something that new hires had
attained or was required of them; approximately
one-fourth of employers also listed licensure or
certification as important. In regards to formal
education, most employers required that a high
school diploma was sufficient for these positions.
Interestingly, while 8.8% of new hires had a
bachelor’s degree, only 5.9% of the positions listed
a bachelor’s degree as a requirement. More
information on education and training can be found
in Table A19 and A20 in the appendix.
In addition to asking about specific skills and
education, the survey also asked employers about
their satisfaction level in regards to new hires’ skills
and work habits. The majority of employers were
either very or somewhat satisfied with the new
hires’ skills (67.8%) and work habits (64.3%). More
concern was demonstrated with work habits rather
than skills; 14.4% of the responses were
very/somewhat dissatisfied with the new hires’
work habits while only 9.4% were very/somewhat
dissatisfied with the new hires’ work skills. See
tables A11 and A12 in the appendix for more
details.
Page 10 of 31 New Hires in Nebraska
New Hires and Green Jobs
In an attempt to determine the skills needed for
new hires in the emerging green economy, some of
the survey questions were designed to ascertain the
amount of time spent by the new hire on green
activities. It is important to note that the definition
for green activities was not identical to that found
within the Nebraska Green Jobs study5 that took
place over approximately the same time period. The
question asked the employer to describe “the
extent to which this position is involved in
increasing energy efficiency, utilizing or developing
renewable energy resources, or preserving and/or
restoring the environment.”
In the actual Green Jobs study, there was a much
clearer definition of a green job and green activities
were broken down into six different categories and
corresponding examples. With this in mind, 4.3% of
the employees were said to engage in green
practices “all of the time.” A sampling of the
occupations that employers stated engaged in
green activities “all of the time” included Chemical
Plant and System Operators, Heavy and Tractor-
Trailer Truck Drivers, Insulation Workers,
Maintenance Workers, and Soil and Plant Scientists.
These occupations were consistent with the findings
from the green jobs survey, which had 3.4% of all
workers employed in Nebraska working in a green
job. Other occupations that were also mentioned as
engaging in green activities “all of the time” but did
not fit with the typical definition of green jobs
included Accountants, Sales Workers, Laundry
Workers, and Licensed Practical Nurses.
Overall, only 16.3% of the positions were rated as
involved in green activities “about half the time” or
more frequently. An equal amount of positions
(16.2%) were rated as “some of the time” and the
largest percentage, 38%, was found in the “none of
5 Report available online at http://neworks.nebraska.gov.
the time” area. A large percentage of responses
(29.4%) selected the “do not know” option.
In addition to asking for an overall green rating,
employers were also asked how important it was
that the new hire possessed certain pre-determined
“green” skills. While the majority of new hires were
not employed in green occupations, it was still
useful to look at the skills most commonly
associated with green occupations. The pre-
determined “green” skills were based on those skills
shared by known green occupations in the O*Net
occupational database. The selected skills were
Service Orientation, Critical Thinking, Reading
Comprehension, Technology Design, and Operation
and Control.
Unsurprisingly, the first three skills were rated
much higher than the latter two. Service
Orientation, Critical Thinking, and Reading
Comprehension are much broader skills that are
needed by most occupations. Combined, over 80%
of the results stated they were very or somewhat
important. Technology Design and Operation and
Control were rated much lower in importance. In
only 52.1% of new hires was Techology Design
deemed very or somewhat important; for
Operation and Control, it was only 70.9%.
Additionally, the employer was asked to select
whether the actual employee in question had an
adequate grasp of this skill when hired. Almost all of
the ratings exceeded 90% with the exception of
Critical Thinking at 86.6%. Reading Comprehension
was the highest rated at 95.1%. The full results for
green ratings be seen in tables A13, A15, and A16.

Page 11 of 31 New Hires in Nebraska
Appendix A: Data Tables
A1: New Hires Employment Type Page 12
A2: New Hire Position Advertised with NDOL Page 12
A3: New Hire Position Located in Nebraska Page 12
A4: New Hire was Rehired Page 12
A5: Ethnicity of New Hires Page 12
A6: Race of New Hires Page 12
A7: Age of New Hires Page 12
A8: Annual Pay for New Hires Page 13
A9: Hours Worked by New Hires Page 13
A10: Benefits for New Hires Page 13
A11: Satisfaction with New Hire Work Skills Page 13
A12: Satisfaction with New Hire Work Habits Page 13
A13: Green Rating for New Hire Position Page 13
A14: Top 25 Reported Occupations Page 14
A15: Importance Rating for "Green" Skills for New Hires Position Page 14
A16: Adequacy Rating for "Green" Skills as New Employee Page 15
A17: Major Categories of Skills of New Hires Page 15
A18: Major Categories of Skills Required for Occupation Page 15
A19: Education & Training New Hire Has Attained Page 15
A20: Education & Training Required for Position Page 16
A21: Skills of New Hires by Category Page 17
A22: Skills Required for Occupation by Category Page 19
A23: All Reported Occupations by SOC Group & Title Page 21
Note: All data in the tables is from the Nebraska 2010-2011 New Hires Survey. It does not
include supplemental data sources used in sampling or other Labor Market Information data
sources.

Page 12 of 31 New Hires in Nebraska
Table A1: New Hires Employment Type
Selection (N=1,247) Percentage
Full-time Variants 82.3%
Full-Time (Unspecified) 48.5%
Full-Time Permanent 31.4%
Full-Time Seasonal 0.9%
Other Full-Time Variant 1.4%
Part-time Variants 12.5%
Part-Time (Unspecified) 7.8%
Part-Time Permanent 4.1%
Part-Time Seasonal 0.5%
Other Part-Time Variant 0.2%
Other 5.2%
Temporary (Unspecified) 2.0%
Permanent (Unspecified) 1.8%
Seasonal (Unspecified) 0.9%
Other Combination 0.5%
Table A2: New Hire Position Advertised with the NE Dept. of Labor
Selection (N=1,232) Percentage
Yes 21.4%
No 48.9%
Do Not Know 29.7%
Table A3: New Hire Position Located in Nebraska
Selection (N=1,253) Percentage
Yes 98.4%
No 0.8%
Do Not Know 0.8%
Table A4: New Hire was Rehired
Selection (N=1,250) Percentage
Yes 13.8%
No 83.4%
Do Not Know 2.8%
Table A5: Ethnicity of New Hires
Selection (N=1,069) Percentage
Hispanic 12.7%
Not Hispanic 77.4%
Do Not Know 9.9%
Table A6: Race of New Hires
Selection (N=1,145) Percentage
Caucasian 79.9%
Black or African-American 5.9%
Asian 1.2%
Hawaiian or Pacific Islander 0.0%
American Indian or Alaska Native 0.6%
Other 4.0%
Do Not Know 8.3%
Table A7: Age of New Hires
Selection (N=1,114) Percentage
24 or younger 13.8%
25-29 16.4%
30-34 14.6%
35-39 12.7%
40-44 11.7%
45-49 10.7%
50-54 9.2%
55-59 6.0%
60-64 3.8%
65 or older 1.1%
Mean 37.9

Page 13 of 31 New Hires in Nebraska
Table A8: Annual Pay for New Hires (Assumes a 40 Hour Work Week)
Selection (N=1,165) Percentage
$15,000 to $19,999 28.7%
$20,000 to $24,999 37.4%
$25,000 to $29,999 13.6%
$30,000 to $34,999 6.9%
$35,000 to $39,999 5.2%
$40,000 to $44,999 3.0%
$45,000 to $49,999 1.8%
$50,000 or more 3.4%
Mean $25,928
Median $22,880
Table A9: Hours Worked by New Hires
Selection (N=1,150) Percentage
Less than 40 hours 30%
40 hours 53%
Over 40 hours 17%
Mean 38.3
Median 40
Table A10: Benefits for New Hires
Selection (N=1,196) Percentage
Health Insurance 65.4%
Paid time off 52.9%
Retirement Plan 46.3%
Dental Insurance* 4.3%
Life Insurance* 3.4%
Disability Insurance* 2.0%
Other 3.9%
None 23.6%
*Recoded from Other Responses
Table A11: Satisfaction with New Hire Work Skills
Selection (N=1,203) Percentage
Very Satisfied (5) 38.5%
Somewhat Satisfied (4) 29.3%
Neither Satisfied nor Dissatisfied (3) 10.6%
Somewhat Dissatisfied (2) 6.7%
Very Dissatisfied (1) 2.7%
Do Not Know 12.1%
Mean 4.07
Table A12: Satisfaction with New Hire Work Habits
Selection (N=1,205) Percentage
Very Satisfied (5) 38.3%
Somewhat Satisfied (4) 26.0%
Neither Satisfied nor Dissatisfied (3) 9.0%
Somewhat Dissatisfied (2) 8.7%
Very Dissatisfied (1) 5.7%
Do Not Know 12.3%
Mean 3.94
Table A13: Green Rating for New Hire Position
Selection (N=1,189) Percentage
All of the time (100) 4.3%
Most of the time (75) 7.6%
About half of the time (50) 4.5%
Some of the time (25) 16.2%
None of the time (0) 38.0%
Do not know 29.4%
Mean 23

Page 14 of 31 New Hires in Nebraska
Table A14: Top 25 Reported Occupations
SOC Code and Occupational Title (N=1,240) Percentage
31-1014 Nursing Assistants 5.0%
53-3032 Heavy and Tractor-Trailer Truck Drivers 3.1%
43-4051 Customer Service Representatives 3.1%
53-7051 Industrial Truck and Tractor Operators 2.5%
41-2031 Retail Salespersons 2.3%
37-2011 Janitors and Cleaners, Except Maids and Housekeeping Cleaners 2.3%
43-6014 Secretaries and Administrative Assistants, Except Legal, Medical, and Executive 2.1%
45-2093 Farmworkers, Farm, Ranch, and Aquacultural Animals 2.1%
49-9071 Maintenance and Repair Workers, General 2.1%
51-2092 Team Assemblers 1.9%
43-3031 Bookkeeping, Accounting, and Auditing Clerks 1.9%
29-2061 Licensed Practical and Licensed Vocational Nurses 1.9%
51-3022 Meat, Poultry, and Fish Cutters and Trimmers 1.5%
49-3031 Bus and Truck Mechanics and Diesel Engine Specialists 1.5%
53-3033 Light Truck or Delivery Services Drivers 1.5%
21-1093 Social and Human Service Assistants 1.5%
33-9032 Security Guards 1.4%
29-1141 Registered Nurses 1.3%
39-9021 Personal Care Aides 1.3%
41-2011 Cashiers 1.1%
43-4171 Receptionists and Information Clerks 1.1%
51-4121 Welders, Cutters, Solderers, and Brazers 1.1%
51-9061 Inspectors, Testers, Sorters, Samplers, and Weighers 1.1%
53-7064 Packers and Packagers, Hand 1.0%
51-9111 Packaging and Filling Machine Operators and Tenders 1.0%
Table A15: Importance Rating for "Green" Skills for New Hires Position
Selection Service
Orientation Critical
Thinking Reading
Comprehension Technology
Design Operation
and Control
5 - Very Important 53.5% 46.1% 43.2% 18.8% 34.1%
4 - Somewhat Important 28.6% 39.1% 37.7% 33.3% 36.6%
3 - Neither Important Nor Unimportant 12.4% 10.4% 13.0% 26.9% 17.9%
2 - Unimportant 3.5% 3.4% 4.5% 9.6% 6.1%
1 - Very Unimportant 2.0% 0.9% 1.5% 11.4% 5.3%
Mean 4.28 4.26 4.16 3.39 3.88

Page 15 of 31 New Hires in Nebraska
Table A16: Adequacy Rating for "Green" Skills as New Employee
Selection Service
Orientation Critical
Thinking Reading
Comprehension Technology
Design Operation
and Control
Adequate 92.8% 86.6% 95.1% 90.1% 90.5%
Inadequate 7.2% 13.4% 4.9% 9.9% 9.5%
Table A17: Major Categories of Skills of New Hires
Response (N=3,062) Percentage
Basic Skills 15.5%
Education/Experience 24.2%
Management Skills 1.5%
Personal Traits/Skills 20.4%
Social Skills 24.4%
Systems Skills 3.2%
Technical Skills 7.7%
No Category 3.0%
Table A18: Major Categories of Skills Required for Occupation
Response (N=3,490) Percentage
Basic Skills 18.2%
Education/Experience 24.5%
Management Skills 2.0%
Personal Traits/Skills 18.6%
Social Skills 23.0%
Systems Skills 4.0%
Technical Skills 8.2%
No Category 1.5%
Table 19: Education & Training New Hire Has Attained
Selection (N=1,185) Percentage
None 1.8%
On-the-Job Training 61.2%
Licensure of Certification 22.6%
Work Experience in Related Occupations 34.0%
Formal Education* 52.2%
High School Diploma or Equivalent* 33.2%
Post-Secondary Technical Training* 5.6%
Associate's Degree* 4.6%
Bachelor's Degree or Greater* 8.8%
Military Experience** 0.4%
Do Not Know 17.0%
*Only Highest Education Listed Shown
**Military Experience only Other Response

Page 16 of 31 New Hires in Nebraska
Table 20: Education & Training Required for Position
Selection (N=1,179) Percentage
None 10.1%
On-the-Job Training 53.5%
Licensure of Certification 25.4%
Work Experience in Related Occupations 33.8%
Formal Education* 55.0%
High School Diploma or Equivalent* 39.6%
Post-Secondary Technical Training* 5.3%
Associate's Degree* 4.2%
Bachelor's Degree or Greater* 5.9%
Military Experience** 0.2%
*Only Highest Education Listed Shown
**Military Experience only Other Response

Page 17 of 31 New Hires in Nebraska
Table A21: Skills of New Hires by Category
Response (N=3,062) Percentage
Social Skills 24.4%
Teamwork/Coordination 11.1%
Service Oriented/Customer Service 7.2%
Social Person/Good Attitude/Well Rounded Personality 5.0%
Leader 0.5%
Instructing/Teaching/Training 0.3%
Persuasion 0.2%
Negotiation 0.1%
Education/Experience 24.2%
Job-Specific Skills or Knowledge 12.9%
License or Certification (Any) 6.7%
Prior Work Experience 3.2%
4-Year Degree 0.6%
2-Year Degree 0.5%
Master's/Graduate Degree 0.2%
High School or GED 0.1%
Continuing Education 0.1%
Personal Traits/Skills 20.4%
Reliable/Dependable 3.6%
Accurate/Detail Oriented 3.2%
Good Work Ethic/Motivated 2.8%
Organized 2.7%
Physical Fitness/Abilities 2.0%
Efficient 1.0%
Honest/Trustworthy 0.8%
Multitasker 0.8%
Empathy 0.8%
Flexible Schedule 0.7%
Other Personal Trait 0.4%
Neat Workspace 0.3%
Common Sense 0.3%
Mature/Professional 0.3%
Multilingual 0.3%
Good Driving History 0.2%
Maintain Confidentiality 0.2%
Appearance 0.1%

Page 18 of 31 New Hires in Nebraska
Table A21: Skills of New Hires by Category (Continued)
Basic Skills 15.5%
Speaking/Verbal/Presentation/Communication 3.9%
Active Learning 2.6%
Attendance/Punctual 2.6%
Active Listening 2.0%
Reading Comprehension 1.0%
Mathematics 1.0%
Writing/Documentation 0.8%
Critical Thinking 0.7%
Safety 0.7%
Learning Strategies 0.1%
Technical Skills 7.7%
Basic Computer Proficiency 5.6%
Operating/Driving Equipment 0.6%
Quality Control 0.5%
Equipment Selection/Familiarity 0.3%
Equipment Maintenance 0.3%
Installation 0.2%
Operation Monitoring 0.1%
Repair 0.1%
Troubleshooting Operator Error 0.1%
Programming 0.1%
Systems Skills 3.2%
Problem Solver 1.7%
Judgment and Decision Making/Self Motivated/Independent 1.4%
System Analysis/Evaluation 0.2%
Management Skills 1.5%
Time Management 0.7%
People Management 0.4%
General Management 0.3%
Material Management 0.1%
Financial Management 0.1%
No Category 3.0%
Do Not Know/Not Applicable 2.3%
Other 0.8%

Page 19 of 31 New Hires in Nebraska
Table A22: Skills Required for Occupation by Category
Response (N=3,490) Percentage
Social Skills 23.0%
Teamwork/Coordination 10.2%
Service Oriented/Customer Service 6.9%
Social Person/Good Attitude/Well Rounded Personality 4.7%
Instructing/Teaching/Training 0.4%
Leader 0.4%
Persuasion 0.3%
Negotiation 0.1%
Education/Experience 24.5%
Job-Specific Skills or Knowledge 14.3%
License or Certification (Any) 5.6%
Prior Work Experience 3.5%
4-Year Degree 0.4%
Continuing Education 0.2%
High School or GED 0.2%
2-Year Degree 0.2%
Master's/Graduate Degree 0.1%
Personal Traits/Skills 18.6%
Accurate/Detail Oriented 4.1%
Reliable/Dependable 3.0%
Physical Fitness/Abilities 2.7%
Good Work Ethic/Motivated 2.4%
Organized 2.3%
Multitasker 1.0%
Efficient 0.6%
Common Sense 0.5%
Honest/Trustworthy 0.5%
Flexible Schedule 0.3%
Other Personal Trait 0.3%
Mature/Professional 0.2%
Multilingual 0.2%
Maintain Confidentiality 0.2%
Good Driving History 0.1%
Neat Workspace 0.1%
Appearance 0.1%

Page 20 of 31 New Hires in Nebraska
Table A22: Skills Required for Occupation by Category (Continued)
Basic Skills 18.2%
Speaking/Verbal/Presentation/Communication 4.0%
Active Listening 3.0%
Attendance/Punctual 2.6%
Active Learning 1.9%
Reading Comprehension 1.6%
Mathematics 1.4%
Critical Thinking 1.3%
Safety 1.0%
Writing/Documentation 0.5%
Both Written & Verbal Communication 0.5%
Both Reading & Writing 0.4%
Learning Strategies 0.1%
Technical Skills 8.2%
Basic Computer Proficiency 5.4%
Operating/Driving Equipment 1.8%
Equipment Maintenance 0.4%
Troubleshooting Operator Error 0.2%
Quality Control 0.2%
Repair 0.1%
Equipment Selection/Familiarity 0.1%
Installation 0.1%
Tech Design 0.1%
Systems Skills 4.0%
Judgment and Decision Making/Self Motivated/Independent 2.5%
Problem Solver 1.5%
Management Skills 2.0%
Time Management 1.4%
General Management 0.4%
People Management 0.2%
No Category 1.5%
Other 1.1%
Do Not Know/Not Applicable 0.4%

Page 21 of 31 New Hires in Nebraska
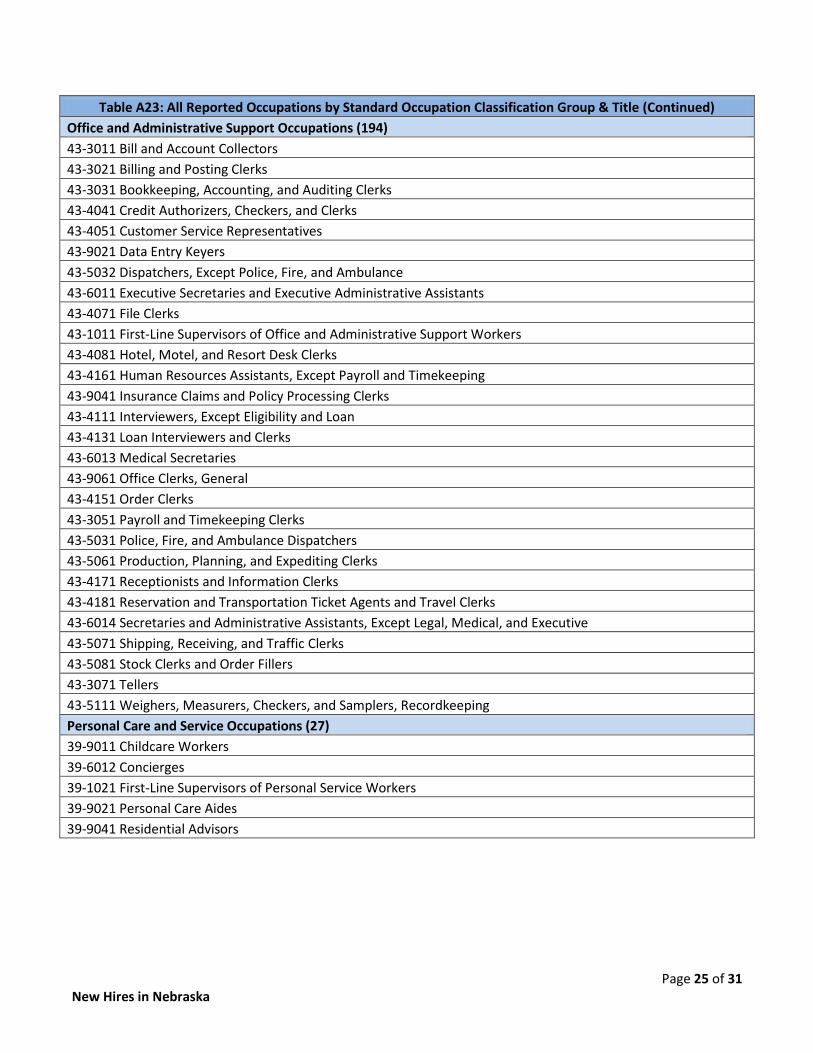
Table A23: All Reported Occupations by Standard Occupation Classification Group & Title
Architecture and Engineering Occupations (6)
17-2021 Agricultural Engineers
17-3011 Architectural and Civil Drafters
17-2071 Electrical Engineers
17-3024 Electro-Mechanical Technicians
17-3013 Mechanical Drafters
Arts, Design, Entertainment, Sports, and Media Occupations (7)
27-3091 Interpreters and Translators
27-1026 Merchandise Displayers and Window Trimmers
27-2012 Producers and Directors
27-3031 Public Relations Specialists
Building and Grounds Cleaning and Maintenance Occupations (43)
37-1011 First-Line Supervisors of Housekeeping and Janitorial Workers
37-2011 Janitors and Cleaners, Except Maids and Housekeeping Cleaners
37-3011 Landscaping and Groundskeeping Workers
37-2012 Maids and Housekeeping Cleaners
Business and Financial Operations Occupations (19)
13-2011 Accountants and Auditors
13-1199 Business Operations Specialists, All Other
13-1141 Compensation, Benefits, and Job Analysis Specialists
13-1071 Human Resources Specialists
13-2072 Loan Officers
13-1081 Logisticians
13-1161 Market Research Analysts and Marketing Specialists
13-1023 Purchasing Agents, Except Wholesale, Retail, and Farm Products
13-1022 Wholesale and Retail Buyers, Except Farm Products
Community and Social Services Occupations (39)
21-1021 Child, Family, and School Social Workers
21-1099 Community and Social Service Specialists, All Other
21-1012 Educational, Guidance, School, and Vocational Counselors
21-1022 Healthcare Social Workers
21-1015 Rehabilitation Counselors
21-1093 Social and Human Service Assistants
21-1011 Substance Abuse and Behavioral Disorder Counselors
Computer and Mathematical Occupations (7)
15-1143 Computer Network Architects
15-1131 Computer Programmers
15-1121 Computer Systems Analysts
15-1151 Computer User Support Specialists

Page 22 of 31 New Hires in Nebraska
Table A23: All Reported Occupations by Standard Occupation Classification Group & Title (Continued)
Construction and Extraction Occupations (74)
47-2021 Brickmasons and Blockmasons
47-2031 Carpenters
47-2051 Cement Masons and Concrete Finishers
47-2061 Construction Laborers
47-2081 Drywall and Ceiling Tile Installers
47-2111 Electricians
47-2042 Floor Layers, Except Carpet, Wood, and Hard Tiles
47-2121 Glaziers
47-3019 Helpers, Construction Trades, All Other
47-3011 Helpers--Brickmasons, Blockmasons, Stonemasons, and Tile and Marble Setters
47-3013 Helpers--Electricians
47-3014 Helpers--Painters, Paperhangers, Plasterers, and Stucco Masons
47-3015 Helpers--Pipelayers, Plumbers, Pipefitters, and Steamfitters
47-4051 Highway Maintenance Workers
47-2131 Insulation Workers, Floor, Ceiling, and Wall
47-2073 Operating Engineers and Other Construction Equipment Operators
47-2141 Painters, Construction and Maintenance
47-2152 Plumbers, Pipefitters, and Steamfitters
47-2181 Roofers
47-2211 Sheet Metal Workers
47-2221 Structural Iron and Steel Workers
47-1011 Supervisors of Construction and Extraction Workers
Education, Training, and Library Occupations (17)
25-2031 Secondary School Teachers, Except Special and Career/Technical Education
25-9041 Teacher Assistants
25-3099 Teachers and Instructors, All Other
Farming, Fishing, and Forestry Occupations (33)
45-2091 Agricultural Equipment Operators
45-2099 Agricultural Workers, All Other
45-2092 Farmworkers and Laborers, Crop, Nursery, and Greenhouse
45-2093 Farmworkers, Farm, Ranch, and Aquacultural Animals
45-2041 Graders and Sorters, Agricultural Products

Page 23 of 31 New Hires in Nebraska
Table A23: All Reported Occupations by Standard Occupation Classification Group & Title (Continued)
Food Preparation and Serving Related Occupations (33)
35-3011 Bartenders
35-3021 Combined Food Preparation and Serving Workers, Including Fast Food
35-2011 Cooks, Fast Food
35-2012 Cooks, Institution and Cafeteria
35-2014 Cooks, Restaurant
35-1012 First-Line Supervisors of Food Preparation and Serving Workers
35-2021 Food Preparation Workers
35-9031 Hosts and Hostesses, Restaurant, Lounge, and Coffee Shop
35-3031 Waiters and Waitresses
Healthcare Practitioners and Technical Occupations (67)
29-2021 Dental Hygienists
29-2041 Emergency Medical Technicians and Paramedics
29-2061 Licensed Practical and Licensed Vocational Nurses
29-2012 Medical and Clinical Laboratory Technicians
29-1122 Occupational Therapists
29-1065 Pediatricians, General
29-2052 Pharmacy Technicians
29-1071 Physician Assistants
29-2053 Psychiatric Technicians
29-2034 Radiologic Technologists
29-1141 Registered Nurses
29-1127 Speech-Language Pathologists
29-2055 Surgical Technologists
29-1129 Therapists, All Other
Healthcare Support Occupations (86)
31-9091 Dental Assistants
31-1011 Home Health Aides
31-9092 Medical Assistants
31-1014 Nursing Assistants
31-2022 Physical Therapist Aides
31-9096 Veterinary Assistants and Laboratory Animal Caretakers

Page 24 of 31 New Hires in Nebraska
Table A23: All Reported Occupations by Standard Occupation Classification Group & Title (Continued)
Installation, Maintenance, and Repair Occupations (85)
49-3023 Automotive Service Technicians and Mechanics
49-3031 Bus and Truck Mechanics and Diesel Engine Specialists
49-2011 Computer, Automated Teller, and Office Machine Repairers
49-3041 Farm Equipment Mechanics and Service Technicians
49-1011 First-Line Supervisors of Mechanics, Installers, and Repairers
49-9021 Heating, Air Conditioning, and Refrigeration Mechanics and Installers
49-9031 Home Appliance Repairers
49-9041 Industrial Machinery Mechanics
49-9071 Maintenance and Repair Workers, General
49-9043 Maintenance Workers, Machinery
49-3042 Mobile Heavy Equipment Mechanics, Except Engines
49-2022 Telecommunications Equipment Installers and Repairers, Except Line Installers
49-9052 Telecommunications Line Installers and Repairers
49-3093 Tire Repairers and Changers
Legal Occupations (2)
23-1011 Lawyers
23-2011 Paralegals and Legal Assistants
Life, Physical, and Social Science Occupations (5)
19-4031 Chemical Technicians
19-3031 Clinical, Counseling, and School Psychologists
19-1022 Microbiologists
19-1013 Soil and Plant Scientists
Management Occupations (14)
11-1011 Chief Executives
11-3021 Computer and Information Systems Managers
11-1021 General and Operations Managers
11-2021 Marketing Managers
11-9111 Medical and Health Services Managers
11-9141 Property, Real Estate, and Community Association Managers
11-2022 Sales Managers
11-9151 Social and Community Service Managers
Page 25 of 31 New Hires in Nebraska
Table A23: All Reported Occupations by Standard Occupation Classification Group & Title (Continued)
Office and Administrative Support Occupations (194)
43-3011 Bill and Account Collectors
43-3021 Billing and Posting Clerks
43-3031 Bookkeeping, Accounting, and Auditing Clerks
43-4041 Credit Authorizers, Checkers, and Clerks
43-4051 Customer Service Representatives
43-9021 Data Entry Keyers
43-5032 Dispatchers, Except Police, Fire, and Ambulance
43-6011 Executive Secretaries and Executive Administrative Assistants
43-4071 File Clerks
43-1011 First-Line Supervisors of Office and Administrative Support Workers
43-4081 Hotel, Motel, and Resort Desk Clerks
43-4161 Human Resources Assistants, Except Payroll and Timekeeping
43-9041 Insurance Claims and Policy Processing Clerks
43-4111 Interviewers, Except Eligibility and Loan
43-4131 Loan Interviewers and Clerks
43-6013 Medical Secretaries
43-9061 Office Clerks, General
43-4151 Order Clerks
43-3051 Payroll and Timekeeping Clerks
43-5031 Police, Fire, and Ambulance Dispatchers
43-5061 Production, Planning, and Expediting Clerks
43-4171 Receptionists and Information Clerks
43-4181 Reservation and Transportation Ticket Agents and Travel Clerks
43-6014 Secretaries and Administrative Assistants, Except Legal, Medical, and Executive
43-5071 Shipping, Receiving, and Traffic Clerks
43-5081 Stock Clerks and Order Fillers
43-3071 Tellers
43-5111 Weighers, Measurers, Checkers, and Samplers, Recordkeeping
Personal Care and Service Occupations (27)
39-9011 Childcare Workers
39-6012 Concierges
39-1021 First-Line Supervisors of Personal Service Workers
39-9021 Personal Care Aides
39-9041 Residential Advisors

Page 26 of 31 New Hires in Nebraska
Table A23: All Reported Occupations by Standard Occupation Classification Group & Title (Continued)
Production Occupations (199)
51-2099 Assemblers and Fabricators, All Other
51-3011 Bakers
51-7011 Cabinetmakers and Bench Carpenters
51-8091 Chemical Plant and System Operators
51-9192 Cleaning, Washing, and Metal Pickling Equipment Operators and Tenders
51-9031 Cutters and Trimmers, Hand
51-4031 Cutting, Punching, and Press Machine Setters, Operators, and Tenders, Metal and Plastic
51-2022 Electrical and Electronic Equipment Assemblers
51-4021 Extruding and Drawing Machine Setters, Operators, and Tenders, Metal and Plastic
51-1011 First-Line Supervisors of Production and Operating Workers
51-3091 Food and Tobacco Roasting, Baking, and Drying Machine Operators and Tenders
51-4071 Foundry Mold and Coremakers
51-4033 Grinding, Lapping, Polishing, and Buffing Machine Tool Setters, Operators, and Tenders, Metal & Plastic
51-9198 Helpers--Production Workers
51-9061 Inspectors, Testers, Sorters, Samplers, and Weighers
51-4034 Lathe and Turning Machine Tool Setters, Operators, and Tenders, Metal and Plastic
51-6011 Laundry and Dry-Cleaning Workers
51-3022 Meat, Poultry, and Fish Cutters and Trimmers
51-4199 Metal Workers and Plastic Workers, All Other
51-4051 Metal-Refining Furnace Operators and Tenders
51-9023 Mixing and Blending Machine Setters, Operators, and Tenders
51-9195 Molders, Shapers, and Casters, Except Metal and Plastic
51-4072 Molding, Coremaking, and Casting Machine Setters, Operators, and Tenders, Metal and Plastic
51-9111 Packaging and Filling Machine Operators and Tenders
51-9123 Painting, Coating, and Decorating Workers
51-9151 Photographic Process Workers and Processing Machine Operators
51-4193 Plating and Coating Machine Setters, Operators, and Tenders, Metal and Plastic
51-5112 Printing Press Operators
51-9199 Production Workers, All Other
51-4023 Rolling Machine Setters, Operators, and Tenders, Metal and Plastic
51-6031 Sewing Machine Operators
51-2041 Structural Metal Fabricators and Fitters
51-2092 Team Assemblers
51-6099 Textile, Apparel, and Furnishings Workers, All Other
51-4111 Tool and Die Makers
51-4121 Welders, Cutters, Solderers, and Brazers

Page 27 of 31 New Hires in Nebraska
Table A23: All Reported Occupations by Standard Occupation Classification Group & Title (Continued)
Protective Services Occupations (31)
33-3012 Correctional Officers and Jailers
33-2011 Firefighters
33-1099 First-Line Supervisors of Protective Service Workers, All Other
33-3051 Police and Sheriff's Patrol Officers
33-9032 Security Guards
Sales and Related Occupations (82)
41-2011 Cashiers
41-2021 Counter and Rental Clerks
41-9091 Door-to-Door Sales Workers, News and Street Vendors, and Related Workers
41-1012 First-Line Supervisors of Non-Retail Sales Workers
41-1011 First-Line Supervisors of Retail Sales Workers
41-3021 Insurance Sales Agents
41-2022 Parts Salespersons
41-2031 Retail Salespersons
41-3099 Sales Representatives, Services, All Other
41-4012 Sales Representatives, Wholesale and Manufacturing, Except Technical and Scientific Products
41-4011 Sales Representatives, Wholesale and Manufacturing, Technical and Scientific Products
41-9041 Telemarketers
Transportation and Material Moving Occupations (170)
53-3022 Bus Drivers, School or Special Client
53-7061 Cleaners of Vehicles and Equipment
53-7021 Crane and Tower Operators
53-3031 Driver/Sales Workers
53-1031 First-Line Supervisors of Transportation and Material-Moving Machine and Vehicle Operators
53-3032 Heavy and Tractor-Trailer Truck Drivers
53-7051 Industrial Truck and Tractor Operators
53-7062 Laborers and Freight, Stock, and Material Movers, Hand
53-3033 Light Truck or Delivery Services Drivers
53-7063 Machine Feeders and Offbearers
53-7199 Material Moving Workers, All Other
53-7064 Packers and Packagers, Hand
53-7072 Pump Operators, Except Wellhead Pumpers
53-4021 Railroad Brake, Signal, and Switch Operators
53-7081 Refuse and Recyclable Material Collectors
53-3041 Taxi Drivers and Chauffeurs

Page 28 of 31 New Hires in Nebraska
Appendix B: Sample Survey Form

Page 29 of 31 New Hires in Nebraska

Page 30 of 31 New Hires in Nebraska

Page 31 of 31 New Hires in Nebraska
Top Related