


Languages
Pages
Legal

NEUROSCIENCE
Intonational speech prosody encodingin the human auditory cortex
C. Tang, L. S. Hamilton, E. F. Chang*
Speakers of all human languages regularly use intonational pitch to convey linguisticmeaning, such as to emphasize a particular word. Listeners extract pitch movementsfrom speech and evaluate the shape of intonation contours independent of eachspeaker’s pitch range. We used high-density electrocorticography to record neuralpopulation activity directly from the brain surface while participants listened tosentences that varied in intonational pitch contour, phonetic content, and speaker.Cortical activity at single electrodes over the human superior temporal gyrusselectively represented intonation contours. These electrodes were intermixed with,yet functionally distinct from, sites that encoded different information aboutphonetic features or speaker identity. Furthermore, the representation of intonationcontours directly reflected the encoding of speaker-normalized relative pitch but notabsolute pitch.
Humans precisely control the pitch of theirvoices to encode linguistic meaning (1, 2).All spoken languages use suprasegmentalpitch modulations at the sentence level orspeech intonation to convey meaning not
explicit in word choice or syntax (3). Raising thepitch on a particular word can change the mean-ing of a sentence. Whereas “Anna likes oranges”communicates that it is Anna, not Lisa, who likesoranges, “Anna likes oranges” communicates thatAnna likes oranges, not apples. Similarly, ris-ing pitch at the end of an utterance can signal aquestion (“Anna likes oranges?”). Confoundingthe listener’s task, pitch also varieswith the lengthof a speaker’s vocal folds (4), such that the highestpitch values reached by some low voices arestill lower than the lowest of a higher-pitchedvoice.Lesion and neuroimaging studies have impli-
cated bilateral frontal and temporal regions in theperception of speech intonation (5–16). Humanneuroimaging and primate electrophysiologyhave also suggested the existence of a putativegeneral pitch center in the lateral Heschl’s gyrus(HG) and the adjacent superior temporal gyrus(STG) (17–21). However, a more fundamentalquestion than anatomical localization is whatthe neural activity in those regions encodes—that is, the precise mapping between specificstimulus features and neural responses. How isintonational pitch in speech encoded, and doesits representation contain concurrent infor-mation about what is being said and by whom?Furthermore, because the same auditory fea-ture of pitch is the primary cue to both in-tonation and speaker identity (22), how does
the auditory cortex represent both kinds ofinformation?We designed and synthesized a controlled
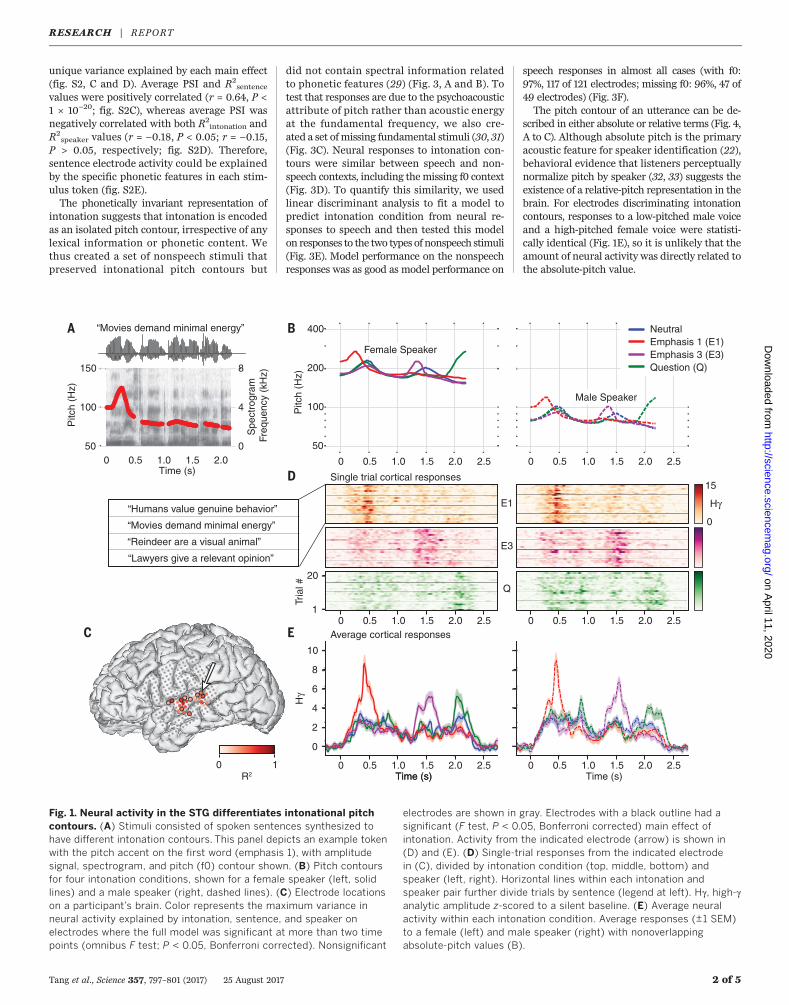
set of spoken sentences that independently var-ied intonation contour, phonetic content, andspeaker identity (Fig. 1A). The four intonationconditions—neutral, emphasis 1, emphasis 3,and question—are linguistically distinct (2) (Fig.1B). By systematically manipulating the pitch(fundamental frequency: f0) contour of eachtoken, we ensured that only pitch, not inten-sity or duration of segments, differed betweenintonation conditions. The three speakers con-sisted of one synthesized male (f0: 83 ± 10 Hz)and two synthesized female speakers (f0: 187 ±23 Hz). The two female speakers had the samef0 but differing formant frequencies, one ofwhich matched the male speaker’s formantfrequencies.Participants (N = 10) passively listened to these
stimuli while we recorded cortical activity fromsubdurally implanted, high-density grids (placedfor clinical localization of refractory seizures).We examined the analytic amplitude of the high-gamma band (70 to 150 Hz) of the local fieldpotential, which correlates with local neuro-nal spiking (23–26). We aligned the high-gammaresponses to sentence onset and used time-dependent general linear models to deter-mine whether and how neural responses oneach electrode systematically depended onstimulus conditions. The fully specified encodingmodel included categorical variables for into-nation, sentence, and speaker condition, as wellas terms for all pairwise interactions and thethree-way interaction. Figure 1C shows the max-imum variance explained in the neural activityfor significant electrodes (defined as electrodeswhere the full model reached significance atmore than two time points; omnibus F test, P <0.05, Bonferroni corrected) in one subject. We
next found the electrodes whose activity differ-entiated intonation contours (F test, P < 0.05,Bonferroni corrected) (circled electrodes in Fig.1C). For one electrode on STG, single-trial ac-tivity increased after the pitch accents in theemphasis 1 and emphasis 3 conditions and afterthe pitch rise in the question condition (Fig.1D). The same pattern of activity by intona-tion contour was seen for each sentence in thestimulus set (Fig. 1D) and for the two formant-matched speakers whose absolute vocal pitchvalues did not overlap (Fig. 1E).We next calculated the contribution of each
main effect of stimulus dimension, as well as theirinteractions to variance explained in the neuralactivity at each significant electrode. Some elec-trodes showed differences between intonationconditions but not sentence or speaker conditions(Fig. 2, A, D, and G) (maximum R2
intonation =0.69, P = 1 × 10−49; Fig. 2J). These electrodeswould respond similarly to the sentences “Moviesdemand minimal energy” and “Humans valuegenuine behavior” if presented with the sameintonation contour (e.g., emphasis on the firstword), despite very different phonetic content.Other electrodes showed differences betweensentence conditions but not intonation or speakerconditions (Fig. 2, B, E, and H) (maximumR2
sentence = 0.85, P = 1 × 10−73; Fig. 2K). Inthese electrodes, the response to a sentencewas the same regardless of whether it was saidneutrally, with emphasis, or as a question, butthe responses strongly differed for a sentencewith different phonetic content. Other elec-trodes differentiated between speaker condi-tions but not intonation or sentence conditions(Fig. 2, C, F, and I) (maximum R2
speaker = 0.67,P = 1 × 10−47; Fig. 2L). These electrodes mainlydistinguished between the male speaker andthe two female speakers (15 of 16 electrodes;1 of 16 differentiated between high and lowformants). The anatomical distribution of encod-ing effects is shown as pie charts on the corticalsurface, indicating the proportion of varianceexplained (Fig. 2M and fig. S1). Some intonation-encoding sites were adjacent to the lateral HGon the STG, but others were found throughoutthe STG, interspersed with other electrodesthat encoded phoneme- and speaker-relatedinformation.We assigned each electrode to one of three
categories—intonation, sentence, or speaker—and then examined the proportion of varianceexplained by each group of predictors (Fig. 2N).The contributions of interactions were minimal(median total proportion of variance explained:6.4%) (Fig. 2N), indicating orthogonal encodingof each stimulus dimension.On the basis of previous work (27), we hy-
pothesized that electrodes whose activity differ-entiated between sentence conditions respondedto particular classes of phonetic features. Wetherefore calculated the average phoneme selec-tivity index (PSI) (27) for each significant elec-trode from its responses to a separate, phoneticallytranscribed speech corpus (TIMIT) (28) (fig. S2,A and B) and correlated it with the maximum
RESEARCH
Tang et al., Science 357, 797–801 (2017) 25 August 2017 1 of 5
Department of Neurological Surgery and Weill Institute forNeurosciences, University of California, San Francisco, CA94143, USA.*Corresponding author. Email: [email protected]
on April 11, 2020
http://science.sciencem
ag.org/D
ownloaded from
unique variance explained by each main effect(fig. S2, C and D). Average PSI and R2
sentence
values were positively correlated (r = 0.64, P <1 × 10⁻²⁰; fig. S2C), whereas average PSI wasnegatively correlated with both R2
intonation andR2
speaker values (r = −0.18, P < 0.05; r = −0.15,P > 0.05, respectively; fig. S2D). Therefore,sentence electrode activity could be explainedby the specific phonetic features in each stim-ulus token (fig. S2E).The phonetically invariant representation of
intonation suggests that intonation is encodedas an isolated pitch contour, irrespective of anylexical information or phonetic content. Wethus created a set of nonspeech stimuli thatpreserved intonational pitch contours but
did not contain spectral information relatedto phonetic features (29) (Fig. 3, A and B). Totest that responses are due to the psychoacousticattribute of pitch rather than acoustic energyat the fundamental frequency, we also cre-ated a set ofmissing fundamental stimuli (30, 31)(Fig. 3C). Neural responses to intonation con-tours were similar between speech and non-speech contexts, including themissing f0 context(Fig. 3D). To quantify this similarity, we usedlinear discriminant analysis to fit a model topredict intonation condition from neural re-sponses to speech and then tested this modelon responses to the two types of nonspeech stimuli(Fig. 3E). Model performance on the nonspeechresponses was as good as model performance on
speech responses in almost all cases (with f0:97%, 117 of 121 electrodes; missing f0: 96%, 47 of49 electrodes) (Fig. 3F).The pitch contour of an utterance can be de-
scribed in either absolute or relative terms (Fig. 4,A to C). Although absolute pitch is the primaryacoustic feature for speaker identification (22),behavioral evidence that listeners perceptuallynormalize pitch by speaker (32, 33) suggests theexistence of a relative-pitch representation in thebrain. For electrodes discriminating intonationcontours, responses to a low-pitched male voiceand a high-pitched female voice were statisti-cally identical (Fig. 1E), so it is unlikely that theamount of neural activity was directly related tothe absolute-pitch value.
Tang et al., Science 357, 797–801 (2017) 25 August 2017 2 of 5
Time (s)
HγE1
E3
Q
0 0.5 1.0 1.5 2.0 2.5 0 0.5 1.0 1.5 2.0 2.5
0 0.5 1.0 1.5 2.0 2.5 0 0.5 1.0 1.5 2.0 2.5
0 0.5 1.0 1.5 2.0 2.5 0 0.5 1.0 1.5 2.0 2.5
400
200
100
5050
100
150
0
15
0 1
8
6
4
2
0
10
0 0.5 1.0 1.5 2.0
1
20
0
4
8
NeutralEmphasis 1 (E1)Emphasis 3 (E3)Question (Q)
Female Speaker
Male Speaker
“Movies demand minimal energy”
“Humans value genuine behavior”
“Reindeer are a visual animal”
“Lawyers give a relevant opinion”
Time (s)
Hγ
Pitc
h (H
z)
Pitc
h (H
z)
Spe
ctro
gram
Fr
eque
ncy
(kH
z)
“Movies demand minimal energy”
R2
Time (s)
Time (s)
Single trial cortical responses
Average cortical responses
Tria
l #
Fig. 1. Neural activity in the STG differentiates intonational pitchcontours. (A) Stimuli consisted of spoken sentences synthesized tohave different intonation contours. This panel depicts an example tokenwith the pitch accent on the first word (emphasis 1), with amplitudesignal, spectrogram, and pitch (f0) contour shown. (B) Pitch contoursfor four intonation conditions, shown for a female speaker (left, solidlines) and a male speaker (right, dashed lines). (C) Electrode locationson a participant’s brain. Color represents the maximum variance inneural activity explained by intonation, sentence, and speaker onelectrodes where the full model was significant at more than two timepoints (omnibus F test; P < 0.05, Bonferroni corrected). Nonsignificant
electrodes are shown in gray. Electrodes with a black outline had asignificant (F test, P < 0.05, Bonferroni corrected) main effect ofintonation. Activity from the indicated electrode (arrow) is shown in(D) and (E). (D) Single-trial responses from the indicated electrodein (C), divided by intonation condition (top, middle, bottom) andspeaker (left, right). Horizontal lines within each intonation andspeaker pair further divide trials by sentence (legend at left). Hg, high-ganalytic amplitude z-scored to a silent baseline. (E) Average neuralactivity within each intonation condition. Average responses (±1 SEM)to a female (left) and male speaker (right) with nonoverlappingabsolute-pitch values (B).
RESEARCH | REPORTon A
pril 11, 2020
http://science.sciencemag.org/
Dow
nloaded from

Tang et al., Science 357, 797–801 (2017) 25 August 2017 3 of 5
e3e1e2
NeutralQuestionEmphasis 1Emphasis 3
IntonationSentenceSpeaker
Movies...Humans...Reindeer...Lawyers...
MaleFemale 1Female 2
02468
Hγ
02468
Hγ
02468
Hγ
0.00
0.25
0.50
0.75
1.00
Uni
que
R2
Time (s)0 0.5 1.0 1.5 2.0 2.5 0 0.5 1.0 1.5 2.0 2.5 0 0.5 1.0 1.5 2.0 2.5
0.0
1.0
0.4
0.6
0.8
Pro
port
ion
of t
otal
R2
Intonation encodingelectrode (e1)
Phonetic feature encoding electrode (e2)
Speaker encodingelectrode (e3)
0.2
Intonationn = 23
Sentencen = 147
Speakern = 7
In Se Sp
In x
Se
In x
Sp
Se x S
p
3-way
Predictor Group
IntonationSentenceSpeakerAll interactions
Fig. 2. Independent neural encoding of intonation, sentence, andspeaker information at single electrodes. (A to C) Neural responseaveraged over intonation contour for three example electrodes (mean ± 1 SEM).Neural activity on electrode one (A) differentiates intonation contours,whereas activity on electrodes two (B) and three (C) does not. Black linesindicate time points when means were significantly different betweenintonation conditions (F test, P < 0.05, Bonferroni corrected). (D to F) Averageneural response to each sentence condition for the same electrodes as in (A)to (C). Black lines indicate significant differences between sentence conditions.(G to I) Average neural response to each speaker for the same electrodes asin (A) to (C) and (D) to (F). Black lines indicate significant differencesbetween speaker conditions. (J to L) Unique variance explained by maineffects for each example electrode. Bold lines indicate time points of significance
for eachmain effect. Black lines indicate time points when the full model wassignificant (omnibus F test; P < 0.05, Bonferroni corrected). (M) Map ofintonation, sentence, and speaker encoding for one subject. Locations ofelectrodes one, two, and three are indicated. The area of the pie chart isproportional to the total variance explained.Wedges show the relativevariance explained by each stimulus dimension (color) or for pairwise andthree-way interactions (black) for each significant electrode. (N) Proportionof variance explained by main effects and interactions across time pointswhen the full model was significant for all significant electrodes across all10 participants with each electrode classified as either intonation (In),sentence (Se), or speaker (Sp) on the basis of which stimulus dimensionwas maximally encoded (Tukey box plot). Pie charts show the averageproportions of the total variance explained. n, number of electrodes.
Fre
quen
cy (
Hz)
Pitc
h (H
z)
−1
0
1
2
3
Hγ
Speech Non-speech, with f0 Non-speech, missing f0
Emphasis 3Emphasis 1Neutral Question
Cla
ssifi
catio
nac
cura
cy
speechwith f0
missing f00
0.2
0.4
0.6
0.8
1.0
with f0
0.2
0.4
0.6
0.8
1.0
Acc
urac
y fo
rno
n-sp
eech
Accuracy for speech Accuracy for speech0.2 0.4 0.6 0.8 1.0
missing f0
0.2 0.4 0.6 0.8 1.00.0 0.5 1.0 1.5 2.0 2.5Time (s)
0.0 0.5 1.0 1.5 2.0 2.5Time (s)
0.0 0.5 1.0 1.5 2.0 2.5Time (s)
0.0 0.5 1.0 1.5 2.0 2.50.0 0.5 1.0 1.5 2.0 2.50.0 0.5 1.0 1.5 2.0 2.5
Fig. 3. Similar neural responses to intonation in speech and nonspeechcontexts. (A) Acoustic signal, pitch contour, and spectrogram of an examplespeech token. A portion of the acoustic signal is expanded to show the quasi-periodic amplitude variation that is characteristic of speech. (B) Nonspeech tokencontaining energy at the fundamental frequency (f0), with pitch contour matchingthat in (A).Three bands of spectral power can be seen at the fundamental, secondharmonic, and third harmonic. (C) Nonspeech token, with same pitch contouras in (A) and (B), that does not contain f0. Pink noise was added from 0.25 sbefore theonsetof thepitch contour to thepitch contouroffset. (D)Averageneuralresponse by intonation contour to speech (left), nonspeech with f0 (middle),and nonspeechmissing f0 (right) stimuli at an example electrode (mean ± 1 SEM).
(E) Classification accuracy of a linear discriminant analysis model fit on neuralresponses to speech stimuli to predict intonation condition for the electroderepresented in (D) (blue; shuffled: green).The accuracy of the speech-trainedmodel on the nonspeech data, both with and without f0, was within the middle95% of accuracies for speech stimuli. (F) Mean accuracy for speech stimuliversus accuracy for nonspeech stimuli (left: with f0; right: missing f0). Eachmarker represents a significant electrode from participants who listened toeach type of nonspeech stimuli (with f0: N = 8 participants; missing f0: N = 3participants). Red markers indicate electrodes whose model performance onnonspeech stimuli was below the middle 95% of accuracy values from speechstimuli. Gray lines indicate chance performance at 25% and the unity line.
RESEARCH | REPORTon A
pril 11, 2020
http://science.sciencemag.org/
Dow
nloaded from

To test the hypothesis that neural activity dif-ferentiating intonation contours can be explainedby relative pitch but not absolute pitch, we pre-sented participants with tokens from the TIMITspeech corpus containing sentences spokenby hundreds of male and female speakers (Fig.4A and fig. S3, A to C) (28). We then comparedencoding models (34) containing absolute pitch(Fig. 4B), relative pitch (Fig. 4C), or both tocompute the unique variance (R2) explained
by absolute- and relative-pitch features at eachelectrode. We also used these models to predictneural responses to the original set of synthesizedintonation stimuli to compare the predictionperformance between absolute- and relative-pitch models.Figure 4D shows the absolute- and relative-
pitch receptive fields for one example electrodethat had a significant increase in R2 when relative-but not absolute-pitch features were included in
the model (permutation test, see materials andmethods). This electrode was tuned to high rela-tive pitch but did not respond differentially todifferent absolute-pitch levels. Other relative-pitch–encoding electrodes were tuned for lowrelative pitch (fig. S4, A to C) or for both high andlow relative pitch at different delays (fig. S4, Dand E), indicating an increased response to pitchmovement. Across absolute-pitch–encoding elec-trodes, somewere tuned to high absolute pitch,
Tang et al., Science 357, 797–801 (2017) 25 August 2017 4 of 5
"Bricks are an alternative."
50100200400
90150200250
Abs
. pitc
h (
Hz)
0.0 0.5 1.0 1.5-1.7-0.50.61.7
Rel
. pitc
h (
z-sc
ore)
"His head flopped back."
0.0 0.5 1.0Time (s)
Female speakers Male speaker
−101234
Abs
onl
ypr
edic
tion
−101234
Rel
onl
ypr
edic
tion
0 0.5 1 1.5 2 2.5
−101234
Act
ual H
γ
0 0.5 1 1.5 2 2.5Time (s)
0 0.5 1 1.5 2 2.5
NeutralQuestion
Emphasis 1Emphasis 3
MaleFemale
Pitc
h (H
z)
400
200
100
50
Pitc
h (H
z)
250
200
150
90Abs
olut
e pi
tch
(Hz)
400 0Delay (ms)
1.7
0.6
-0.5
-1.7Rel
ativ
e pi
tch
(z-s
core
)
−0.08
0.00
0.08
−0.08
0.00
0.08
Into
natio
n en
codi
ng (
R2 )
Absolute pitch encoding (R2)0.00 0.05 0.10 0.15 0.20 0.25
0.0
0.2
0.4
0.6
0.8
Relative pitch encoding (R2)0.00 0.02 0.04 0.06 0.08
0.0
0.2
0.4
0.6
0.8
Into
natio
n en
codi
ng (
R2 )
Fig. 4. Cortical representation of intonation relies on relative-pitchencoding, not absolute-pitch encoding. (A) Example tokens from theTIMITspeech corpus. (B) Absolute-pitch (ln Hz) feature representation.Bins represent different values of absolute pitch. (C) Relative-pitch(z score of ln Hz within speaker) feature representation. The gray lineindicates a relative-pitch value of 0. (D) Pitch temporal receptive fieldfrom one example electrode that encoded relative but not absolutepitch (R2
relative = 0.03, significant by permutation test; R2absolute = 0.00,
not significant). The receptive field shows which stimulus featuresdrive an increase in the neural response—in this case, high values ofrelative pitch. Color indicates regression weight (arbitrary units) (E) Pitchcontours of the original stimulus set. (F) Average pitch contours formale and female speakers in the original stimulus set across intonationconditions. (G) Prediction of the model fit with only absolute-pitchfeatures. (H) Average predicted response across all male and female
tokens from the absolute-pitch–only model. (I) Prediction of the modelfit with only relative-pitch features. (J) Average predicted responseacross all male and female tokens from the relative-pitch–only model.(K) Actual neural responses to original stimulus set (mean ± 1 SEM).The actual response of this electrode was better predicted by therelative-pitch–only model (rrel_pred = 0.85; rabs_pred = 0.66). (L) Actualneural responses averaged over intonation conditions. (M) Scatterplotbetween relative- and absolute-pitch encoding with neural discrimina-bility of intonation contours, showing that intonation contourdiscriminability is correlated with relative-pitch encoding but notabsolute-pitch encoding (rrelative_intonation = 0.57, P < 1 × 10⁻¹⁶;rabsolute_intonation = 0.03, P > 0.05). Colored markers show electrodeswith significant (permutation test; R2 > 95th percentile of nulldistribution) relative- and absolute-pitch encoding for the top andbottom panels, respectively.
RESEARCH | REPORTon A
pril 11, 2020
http://science.sciencemag.org/
Dow
nloaded from

whereas others were tuned to low absolutepitch (fig. S5).We next determined which pitch features (ab-
solute or relative) better predicted the neural re-sponses to the original stimulus set (Fig. 4, E andF). For the electrode whose receptive field isshown in Fig. 4D, the absolute-pitch–only modelpredicted that the pattern of responses to dif-ferent intonation contours differed for the femaleand male speakers (Fig. 4G), with a greater re-sponse to the female speakers comparedwith themale speaker (Fig. 4H). Conversely, the relative-pitch–onlymodel predicted similar responses forthe female and male speakers (Fig. 4, I and J).The actual neural response to these stimuli isshown in Fig. 4K (Fig. 4L shows an additionalview of the actual responses averaged over in-tonation conditions) and wasmore similar to theprediction fromthe relative-pitch–onlymodel thantheprediction from the absolute-pitch–onlymodel(rrel_pred = 0.85; rabs_pred = 0.66). Responses of84%of intonation electrodes (38 of 45 electrodes)were better predicted by relative pitch. In addi-tion, relative-pitch encoding predicted neural dis-criminability of intonation contours (r= 0.57,P<1 × 10⁻¹⁶), whereas absolute-pitch encoding didnot (r = 0.03, P = 0.67) (Fig. 4M).We demonstrated direct evidence for the
concurrent extraction of multiple socially andlinguistically relevant dimensions of speech in-formation at the level of human nonprimary,high-order auditory cortex in the STG. Our re-sults are consistent with the idea that the maintypes of voice information, including speech andspeaker identity, are processed in dissociablepathways (35, 36).The importance of relative pitch to linguistic
prosody is well established because vocal pitchranges differ across individual speakers (2, 37).Additionally, in music, melodies can be recog-nized even when the notes are transposed. Therepresentation of relative auditory features may,in fact, be a general property of the auditory sys-tem because contours can be recognized in mul-tiple auditory dimensions, such as loudness andtimbre (38, 39). Functional magnetic resonanceimaging blood oxygen level–dependent activityincreases in nonprimary areas of the humanlateral HG, planum polare, and anterolateralplanum temporale for harmonic tone complexesthat change in pitch height and pitch chroma(40), where activity depends on the variabilityof pitch-height changes (41, 42). However, inaddition to relative-pitch encoding, we alsofound coexisting absolute-pitch encoding inthe STG, consistent with reports that differ-ences in cortical activation for different speakersare correlated with differences in fundamentalfrequency (43).In animal-model studies, spectral and tempo-
ral features important for pitch are encoded atmany levels of the auditory system, from theauditory nerve (44, 45) to the primary auditorycortex (46). Single neurons can encode informa-tion about pitch by systematically varyingtheir firing rate to sounds with different pitch(47, 48), and some respond similarly to pure
tone and missing fundamental tones withmatched pitch (21). Multiunit activity contain-ing information about whether a target soundwas higher or lower in pitch than a previoussound may play a role in relative-pitch process-ing (49). However, a direct neural encoding ofrelative pitch or its dissociation from sites encod-ing absolute pitch has not been previouslydemonstrated.Perceptual studies have demonstrated that
speaker normalization for pitch occurs in thesentence context (32, 50) and can also occuras rapidly as within the first six glottal periods(~20 to 50 ms) (51). We have demonstrated howintonational pitch undergoes specialized extrac-tion from the speech signal, separate from otherimportant elements, such as the phonemes them-selves. An outstanding future question is howsuch components are then integrated to sup-port a unified, meaningful percept for languagecomprehension.
REFERENCES AND NOTES
1. A. Cutler, D. Dahan, W. van Donselaar, Lang. Speech 40,141–201 (1997).
2. D. R. Ladd, Intonational Phonology (Cambridge Univ.Press, 2008).
3. S. Shattuck-Hufnagel, A. E. Turk, J. Psycholinguist. Res. 25,193–247 (1996).
4. I. R. Titze, J. Acoust. Soc. Am. 85, 1699–1707 (1989).5. E. D. Ross, Arch. Neurol. 38, 561–569 (1981).6. K. M. Heilman, D. Bowers, L. Speedie, H. B. Coslett, Neurology
34, 917–921 (1984).7. M. D. Pell, S. R. Baum, Brain Lang. 57, 80–99 (1997).8. J. Witteman, M. H. van Ijzendoorn, D. van de Velde,
V. J. J. P. van Heuven, N. O. Schiller, Neuropsychologia 49,3722–3738 (2011).
9. E. Plante, M. Creusere, C. Sabin, Neuroimage 17, 401–410(2002).
10. M. Meyer, K. Alter, A. D. Friederici, G. Lohmann,D. Y. von Cramon, Hum. Brain Mapp. 17, 73–88 (2002).
11. M. Meyer, K. Steinhauer, K. Alter, A. D. Friederici,D. Y. von Cramon, Brain Lang. 89, 277–289 (2004).
12. J. Gandour et al., Neuroimage 23, 344–357 (2004).13. C. P. Doherty, W. C. West, L. C. Dilley, S. Shattuck-Hufnagel,
D. Caplan, Hum. Brain Mapp. 23, 85–98 (2004).14. A. D. Friederici, K. Alter, Brain Lang. 89, 267–276
(2004).15. Y. Tong et al., Neuroimage 28, 417–428 (2005).16. J. Kreitewolf, A. D. Friederici, K. von Kriegstein, Neuroimage
102, 332–344 (2014).17. T. D. Griffiths, C. Büchel, R. S. Frackowiak, R. D. Patterson, Nat.
Neurosci. 1, 422–427 (1998).18. R. D. Patterson, S. Uppenkamp, I. S. Johnsrude, T. D. Griffiths,
Neuron 36, 767–776 (2002).19. H. Penagos, J. R. Melcher, A. J. Oxenham, J. Neurosci. 24,
6810–6815 (2004).20. M. Schönwiesner, R. J. Zatorre, Exp. Brain Res. 187, 97–105
(2008).21. D. Bendor, X. Wang, Nature 436, 1161–1165 (2005).22. W. A. van Dommelen, Lang. Speech 33, 259–272
(1990).23. M. Steinschneider, Y. I. Fishman, J. C. Arezzo, Cereb. Cortex 18,
610–625 (2008).24. S. Ray, J. H. R. Maunsell, PLOS Biol. 9, e1000610
(2011).25. E. Edwards et al., J. Neurophysiol. 102, 377–386
(2009).26. N. E. Crone, D. Boatman, B. Gordon, L. Hao, Clin. Neurophysiol.
112, 565–582 (2001).27. N. Mesgarani, C. Cheung, K. Johnson, E. F. Chang, Science
343, 1006–1010 (2014).28. J. S. Garofalo, L. F. Lamel, W. M. Fisher, J. G. Fiscus,
D. S. Pallett, N. L. Dahlgren, V. Zue, “TIMIT acoustic-
phonetic continuous speech corpus,” Linguistic DataConsortium (1993); https://catalog.ldc.upenn.edu/ldc93s1.
29. G. P. Sonntag, T. Portele, Comput. Speech Lang. 12, 437–451(1998).
30. J. C. R. Licklider, J. Acoust. Soc. Am. 26, 945(1954).
31. C. J. Plack, A. J. Oxenham, R. R. Fay, Pitch: Neural Codingand Perception (Springer, 2006), vol. 24.
32. P. C. M. Wong, R. L. Diehl, J. Speech Lang. Hear. Res. 46,413–421 (2003).
33. C. Gussenhoven, B. H. Repp, A. Rietveld, H. H. Rump, J. Terken,J. Acoust. Soc. Am. 102, 3009–3022 (1997).
34. F. E. Theunissen et al., Netw. Comput. Neural Syst. 12, 289–316(2001).
35. P. Belin, S. Fecteau, C. Bédard, Trends Cogn. Sci. 8, 129–135(2004).
36. P. Belin, P. E. G. Bestelmeyer, M. Latinus, R. Watson,Br. J. Psychol. 102, 711–725 (2011).
37. R. Jakobson, G. Fant, M. Halle, Preliminaries to SpeechAnalysis: The Distinctive Features and Their Correlates(MIT Press, 1951).
38. J. H. McDermott, A. J. Lehr, A. J. Oxenham, Psychol. Sci. 19,1263–1271 (2008).
39. K. R. Kluender, J. A. Coady, M. Kiefte, Speech Commun. 41,59–69 (2003).
40. J. D. Warren, S. Uppenkamp, R. D. Patterson,T. D. Griffiths, Proc. Natl. Acad. Sci. U.S.A. 100,10038–10042 (2003).
41. E. J. Allen, P. C. Burton, C. A. Olman, A. J. Oxenham,J. Neurosci. 37, 1284–1293 (2017).
42. R. J. Zatorre, K. Delhommeau, J. M. Zarate, Front. Psychol. 3,544 (2012).
43. E. Formisano, F. De Martino, M. Bonte, R. Goebel, Science 322,970–973 (2008).
44. P. A. Cariani, B. Delgutte, J. Neurophysiol. 76, 1698–1716(1996).
45. P. A. Cariani, B. Delgutte, J. Neurophysiol. 76, 1717–1734(1996).
46. Y. I. Fishman, C. Micheyl, M. Steinschneider, J. Neurosci. 33,10312–10323 (2013).
47. J. K. Bizley, K. M. M. Walker, B. W. Silverman,A. J. King, J. W. H. Schnupp, J. Neurosci. 29, 2064–2075(2009).
48. J. K. Bizley, K. M. M. Walker, A. J. King, J. W. H. Schnupp,J. Neurosci. 30, 5078–5091 (2010).
49. J. K. Bizley, K. M. M. Walker, F. R. Nodal, A. J. King,J. W. H. Schnupp, Curr. Biol. 23, 620–625 (2013).
50. J. Pierrehumbert, J. Acoust. Soc. Am. 66, 363–369(1979).
51. C.-Y. Lee, J. Acoust. Soc. Am. 125, 1125–1137 (2009).
ACKNOWLEDGMENTS
We thank S. Shattuck-Hufnagel, K. Johnson, C. Schreiner,M. Leonard, Y. Oganian, N. Fox, and B. Dichter forhelpful comments on the manuscript. This work wassupported by grants from the NIH (R01-DC012379 toE.F.C. and F32 DC014192-01 to L.S.H.). E.F.C. is aNew York Stem Cell Foundation Robertson Investigator.This research was also supported by the New YorkStem Cell Foundation, the Howard Hughes Medical Institute,the McKnight Foundation, The Shurl and Kay CurciFoundation, and The William K. Bowes Foundation. Raw data,analysis code, and supporting documentation for thisproject are accessible online at https://doi.org/10.5281/zenodo.826950.
SUPPLEMENTARY MATERIALS
www.sciencemag.org/content/357/6353/797/suppl/DC1Materials and MethodsFigs. S1 to S5Table S1References (52–59)Audio S1 to S96
25 January 2017; resubmitted 21 April 2017Accepted 20 July 201710.1126/science.aam8577
Tang et al., Science 357, 797–801 (2017) 25 August 2017 5 of 5
RESEARCH | REPORTon A
pril 11, 2020
http://science.sciencemag.org/
Dow
nloaded from

Intonational speech prosody encoding in the human auditory cortexC. Tang, L. S. Hamilton and E. F. Chang
DOI: 10.1126/science.aam8577 (6353), 797-801.357Science
, this issue p. 797Sciencespeaker.independent from, sites that encode other critical aspects of speech, such as the phonemes and information about theextracted intonational information in real time from the speech signal. These sites were overlapping with, but functionally pitch is represented by a highly specialized and dedicated neural population in the auditory cortex. Discrete cortical sitesperformed high-density brain recordings on clinically monitored neurosurgical patients. They discovered that intonational
et al.To emphasize a word, we briefly raise our pitch; this alone can change the meaning of a sentence. Tang Brain mechanisms of pitch perception
ARTICLE TOOLS http://science.sciencemag.org/content/357/6353/797
MATERIALSSUPPLEMENTARY
http://science.sciencemag.org/content/suppl/2017/08/24/357.6353.797.DC1http://science.sciencemag.org/content/suppl/2017/08/24/357.6353.797.DC2
REFERENCES
http://science.sciencemag.org/content/357/6353/797#BIBLThis article cites 52 articles, 8 of which you can access for free
PERMISSIONS http://www.sciencemag.org/help/reprints-and-permissions
Terms of ServiceUse of this article is subject to the
is a registered trademark of AAAS.ScienceScience, 1200 New York Avenue NW, Washington, DC 20005. The title (print ISSN 0036-8075; online ISSN 1095-9203) is published by the American Association for the Advancement ofScience
Science. No claim to original U.S. Government WorksCopyright © 2017 The Authors, some rights reserved; exclusive licensee American Association for the Advancement of
on April 11, 2020
http://science.sciencem
ag.org/D
ownloaded from
Top Related