


Languages
Pages
Legal


National & Regional Economic Outlook
The Alliance Bank Business Outreach Center 2014 Economic Outlook Conference
November 6, 2014
Ronald J. GundersonProfessor of EconomicsNorthern Arizona University

A Few Bright Spots
Gasoline prices have dropped sharplyRetail sales should improve as a resultNew job creation is better this year than in
several yearsConsumer Confidence is up!
2
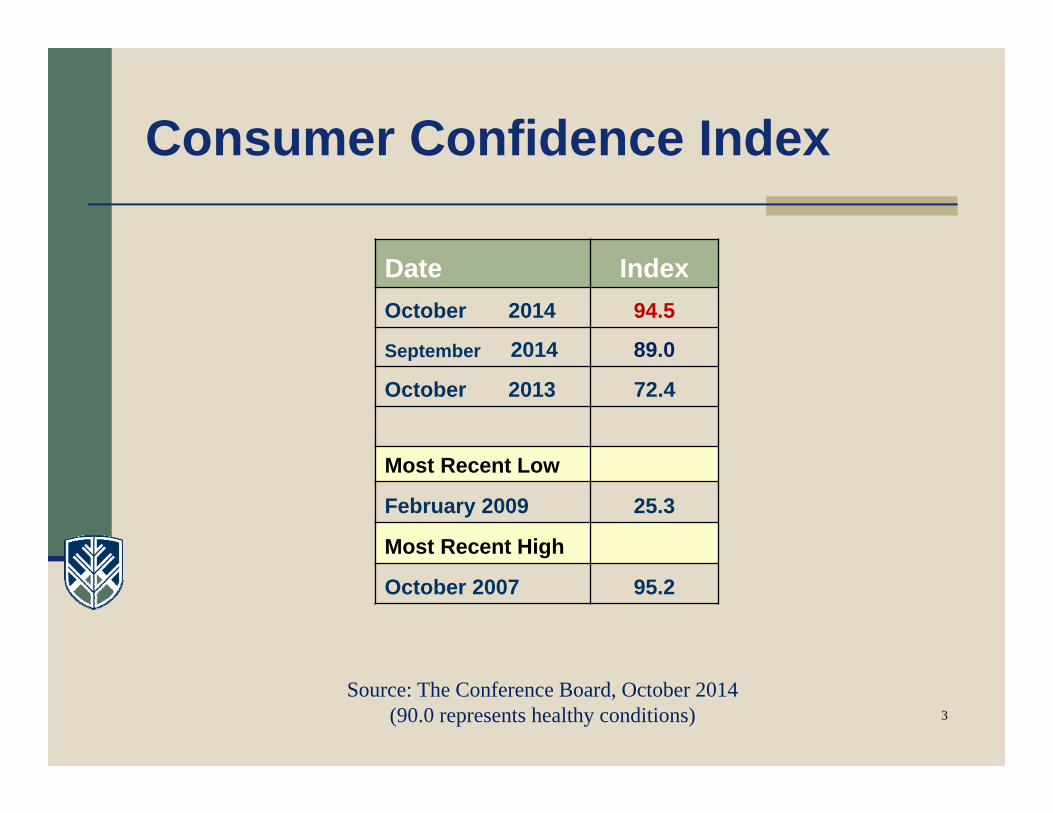
Consumer Confidence Index
Date IndexOctober 2014 94.5
September 2014 89.0
October 2013 72.4
Most Recent Low
February 2009 25.3
Most Recent High
October 2007 95.2
3
Source: The Conference Board, October 2014 (90.0 represents healthy conditions)
The Current Picture
Wages are not keeping up so income hasn’t rebounded
Millions of persons are working part-time even though they would like to be full-time
It is taking longer to find jobs (structural unemployment)
People are still struggling with mortgage debt
Source: Boak & Rugaber, AP Economics Writers. August 1, 2014.
4

Wealth Without Workers; Workers Without Wealth
We are in the midst of an economic revolution, but this is not our first experience with a revolutionary environment.
Source: The Economist, October 4, 2014
5
The 19th century industrial revolution transformed the human condition, but for the typical wage-earner, this meant hard labor in crowded, disease-ridden cities.
It was nearly 100 years before the typical worker benefited from the revolution.Source: The Economist, October 4, 2014
6
Industrial Revolution

Digital Revolution
Today’s digital revolution is creating a similar situation worldwide, but we don’t have 100 years to find a solution.
Source: The Economist, October 4, 2014
7
Technology Changes
Technology has destroyed a large number of medium-skilled jobs
Increased the number of persons competing for lower-skilled jobs, while expanding the range of tasks that can be automated
Workers are competing against each other and against machines!
Source: The Economist, October 4, 2014
8

A Bold Response
Raise the productivity and employability of the less-skilled.
Revamp education, not just for the young, but adults need lifetime learning to keep up.
This will increase employability, but further advances in technology will keep wages low.
Source: The Economist, October 4, 2014
9

The Future
The market system thrives on finding new ways to do old things!
Joseph Schumpeter called this: Creative Destruction
Unless a market society continues to provide solutions to the downsides that accompany the benefits of new technology, Schumpeter felt capitalism will disappear.
10
Regional Economic Trends
Flagstaff & Northern Arizona
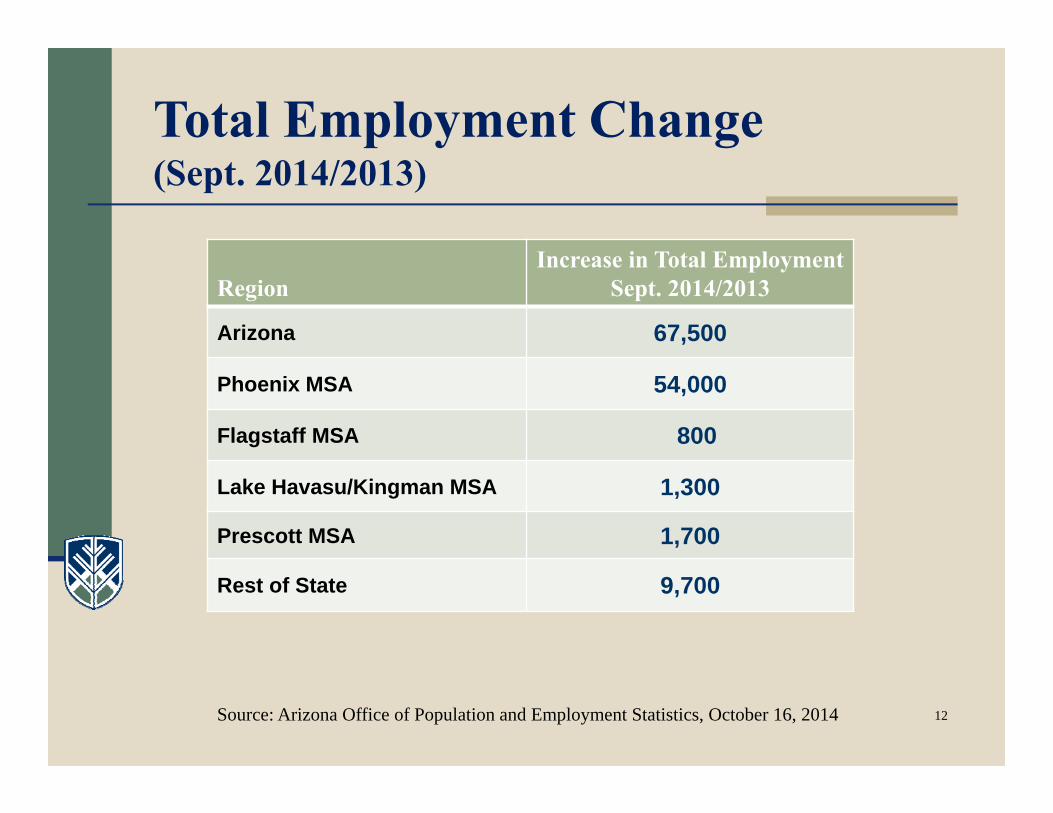
RegionIncrease in Total Employment
Sept. 2014/2013
Arizona 67,500
Phoenix MSA 54,000
Flagstaff MSA 800
Lake Havasu/Kingman MSA 1,300
Prescott MSA 1,700
Rest of State 9,700
Total Employment Change(Sept. 2014/2013)
Source: Arizona Office of Population and Employment Statistics, October 16, 2014 12
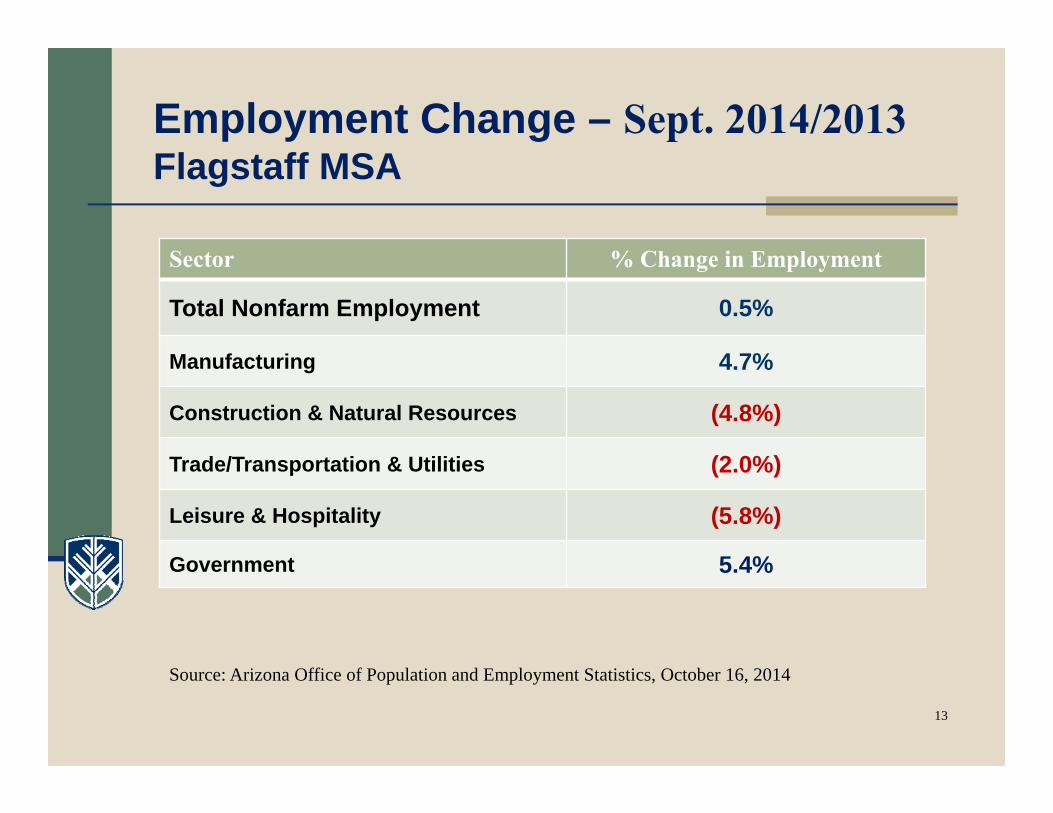
Sector % Change in Employment
Total Nonfarm Employment 0.5%
Manufacturing 4.7%
Construction & Natural Resources (4.8%)
Trade/Transportation & Utilities (2.0%)
Leisure & Hospitality (5.8%)
Government 5.4%
Employment Change – Sept. 2014/2013Flagstaff MSA
Source: Arizona Office of Population and Employment Statistics, October 16, 2014
13
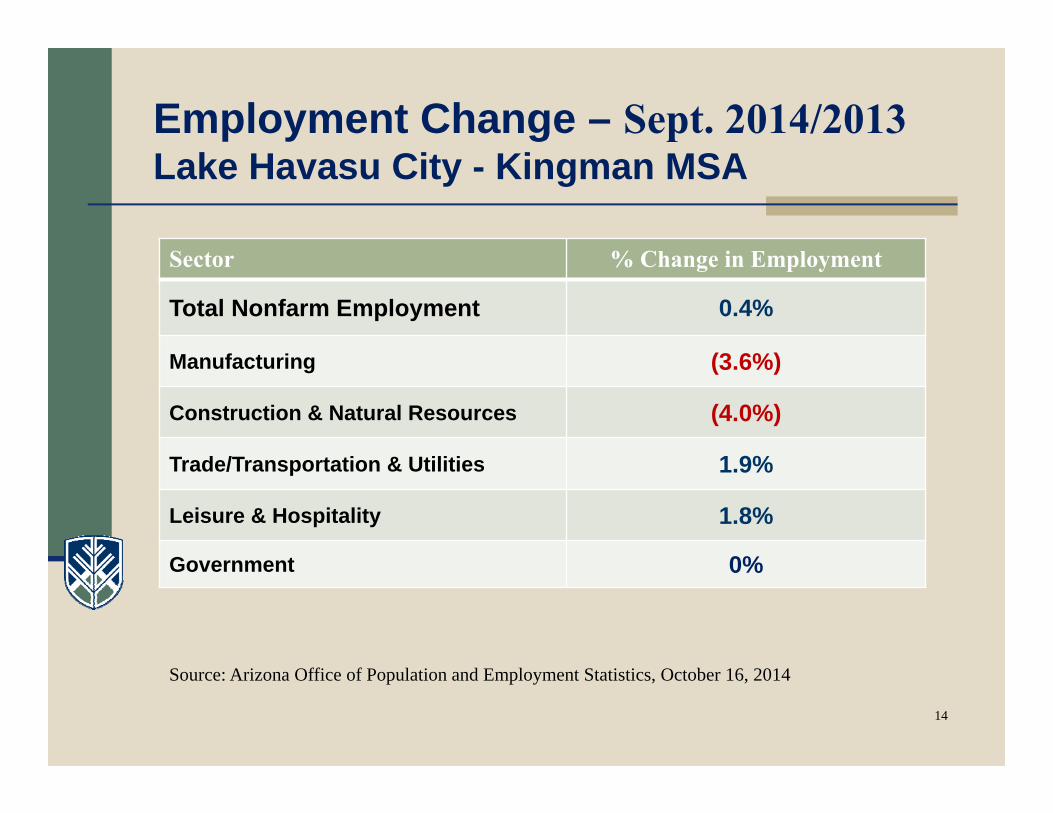
Sector % Change in Employment
Total Nonfarm Employment 0.4%
Manufacturing (3.6%)
Construction & Natural Resources (4.0%)
Trade/Transportation & Utilities 1.9%
Leisure & Hospitality 1.8%
Government 0%
Employment Change – Sept. 2014/2013Lake Havasu City - Kingman MSA
Source: Arizona Office of Population and Employment Statistics, October 16, 2014
14

Sector % Change in Employment
Total Nonfarm Employment 1.2%
Manufacturing 3.1%
Construction & Natural Resources 2.3%
Trade/Transportation & Utilities 5.2%
Leisure & Hospitality (4.9%)
Government 1.9%
Employment Change – Sept. 2014/2013Prescott MSA
Source: Arizona Office of Population and Employment Statistics, October 16, 2014
15

Flagstaff Real Estate (Overall market)
Median Single Family Home Price* September 2014 ---- $359,900
September 2013 ---- $305,000
September 2012 ---- $274,700
May 2007 ---- $399,750 (peak median price)
*The median price is often not the best measure because it largely reflects which part of the market is moving.
Source: Flagstaff Real Estate News, Ann Heitland, Remax Peak Properties, Various Issues.
16

Flagstaff Single Family Homes Median Sales Price
17
392,500 387,900
323,000338,950
297,000281,500 274,700
305,000
359,000
2006 2007 2008 2009 2010 2011 2012 2013 2014
Median Price ($) (September)

Flagstaff Real Estate (Overall Flagstaff Regional market)
Supply of Homes (Sept. 2014/2013) $0 – $200,000 fell from 2.1 months to 2.0 months
$200,000 – $300,000 rose from 2.8 months to 3.4 months
$300,000 – $400,000 stayed the same at 4.4 months
Flagstaff is still a sellers’ market up to $400,000.
The number of homes for sale in September rose 6.5% from a year ago.
18
Source: Flagstaff Real Estate News, Ann Heitland, Remax Peak Properties, Various Issues.
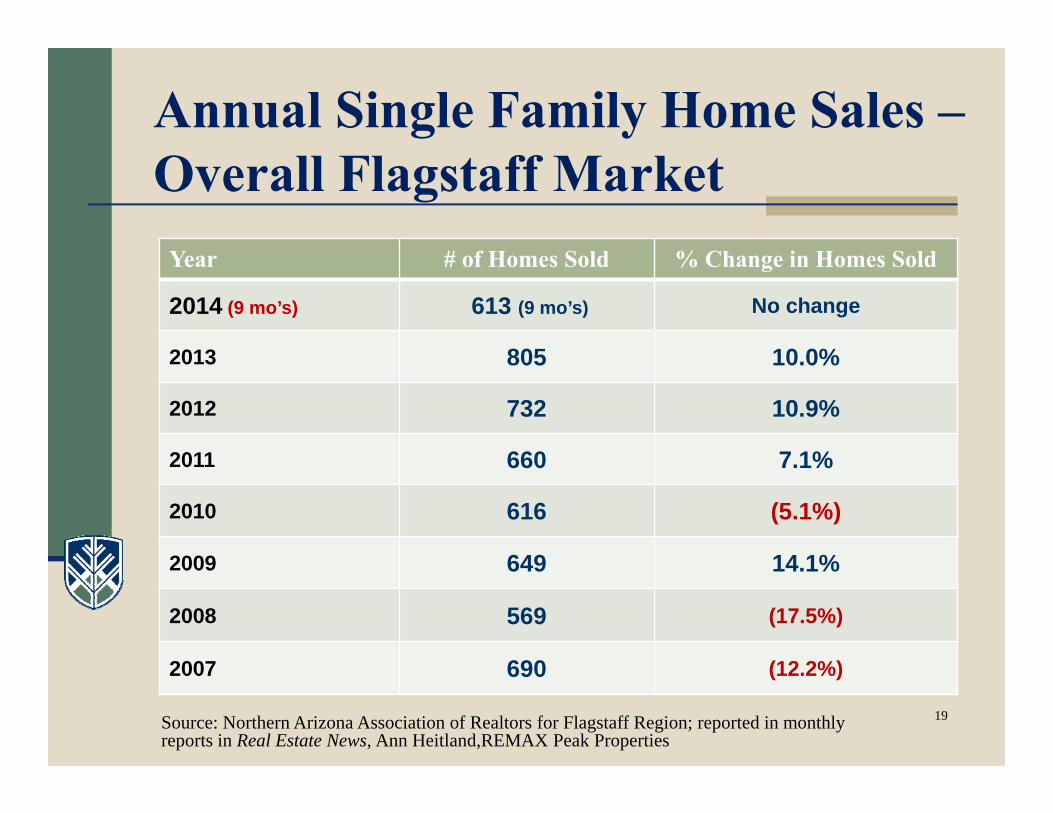
Year # of Homes Sold % Change in Homes Sold
2014 (9 mo’s) 613 (9 mo’s) No change
2013 805 10.0%
2012 732 10.9%
2011 660 7.1%
2010 616 (5.1%)
2009 649 14.1%
2008 569 (17.5%)
2007 690 (12.2%)
Annual Single Family Home Sales –Overall Flagstaff Market
Source: Northern Arizona Association of Realtors for Flagstaff Region; reported in monthly reports in Real Estate News, Ann Heitland,REMAX Peak Properties
19

Flagstaff Business Activity (FY 2015)Taxable Sales – July-September
Percent ChangeTaxable Business Activity from previous year
Total Business Activityw/o Utilities 6.6%
Auto Sales 11.3%
Construction 17.4%
BBB 7.2%
Other Retail 1.8%
Source: City of Flagstaff Sales Tax Division

Flagstaff Tax RevenuesTotal w/o Utilities
21
-6.32
3.29
2.04
6.84
3.51
6.62
FY 09-10 FY 10-11 FY 11-12 FY 12-13 FY 13-14 FY '15 (3 MO'S)
Percent ∆ From Previous Year

Flagstaff Tax RevenuesAuto Sales
22
3.38
18.3617.72
16.59
10.4211.28
FY 09-10 FY 10-11 FY 11-12 FY 12-13 FY 13-14 FY '15 (3 MO'S)
Percent ∆ From Previous Year
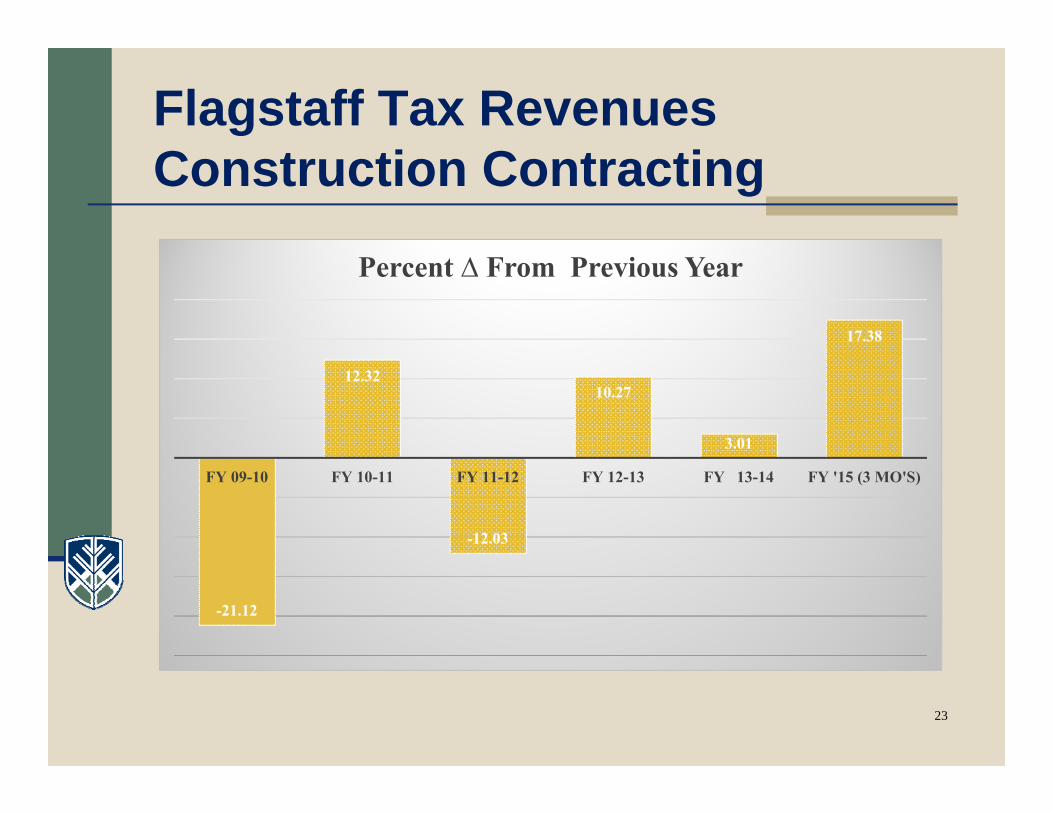
Flagstaff Tax RevenuesConstruction Contracting
23
-21.12
12.32
-12.03
10.27
3.01
17.38
FY 09-10 FY 10-11 FY 11-12 FY 12-13 FY 13-14 FY '15 (3 MO'S)
Percent ∆ From Previous Year
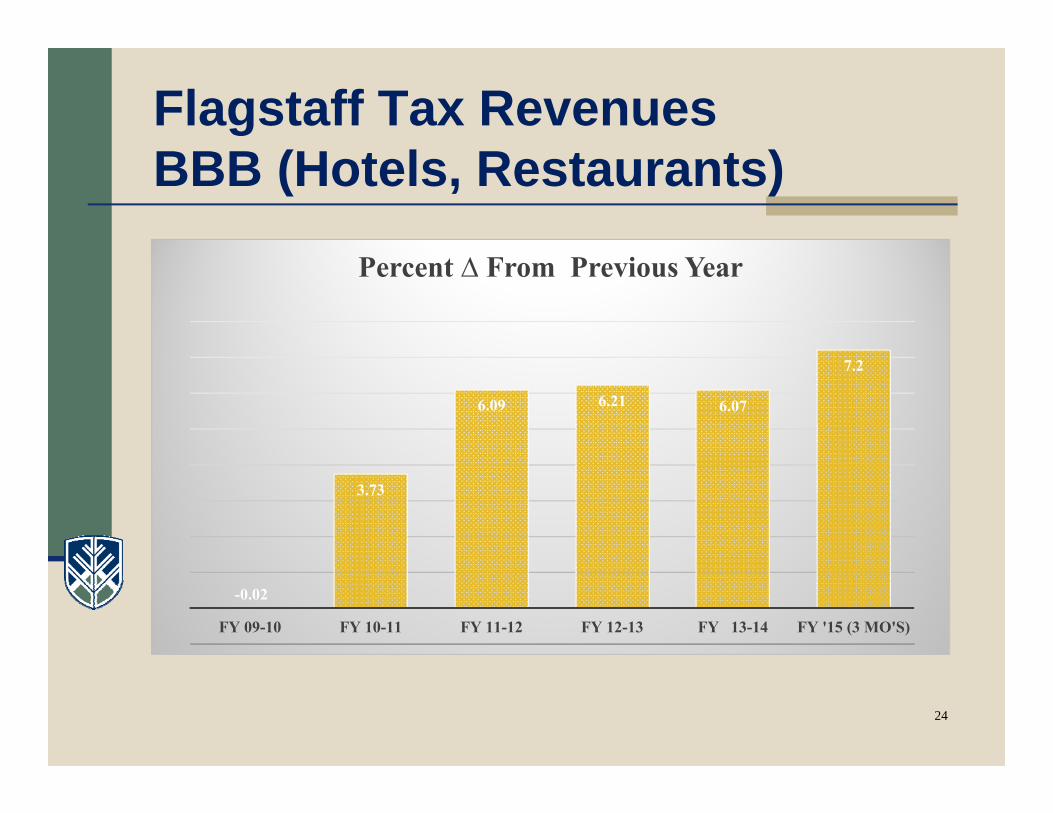
Flagstaff Tax RevenuesBBB (Hotels, Restaurants)
24
-0.02
3.73
6.09 6.21 6.07
7.2
FY 09-10 FY 10-11 FY 11-12 FY 12-13 FY 13-14 FY '15 (3 MO'S)
Percent ∆ From Previous Year
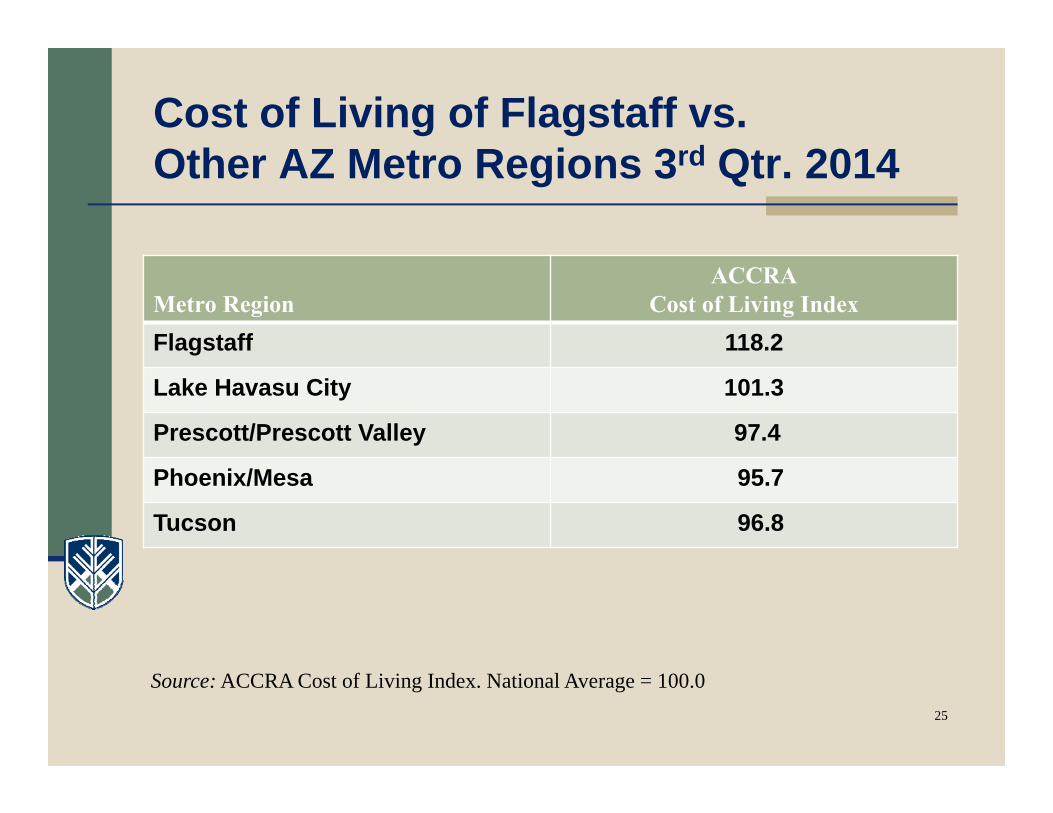
Cost of Living of Flagstaff vs.Other AZ Metro Regions 3rd Qtr. 2014
Metro RegionACCRA
Cost of Living IndexFlagstaff 118.2
Lake Havasu City 101.3
Prescott/Prescott Valley 97.4
Phoenix/Mesa 95.7
Tucson 96.8
Source: ACCRA Cost of Living Index. National Average = 100.025

Increased NAU Student Enrollment
NAU Enrollment – Mountain CampusFall 2014 20,134Fall 2013 19,320Fall 2012 18,431Fall 2011 17,761Fall 2010 17,529Fall 2009 16,032
Total increase since 2009: 4,102 students or >25%Source: NAU Office Planning and Institutional Research
Top Related