


Languages
Pages
Legal

NEUTRINO OSCILLATION WORKSHOP
Conca Specchiulla 9-16 Sept. 2006
Anna Maria Rotunno
Dip. Di Fisica & Sez. INFN di Bari
Geo-Neutrino: Theoretical Aspects
Based on:
G.L. Fogli, E. Lisi, A. Palazzo, A.M. Rotunno, GeoNeutrinos: an approach to their uncertainties and correlations, to appear in Earth, Moon and Planets;& long preprint in preparation (2006)

Contents
- Introduction to Geo-Neutrinos
- The Geo-Neutrino Source Model (GNSM)
- Covariance and Correlation
- Forward Analysis
- Backward Analysis
- Conclusions and Prospects
Purpose of this Work
- We show predictions about several experiments (“forward approach”) and how future data can constrain the error matrix of the model (“backward approach”).
Geo-Neutrinos emitted by heat producing elements (U, Th, K) can probe Earth interior.
Their fluxes present large and correlated uncertainties. Handling them is difficult but necessary,
if we want to quantify how future data can reduce errors.
- We propose an approach in terms of covariance matrices.
- We briefly discuss the construction of a tentative Geo-Neutrino Source Model (GNSM) describing U, Th, K abundances in Earth reservoirs.
Introduction to Geo-Neutrinos
T = 1500 ºC
(Mg, Fe, Al)(Al,Si)O2 pervoskiteCaSiO2 pervoskite,
(Fe,Mg)O
Fe-Ni, Si, S, O, H,
etc.
T = 4300 ºC
T = 3700 ºC
T = 4000 ºC
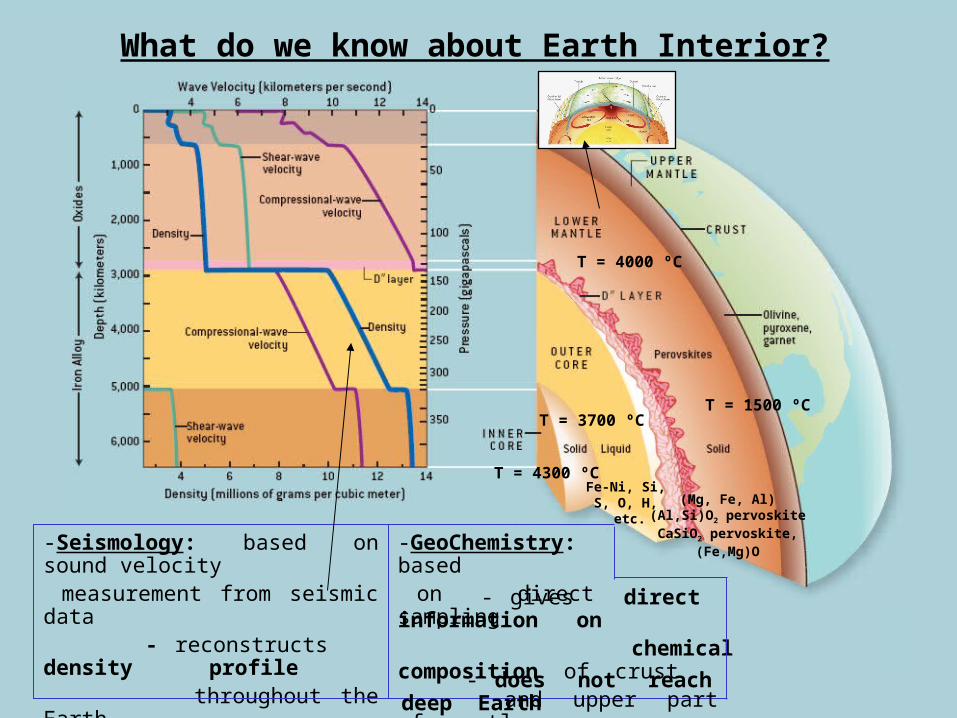
What do we know about Earth Interior?
-Seismology: based on sound velocity measurement from seismic data - reconstructs density profile throughout the Earth - infers crust-mantle-core layer structure - does not reach deep Earth
-GeoChemistry: based on direct sampling - gives direct information on chemical composition of crust and upper part of mantle
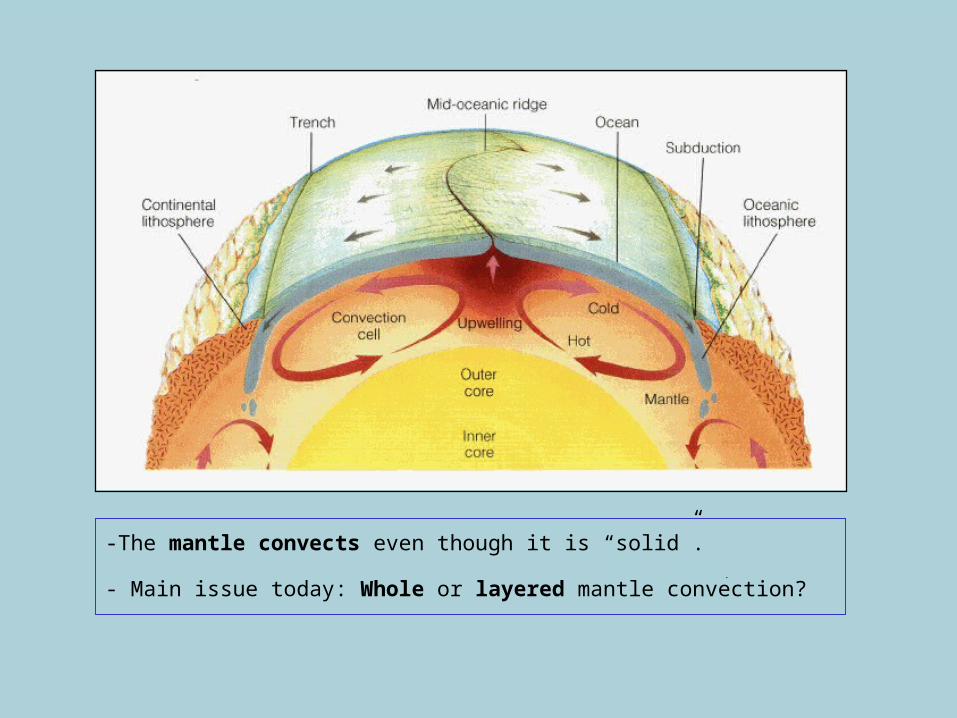
-The mantle convects even though it is “solid”.
- Main issue today: Whole or layered mantle convection?
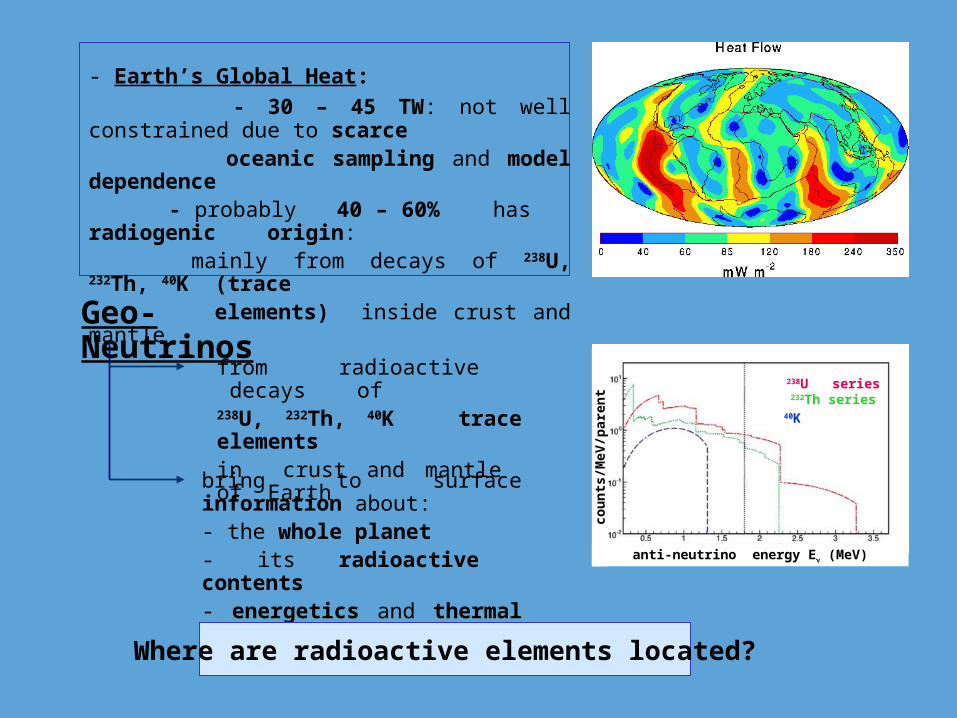
- Earth’s Global Heat:
- 30 – 45 TW: not well constrained due to scarce oceanic sampling and model dependence - probably 40 – 60% has radiogenic origin: mainly from decays of 238U, 232Th, 40K (trace elements) inside crust and mantle
Geo-Neutrinos
from radioactive decays of 238U, 232Th, 40K trace elements in crust and mantle of Earth
bring to surface information about:- the whole planet- its radioactive contents- energetics and thermal history
Where are radioactive elements located?
anti-neutrino energy E (MeV)
238U series232Th series 40K
coun
ts/M
eV/p
aren
t
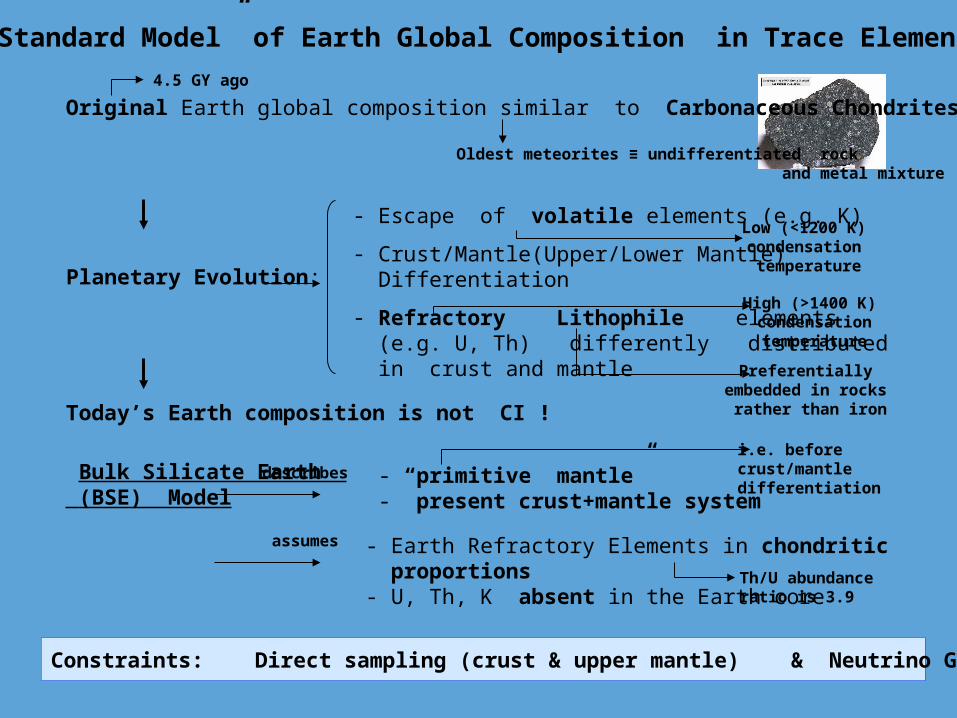
“Standard Model” of Earth Global Composition in Trace Elements
Original Earth global composition similar to Carbonaceous Chondrites (CI)
- Escape of volatile elements (e.g. K)
- Crust/Mantle(Upper/Lower Mantle) Differentiation
- Refractory Lithophile elements (e.g. U, Th) differently distributed in crust and mantle
Oldest meteorites ≡ undifferentiated rock and metal mixture
Today’s Earth composition is not CI !
Planetary Evolution:
Low (<1200 K) condensation temperature
High (>1400 K) condensationtemperature
Preferentially embedded in rocks
rather than iron
Bulk Silicate Earth (BSE) Model
Th/U abundance ratio is 3.9
i.e. before crust/mantle differentiation
- “primitive mantle” - present crust+mantle system
describes
- Earth Refractory Elements in chondritic proportions - U, Th, K absent in the Earth core
assumes
Constraints: Direct sampling (crust & upper mantle) & Neutrino Geophysics (in the future)
4.5 GY ago
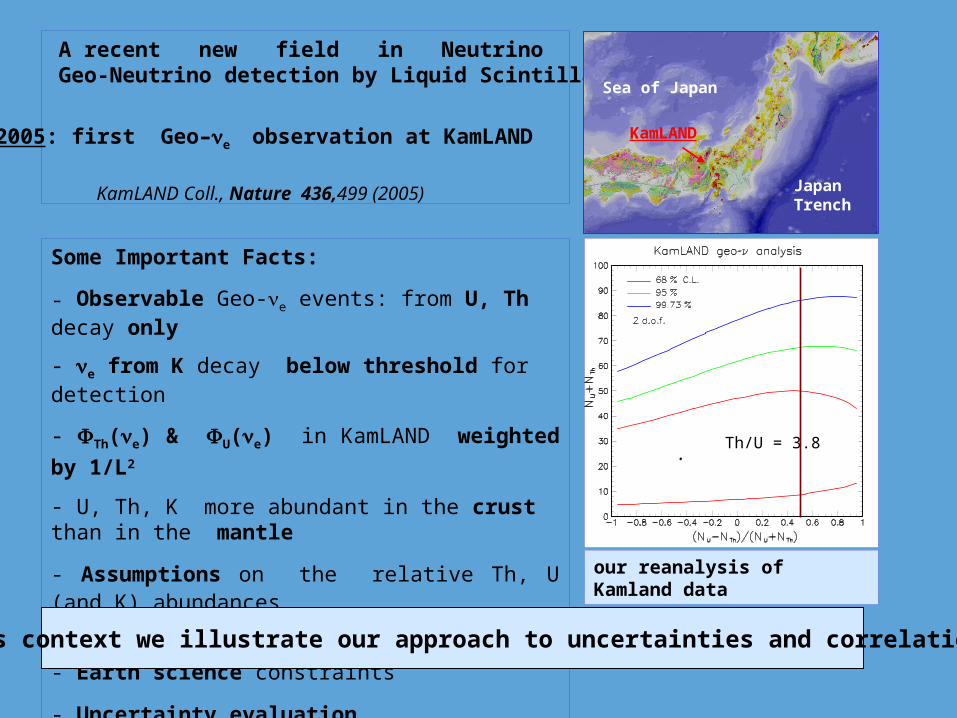
A recent new field in Neutrino Physics: Geo-Neutrino detection by Liquid Scintillator
2005: first Geo–e observation at KamLAND
KamLAND Coll., Nature 436,499 (2005)
Some Important Facts:
- Observable Geo-e events: from U, Th decay only
- e from K decay below threshold for detection
- Th(e) & U(e) in KamLAND weighted by 1/L2
- U, Th, K more abundant in the crust than in the mantle
- Assumptions on the relative Th, U (and K) abundances need to be explicitly reported
- Earth science constraints
- Uncertainty evaluation
Sea of Japan
JapanTrench
KamLAND
our reanalysis of Kamland data
In this context we illustrate our approach to uncertainties and correlations
Th/U = 3.8

Question 1: What do we really know about U, Th, K abundances?
Question 2: What do we expect to know from geo- data?
Usually advertised Goal: measure the Earth Radiogenic Heat
But….
… based on future U and Th geo- flux measurements, we might say something more
(e.g., about mantle convection)
We report about a systematic approach to include U, Th and K abundance
uncertainties and correlations in reservoirs (“Geo-Neutrino Source Model”)
The Geo-Neutrino Source Model (GNSM)
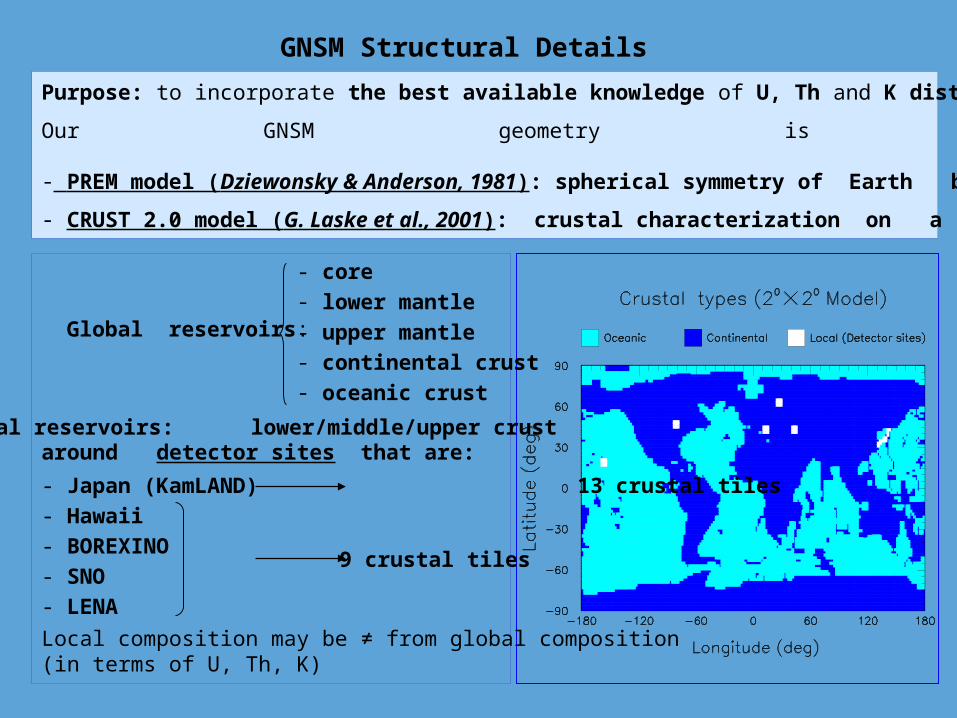
Purpose: to incorporate the best available knowledge of U, Th and K distributions inside Earth.
Our GNSM geometry is based on:
- PREM model (Dziewonsky & Anderson, 1981): spherical symmetry of Earth below crust
- CRUST 2.0 model (G. Laske et al., 2001): crustal characterization on a 2° 2° grid.
Global reservoirs:
around detector sites that are:
- Japan (KamLAND) 13 crustal tiles
- Hawaii
- BOREXINO
- SNO
- LENA
9 crustal tiles
GNSM Structural Details
- core- lower mantle
- upper mantle- continental crust- oceanic crust
Local reservoirs: lower/middle/upper crust
Local composition may be ≠ from global composition(in terms of U, Th, K)
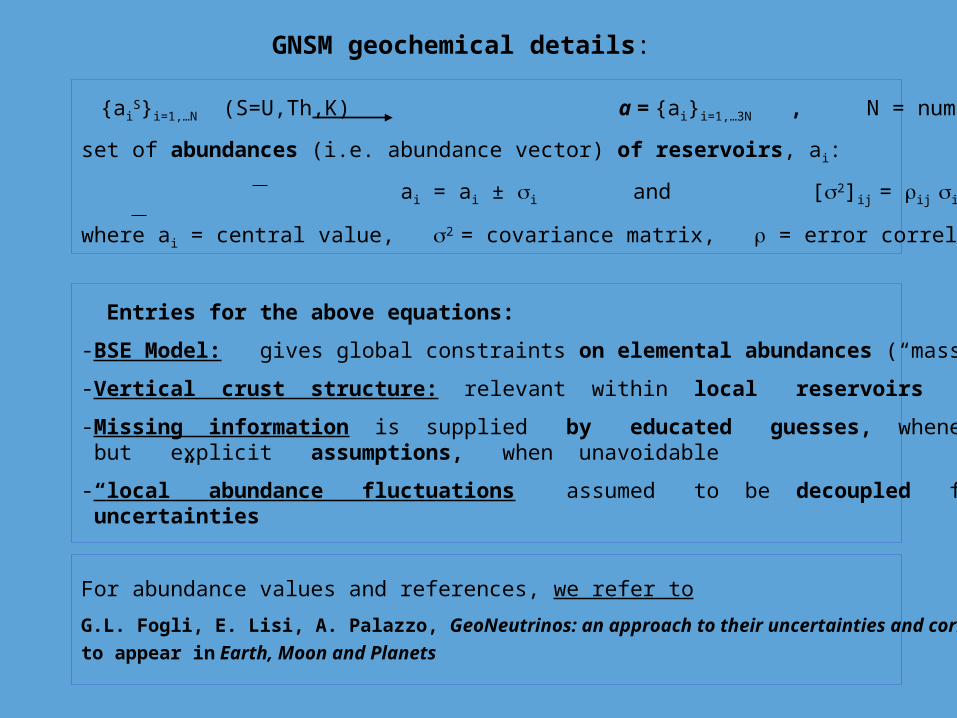
{aiS}i=1,…N (S=U,Th,K) a = {ai}i=1,…3N , N = number of reservoirs
set of abundances (i.e. abundance vector) of reservoirs, ai:
ai = ai ± i and [2]ij = ij i j
where ai = central value, 2 = covariance matrix, = error correlation matrix.
For abundance values and references, we refer to
G.L. Fogli, E. Lisi, A. Palazzo, GeoNeutrinos: an approach to their uncertainties and correlations,
to appear in Earth, Moon and Planets
Entries for the above equations:
-BSE Model: gives global constraints on elemental abundances (“mass balance constraints”)
-Vertical crust structure: relevant within local reservoirs
-Missing information is supplied by educated guesses, whenever possible, or arbitrary but explicit assumptions, when unavoidable
-“local” abundance fluctuations assumed to be decoupled from “global” abundance uncertainties
GNSM geochemical details:
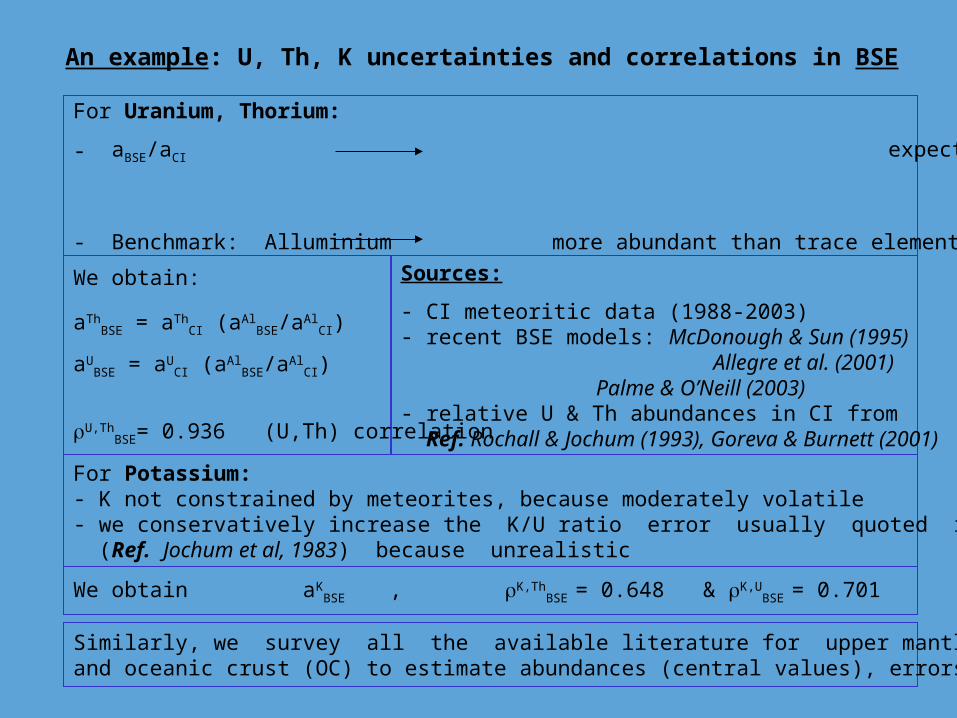
An example: U, Th, K uncertainties and correlations in BSE
For Uranium, Thorium:
- aBSE/aCI expected to be the same for all Refractory Lithophile Elements not volatilized during Earth formation (e.g. U, Th, Al)
- Benchmark: Alluminium more abundant than trace elements U, Th
We obtain:
aThBSE = aTh
CI (aAlBSE/aAl
CI)
aUBSE = aU
CI (aAlBSE/aAl
CI)
U,ThBSE= 0.936 (U,Th) correlation
Sources:
- CI meteoritic data (1988-2003)- recent BSE models: McDonough & Sun (1995)
Allegre et al. (2001) Palme & O’Neill (2003)- relative U & Th abundances in CI from Ref. Rochall & Jochum (1993), Goreva & Burnett (2001)
For Potassium:- K not constrained by meteorites, because moderately volatile- we conservatively increase the K/U ratio error usually quoted in the geochemical literature (Ref. Jochum et al, 1983) because unrealistic
We obtain aKBSE , K,Th
BSE = 0.648 & K,UBSE = 0.701
Similarly, we survey all the available literature for upper mantle (UM), continental crust (CC)and oceanic crust (OC) to estimate abundances (central values), errors and correlation
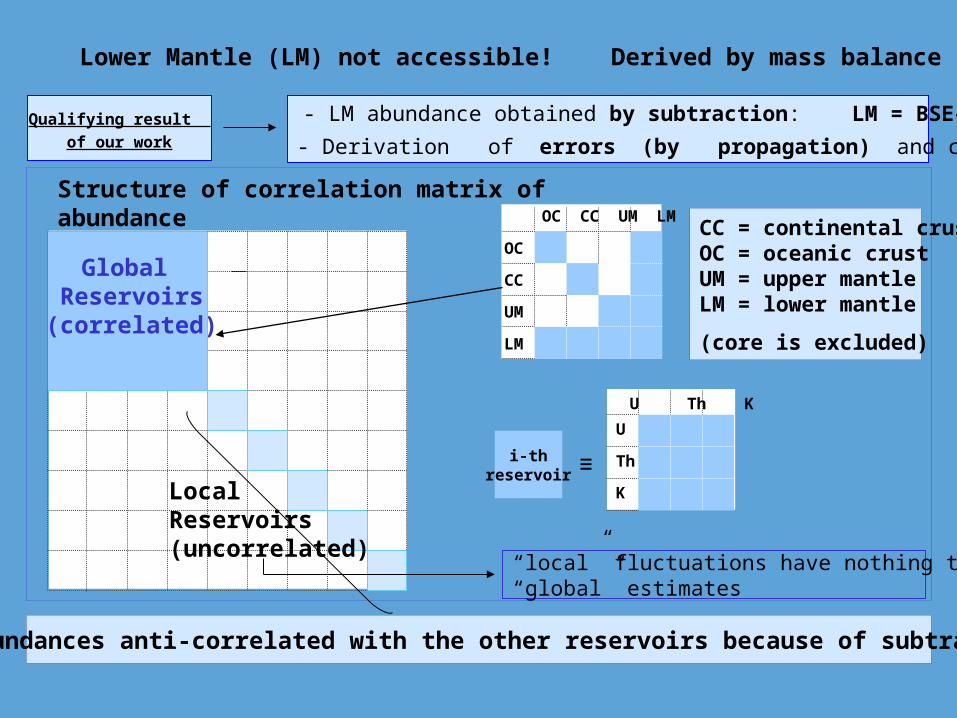
- LM abundance obtained by subtraction: LM = BSE–UM–CC–OC
- Derivation of errors (by propagation) and correlations Qualifying result
of our work
Global Reservoirs
(correlated)
OC CC UM LM
OC
CC
UM
LM
CC = continental crustOC = oceanic crustUM = upper mantleLM = lower mantle
(core is excluded)
Local Reservoirs(uncorrelated)
i-threservoir
U Th K
U
Th
K
≡
LM abundances anti-correlated with the other reservoirs because of subtraction
Structure of correlation matrix of abundance
Lower Mantle (LM) not accessible! Derived by mass balance constraints
“local” fluctuations have nothing to do with“global” estimates
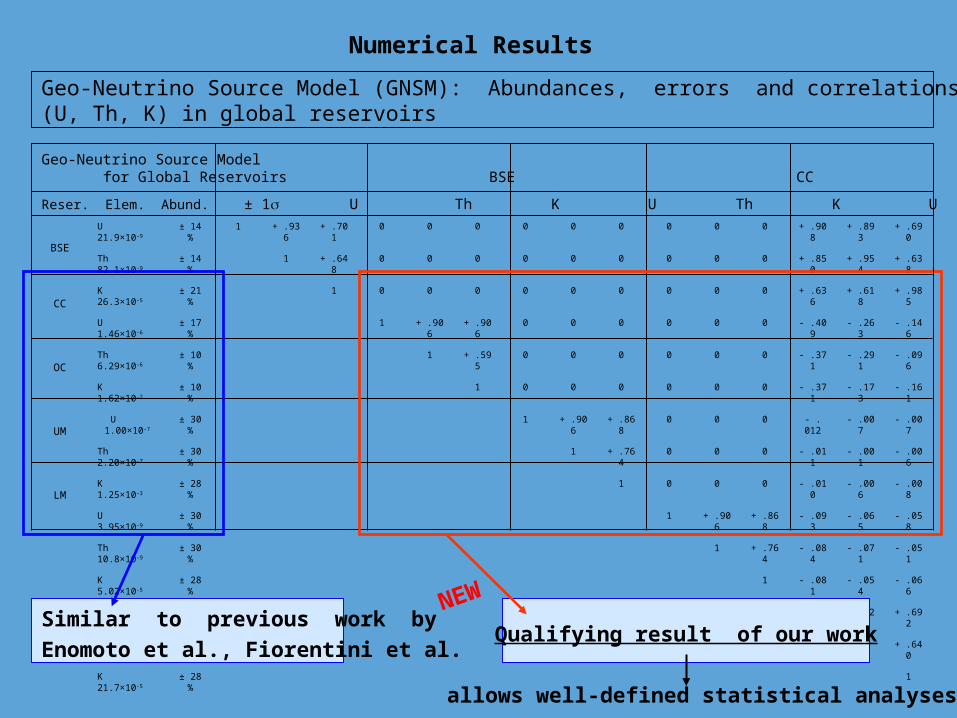
Geo-Neutrino Source Model for Global Reservoirs BSE CC OC UM LM
U 21.9×10⁻⁹ ± 14 % 1 + .936 + .701 0 0 0 0 0 0 0 0 0 + .908 + .893 + .690
Th 82.1×10⁻⁹ ± 14 % 1 + .648 0 0 0 0 0 0 0 0 0 + .850 + .954 + .638
K 26.3×10⁻⁵ ± 21 % 1 0 0 0 0 0 0 0 0 0 + .636 + .618 + .985
U 1.46×10⁻⁶ ± 17 % 1 + .906 + .906 0 0 0 0 0 0 - .409 - .263 - .146
Th 6.29×10⁻⁶ ± 10 % 1 + .595 0 0 0 0 0 0 - .371 - .291 - .096
K 1.62×10⁻² ± 10 % 1 0 0 0 0 0 0 - .371 - .173 - .161
U 1.00×10⁻⁷ ± 30 % 1 + .906 + .868 0 0 0 - . 012 - .007 - .007
Th 2.20×10⁻⁷ ± 30 % 1 + .764 0 0 0 - .011 - .001 - .006
K 1.25×10⁻³ ± 28 % 1 0 0 0 - .010 - .006 - .008
U 3.95×10⁻⁹ ± 30 % 1 + .906 + .868 - .093 - .065 - .058
Th 10.8×10⁻⁹ ± 30 % 1 + .764 - .084 - .071 - .051
K 5.02×10⁻⁵ ± 28 % 1 - .081 - .054 - .066
U 17.3×10⁻⁹ ± 30 % 1 + .924 + .692
Th 60.4×10⁻⁹ ± 30 % 1 + .640
K 21.7×10⁻⁵ ± 28 % 1
Reser. Elem. Abund. ± 1 U Th K U Th K U Th K U Th K U Th K
BSE
CC
OC
UM
LM
Geo-Neutrino Source Model (GNSM): Abundances, errors and correlations of radiogenic elements(U, Th, K) in global reservoirs
Qualifying result of our workNEW
Similar to previous work by
Enomoto et al., Fiorentini et al.
Numerical Results
allows well-defined statistical analyses

- All relevant observables and constraints can be expressed as linear functions of such
abundances (with known coefficients)
- (U,Th,K) abundances within a given reservoir are typically positively correlated
- (U,Th,K) correlations among different reservoirs can take any value
> 0 local abundances
ij < 0 complementary reservoirs
~ 0 decoupled reservoirs
- Measured Geo-Neutrino event rates (RU, RTh) are anticorrelated
RT
h (T
NU
)
Solid line: KamLAND data fit
Dashed line: Adapted Gaussian
RU = 12.5 ± 48.9 TNU RTh = 34.7 ± 28.5 TNU
(U,Th) = - 0.645
1 TNU = 1 event/year/1032 protons
RU (TNU)
our reanalysis of Kamland data
Negative correlation due to experimental sensitivity to RU +RTh rather than RU and RTh separately
Covariance approach relevant for GeoNeutrino physics because:
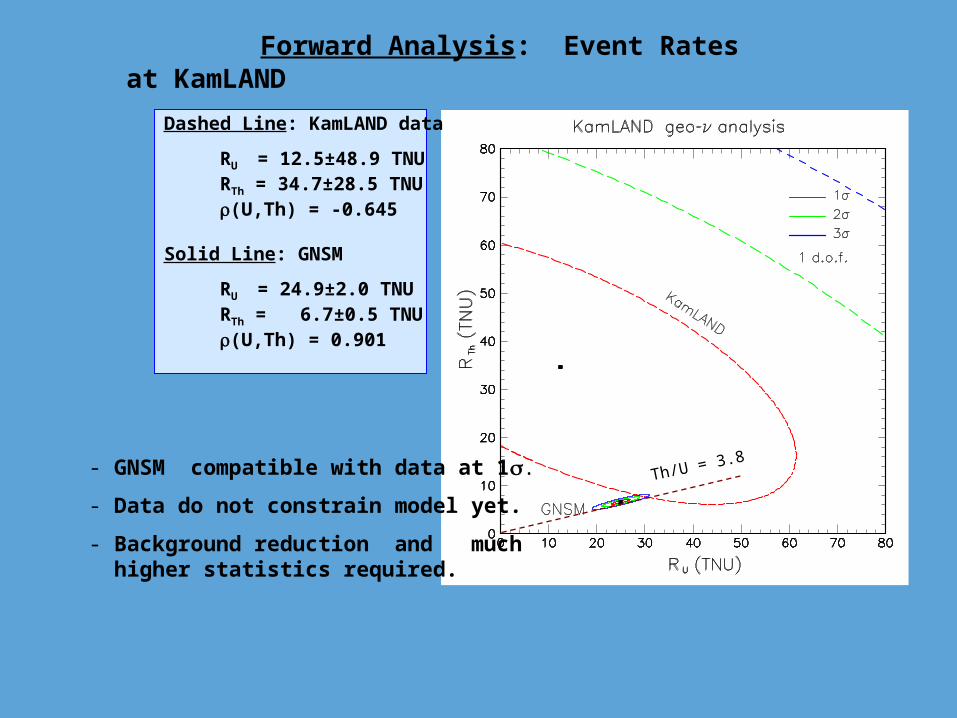
Forward Analysis: Event Rates at KamLAND
- GNSM compatible with data at 1.
- Data do not constrain model yet.
- Background reduction and much higher statistics required.
Dashed Line: KamLAND data
RU = 12.5±48.9 TNU RTh = 34.7±28.5 TNU (U,Th) = -0.645
Solid Line: GNSM
RU = 24.9±2.0 TNU RTh = 6.7±0.5 TNU (U,Th) = 0.901
Th/U = 3.8
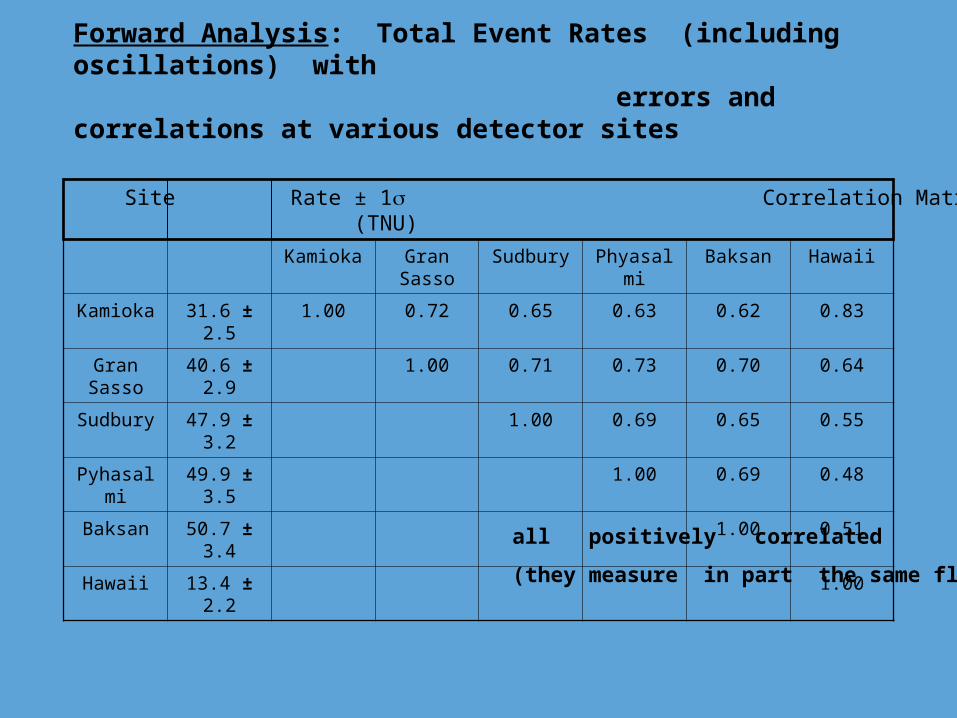
Kamioka Gran Sasso Sudbury Phyasalmi Baksan Hawaii
Kamioka 31.6 ± 2.5 1.00 0.72 0.65 0.63 0.62 0.83
Gran Sasso 40.6 ± 2.9 1.00 0.71 0.73 0.70 0.64
Sudbury 47.9 ± 3.2 1.00 0.69 0.65 0.55
Pyhasalmi 49.9 ± 3.5 1.00 0.69 0.48
Baksan 50.7 ± 3.4 1.00 0.51
Hawaii 13.4 ± 2.2 1.00
Site Rate ± 1 Correlation Matrix of GNSM predictions (TNU)
Forward Analysis: Total Event Rates (including oscillations) with errors and correlations at various detector sites
all positively correlated
(they measure in part the same flux)
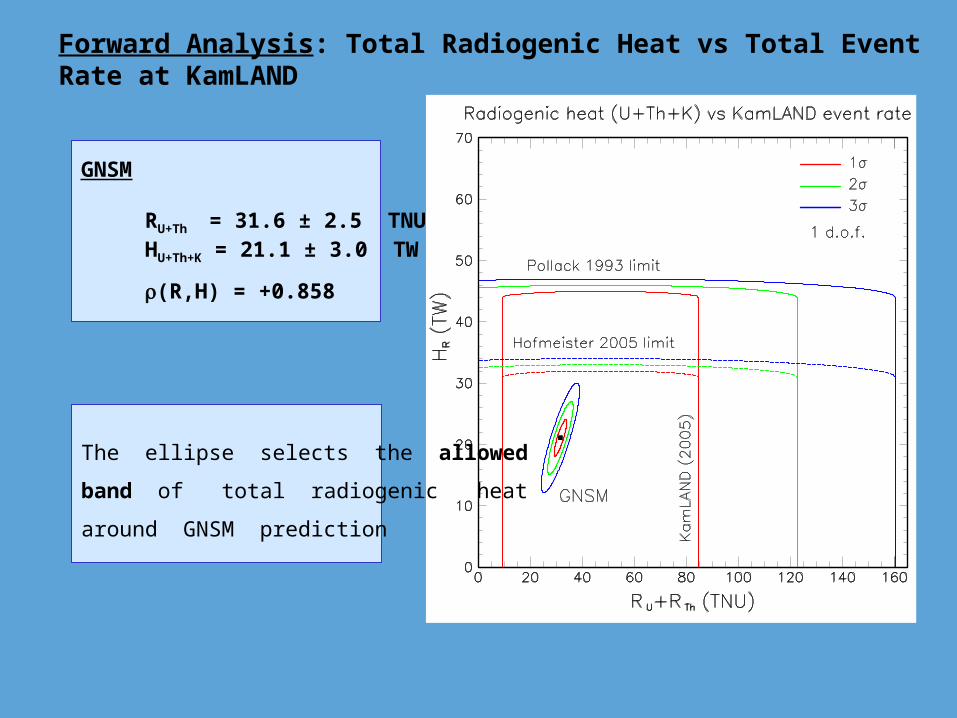
Forward Analysis: Total Radiogenic Heat vs Total Event Rate at KamLAND
GNSM
RU+Th = 31.6 ± 2.5 TNU HU+Th+K = 21.1 ± 3.0 TW
(R,H) = +0.858
The ellipse selects the allowed
band of total radiogenic heat
around GNSM prediction
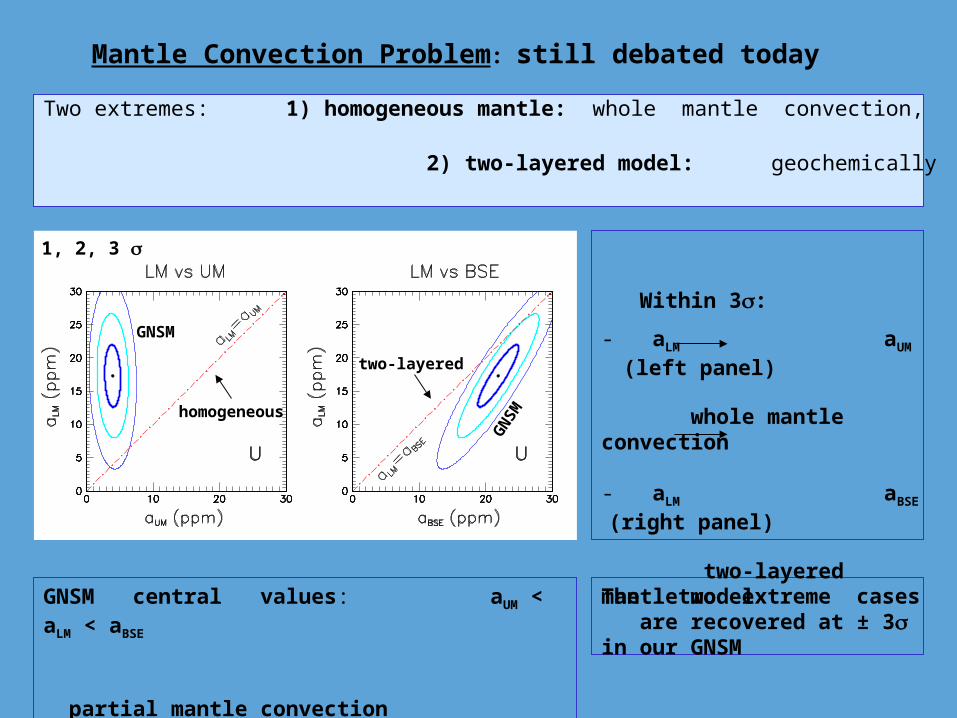
Two extremes: 1) homogeneous mantle: whole mantle convection, i.e. aLM= aUM 2) two-layered model: geochemically decoupled UM and LM LM with primitive abundances aLM= aBSE
Within 3:
- aLM aUM (left panel)
whole mantle convection - aLM aBSE (right panel)
two-layered mantle model
The two extreme cases are recovered at ± 3 in our GNSM
GNSM central values: aUM < aLM < aBSE
partial mantle convection
Mantle Convection Problem: still debated today
1, 2, 3
homogeneous
two-layered
GNSM
GN
SM
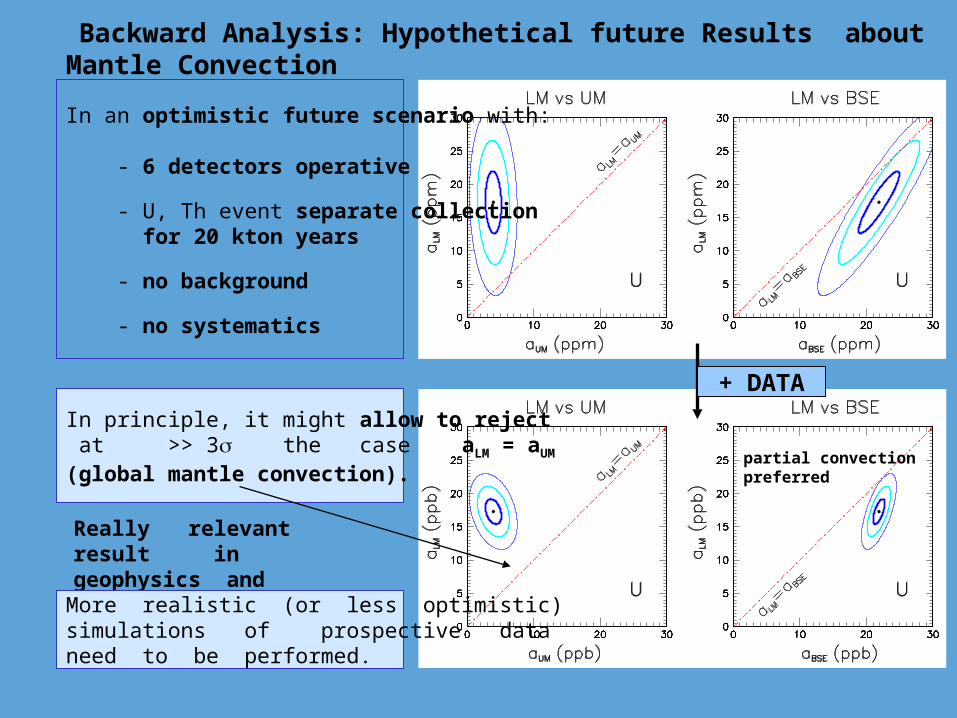
In an optimistic future scenario with:
- 6 detectors operative
- U, Th event separate collection for 20 kton years
- no background
- no systematics
+ DATA
In principle, it might allow to reject at >> 3 the case aLM = aUM
(global mantle convection).
Really relevant result in geophysics and geochemistry
More realistic (or less optimistic) simulations of prospective dataneed to be performed.
Backward Analysis: Hypothetical future Results about Mantle Convection
partial convectionpreferred
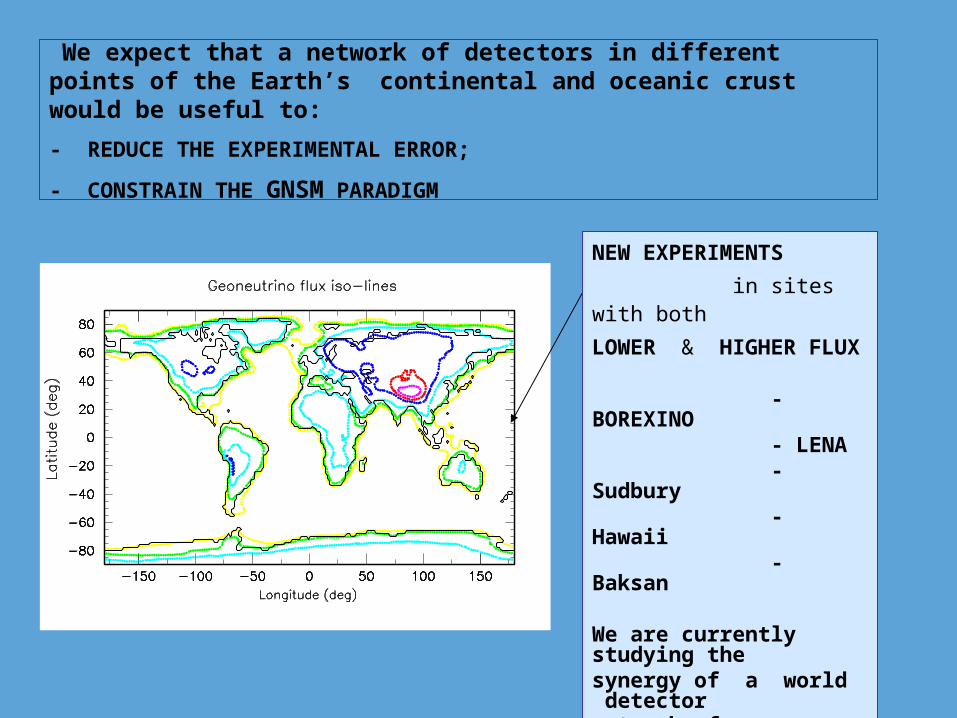
We expect that a network of detectors in different points of the Earth’s continental and oceanic crust would be useful to:
- REDUCE THE EXPERIMENTAL ERROR;
- CONSTRAIN THE GNSM PARADIGM
NEW EXPERIMENTS
in sites with both
LOWER & HIGHER FLUX - BOREXINO - LENA - Sudbury - Hawaii - Baksan We are currently studying the synergy of a world detector network from a quantitative
viewpoint.

- We have presented a tentative Geo-Neutrino Source Model (GNSM) embedding a full error matrix for the (U, Th, K) abundances in relevant local and global reservoirs. It is based on published data (when available) and on supplementary assumptions (when needed).
- Covariance analysis may provide a useful template for current and future studies. Applications of our approach have been given in terms of predictions for future experiments (forward propagations of errors) and of GNSM error reduction through prospective data (backward update).
- We are still far from a satisfactory approach of this kind in (U, Th, K) geochemistry, due to intrinsic difficulties (large uncertainties, incomplete data, sometimes conflicting estimates, ecc.)
- Interdisciplinary studies of more refined geochemical and geophysical Earth models and of future possible observations of Geo-Neutrino signals will be beneficial to Earth sciences.
Conclusions and Prospects
Top Related