


Languages
Pages
Legal


My Time in CURENT
Graham Treasure
Quick Recap
• First semester– Electrical theory– Introduction to programming– I already gave this talk
• Second Semester– Applications of knowledge from first semester– I will focus on this

Power Systems
• Consists of generators, loads, buses, and lines• 3 Types of Buses– Swing Bus (Vθ)– Generator Bus (PQ)– Load Bus (PV)
• 4 Variables; but with a combination of buses, we can still obtain all of them
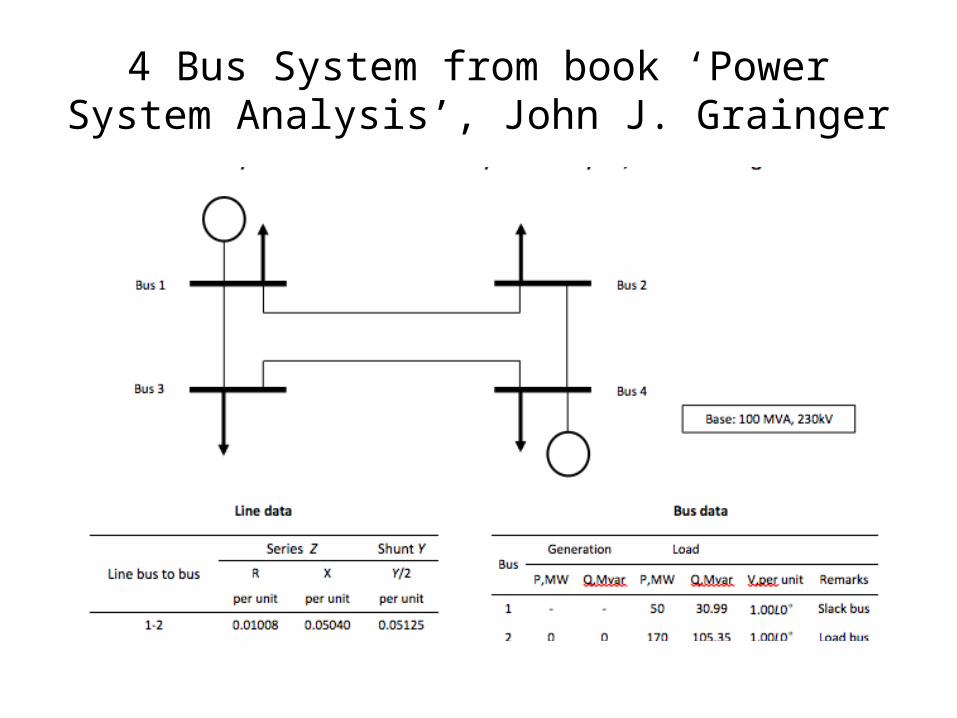
4 Bus System from book ‘Power System Analysis’, John J. Grainger
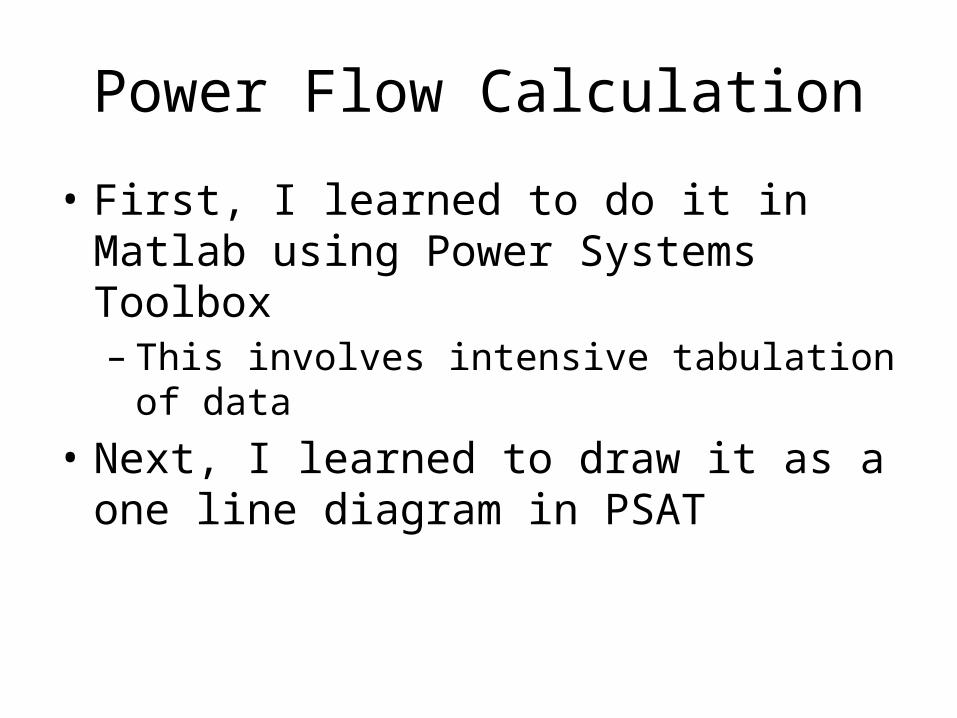
Power Flow Calculation
• First, I learned to do it in Matlab using Power Systems Toolbox– This involves intensive tabulation of data
• Next, I learned to draw it as a one line diagram in PSAT
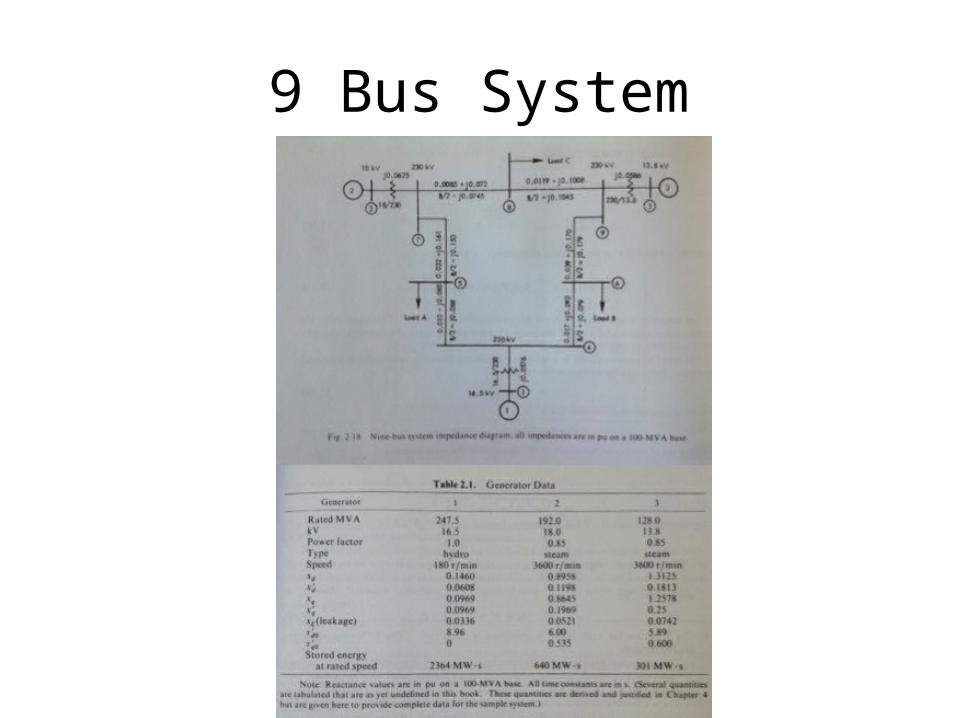
9 Bus System
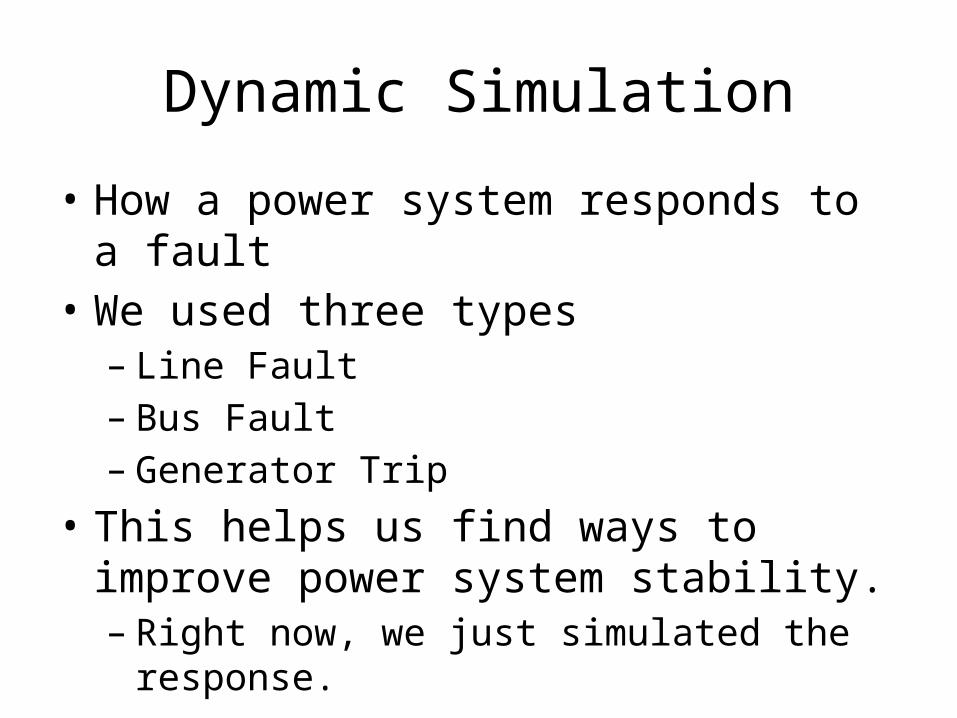
Dynamic Simulation
• How a power system responds to a fault• We used three types– Line Fault– Bus Fault– Generator Trip
• This helps us find ways to improve power system stability.– Right now, we just simulated the response.

Line/Bus Fault
• These occur when a line or bus becomes grounded
• No change in generation/load• System returns to its original state after the
fault is cleared• Faults generally do not last longer than five
cycles (<0.1s) due to protection relays
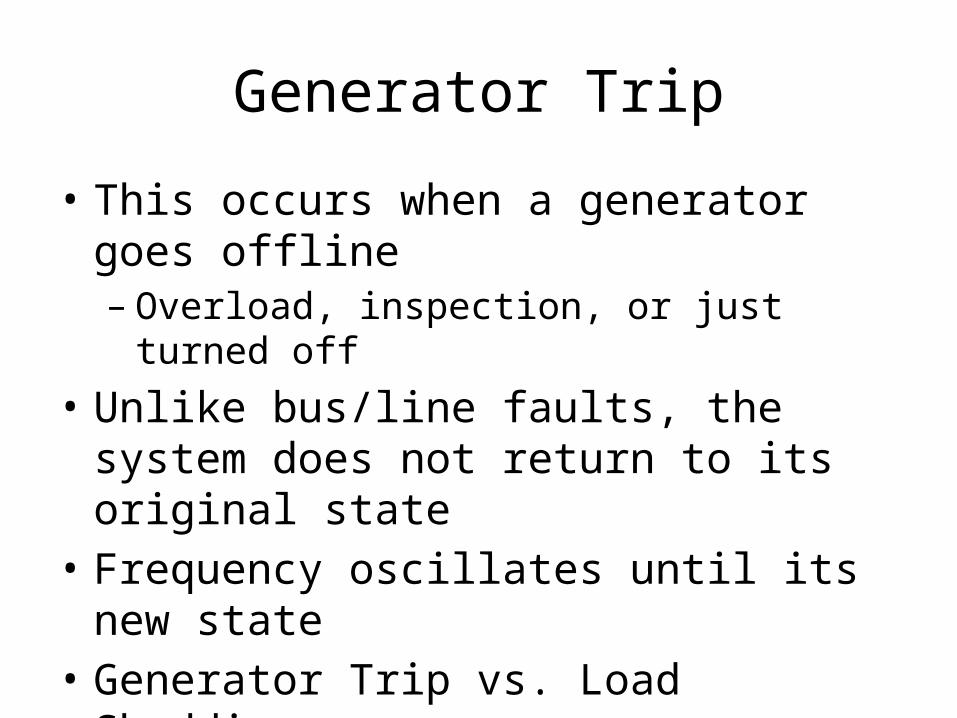
Generator Trip
• This occurs when a generator goes offline– Overload, inspection, or just turned off
• Unlike bus/line faults, the system does not return to its original state
• Frequency oscillates until its new state• Generator Trip vs. Load Shedding
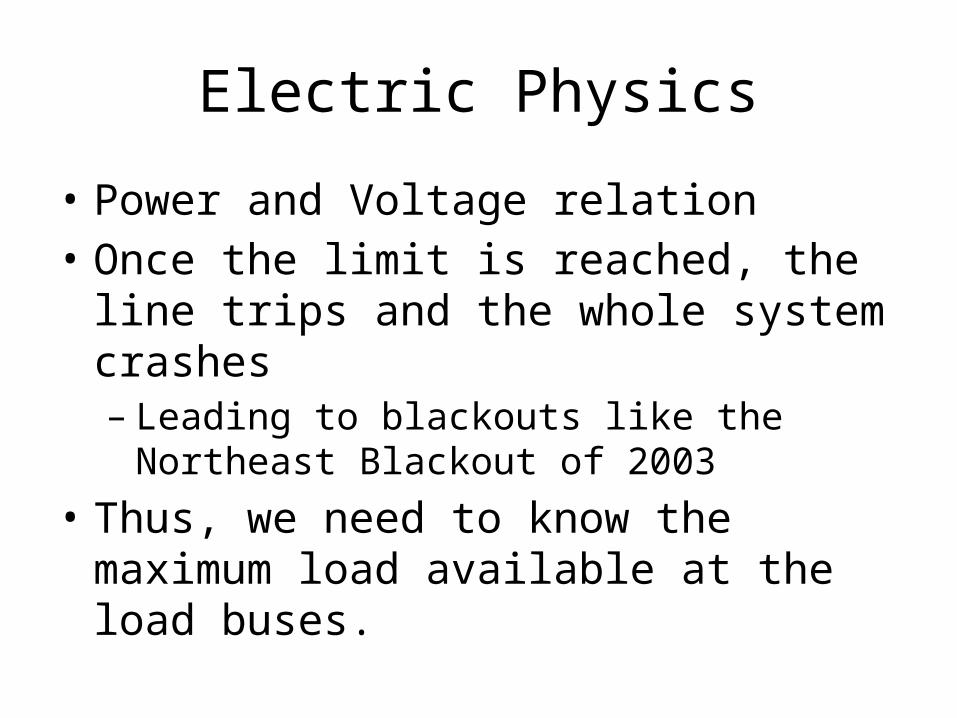
Electric Physics
• Power and Voltage relation• Once the limit is reached, the line trips and
the whole system crashes– Leading to blackouts like the Northeast Blackout of
2003• Thus, we need to know the maximum load
available at the load buses.
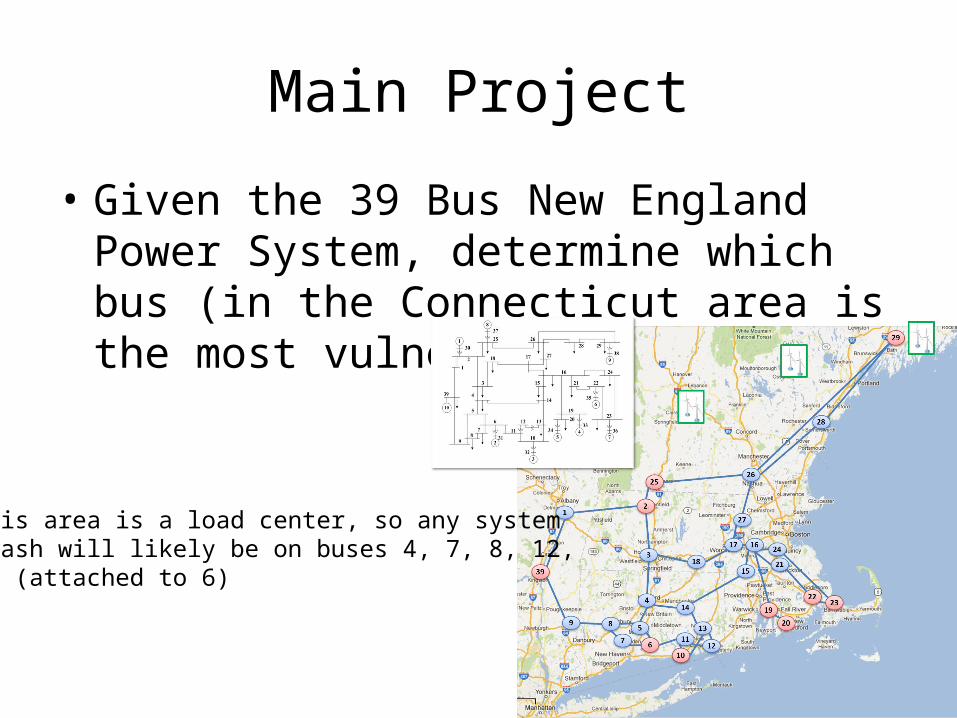
Main Project
• Given the 39 Bus New England Power System, determine which bus (in the Connecticut area is the most vulnerable.)
This area is a load center, so any systemcrash will likely be on buses 4, 7, 8, 12,31 (attached to 6)
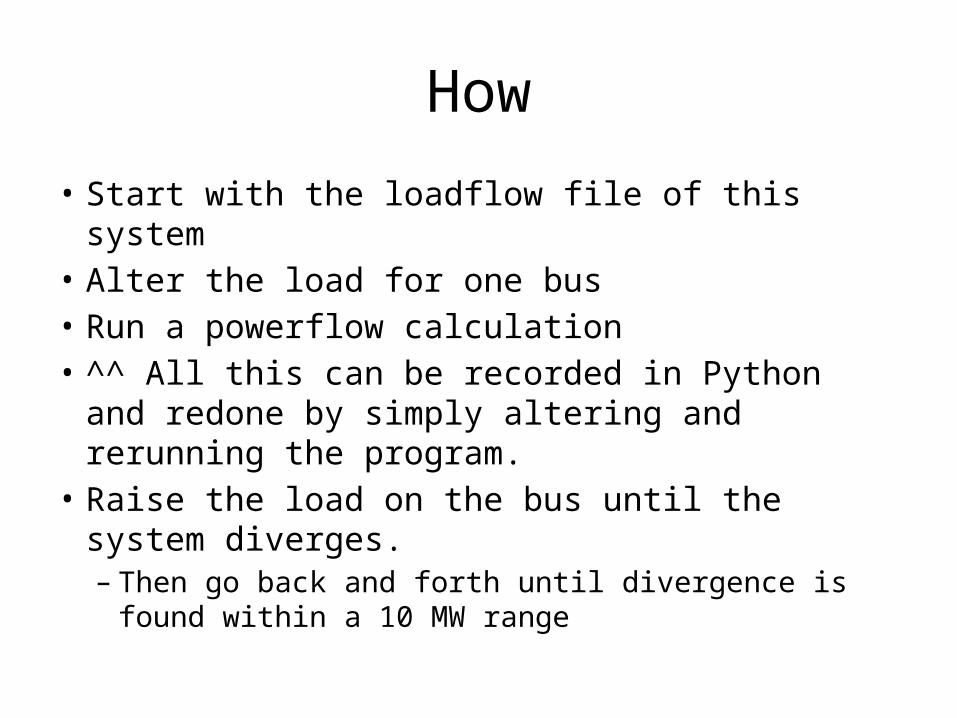
How
• Start with the loadflow file of this system• Alter the load for one bus• Run a powerflow calculation• ^^ All this can be recorded in Python and redone
by simply altering and rerunning the program.• Raise the load on the bus until the system
diverges.– Then go back and forth until divergence is found
within a 10 MW range
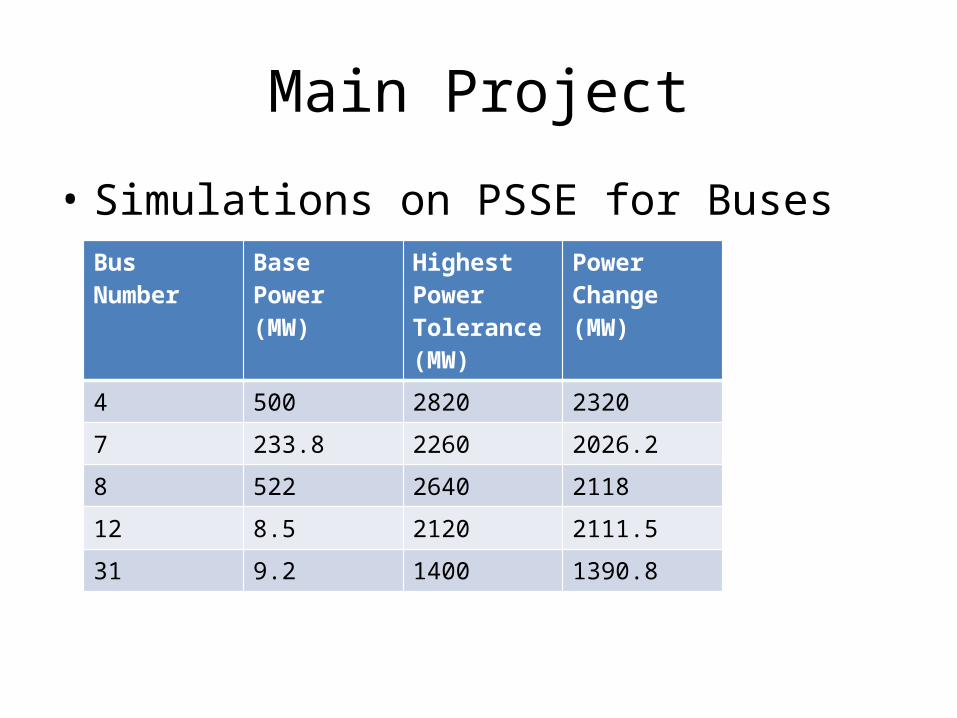
Main Project
• Simulations on PSSE for Buses Bus Number Base Power
(MW)Highest Power Tolerance (MW)
Power Change (MW)
4 500 2820 2320
7 233.8 2260 2026.2
8 522 2640 2118
12 8.5 2120 2111.5
31 9.2 1400 1390.8

WHY?
• When load in a system is increased, it generally affects the loads in proportion to the original voltage.
• SO to find the most vulnerable bus, we must increase the loads on all the buses in the system. The previous tests can give us a good starting point.
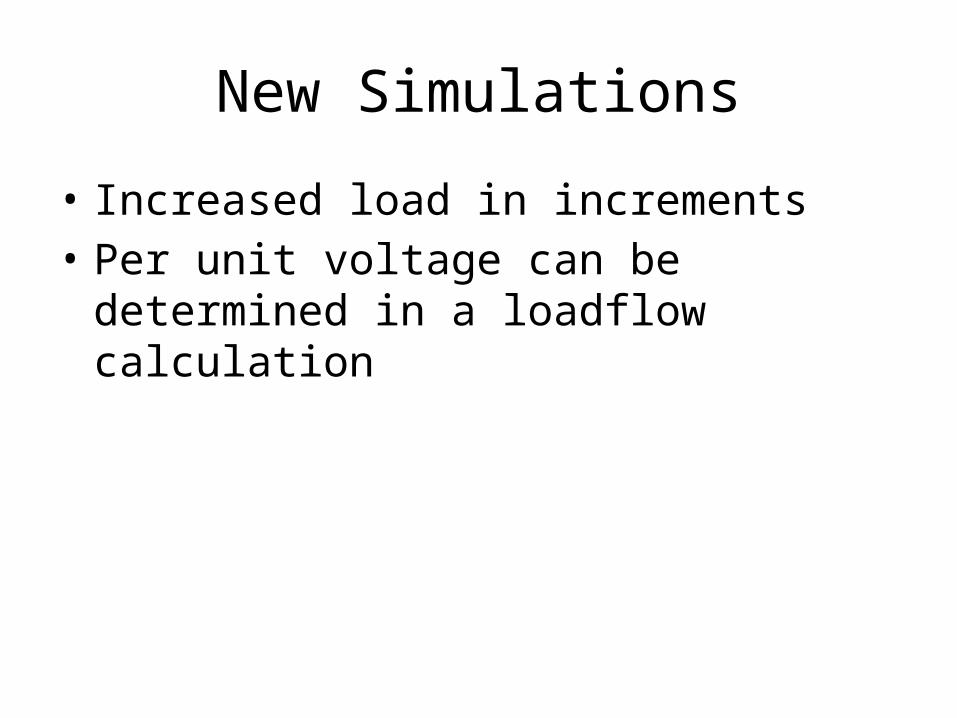
New Simulations
• Increased load in increments• Per unit voltage can be determined in a
loadflow calculation
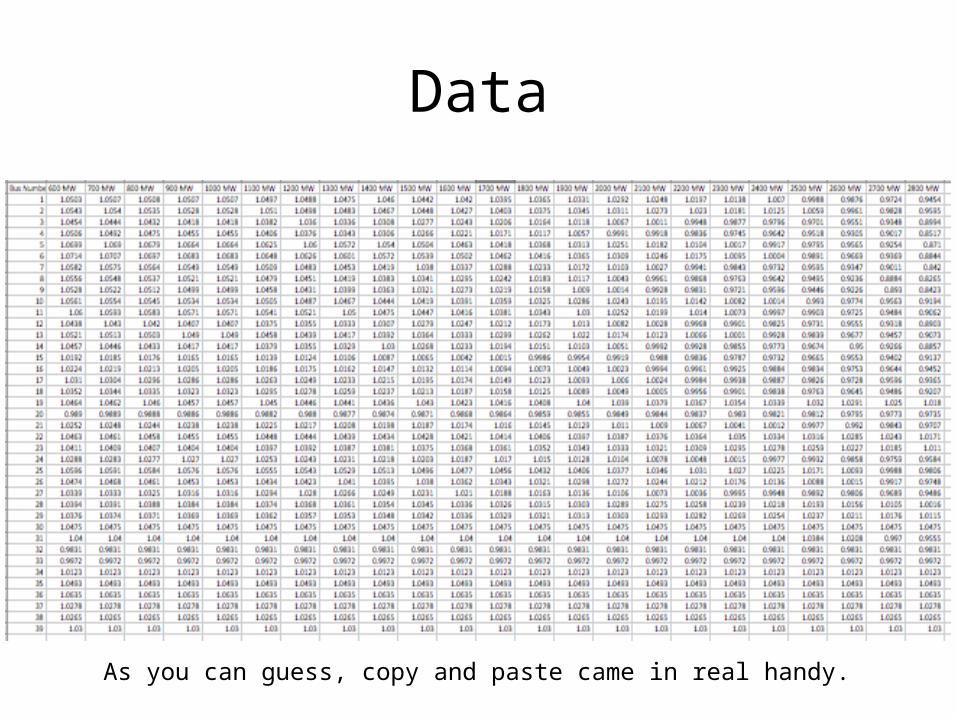
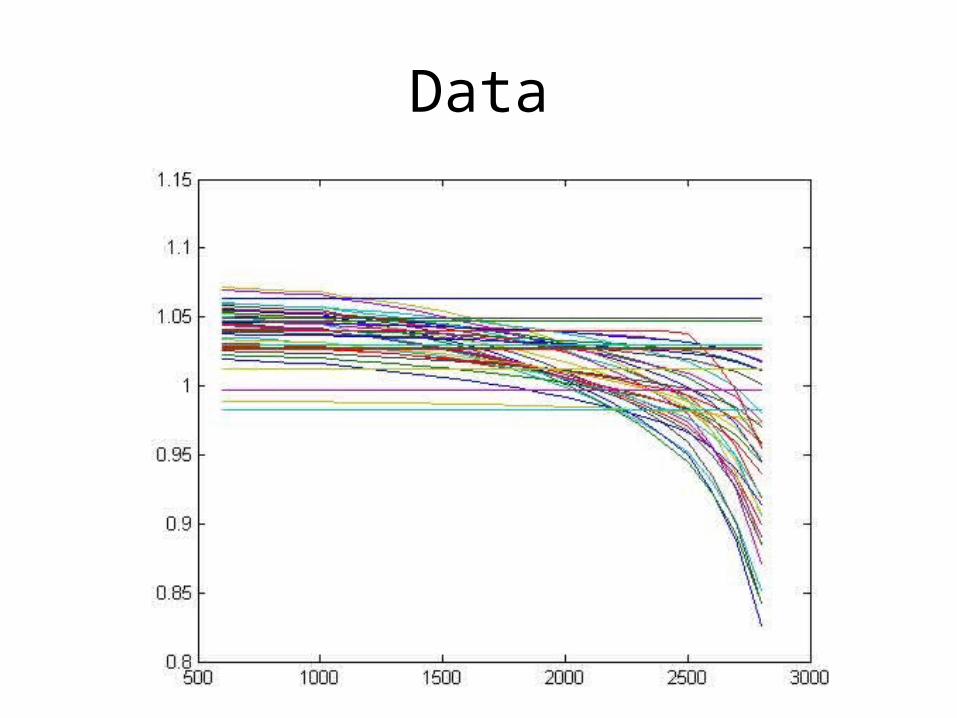
Data
As you can guess, copy and paste came in real handy.
Data
Pop Quiz: Why didn’t all of the voltages drop?
Answer: Some are generator buses! In power flow, the voltages of the generators are fixed.
Not always the case in dynamics
Conclusion
• When the power flow of the system increases, we should watch bus 31, as it has the lowest load limit.– This does not mean other should be ignored– Loads can vary independently, so another bus may
reach its limit first– This is based on a constant PQ load model. Thus, it
is a preliminary test. The load may be modeled by current, impedance, induction motor, or a combination of them.
Top Related