


Languages
Pages
Legal


Multidimensional Databases
Slides adapted from Torben Bach Pedersen and Man
Lung Yiu
Gao Cong

Aalborg University 2008 - DWDM course 2
Overview
• Cubes: Dimensions, Facts, Measures
• OLAP Queries
• Relational Implementation
• Redundancy
• Reading materials: Article on Multidimensional Databases;
Kimball ch. 6

Aalborg University 2008 - DWDM course 3
Business Dimensional Lifecycle
Technical
Architecture
Design
Product
Selection&
Installation
End-User
Application
Specification
End-User
Application
Development
Business
Requirements
Definition
DeploymentMaintenance
& Growth
Project Management
Dimensional
Modeling
Physical
Design
Data Staging
Design &
Development
Project
Planning

Aalborg University 2008 - DWDM course 4
The Multidimensional Model
• Data is divided into:
Measurement: Facts , numeric value can be aggregated
Context: Dimensions
A business process represented by a multidimensional model
consisting a fact table and some dimension tables
• Fact, e.g. sales price, sales quantity
• Dimensions describe facts
Who what when where why and how context of measurement
A sale has the dimensions Product, Store and Time
• Goal for dimensional modeling:
Surround facts with as much relevant context (dimensions) as
possible
• Cube: dimensional models stored in multidimensional
online analytical processing structures (OLAP)

Aalborg University 2008 - DWDM course 5
Why not Normalized Model?
• Normalized Model (3NF)
Aims to reduce redundancies, thus making transaction loading and
updating simple and fast
Will result in a large number of tables (could be thousands for
ERP), hard to get an overview
Normalized databases spread information
When analyzing data, the information need to be integrated again

Aalborg University 2008 - DWDM course 6
The Multidimensional Model
• One purpose
Data analysis
• Better at that purpose Understandability
Query performance
• But
Less flexible
Not suited for OLTP systems

Aalborg University 2008 - DWDM course 7
Cube Example
2000 2001
Aalborg
Copenhagen
Milk
Bread
123 127
57 45
56 67
211
Dimension
values
Cell
(aggregated measure)

Aalborg University 2008 - DWDM course 8
Cubes
• A “cube” may have many dimensions!
Theoretically no limit for the number of dimensions
Typical cubes have 4-12 dimensions
• But only 2-3 dimensions can be viewed at a time
Dimensionality reduced by queries via projection/aggregation
• A cube consists of cells
A given combination of dimension values
empty cell = no data for this combination
sparse cube: few non-empty cells
dense cube: many non-empty cells
Cubes become sparse at high dimensionality
Aalborg University 2008 - DWDM course 9
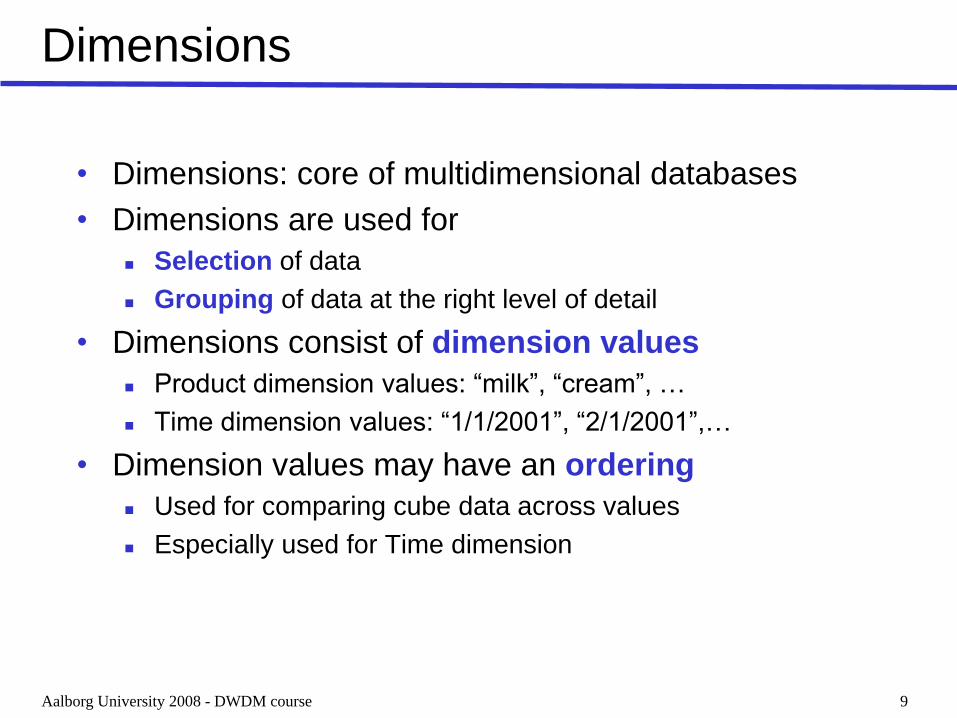
Dimensions
• Dimensions: core of multidimensional databases
• Dimensions are used for
Selection of data
Grouping of data at the right level of detail
• Dimensions consist of dimension values
Product dimension values: “milk”, “cream”, …
Time dimension values: “1/1/2001”, “2/1/2001”,…
• Dimension values may have an ordering
Used for comparing cube data across values
Especially used for Time dimension

Aalborg University 2008 - DWDM course 10
Dimensions
• Dimensions have hierarchies with levels
Typically 3-5 levels (of detail) , many to one
Dimension values are organized in a tree structure
Product: Product Type Category
Store: Store Area City County
Time: Day Month Quarter Year
Dimensions have a bottom level and a top level (ALL)
• Levels may have attributes
Simple, non-hierarchical information
Day has Workday as attribute
• Dimensions should contain much information
Time dimensions may contain holiday, season, events,…
Good dimensions have 50-100 or more attributes/levels

Aalborg University 2008 - DWDM course 11
Dimension Example
Location
City
Country USA Denmark
Berkeley New York Aalborg Copenhagen
TT
Schema Instance
We say:
“Country covers City”
“Denmark covers Aalborg”
T covers anything

Aalborg University 2008 - DWDM course 12
Dimension Example (cont’)
Time Schema
• Not necessarily total order
• Can be partial order
Day
Week
Month
Year
T
Product
Type
Category
T
Product Schema

Aalborg University 2008 - DWDM course 13
• Why we need hierarchy in dimension values?
Hint: Compare the following Product schemas and consider
possible query types that can be answered by them
• Why a dimension should contain many attributes?
E.g., Consider the attributes “holiday”, “season”, “event” in the
Time dimension. How are they useful for query operations?
Product
Type
Category
T
Product Schema A Product Schema B
Product
T

Aalborg University 2008 - DWDM course 14
Facts
• Facts represent the subject of the desired analysis
Represent a business process
The “important” in the business that should be analyzed
• A fact is most often identified via its dimension values
A fact is a non-empty cell
Some models give facts an explicit identity
• Generally a fact should
Be attached to exactly one dimension value in each dimension
Only be attached to dimension values in the bottom levels
• The measurements or metrics or facts of business processes
"monthly sales number" in the Sales business process
Aalborg University 2008 - DWDM course 15
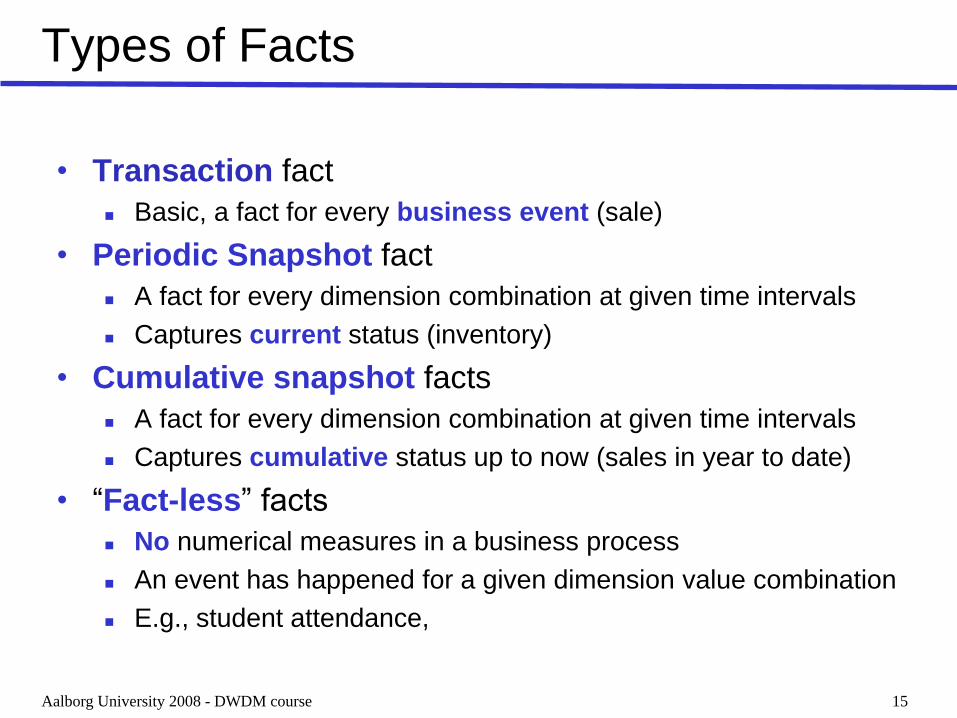
Types of Facts
• Transaction fact
Basic, a fact for every business event (sale)
• Periodic Snapshot fact
A fact for every dimension combination at given time intervals
Captures current status (inventory)
• Cumulative snapshot facts
A fact for every dimension combination at given time intervals
Captures cumulative status up to now (sales in year to date)
• “Fact-less” facts
No numerical measures in a business process
An event has happened for a given dimension value combination
E.g., student attendance,
Aalborg University 2008 - DWDM course 16
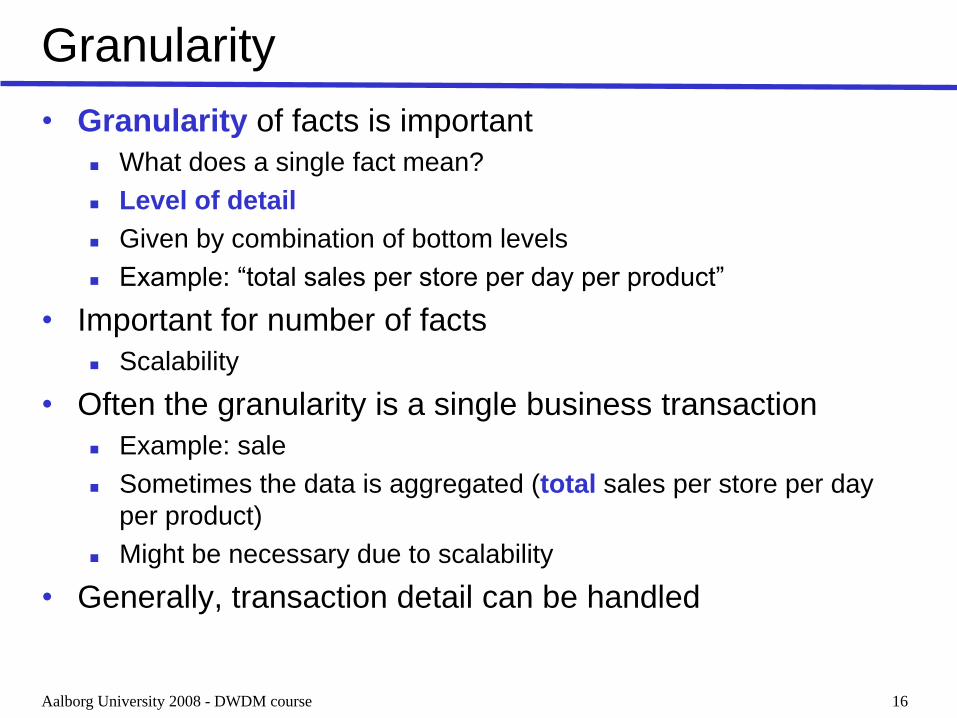
Granularity
• Granularity of facts is important
What does a single fact mean?
Level of detail
Given by combination of bottom levels
Example: “total sales per store per day per product”
• Important for number of facts
Scalability
• Often the granularity is a single business transaction
Example: sale
Sometimes the data is aggregated (total sales per store per day
per product)
Might be necessary due to scalability
• Generally, transaction detail can be handled

Aalborg University 2008 - DWDM course 17
Granularity
• All measurements in a fact table should have the same
grain
• However, a single business process many produce
measurements at different level of details
E.g. an order contains multiple items in multiple lines, but single
freight charge
Fact table
Oder Data Key (FK)
Produce Key (FK)
Ship Key (FK)
Order Number
Order Line Number
Order Line Amount
Order Line Quantity
Freight charge?

Aalborg University 2008 - DWDM course 18
Measures
• Measures represent the fact property that the users
want to study and optimize
Example: total sales price
• A measure has two components
Numerical value: (sales price)
Aggregation formula (SUM): used for aggregating/combining
a number of measure values into one
Measure value determined by dimension value combination
Measure value is meaningful for all aggregation levels
• Most multidimensional models have measures

Aalborg University 2008 - DWDM course 19
Types of Measures
Measure type Property Example Occurence
Additive Can be aggregated
over all dimensions
sales price Often occur in
event facts
Semi-additive Cannot be
aggregated over
some dimensions -
typically time
inventory Often occur in
snapshot facts
Non-additive Cannot be
aggregated over
any dimensions
average
sales price
Occur in all
types of facts

Aalborg University 2008 - DWDM course 20
Schema Documentation
• No well-defined standard
• Our own notation
T level corresponds to ALL
Record the measures
• Modeling and OLAP tools
have their own notation
Store
County
Store
dimension
Store Product
Category
Product
Product
dimension
Day
Month
Year
Time
Time
dimension
Customer
Customer
dimension
Cust. group
Customer
TTTT
Sales price
Count
Avg. sales price

Aalborg University 2008 - DWDM course 21
Analyst: “Why can’t I answer question X?”
• Possible reasons Certain measures not included in fact table
Granularity of facts too coarse
Particular dimensions not in DW
Descriptive attributes missing from dimensions
Meaning of attributes/measures deviate from the analyst’s expectation
……
• Use this as a checklist for your mini-project
Aalborg University 2008 - DWDM course 22
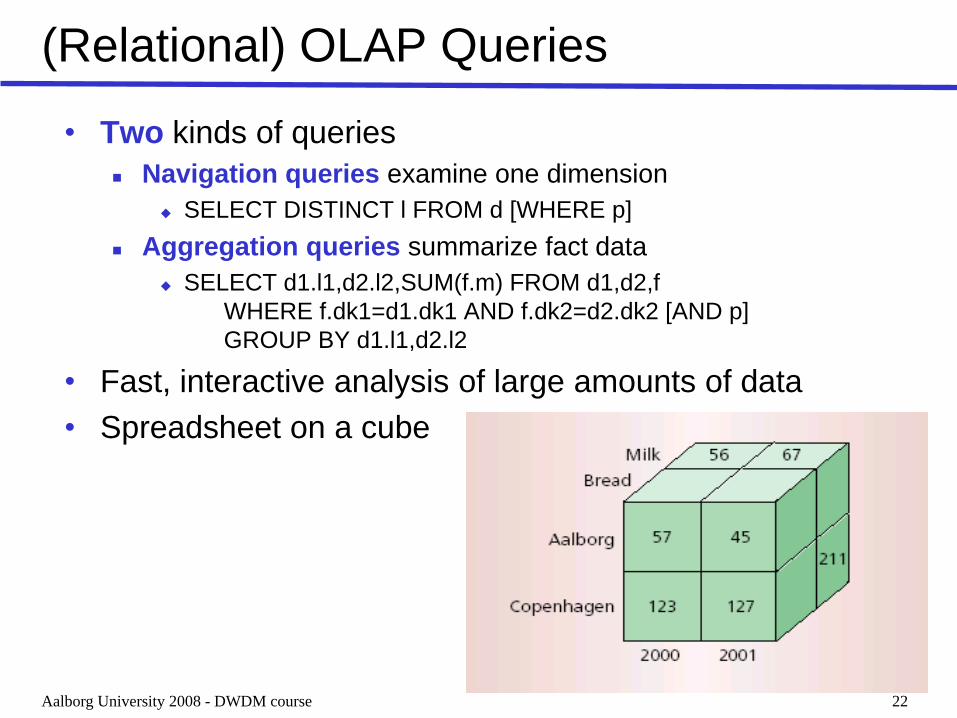
(Relational) OLAP Queries
• Two kinds of queries
Navigation queries examine one dimension
SELECT DISTINCT l FROM d [WHERE p]
Aggregation queries summarize fact data
SELECT d1.l1,d2.l2,SUM(f.m) FROM d1,d2,f
WHERE f.dk1=d1.dk1 AND f.dk2=d2.dk2 [AND p]
GROUP BY d1.l1,d2.l2
• Fast, interactive analysis of large amounts of data
• Spreadsheet on a cube

Aalborg University 2008 - DWDM course 23
OLAP Queries
Roll-up: get
overviewDrilll-down:
more detail
Starting level
(City, Year, Product)Slice/Dice:
selection,
Year=2000
Aalborg
ALL Time
Copenhagen
Bread
Milk
Aalborg
Copenhagen
Bread
Milk
01-06
/2000
07-12
/200001-06
/200107-12
/2001
Exercise: Fill in this value

Aalborg University 2008 - DWDM course 24
ROLAP
• Relational OLAP
• Data stored in relational tables
Star (or snowflake) schemas used for modeling
SQL used for querying
• Pros
Leverages investments in relational technology
Scalable (billions of facts)
Flexible, designs easier to change
New, performance enhancing techniques adapted from MOLAP
Indices, materialized views, special treatment of star schemas
• Cons
Storage use (often 3-4 times MOLAP)
Response times

Aalborg University 2008 - DWDM course 25
MOLAP
• Multidimensional OLAP
• Data stored in special multidimensional data structures
• Pros
Less storage use (“foreign keys” not stored)
Faster query response times
• Cons
Up till now not so good scalability (changing)
Less flexible, e.g., cube must be re-computed when design
changes
Does not reuse an existing investment (but often bundled with
RDBMS)
Not as open technology

Aalborg University 2008 - DWDM course 26
HOLAP
• Hybrid OLAP
• Detail data stored in relational tables (ROLAP)
• Aggregates stored in multidimensional structures (MOLAP)
• Pros
Scalable (as ROLAP)
Fast (as MOLAP)
• Cons
Complexity

Aalborg University 2008 - DWDM course 27
Relational Implementation
• The cube is often implemented in an RDBMS
• Fact table stores facts
One column for each measure
One column for each dimension (foreign key to dimension table)
Dimensions keys make up composite primary key
• Dimension table stores dimension
Why not use production keys/codes as the key?
E.g., product dimension, production code: AABC1234
E.g., customer dimension, CPR number: 020208-1357
Use surrogate key (integer key column)
For Extract-Transform-Load, we need to keep a mapping from
production key to surrogate key (more about this in lecture #4)

Aalborg University 2008 - DWDM course 28
Relational Implementation
• Goal for dimensional modeling: surround the facts with
as much context (dimensions) as we can
• Granularity of the fact table is important
What does one fact table row represent?
Important for the size of the fact table
Often corresponding to a single business transaction (sale)
But it can be aggregated (sales per product per day per store)
• Some properties
Many-to-one relationship from fact to dimension
Many-to-one relationships from lower to higher levels in the
hierarchies

Aalborg University 2008 - DWDM course 29
Relational Design
• One completely de-normalized table
Bad: inflexibility, storage use, bad performance, slow update
• Star schemas
• Snowflake schemas
Product Type Category Store City County Day Month Year Sales
Top Beer Beverage Trøjborg Århus Århus 25 Maj 1997 5.75
Product Store Time

Aalborg University 2008 - DWDM course 30
Star Schema Example
ProductId StoreId TimeId Sale
1 1 1 5.75
ProductID Product Type Category
1 Top Beer Beverage
StoreID Store City County
1 Trøjborg Århus Århus
TimeID Day Month Year
1 25. Maj 1997
• Star schemas
One fact table
De-normalized dimension tables
One column per level/attribute

Aalborg University 2008 - DWDM course 31
Snow-flake Schema Example
ProductId StoreId TimeId Sale
1 1 1 5.75
ProductID Product TypeID
1 Top 1
StoreID Store CityID
1 Trøjborg 1
TimeID Day MonthID
1 25. 1
CityID City CountyId
1 Århus 1
TypeID Type CategoryID
1 Beer 1
MonthID Month YearID
1 May 1
• Snowflake schemas
Dimensions are normalized
One dimension table per level
Each dimension table has
integer key, level name, and
one column per attribute

Aalborg University 2008 - DWDM course 32
• Suppose the original Store hierarchy A is replaced by B
• Discuss the major change to the previous examples of
Star Schema and Snow-flake Schema
Store
City
County
T
Store Schema A Store Schema B
Store
City
County
Country
T

Aalborg University 2008 - DWDM course 33
Star vs Snow-flake
• Star Schemas+ Simple and easy overview ease-of-use
+ Relatively flexible
+ Dimension tables often relatively small
+ “Recognized” by many RDBMSes -> good performance
- Hierarchies are ”hidden” in the columns
- Dimension tables are de-normalized
• Snow flake schemas+ Hierarchies are made explicit/visible
+ Very flexible
+ Dimension tables use less space
- Harder to use due to many joins
- Worse performance

Aalborg University 2008 - DWDM course 34
Redundancy in DW
• Only very little redundancy in fact tables
The same fact data only stored in one fact table
• Redundancy is mostly in dimension tables
Star dimension tables have redundant entries for the higher levels
• Redundancy problems?
Inconsistent data – the central load process helps with this
Update time – the DW is optimized for querying, not updates
Space use: dimension tables typically take up less than 5% of DW
• So: controlled redundancy is good
Up to a certain limit

Aalborg University 2008 - DWDM course 35
Case Study: Grocery Store
• Stock Keeping Units (SKUs)
• Universal Product Codes (UPCs)
• Point Of Sale (POS) system
• Stores
• Promotions

Aalborg University 2008 - DWDM course 36
DW Design Steps
• Choose the business process(es) to model
Sales
• Choose the granularity of the business process
SKU by Store by Promotion by Day
Low granularity is needed
Are individual transactions necessary/feasible?
• Choose the dimensions
Time, Store, Promotion, Product
• Choose the measures
Dollar_sales, unit_sales, dollar_cost, customer_count
• Resisting normalization and preserving browsing
Flat dimension tables makes browsing easy and fast

Aalborg University 2008 - DWDM course 37
The Grocery Store Dimensions
• Time dimension
Explicit time dimension is needed (events, holidays,..)
• Product dimension
Six-level hierarchy allows drill-down/roll-up
Many descriptive attributes (often more than 50)
• Store dimension
Many descriptive attributes
• Promotion dimension
Example of a causal dimension
Used to see if promotions work/are profitable
Ads, price reductions, end-of-aisle displays, coupons

Aalborg University 2008 - DWDM course 38
The Grocery Store Measures
• All additive across all dimensions Dollar_sales
Unit_sales
Dollar_cost
• Gross profit (derived) Computed from sales and cost
Additive
• Gross margin (derived) Computed from gross profit and sales
Non-additive across all dimensions
• Customer_count Additive across time, promotion, and store
Non-additive across product. Why?
Semi-additive

Aalborg University 2008 - DWDM course 39

Aalborg University 2008 - DWDM course 40
Data Warehouse Size
• Estimated number of fact records: 730*300*3000*1 = 657,000,000
Time dimension: 2 years = 730 days
Store dimension: 300 stores reporting each day
Product dimension: 30,000 products, only 3000 sell per day
Promotion dimension: 5000 combinations, but a product only appears in one combination per day
• Total data warehouse size: 657,000,000 * 8 fields * 4 bytes = 21 GB
Number of fields: 4 key + 4 fact = 8 fields
Assuming sizes of dimensions negligible
• Small size (by today’s standard), feasible to store at transaction level detail
• At the end of the mini-project, try to figure out the size of your relational DW
In your case, the number of fact records can be easily found, without estimation

Aalborg University 2008 - DWDM course 41
Summary
• Cubes: Dimensions, Facts, Measures
• OLAP Queries
• Relational Implementation
Star schema vs Snowflake schema
• Redundancy

Aalborg University 2008 - DWDM course 42
MS Analysis Services (Demo. Session)
• Business Intelligence Development Studio: demo Build a relational DW
Build a “test cube” based on data you type, the final cube must be rebuilt after completing the ETL process
1) Create an Analysis Services project
2) New data source
3) New data source view1) Star schema, define primary/foreign keys
2) Explore data (check if your data is OK)
4) Create dimension(s)1) Build the hierarchy
2) Browse the dimension
5) Create a cube1) Browse/query the cube
Top Related