


Languages
Pages
Legal


Muhammad AfaaqMuhammad Afaaq
MC090400284 MC090400284
MBA MBA
(Finance)(Finance)
Finance (FINI-619)Finance (FINI-619)
Internship report on Internship report on
National Bank of PakistanNational Bank of Pakistan
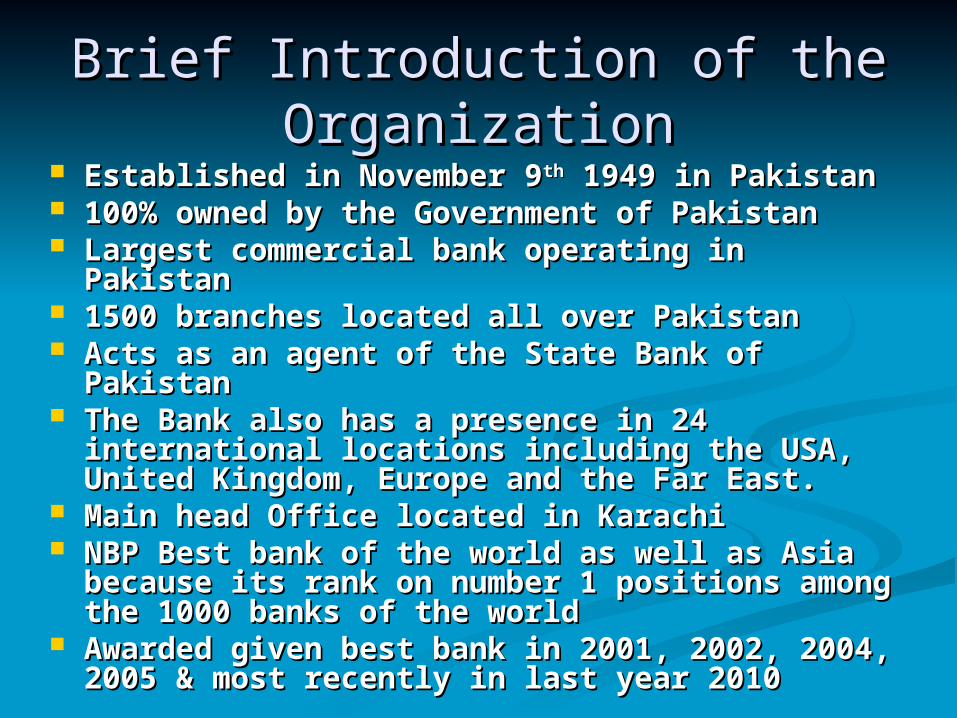
Brief Introduction of the Brief Introduction of the OrganizationOrganization
Established in November 9Established in November 9thth 1949 in Pakistan 1949 in Pakistan 100% owned by the Government of Pakistan100% owned by the Government of Pakistan Largest commercial bank operating in Pakistan Largest commercial bank operating in Pakistan 1500 branches located all over Pakistan1500 branches located all over Pakistan Acts as an agent of the State Bank of PakistanActs as an agent of the State Bank of Pakistan The The Bank also has a presence in 24 international locations Bank also has a presence in 24 international locations
including the USA, United Kingdom, Europe and the Far including the USA, United Kingdom, Europe and the Far East.East.
Main head Office located in KarachiMain head Office located in Karachi NBP Best bank of the world as well as Asia because its NBP Best bank of the world as well as Asia because its
rank on number 1 positions among the 1000 banks of the rank on number 1 positions among the 1000 banks of the worldworld
Awarded given best bank in 2001, 2002, 2004, 2005 & most Awarded given best bank in 2001, 2002, 2004, 2005 & most recently in last year 2010recently in last year 2010

Business volumeBusiness volume In MillionsIn Millions
Description 2006 2007 2008 2009 2010Profit before tax
26,311 28,061 23,001 21,300 24,415
Profit after tax
17,022 19,034 15,459 17,562 17,563
Shareholder’s equity
353,045 69,271 81,367 94,142 103,762
Advances – net
316,110 340,319 412,987 475,243 477,507
Total Assets 635,133 762,194 817,758 944,583 1,035,025
Deposits 501,672 591,907 624,939 727,465 832,152Investments 139,947 211,146 170,822 217,643 301,324
Earnings per share
12.65 14.15 11.49 13.05 13.05

CompetitorsCompetitors MCB Bank LimitedMCB Bank Limited Habib Bank LimitedHabib Bank Limited United Bank LimitedUnited Bank Limited Allied Bank LimitedAllied Bank Limited Bank Alfalah LimitedBank Alfalah Limited Soneri Bank Limited Soneri Bank Limited Askari Bank LimitedAskari Bank Limited Bank of PunjabBank of Punjab First Women BankFirst Women Bank

Organizational Hierarchy Organizational Hierarchy ChartChart

Training ProgramTraining Program Task assign to me in Account Opening Task assign to me in Account Opening
DepartmentDepartment
• Account Opening Forms fillingAccount Opening Forms filling• Customer GuidanceCustomer Guidance• Opened Different types of AccountsOpened Different types of Accounts
Task assign to me in Bill Collection DepartmentTask assign to me in Bill Collection Department
• Collecting utilities billsCollecting utilities bills• Observing due date and what’s the amount collect in due dateObserving due date and what’s the amount collect in due date

Training ProgramTraining Program Task assign to me in Cash DepartmentTask assign to me in Cash Department
• Observing the function of bank payment and receiptObserving the function of bank payment and receipt• Observing government receipt and payment.Observing government receipt and payment.
Task assign to me in Credit DepartmentTask assign to me in Credit Department
• Observing requirements to get loanObserving requirements to get loan• Observing bank charges interest against loanObserving bank charges interest against loan

Training ProgramTraining Program
Task assign to me in Remittance Task assign to me in Remittance DepartmentDepartment
• Learn about the categories of remittance department Learn about the categories of remittance department • Fill demand draftFill demand draft• Pay order Pay order • LC LC

Ratio AnalysisRatio Analysis
1. Liquidity ratio1. Liquidity ratio
Firm ability to meet its current obligationsFirm ability to meet its current obligations
It includes current ratio, Acid test ratio, It includes current ratio, Acid test ratio, Working capital ratioWorking capital ratio

Current RatioCurrent Ratio
Ratio Ratio AnalysisAnalysis
National bank of PakistanNational bank of Pakistan
Current Ratio= Current Assets/ Current liabilities Current Ratio= Current Assets/ Current liabilities
Year 2008Year 2008 Year 2009Year 2009 Year 2010Year 2010
Current Current RatioRatio
584,977,140 584,977,140 / / 682,905,461 682,905,461 ==0.86 Times0.86 Times
645,064,165 645,064,165 / / 725,293,720 725,293,720 = = 0.89 Times0.89 Times
693,463,983 693,463,983 / / 867,626,367 867,626,367 = = 0.80 Times0.80 Times
0.86
0.89
0.8
0.75 0.8 0.85 0.9
2008
2009
2010
Current Ratio
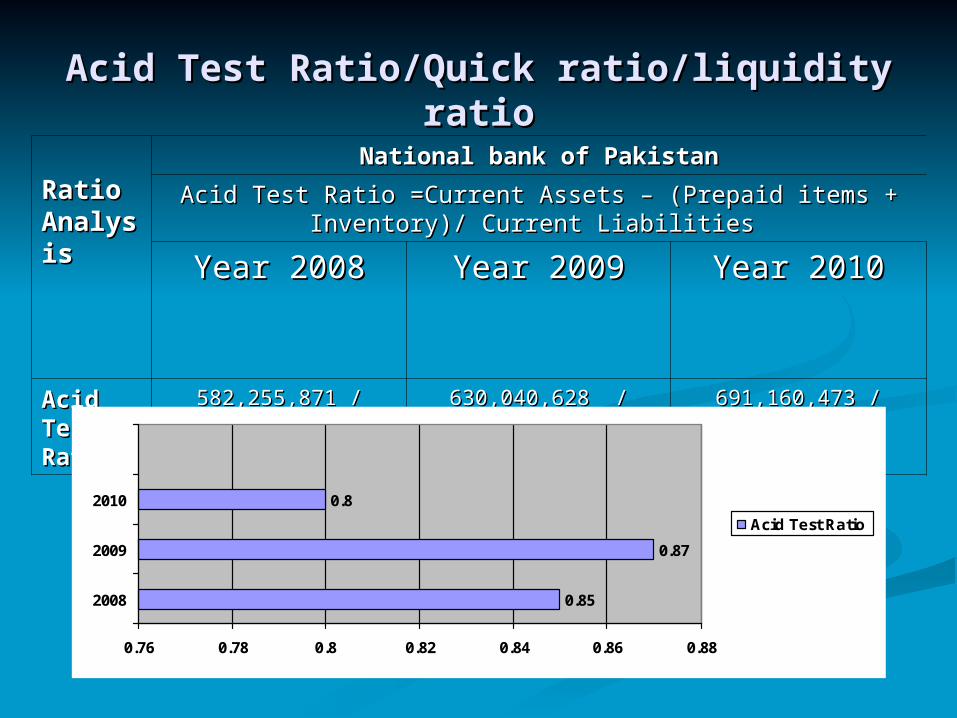
Acid Test Ratio/Quick ratio/liquidity Acid Test Ratio/Quick ratio/liquidity ratioratio
Ratio Ratio AnalysisAnalysis
National bank of PakistanNational bank of Pakistan
Acid Test Ratio =Current Assets – (Prepaid items + Inventory)/ Current Acid Test Ratio =Current Assets – (Prepaid items + Inventory)/ Current Liabilities Liabilities
Year 2008Year 2008 Year 2009Year 2009 Year 2010Year 2010
Acid Test Acid Test RatioRatio
582,255,871 582,255,871 / / 682,905,461 682,905,461 ==0.85 times0.85 times
630,040,628 630,040,628 / / 725,293,720 725,293,720 = = 0.87 times0.87 times
691,160,473 691,160,473 / / 867,626,367 867,626,367 = = 0.80 times0.80 times
0.85
0.87
0.8
0.76 0.78 0.8 0.82 0.84 0.86 0.88
2008
2009
2010
Acid Test Ratio

Working Capital RatioWorking Capital Ratio
Ratio Ratio AnalysisAnalysis
National bank of PakistanNational bank of Pakistan
Net Working Capital = Current Assets - Current LiabilitiesNet Working Capital = Current Assets - Current Liabilities
Year 2008Year 2008 Year 2009Year 2009 Year 2010Year 2010
Net Working Net Working Capital Capital Ratio Ratio
584,977,140 -682,905,461 584,977,140 -682,905,461 = = -97,928,321-97,928,321
645,064,165 645,064,165 --725,293,720725,293,720 = = -80,229,555-80,229,555
693,463,983 693,463,983 --867,626,367 867,626,367 = = -174,162,384-174,162,384
-97,928,321
-80,229,555
-174,162,384
-200,000,000
-150,000,000
-100,000,000
-50,000,000
0
2008
2009
2010Working Capitalratio
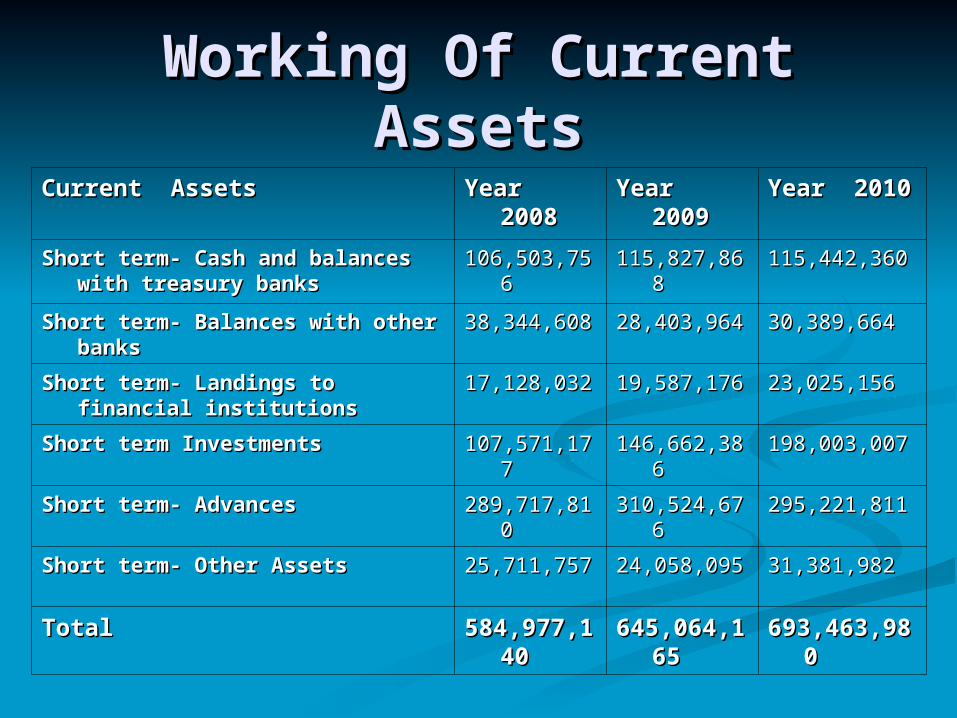
Working Of Current Working Of Current AssetsAssets
Current AssetsCurrent Assets Year 2008Year 2008 Year 2009Year 2009 Year 2010Year 2010
Short term- Cash and balances with Short term- Cash and balances with treasury bankstreasury banks
106,503,756106,503,756 115,827,868115,827,868 115,442,360115,442,360
Short term- Balances with other banksShort term- Balances with other banks 38,344,60838,344,608 28,403,96428,403,964 30,389,66430,389,664
Short term- Landings to financial Short term- Landings to financial institutionsinstitutions
17,128,03217,128,032 19,587,17619,587,176 23,025,15623,025,156
Short term InvestmentsShort term Investments 107,571,177107,571,177 146,662,386146,662,386 198,003,007198,003,007
Short term- AdvancesShort term- Advances 289,717,810289,717,810 310,524,676310,524,676 295,221,811295,221,811
Short term- Other AssetsShort term- Other Assets 25,711,75725,711,757 24,058,09524,058,095 31,381,98231,381,982
TotalTotal 584,977,140584,977,140 645,064,165645,064,165 693,463,980693,463,980

Working Of Current LiabilitiesWorking Of Current Liabilities
Current LiabilitiesCurrent Liabilities Year 2008Year 2008 Year 2009Year 2009 Year 2010Year 2010
Short Term- Bill PayableShort Term- Bill Payable 10,219,06110,219,061 10,621,16910,621,169 8,006,6318,006,631
Short Term- BorrowingsShort Term- Borrowings 37,409,28837,409,288 37,057,18937,057,189 17,154,13117,154,131
Short Term- Deposits and other accountsShort Term- Deposits and other accounts 614,538,859614,538,859 655,031,896655,031,896 816,172,861816,172,861
Short Term- Liabilities against assets subject to Short Term- Liabilities against assets subject to finance leasefinance lease
1651716517 20,40820,408 43,96343,963
Short Term- Other liabilitiesShort Term- Other liabilities 20,721,73620,721,736 22,563,05822,563,058 26,248,78226,248,782
TotalTotal 682,905,461682,905,461 725,293,720725,293,720 867,626,368867,626,368
Leverage RatiosLeverage RatiosLeverage ratios measure the degree of Leverage ratios measure the degree of
protection of suppliers of long term fundsprotection of suppliers of long term funds

Times Interest EarnedTimes Interest EarnedMeasure firm ability to meet interest payment Measure firm ability to meet interest payment
on debton debt
Ratio Ratio AnalysisAnalysis
National bank of PakistanNational bank of Pakistan
Time Interest earned ratio = Time Interest earned ratio = Earning before interest & tax (EBIT)Earning before interest & tax (EBIT)
Interest expensesInterest expenses
Year 2008Year 2008 Year 2009Year 2009 Year 2010Year 2010
Time Interest Time Interest earned ratioearned ratio
46,885,766 46,885,766 / / 23,884,768 23,884,768
= = 1.96 times1.96 times
61,789,822 61,789,822 / / 40,489,649 40,489,649 = = 1.53 times1.53 times
69,665,595 69,665,595 / / 45,250,476 45,250,476 = = 1.54 times1.54 times
1.96
1.52
1.53
0 0.5 1 1.5 2 2.5
2008
2009
2010
Times Interest Earned

Working Of EBITWorking Of EBIT
EBITEBIT Year 2008Year 2008 Year 2009Year 2009 Year 2010Year 2010
Profit Before TaxProfit Before Tax 23,000,99823,000,998 21,300,17321,300,173 24,415,11924,415,119
Add: Interest/ mark-up expensesAdd: Interest/ mark-up expenses 23,884,76823,884,768 40,489,64940,489,649 45,250,47645,250,476
TotalTotal 46,885,76646,885,766 61,789,82261,789,822 69,665,59569,665,595
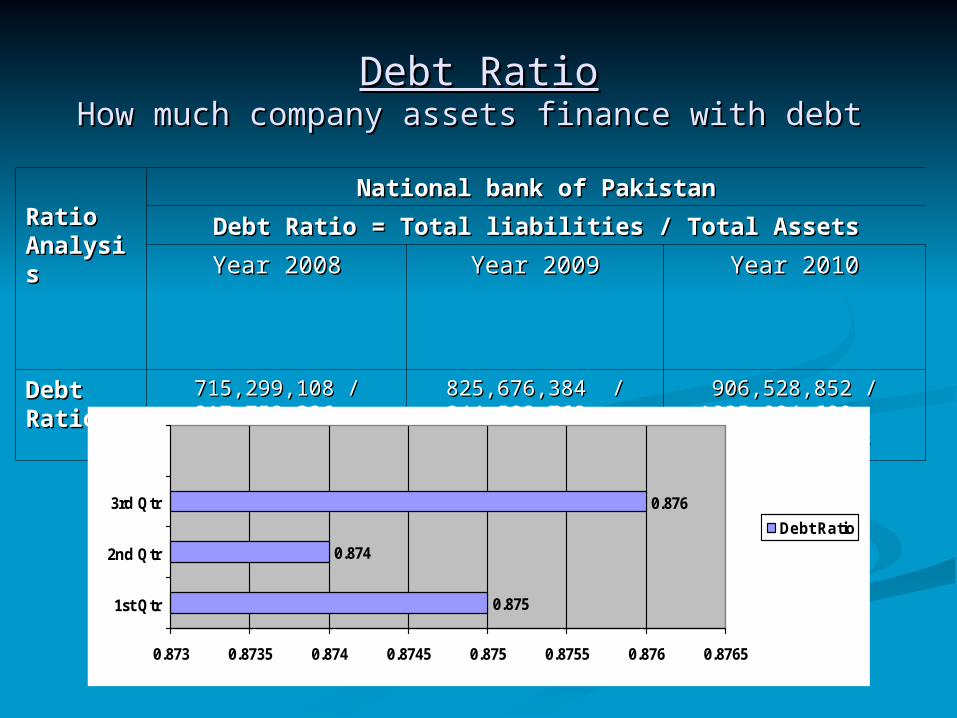
Debt RatioDebt RatioHow much company assets finance with debt How much company assets finance with debt
Ratio Ratio AnalysisAnalysis
National bank of PakistanNational bank of Pakistan
Debt Ratio = Total liabilities / Total AssetsDebt Ratio = Total liabilities / Total Assets
Year 2008Year 2008 Year 2009Year 2009 Year 2010Year 2010
Debt RatioDebt Ratio 715,299,108 715,299,108 / / 817,758,326 817,758,326 = = 0.875 times0.875 times
825,676,384 825,676,384 / / 944,582,762 944,582,762
= = 0.874 times0.874 times
906,528,852 906,528,852 / / 1035,024,680 1035,024,680
= = 0.876 times0.876 times
0.875
0.874
0.876
0.873 0.8735 0.874 0.8745 0.875 0.8755 0.876 0.8765
1st Qtr
2nd Qtr
3rd Qtr
Debt Ratio

Working Of Total DebtWorking Of Total Debt
Total DebtTotal Debt Year 2008Year 2008 Year 2009Year 2009 Year 2010Year 2010
Bill PayableBill Payable 10,219,06110,219,061 10,621,16910,621,169 8,006,6308,006,630
BorrowingsBorrowings 40,458,92640,458,926 45,278,13845,278,138 20,103,59020,103,590
Deposits and other accountsDeposits and other accounts 624,939,016624,939,016727,464,825727,464,825 832,151,888832,151,888
Sub-ordinated loansSub-ordinated loans ---------------------- ---------- ---------- ------------------
Liabilities against assets subject to Liabilities against assets subject to finance leasefinance lease
25,27425,274
42,62942,629 106,704106,704
Other liabilitiesOther liabilities 39,656,83139,656,831 42,269,62342,269,623 46,160,04046,160,040
Deferred tax liabilitiesDeferred tax liabilities ------------------ -------------------- ----------------
TotalTotal 715,299,108715,299,108 825,676,384825,676,384 906,528,852906,528,852

Working Of Total AssetsWorking Of Total Assets
Total AssetsTotal Assets Year 2008Year 2008 Year 2009Year 2009 Year 2010Year 2010
Cash and balances with treasury Cash and balances with treasury banksbanks
106,503,756106,503,756 115,827,868115,827,868 115,442,360115,442,360
Balances with other banksBalances with other banks 38,344,60838,344,608 28,405,56428,405,564 30,389,66430,389,664
Landings to financial institutionsLandings to financial institutions 17,128,03217,128,032 19,587,17619,587,176 23,025,15623,025,156
InvestmentsInvestments 170,822,491170,822,491 217,642,822217,642,822 301,323,804301,323,804
AdvancesAdvances 412,986,865412,986,865 475,243,431475,243,431 477,506,564477,506,564
Operating fixed assetsOperating fixed assets 24,217,65524,217,655 25,147,19225,147,192 26,888,22626,888,226
Deferred tax assets-netDeferred tax assets-net 3,204,5723,204,572 3,062,2713,062,271 6,952,6666,952,666
Other AssetsOther Assets 44,550,34744,550,347 59,666,43859,666,438 53,496,24053,496,240
TotalTotal 817,758,326817,758,326 944,582,762944,582,762 1,035,024,6801,035,024,680
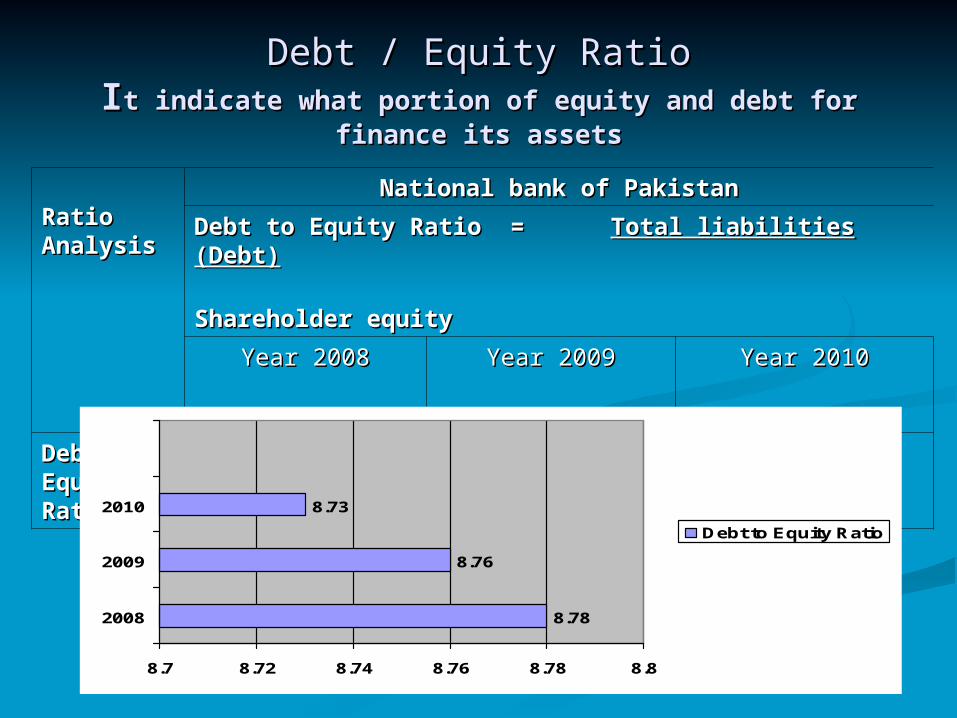
Debt / Equity RatioDebt / Equity RatioIIt indicate what portion of equity and debt for finance t indicate what portion of equity and debt for finance
its assetsits assets
Ratio Ratio AnalysisAnalysis
National bank of PakistanNational bank of Pakistan
Debt to Equity Ratio = Debt to Equity Ratio = Total liabilities (Debt)Total liabilities (Debt)
Shareholder equityShareholder equity
Year 2008Year 2008 Year 2009Year 2009 Year 2010Year 2010
Debt to Debt to Equity RatioEquity Ratio
715,299,108 715,299,108 / / 81,497,458 81,497,458
= = 8.78 times8.78 times
825,676,384 825,676,384 / / 94,265,853 94,265,853 = = 8.76 times8.76 times
906,528,852 906,528,852 / / 103,880,048 103,880,048
= = 8.73 times8.73 times
8.78
8.76
8.73
8.7 8.72 8.74 8.76 8.78 8.8
2008
2009
2010
Debt to Equity Ratio
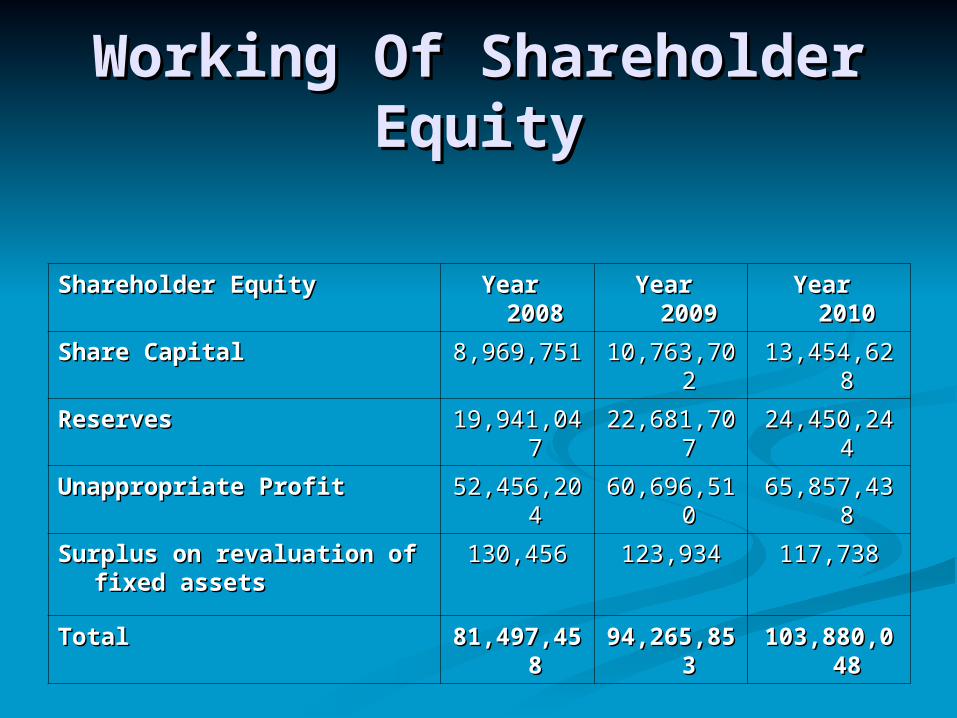
Working Of Shareholder Working Of Shareholder EquityEquity
Shareholder EquityShareholder Equity Year 2008Year 2008 Year 2009Year 2009 Year 2010Year 2010
Share CapitalShare Capital 8,969,7518,969,751 10,763,70210,763,702 13,454,62813,454,628
ReservesReserves 19,941,04719,941,047 22,681,70722,681,707 24,450,24424,450,244
Unappropriate ProfitUnappropriate Profit 52,456,20452,456,204 60,696,51060,696,510 65,857,43865,857,438
Surplus on revaluation of fixed Surplus on revaluation of fixed assetsassets
130,456130,456 123,934123,934 117,738117,738
TotalTotal 81,497,45881,497,458 94,265,85394,265,853 103,880,048103,880,048
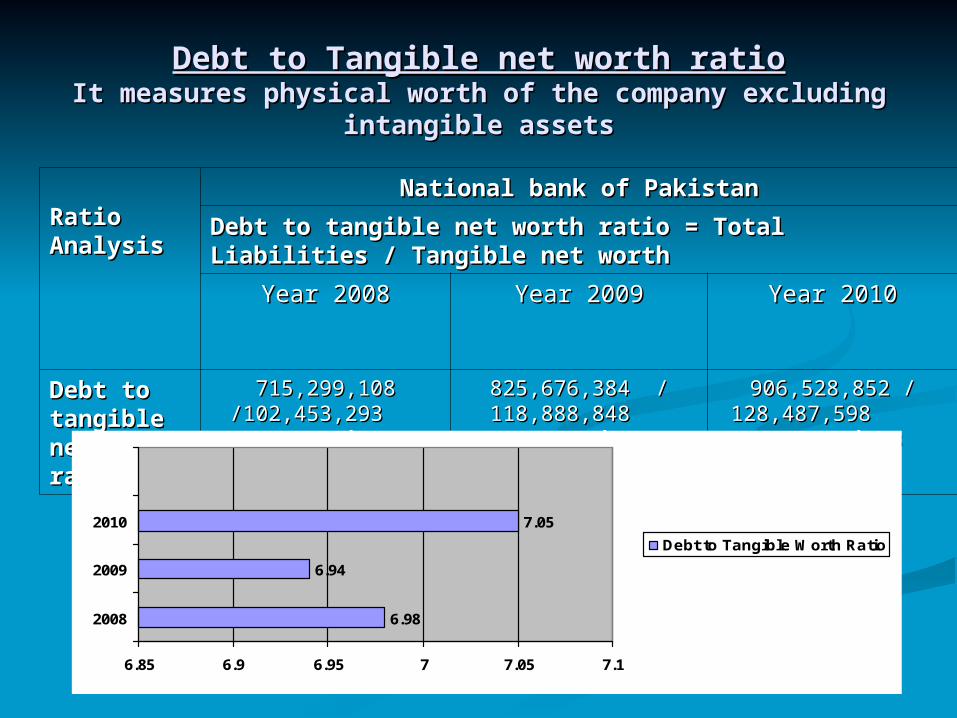
Debt to Tangible net worth ratioDebt to Tangible net worth ratioIt measures physical worth of the company excluding It measures physical worth of the company excluding
intangible assetsintangible assets
Ratio Ratio AnalysisAnalysis
National bank of PakistanNational bank of Pakistan
Debt to tangible net worth ratio = Total Liabilities / Tangible net worthDebt to tangible net worth ratio = Total Liabilities / Tangible net worth
Year 2008Year 2008 Year 2009Year 2009 Year 2010Year 2010
Debt to Debt to tangible net tangible net worth ratioworth ratio
715,299,108 715,299,108 //102,453,293 102,453,293
= = 6.98 times6.98 times
825,676,384 825,676,384 / / 118,888,848 118,888,848
= = 6.94 times6.94 times
906,528,852 906,528,852 / / 128,487,598 128,487,598
= = 7.05 times7.05 times
6.98
6.94
7.05
6.85 6.9 6.95 7 7.05 7.1
2008
2009
2010
Debt to Tangible Worth Ratio
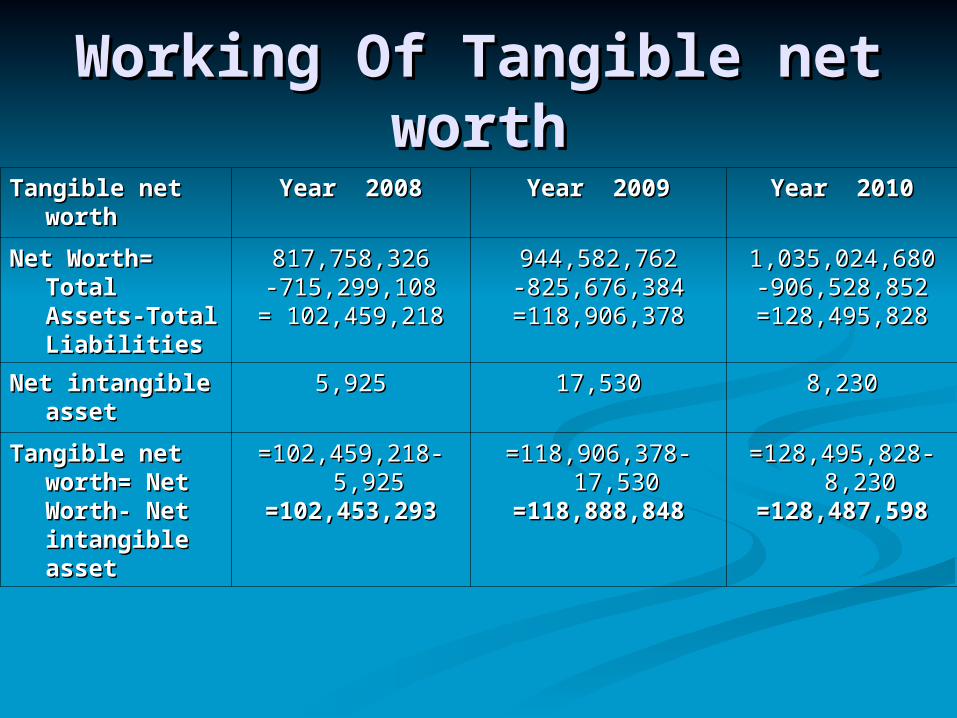
Working Of Working Of Tangible net Tangible net worthworth
Tangible net worthTangible net worth Year 2008Year 2008 Year 2009Year 2009 Year 2010Year 2010
Net Worth= Total Net Worth= Total Assets-Total Assets-Total LiabilitiesLiabilities
817,758,326817,758,326--715,299,108715,299,108= = 102,459,218102,459,218
944,582,762944,582,762--825,676,384825,676,384=118,906,378=118,906,378
1,035,024,6801,035,024,680--906,528,852906,528,852=128,495,828=128,495,828
Net intangible assetNet intangible asset 5,9255,925 17,53017,530 8,2308,230
Tangible net worth= Tangible net worth= Net Worth- Net Net Worth- Net intangible assetintangible asset
=102,459,218- 5,925=102,459,218- 5,925=102,453,293=102,453,293
=118,906,378-17,530=118,906,378-17,530=118,888,848=118,888,848
=128,495,828-8,230=128,495,828-8,230=128,487,598=128,487,598
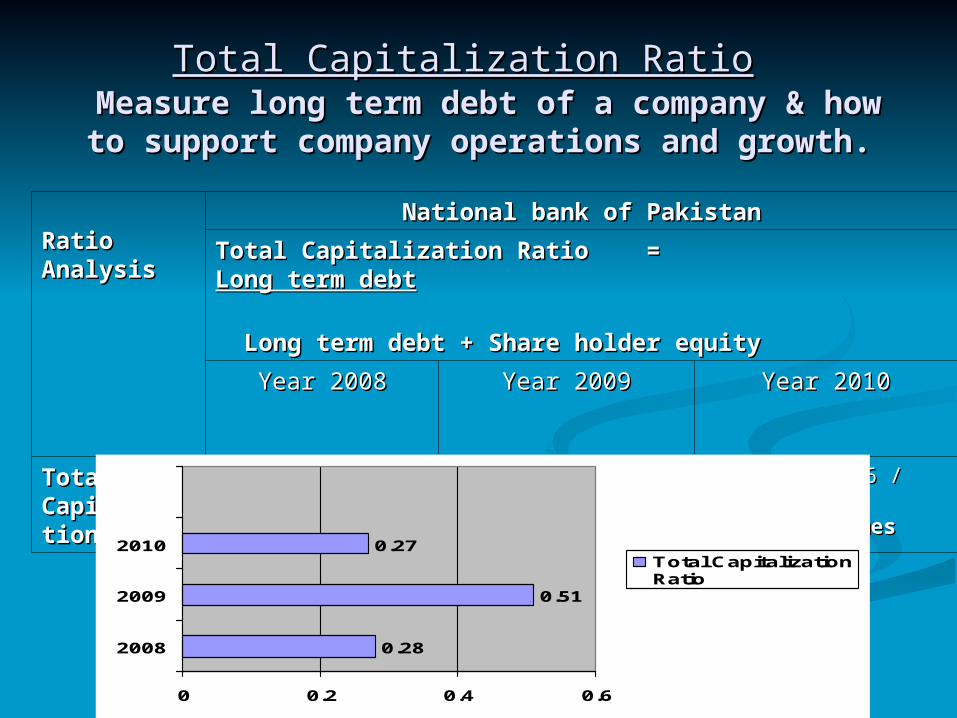
Total Capitalization RatioTotal Capitalization Ratio Measure long term debt of a company & how Measure long term debt of a company & how to support company operations and growth.to support company operations and growth.
Ratio AnalysisRatio AnalysisNational bank of PakistanNational bank of Pakistan
Total Capitalization Ratio = Total Capitalization Ratio = Long term debtLong term debt
Long term debt + Share holder equityLong term debt + Share holder equity
Year 2008Year 2008 Year 2009Year 2009 Year 2010Year 2010
Total Total Capitalization Capitalization RatioRatio
32,393,647 32,393,647 //113,891,105 113,891,105
= = 0.28 times0.28 times
100,382,664 100,382,664 / / 194,648,517 194,648,517
= = 0.52 times0.52 times
38,902,486 38,902,486 / / 142,782,534 142,782,534
= = 0.27 times 0.27 times
0.28
0.51
0.27
0 0.2 0.4 0.6
2008
2009
2010Total CapitalizationRatio

Working Of Long Term Working Of Long Term DebtDebt
Long Term DebtLong Term Debt Year 2008Year 2008 Year 2009Year 2009 Year 2010Year 2010
Long term- BorrowingsLong term- Borrowings 3,049,6383,049,638 8,220,9498,220,949 2,949,4602,949,460
Long term- Deposits and other Long term- Deposits and other accountsaccounts
10,400,15710,400,157 72,432,92972,432,929 15,979,02715,979,027
Sub-ordinated loansSub-ordinated loans - - -- --
Long term- Liabilities against assets Long term- Liabilities against assets subject to finance leasesubject to finance lease
8,7578,757 22,22122,221 62,74162,741
Long term- Other liabilitiesLong term- Other liabilities 18,935,09518,935,095 19,706,56519,706,565 19,911,25819,911,258
Deferred tax liabilitiesDeferred tax liabilities -- -- --
TotalTotal 32,393,64732,393,647 100,382,664100,382,664 38,902,48638,902,486
Profitability RatiosProfitability Ratios Profitability ratios measure the Profitability ratios measure the earning or profit ability of a firmearning or profit ability of a firm

Net Profit MarginNet Profit Margin
Ratio Ratio AnalysisAnalysis
National bank of PakistanNational bank of Pakistan
Net Profit Margin = (Net Income / Sales) *100Net Profit Margin = (Net Income / Sales) *100
Year 2008Year 2008 Year 2009Year 2009 Year 2010Year 2010
Net Profit Net Profit MarginMargin
15,458,590 15,458,590 / / 60,942,798 60,942,798
= = 25.4%25.4%
17,561,846 17,561,846 / / 77,947,697 77,947,697
= = 22.5%22.5%
17,563,214 17,563,214 / / 88,472,134 88,472,134
= = 19.9%19.9%
25.4
22.5
19.9
0 5 10 15 20 25 30
2008
2009
2010
Net Profit Margin
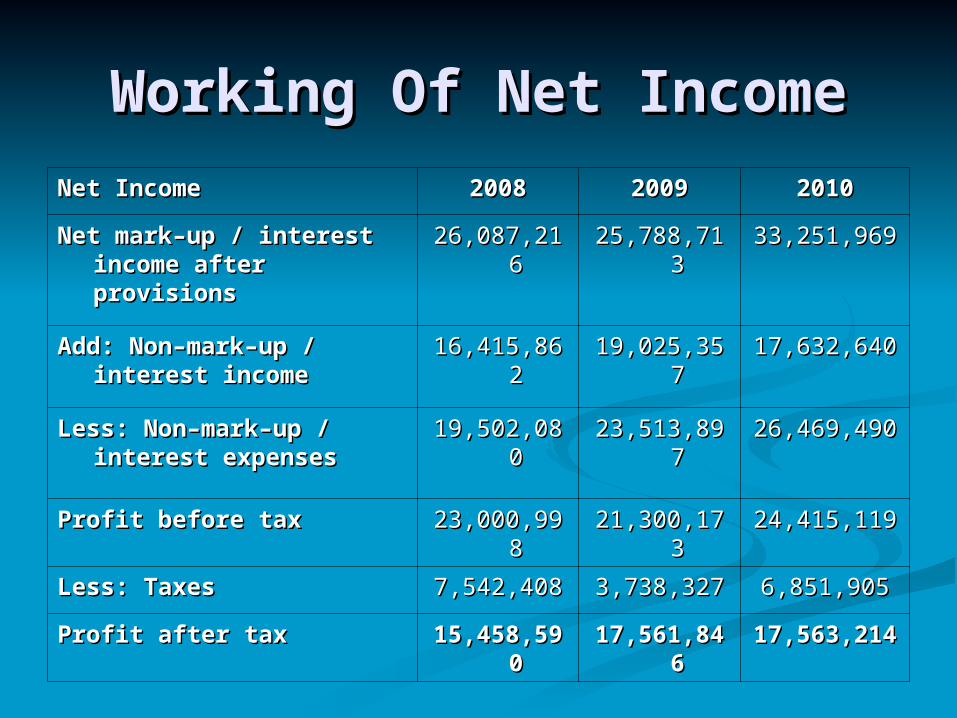
Working Of Net IncomeWorking Of Net IncomeNet IncomeNet Income 20082008 20092009 20102010
Net mark–up / interest income Net mark–up / interest income after provisionsafter provisions
26,087,21626,087,216 25,788,71325,788,713 33,251,96933,251,969
Add: Non–mark–up / interest Add: Non–mark–up / interest incomeincome
16,415,86216,415,862 19,025,35719,025,357 17,632,64017,632,640
Less: Non–mark–up / interest Less: Non–mark–up / interest expensesexpenses
19,502,08019,502,080 23,513,89723,513,897 26,469,49026,469,490
Profit before taxProfit before tax 23,000,99823,000,998 21,300,17321,300,173 24,415,11924,415,119
Less: TaxesLess: Taxes 7,542,4087,542,408 3,738,3273,738,327 6,851,9056,851,905
Profit after tax Profit after tax 15,458,59015,458,590 17,561,84617,561,846 17,563,21417,563,214

Return on AssetsReturn on Assets
Ratio Ratio AnalysisAnalysis
National bank of PakistanNational bank of Pakistan
Return on Assets = (EBIT / Total Assets)*100Return on Assets = (EBIT / Total Assets)*100
Year 2008Year 2008 Year 2009Year 2009 Year 2010Year 2010
Return on Return on AssetsAssets
46,885,766 46,885,766 / / 817,758,326 817,758,326
= = 5.73%5.73%
61,789,822 61,789,822 / / 944,582,762 944,582,762
= = 6.54%6.54%
69,665,595 69,665,595 / / 1,035,024,680 1,035,024,680
= = 6.73%6.73%
5.73
6.54
6.73
5.2 5.4 5.6 5.8 6 6.2 6.4 6.6 6.8 7
2008
2009
2010
Return on Assets

DuPont Return on AssetsDuPont Return on Assets Sales comparisons with net income and Sales comparisons with net income and
assets.assets.
Ratio Ratio AnalysisAnalysis
National bank of PakistanNational bank of Pakistan
DuPont Return on Assets = (Net Income / Sales) * (Sales / Total DuPont Return on Assets = (Net Income / Sales) * (Sales / Total Assets)*100Assets)*100
Year 2008Year 2008 Year 2009Year 2009 Year 2010Year 2010
DuPont DuPont Return on Return on AssetsAssets
0.25366 0.25366 * * 0.07425 0.07425 = = 1.89%1.89%
0.22530 0.22530 * * 0.08252 0.08252 = = 1.86%1.86%
0.19852 0.19852 * * 0.08548 0.08548 = = 1.69%1.69%
1.91
1.87
1.69
1.55 1.6 1.65 1.7 1.75 1.8 1.85 1.9 1.95
2008
2009
2010
DuPont Return On Assets
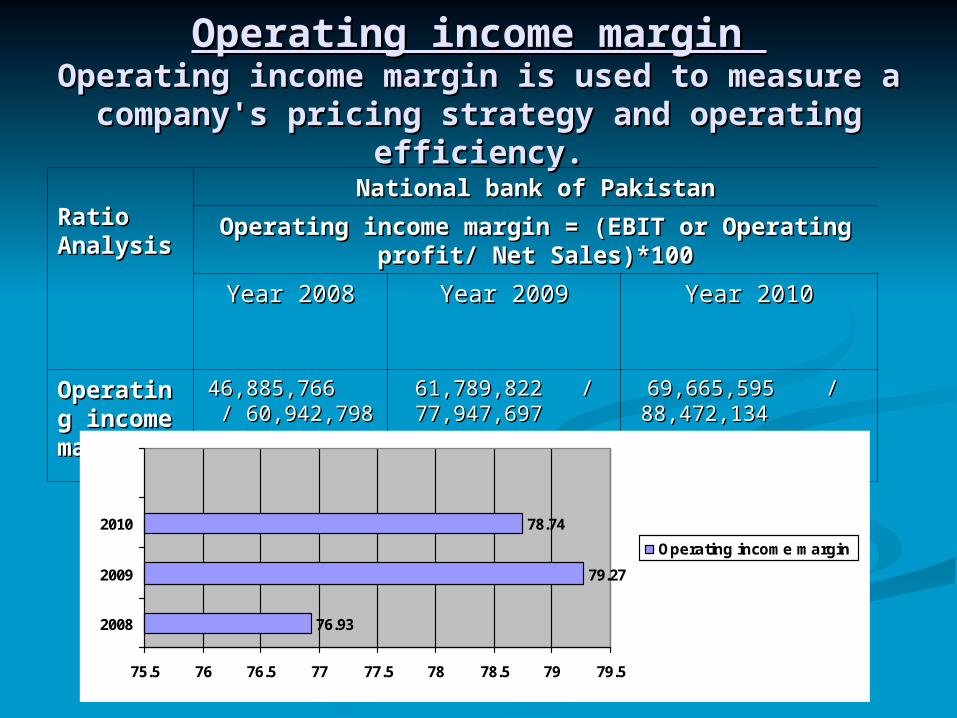
Operating income margin Operating income margin Operating income margin is used to measure a Operating income margin is used to measure a
company's pricing strategy and operating company's pricing strategy and operating efficiency.efficiency.
Ratio Ratio AnalysisAnalysis
National bank of PakistanNational bank of Pakistan
Operating income margin = (EBIT or Operating profit/ Net Operating income margin = (EBIT or Operating profit/ Net Sales)*100Sales)*100
Year 2008Year 2008 Year 2009Year 2009 Year 2010Year 2010
Operating Operating income income marginmargin
46,885,766 46,885,766 / / 60,942,798 60,942,798
= = 76.93%76.93%
61,789,822 61,789,822 / / 77,947,697 77,947,697
= = 79.27%79.27%
69,665,595 69,665,595 / / 88,472,134 88,472,134
= = 78.74%78.74%
76.93
79.27
78.74
75.5 76 76.5 77 77.5 78 78.5 79 79.5
2008
2009
2010
Operating income margin

Return on Operating AssetsReturn on Operating AssetsOperating assets are those assets actively used Operating assets are those assets actively used
to create sale and earn profitto create sale and earn profit Ratio Ratio AnalysisAnalysis
National bank of PakistanNational bank of Pakistan
Return on Operating Assets = (EBIT/ Operating Assets)*100Return on Operating Assets = (EBIT/ Operating Assets)*100
Year 2008Year 2008 Year 2009Year 2009 Year 2010Year 2010
Return on Return on Operating Operating AssetsAssets
46,885,766 46,885,766 / / 560,836,308560,836,308
= = 8.36%8.36%
61,789,822 61,789,822 / / 635,805,667635,805,667
= = 9.72%9.72%
69,665,595 69,665,595 / / 642,862,306642,862,306
= = 10.84%10.84%
8.36
9.72
10.84
0 2 4 6 8 10 12
2008
2009
2010
Return on Operating Assets
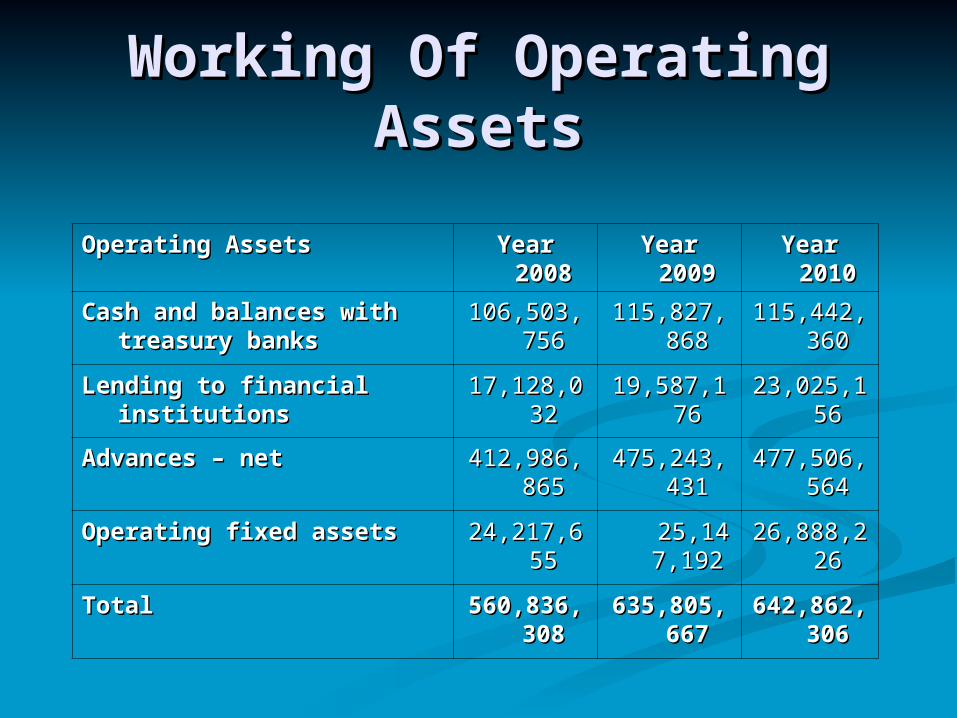
Working Of Operating Working Of Operating AssetsAssets
Operating Assets Operating Assets Year 2008Year 2008 Year 2009Year 2009 Year 2010Year 2010
Cash and balances with treasury Cash and balances with treasury banksbanks
106,503,756106,503,756 115,827,868115,827,868 115,442,36115,442,3600
Lending to financial institutionsLending to financial institutions 17,128,03217,128,032 19,587,17619,587,176 23,025,15623,025,156
Advances – netAdvances – net 412,986,865412,986,865 475,243,431475,243,431 477,506,56477,506,5644
Operating fixed assetsOperating fixed assets 24,217,65524,217,655 25,147,25,147,192192
26,888,22626,888,226
TotalTotal 560,836,308560,836,308 635,805,667635,805,667 642,862,30642,862,3066
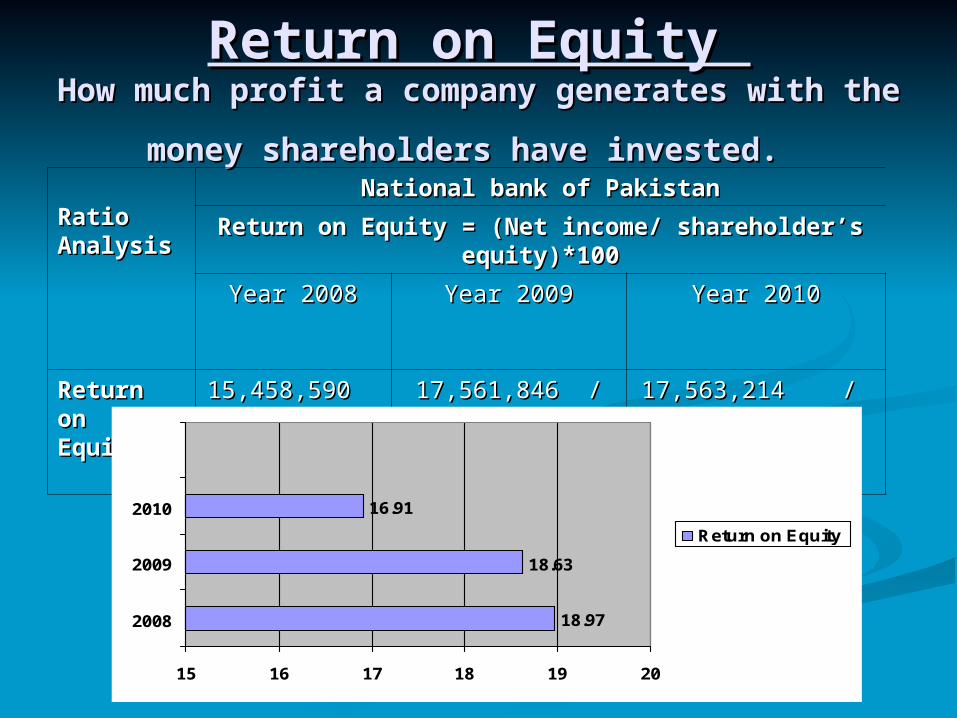
Return on Equity Return on Equity How How much profit a company generates with much profit a company generates with
the money shareholders have invested.the money shareholders have invested. Ratio Ratio AnalysisAnalysis
National bank of PakistanNational bank of Pakistan
Return on Equity = (Net income/ shareholder’s equity)*100Return on Equity = (Net income/ shareholder’s equity)*100
Year 2008Year 2008 Year 2009Year 2009 Year 2010Year 2010
Return on Return on EquityEquity
15,458,590 15,458,590 / / 81,497,458 81,497,458 = = 18.97%18.97%
17,561,846 17,561,846 / / 94,265,853 94,265,853 = = 18.63%18.63%
17,563,214 17,563,214 / / 103,880,048 103,880,048
= = 16.91%16.91%
18.97
18.63
16.91
15 16 17 18 19 20
2008
2009
2010
Return on Equity

Gross Profit Margin RatioGross Profit Margin Ratio Gross profit increase when reduce costGross profit increase when reduce cost
Ratio Ratio AnalysisAnalysis
National bank of PakistanNational bank of Pakistan
Gross Profit Margin Ratio = (Gross Profit / Net Sales)*100Gross Profit Margin Ratio = (Gross Profit / Net Sales)*100
Year 2008Year 2008 Year 2009Year 2009 Year 2010Year 2010
Gross Profit Gross Profit Margin Margin RatioRatio
37,058, 030 37,058, 030 / / 60,942,798 60,942,798 = = 60.81%60.81%
37,458,048 37,458,048 / / 77,947,697 77,947,697 = = 48.06%48.06%
43,221,658 43,221,658 / / 88,472,134 88,472,134
= = 48.85%48.85%
60.81
48.06
48.85
0 10 20 30 40 50 60 70
2008
2009
2010
Gross Profit Margin Ratio

Working Of Gross ProfitWorking Of Gross Profit
Gross ProfitGross Profit Year 2008Year 2008 Year 2009Year 2009 Year 2010Year 2010
Mark–up / return / interest earnedMark–up / return / interest earned 60,942,79860,942,798 77,947,69777,947,697 88,472,13488,472,134
Less: Mark–up / return / interest Less: Mark–up / return / interest expensed expensed
23,884,76823,884,768 40,489,64940,489,649 45,250,47645,250,476
Total Total 37,058,03037,058,030 37,458,04837,458,048 43,221,65843,221,658
Activity RatiosActivity Ratios
Activity ratios measure a firm's Activity ratios measure a firm's ability to convert different ability to convert different
accounts within their balance accounts within their balance sheets into cash or sales.sheets into cash or sales.

Total Assets TurnoverTotal Assets TurnoverAsset turnover measures how effectively a Asset turnover measures how effectively a
business is using assets to generate sales.business is using assets to generate sales.
Ratio Ratio AnalysisAnalysis
National bank of PakistanNational bank of Pakistan
Total Assets Turnover = Net sales/ Total AssetsTotal Assets Turnover = Net sales/ Total Assets
Year 2008Year 2008 Year 2009Year 2009 Year 2010Year 2010
Total Assets Total Assets TurnoverTurnover
60,942,798 60,942,798 / / 817,758,326 817,758,326
= = 0.0745 No. of times0.0745 No. of times
77,947,697 77,947,697 / / 944,582,762 944,582,762
= = 0.0825 No. of times0.0825 No. of times
88,472,134 88,472,134 / / 1,035,024,680 1,035,024,680
= = 0.0855 No. of times0.0855 No. of times
0.0745
0.0825
0.0855
0.068 0.07 0.072 0.074 0.076 0.078 0.08 0.082 0.084 0.086 0.088
2008
2009
2010
Total Assets Turnover
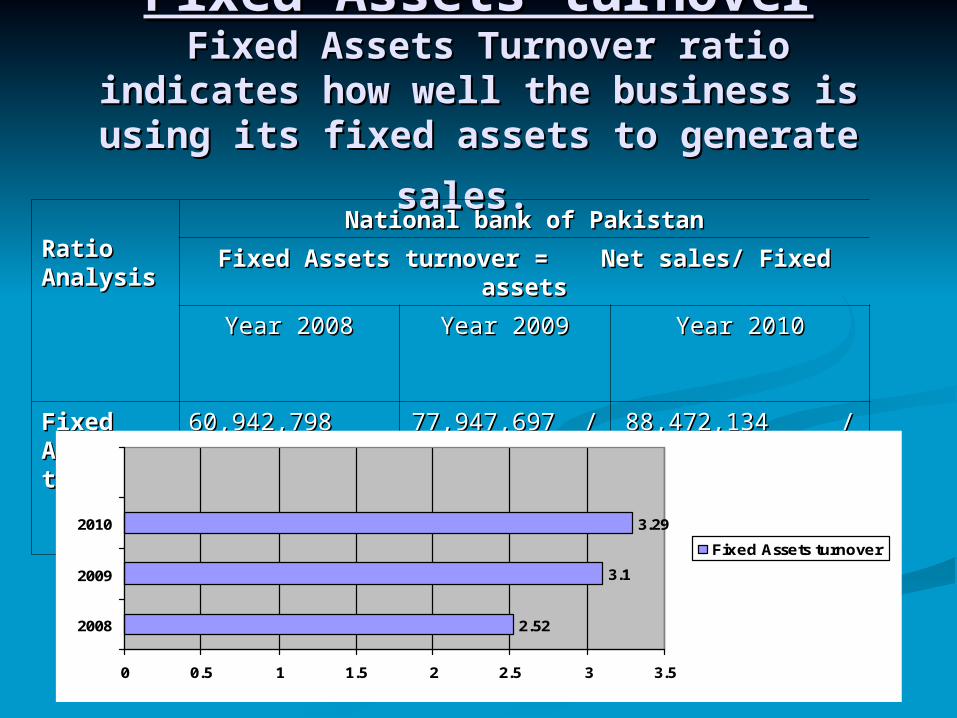
Fixed Assets turnoverFixed Assets turnover Fixed Assets Turnover ratio indicates Fixed Assets Turnover ratio indicates how well the business is using its fixed how well the business is using its fixed
assets to generate sales.assets to generate sales. Ratio Ratio AnalysisAnalysis
National bank of PakistanNational bank of Pakistan
Fixed Assets turnover = Fixed Assets turnover = Net sales/ Fixed assetsNet sales/ Fixed assets
Year 2008Year 2008 Year 2009Year 2009 Year 2010Year 2010
Fixed Assets Fixed Assets turnoverturnover
60,942,798 60,942,798 / / 24,217,655 24,217,655
= = 2.52 No. of times2.52 No. of times
77,947,697 77,947,697 / / 25,147,192 25,147,192
= = 3.10 No. of times3.10 No. of times
88,472,134 88,472,134 / / 341,560,700 341,560,700
= = 3.29 No. of times3.29 No. of times
2.52
3.1
3.29
0 0.5 1 1.5 2 2.5 3 3.5
2008
2009
2010
Fixed Assets turnover

Market RatiosMarket Ratios
Market ratios measure investor Market ratios measure investor response to owning a company's response to owning a company's stock and also the cost of issuing stock and also the cost of issuing
stock.stock.

Dividend per shareDividend per shareDividend per share is used to measure Dividend per share is used to measure the income received by shareholders the income received by shareholders
from each share owned.from each share owned.
Ratio Ratio AnalysisAnalysis
National bank of PakistanNational bank of Pakistan
Dividend per share = Dividend per share = Dividend paid to share holderDividend paid to share holder
Average common share outstandingAverage common share outstanding
Year 2008Year 2008 Year 2009Year 2009 Year 2010Year 2010
Dividend per Dividend per shareshare
6,104,894 6,104,894 / / 896975 896975
= = 6.81 Rs.6.81 Rs.
5,820,338 5,820,338 / / 1076370 1076370 = = 5.41 Rs.5.41 Rs.
8,060,510 8,060,510 / / 1345463 1345463
= = 5.99 Rs.5.99 Rs.
6.81
5.41
5.991
0 2 4 6 8
2008
2009
2010
Dividend per share
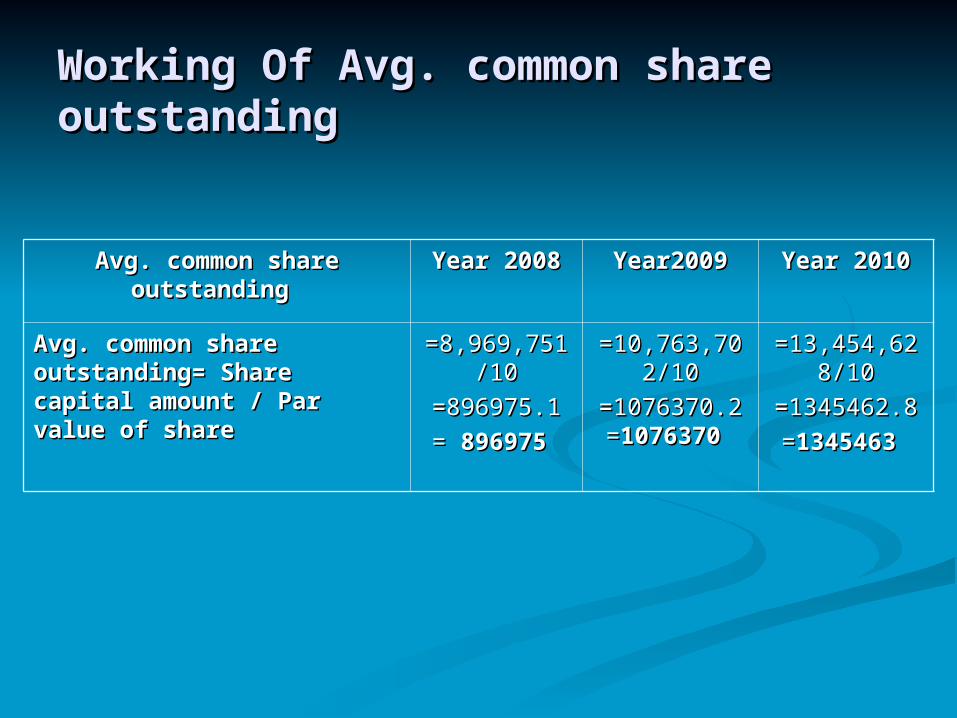
Working Of Avg. common share Working Of Avg. common share outstandingoutstanding
Avg. common share outstanding Avg. common share outstanding Year 2008Year 2008 Year2009Year2009 Year 2010Year 2010
Avg. common share outstanding= Avg. common share outstanding= Share capital amount / Par value of Share capital amount / Par value of shareshare
=8,969,751/10=8,969,751/10
=896975.1=896975.1
= = 896975896975
=10,763,702/10=10,763,702/10
=1076370.2 =1076370.2 ==10763701076370
=13,454,628/10=13,454,628/10
=1345462.8=1345462.8
==13454631345463
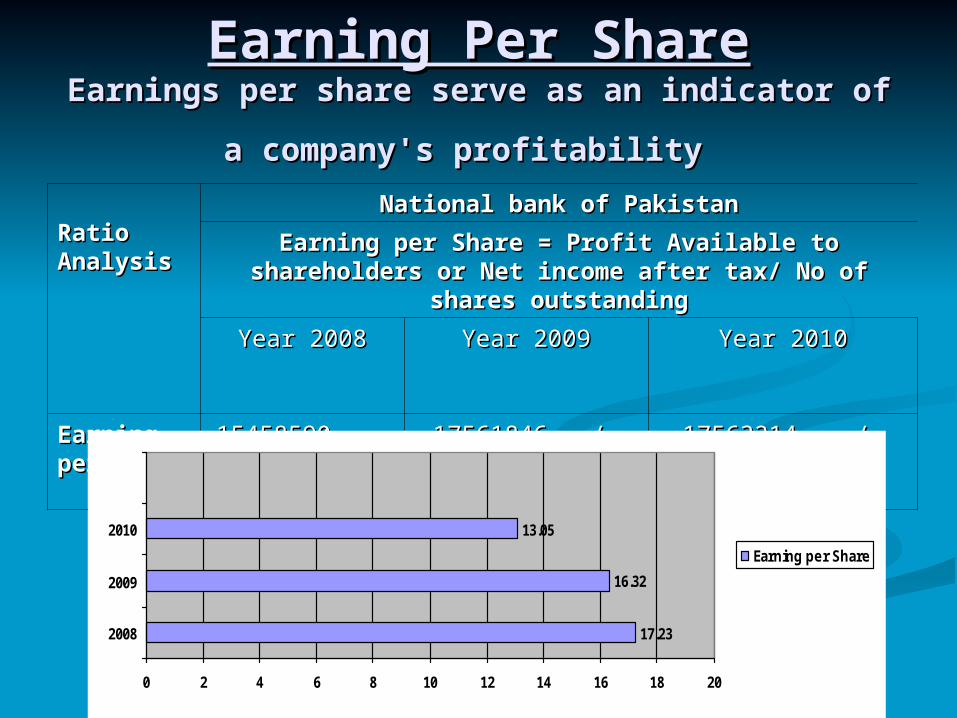
Earning Per ShareEarning Per ShareEarnings per share serve as an indicator of a Earnings per share serve as an indicator of a
company's profitabilitycompany's profitability
Ratio Ratio AnalysisAnalysis
National bank of PakistanNational bank of Pakistan
Earning per Share = Profit Available to shareholders or Net income Earning per Share = Profit Available to shareholders or Net income after tax/ No of shares outstandingafter tax/ No of shares outstanding
Year 2008Year 2008 Year 2009Year 2009 Year 2010Year 2010
Earning per Earning per ShareShare
15458590 15458590 / / 896975 896975
= = 17.23 Rs.17.23 Rs.
17561846 17561846 / / 1076370 1076370 = = 16.32 Rs.16.32 Rs.
17563214 17563214 / / 1345463 1345463 = = 13.05 Rs.13.05 Rs.
17.23
16.32
13.05
0 2 4 6 8 10 12 14 16 18 20
2008
2009
2010
Earning per Share
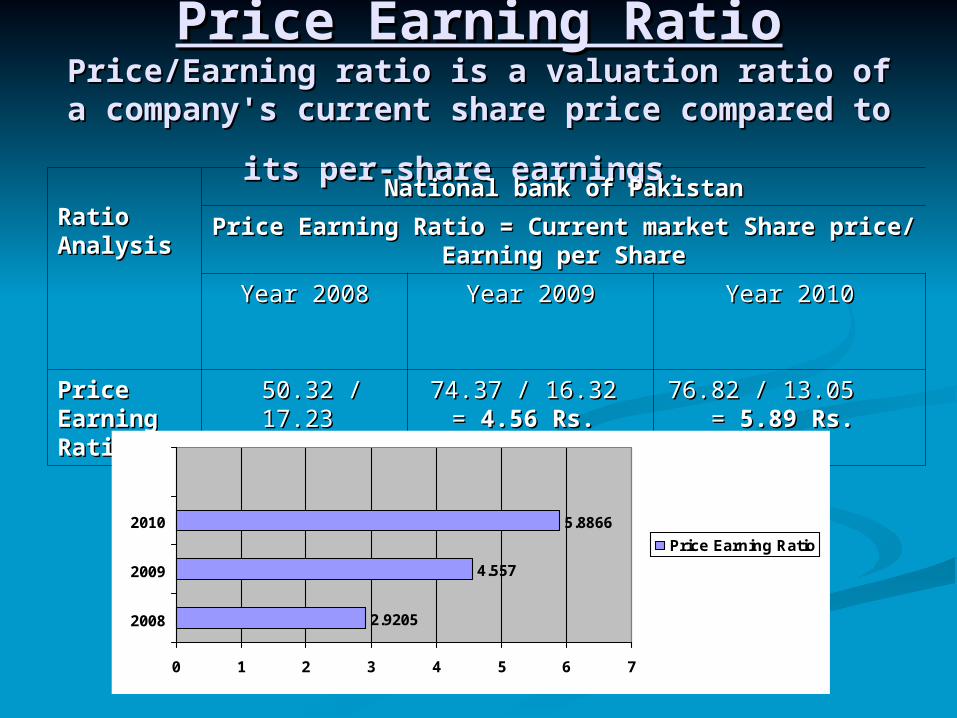
Price Earning RatioPrice Earning RatioPrice/Earning ratio is a valuation ratio of a Price/Earning ratio is a valuation ratio of a
company's current share price compared to its company's current share price compared to its
per-share earnings.per-share earnings. Ratio Ratio AnalysisAnalysis
National bank of PakistanNational bank of Pakistan
Price Earning Ratio = Current market Share price/ Earning per Price Earning Ratio = Current market Share price/ Earning per ShareShare
Year 2008Year 2008 Year 2009Year 2009 Year 2010Year 2010
Price Price Earning Earning RatioRatio
50.32 50.32 / / 17.23 17.23 = = 2.92 Rs.2.92 Rs.
74.37 74.37 / / 16.32 16.32 = = 4.56 Rs.4.56 Rs.
76.82 76.82 / / 13.05 13.05 = = 5.89 Rs.5.89 Rs.
2.9205
4.557
5.8866
0 1 2 3 4 5 6 7
2008
2009
2010
Price Earning Ratio

ConclusionConclusion NBP is a part of State Bank of Pakistan and it is its major strength. NBP is a part of State Bank of Pakistan and it is its major strength.
Providing different products and services to its customers. Islamic banking, Providing different products and services to its customers. Islamic banking, student loan scheme, international finance.student loan scheme, international finance.
Most rising bank with highest return on capital.Most rising bank with highest return on capital.
Largest market share amongst all Banks in Pakistan. Largest market share amongst all Banks in Pakistan.
Highest cost to Income ratio as compare to all other commercial banks. Highest cost to Income ratio as compare to all other commercial banks.
Net assets of the NBP are increasing day by day. Net assets of the NBP are increasing day by day.
The net profit is also increasing which may attract the investors. The net profit is also increasing which may attract the investors.

RecommendationsRecommendations Improve its EPS because its shows company profitability.Improve its EPS because its shows company profitability.
Increase sale and reduce expenses to earn better profit marginIncrease sale and reduce expenses to earn better profit margin
Improve liquidity position by increasing its saleImprove liquidity position by increasing its sale
Increase the current assets as compared to current liabilitiesIncrease the current assets as compared to current liabilities
Proper training of staff membersProper training of staff members
Prevailing friendly environmentPrevailing friendly environment
Complaint counter should be availableComplaint counter should be available
Working capital should be positive .Working capital should be positive .

Thank YouThank You
Top Related