


Languages
Pages
Legal


© 2016 MSCI Inc. All rights reserved. Please refer to the disclaimer at the end of this document.
MSCI SEMINAR SERIES: FIXED INCOME INSIGHTS Navigate the ECB’s Corporate Sector Purchase
Program with MSCI Fixed Income Analytics
• 1 bp tolerance level for MSCI-reconciled bottom up, daily index returns vs. vendor
reported returns
• 15 years of providing data management, reconciliation, and reporting managed services
to large organizations
• 40+ fixed income researchers focusing on fixed income modeling/single security pricing
• 100+ fixed income pricing models available through MSCI
• 125+ people devoted to providing exceptional data quality & management
• 1989 is the year when MSCI introduced its first fixed income factor model
• 6,000 issuer curves built by MSCI and used in our models
• 19,000 fixed income benchmark indexes available through MSCI, including Barclays
Capital, Bloomberg, JPMorgan, iBoxx, and BofA Merrill Lynch
• 40,000 global structured fixed income deals covered though INTEX cashflow models
• 3.3 million instruments for which MSCI delivers terms & conditions data
2
MSCI = FIXED INCOME EXPERTISE
MSCI IS A LEADER IN FIXED INCOME ANALYTICS
3 3
• Curve & Spread attribution
• Visualization dashboards
• Data management
• Quality control
• Reporting
• Global, including EM
• Integrated with equity & private asset classes
• Over 100 pricing models
• Over 6,000 issuer curves
Single
Security
Analytics
Factor
Models
Performance
Attribution
Services

MSCI FIXED INCOME ANALYTICS INFRASTRUCTURE
Data
• 125+ staff dedicated to data services
• Significant QA processes
• 50+ vendors
• Reference data for over 3.3 million assets
Benchmark Indexes
• All major indexes: Bloomberg / Barclays, iBoxx, BofA / Merrill, JPMorgan, Citigroup
• Over 19,000 benchmark indexes
• Indexes reconciled daily to 1 bp of reported returns
Reporting
• Multiple data out capabilities: batch reports, APIs, XMLs, Web Based Platform
• Market-leading partitioning: slice & dice, user data, user-defined groupings
• On-demand report creation
Research
• Over 40 research staff on FI
• Majority of client consultants have advanced degrees and experience as market practitioners
4

• Expertise ─ Three decades of expertise in fixed income ─ Four decades building factor models
• Services ─ Data collection, reconciliation, implementation, & custom workflow
integration ─ Built around your process
• Scalability ─ On-demand infrastructure for asset growth and new strategies ─ Links to other asset classes
• Reporting ─ Flexible, open ─ Batch, user interface, web services, Excel interface
• Investment ─ Significant product development investments in FI analytics in 2016
WHY MSCI FOR FIXED INCOME?
5
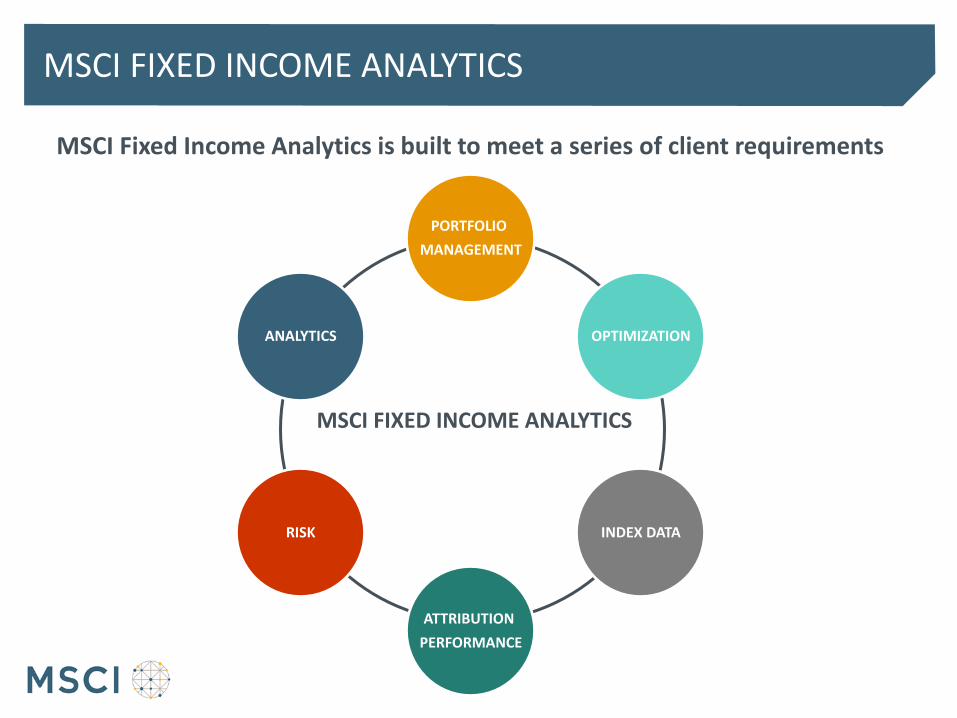
MSCI FIXED INCOME ANALYTICS
MSCI Fixed Income Analytics is built to meet a series of client requirements
MSCI FIXED INCOME ANALYTICS
PORTFOLIO
MANAGEMENT
OPTIMIZATION
INDEX DATA
ATTRIBUTION
PERFORMANCE
RISK
ANALYTICS

FIXED INCOME RESEARCH INITIATIVES
7

Current and Future Successes
• New Fixed Income Factor Model (phase 2: Nov 2016)
• Integration of Barra and RiskMetrics Models (ongoing effort)
• Bank Loan Model (Nov 2016, Q2 2017)
• Systematic Strategy Factors (e.g. carry, value, trend) (2017)
• Advanced Modeling for High Yield and Distressed (2017)
FIXED INCOME RESEARCH HEADLINES
8

MSCI INTEGRATED ANALYTICS
9
Risk Reporting
Portfolio Management
Asset Allocation and Total Plan Risk Budgeting
Board Reporting
Ris
k M
anag
emen
t
KEY RATE DURATIONS
EQUITY TIME SERIES
ISSUER CURVES
IMPLIED VOLATILITY SURFACES
COMMODITY PRICES
MUNICIPAL CURVES
INFLATION
GDP GROWTH
GLOBAL VALUE GLOBAL BANKS
GLOBAL COUNTRY FACTORS GLOBAL RATES
GLOBAL SPREADS
1 YEAR
1 DAY
Ho
rizo
n
1 MONTH
3 YEARS +
Equity Fixed Income Derivatives Private Assets
EQUITY RATES CREDIT
INFLATION PURE ALTS REAL ASSETS
KEY RATES (US 10Y)
CREDIT SPREADS (CAD FINANCIALS )
EQUITY INDUSTRIES (JAPANESE BANKS)
EQUITY STYLES (US VALUE)
PRIVATE ASSETS (US BUYOUTS)

INTEGRATING FIXED INCOME ANALYTICS
Link RiskMetrics with Barra factor analytics
• Asset coverage, pricing models, curves, data …
• Connect layers of the investment “pyramid”
• Deliver RiskManager positions into BarraOne
• Allow BarraOne access to pricing models in RiskManager
10
Benefits to Clients • Improved single security analytics and portfolio risk models
• Integrated solution to address needs of both risk managers and front office decision makers
• Industry standard fixed income models
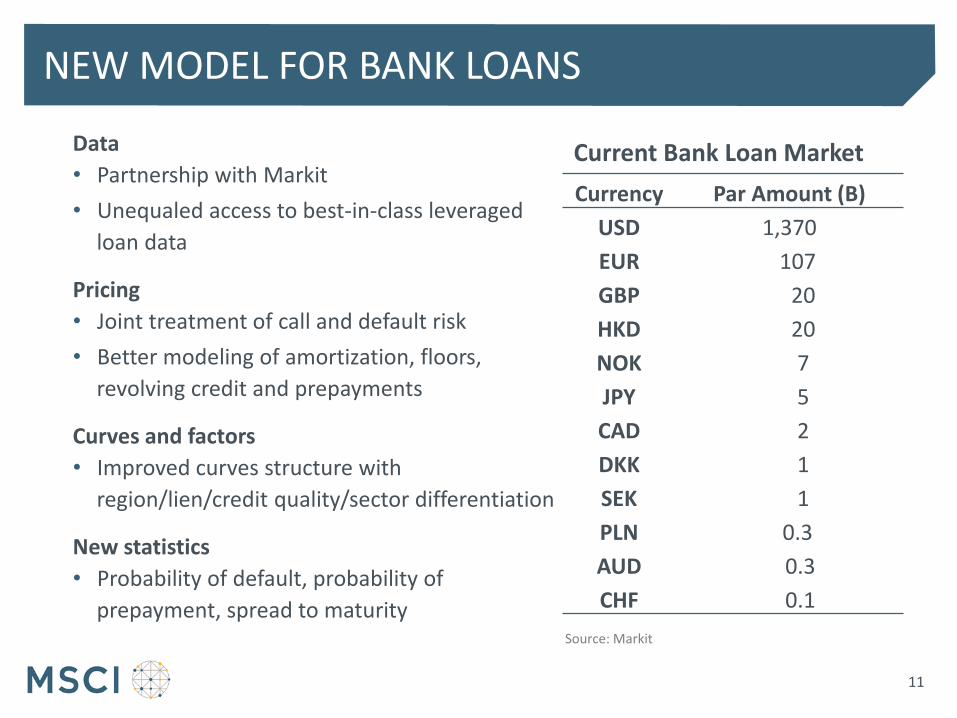
NEW MODEL FOR BANK LOANS
11
Data
• Partnership with Markit
• Unequaled access to best-in-class leveraged
loan data
Pricing
• Joint treatment of call and default risk
• Better modeling of amortization, floors,
revolving credit and prepayments
Curves and factors
• Improved curves structure with
region/lien/credit quality/sector differentiation
New statistics
• Probability of default, probability of
prepayment, spread to maturity
Currency Par Amount (B)
USD 1,370
EUR 107
GBP 20
HKD 20
NOK 7
JPY 5
CAD 2
DKK 1
SEK 1
PLN 0.3
AUD 0.3
CHF 0.1
Source: Markit
Current Bank Loan Market
NEW FIXED INCOME FACTOR MODEL
12

NEW FIXED INCOME FACTOR MODEL: BRIDGING THE NEEDS OF PORTFOLIO & RISK MANAGERS
13
Portfolio Managers
Risk Managers
Intuitive Factors (examples)
• Key Rate Durations
• OAS as forward indicator of spread risk
• Breakeven-Inflation
• Basis risk (CDS & Bond, OTR & OFTR Tsy)
• EUR spreads calculated to the German government curve
Designed to assist in portfolio
construction, hedging and rebalancing
Based on deep experience in
modeling factors combined with
rigorous validation process
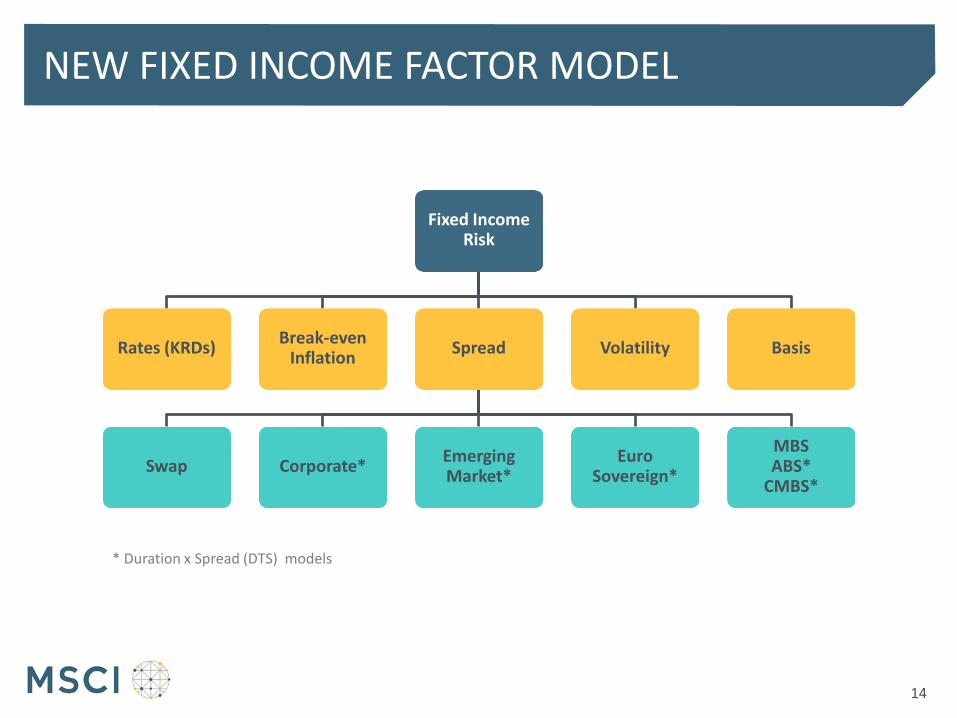
NEW FIXED INCOME FACTOR MODEL
Fixed Income Risk
Rates (KRDs) Break-even
Inflation Spread
Swap Corporate* Emerging Market*
Euro Sovereign*
MBS ABS*
CMBS*
Volatility Basis
* Duration x Spread (DTS) models
14
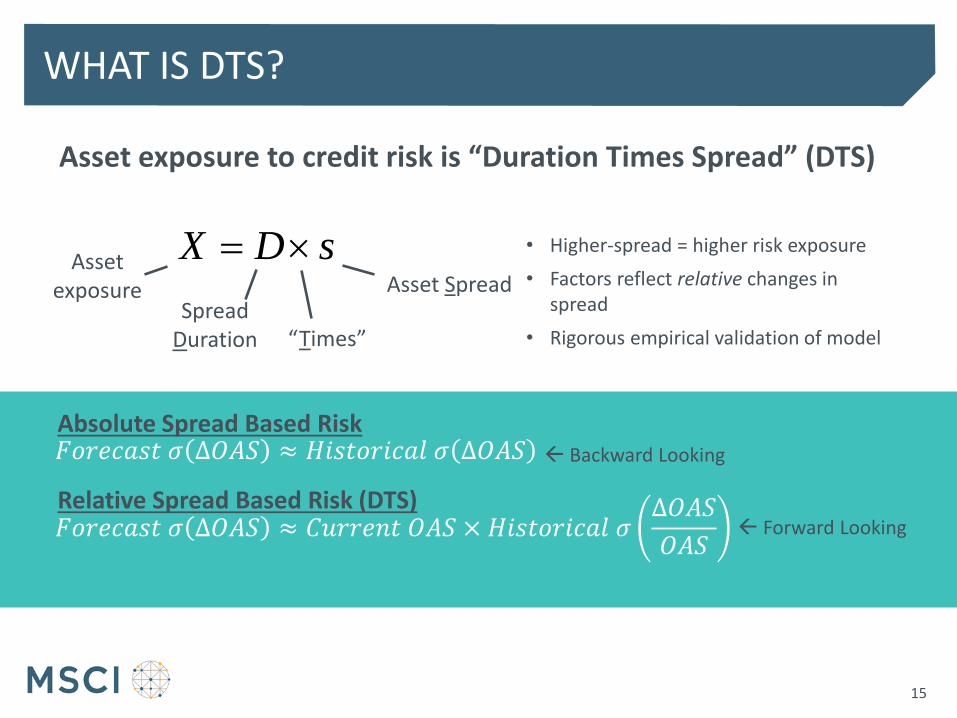
WHAT IS DTS?
X D s Asset exposure
Spread Duration
Asset Spread
“Times”
15
• Higher-spread = higher risk exposure
• Factors reflect relative changes in spread
• Rigorous empirical validation of model
Asset exposure to credit risk is “Duration Times Spread” (DTS)
𝐹𝑜𝑟𝑒𝑐𝑎𝑠𝑡 𝜎 ∆𝑂𝐴𝑆 ≈ 𝐻𝑖𝑠𝑡𝑜𝑟𝑖𝑐𝑎𝑙 𝜎 ∆𝑂𝐴𝑆
𝐹𝑜𝑟𝑒𝑐𝑎𝑠𝑡 𝜎 ∆𝑂𝐴𝑆 ≈ 𝐶𝑢𝑟𝑟𝑒𝑛𝑡 𝑂𝐴𝑆 × 𝐻𝑖𝑠𝑡𝑜𝑟𝑖𝑐𝑎𝑙 𝜎∆𝑂𝐴𝑆
𝑂𝐴𝑆
Backward Looking
Forward Looking
Absolute Spread Based Risk
Relative Spread Based Risk (DTS)
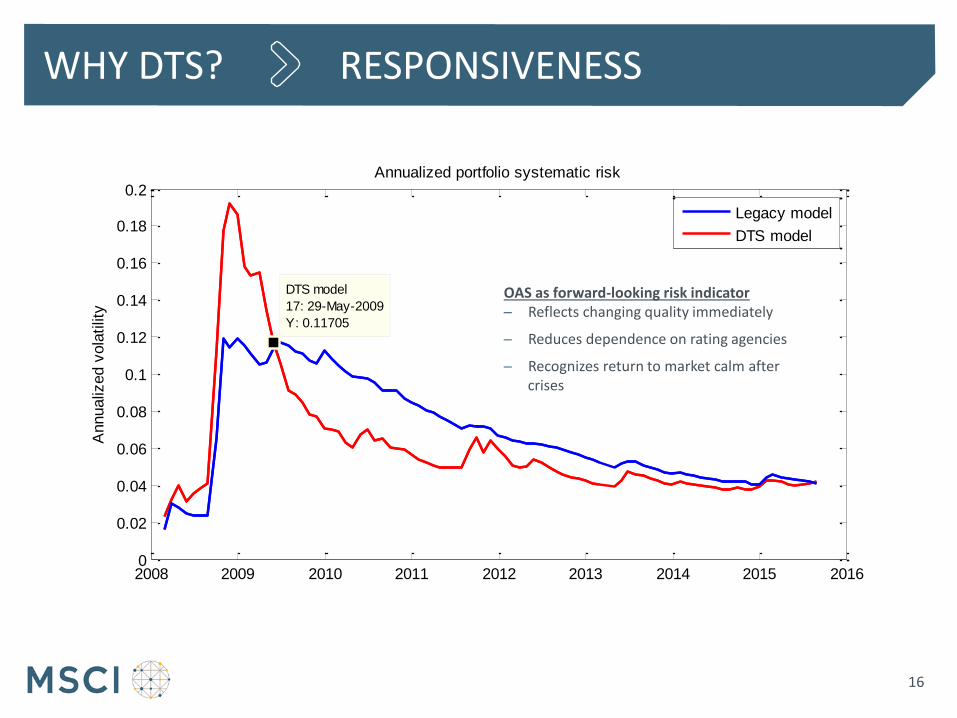
WHY DTS? RESPONSIVENESS
16
2008 2009 2010 2011 2012 2013 2014 2015 20160
0.02
0.04
0.06
0.08
0.1
0.12
0.14
0.16
0.18
0.2
DTS model
17: 29-May-2009
Y: 0.11705
Annualiz
ed v
ola
tilit
y
Annualized portfolio systematic risk
Legacy model
DTS model
OAS as forward-looking risk indicator ─ Reflects changing quality immediately
─ Reduces dependence on rating agencies
─ Recognizes return to market calm after crises

DTS FOR SOVEREIGN EUROPE: FRANCE
2007 2010 2012 20150
50
100
150
200
250
300Risk Forecasts
Ris
k (
Month
ly b
ps)
France (DTS)
Germany
France (Absolute)
2007 2010 2012 20150
100
200Spread to German Bund
Spre
ad (
bps)
17

EXAMPLE: EURO FACTORS
Country
Austria
Belgium
Finland
France
Germany
Ireland
Italy
Luxembourg
Netherlands
Portugal
Spain
e.g. French Bank → EU Banks IG + EU France Corporate
Sectors
EU Financials IG EU Utilities
EU Banking IG EU Electric Utility IG
EU Capital Markets IG EU Materials
EU Diversified Financials IG EU Health Care
EU Insurance IG EU Information Technology
EU Real Estate IG EU Transportation
EU Financials HY EU Agency
EU Industrials EU Supranational
EU Capital Goods IG EU Pfandbrief
EU Services IG EU Covered France
EU Consumer Discretionary EU Covered Spain
EU Auto IG EU Other Covered
EU Consumer Staples EU Local & Provincial
EU Food IG EU Corporate IG
EU Energy EU Corporate HY
EU Oil & Gas IG
EU Telecoms
EU Diversified Telecoms IG
18
Rates
1M
6M
1Y
2Y
5Y
10Y
20Y
30Y
50Y
Sovereign Spread
Austria
Belgium
Finland
France
Ireland
Italy
Netherlands
Portugal
Spain
EU Other
Credit Yield Curve
Basis
CDS Basis IG
CDS Basis HY
Swap
1M
6M
1Y
2Y
5Y
10Y
20Y
30Y
50Y
Inflation1
1Y
2Y
5Y
10Y
20Y
30Y
50Y
1/We have additional inflation factors for Germany, France and Italy

NEW FIXED INCOME FACTOR MODEL: DELIVERY TIMELINE
• Major fixed income market models available for testing starting July 18th
• Model has been locked down after receiving substantial client feedback and is
scheduled for release on November 19th
Alpha P
Today 2016 Q1 2017
Beta P Client POCs & feedback P
USD, Euro, Sterling, Yen, EM models
Release
All FI Markets MSCI Integrated Model
Markets:
19
Select Enhancements Planned for 2017 • Bank Loans • Basis Factors for Inflation Swaps, Tsy & FX Futures • Nordics Credit (evaluating data) • Integration with Equities, Private Assets & Commodities • Systematic Strategy Factors (e.g. carry, value, trend) • Improvements for high yield & distressed

ANALYZING A STRATEGY FOR EUROPEAN CORPORATES:
Background
Portfolio Construction
Performance Analysis
20
STARTING POINT
21
Key MSCI Tools Used to Analyze Euro Corporate Strategy
• New Fixed Income Factor Model
• Performance Attribution
• Portfolio Optimizer
• BLM Model Bid/Ask Spreads
OVERVIEW OF ECB’S CORPORATE BOND PROGRAM (CSPP)
22
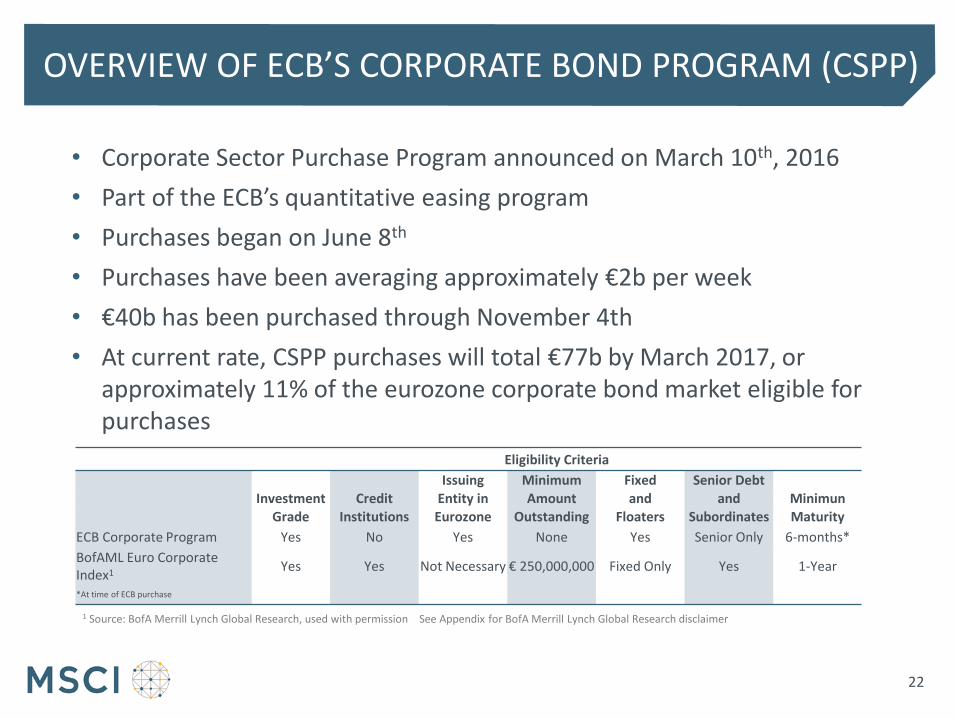
• Corporate Sector Purchase Program announced on March 10th, 2016
• Part of the ECB’s quantitative easing program
• Purchases began on June 8th
• Purchases have been averaging approximately €2b per week
• €40b has been purchased through November 4th
• At current rate, CSPP purchases will total €77b by March 2017, or approximately 11% of the eurozone corporate bond market eligible for purchases
Eligibility Criteria
Issuing Minimum Fixed Senior Debt Investment Credit Entity in Amount and and Minimun Grade Institutions Eurozone Outstanding Floaters Subordinates Maturity
ECB Corporate Program Yes No Yes None Yes Senior Only 6-months*
BofAML Euro Corporate Index1
Yes Yes Not Necessary € 250,000,000 Fixed Only Yes 1-Year
*At time of ECB purchase
1 Source: BofA Merrill Lynch Global Research, used with permission See Appendix for BofA Merrill Lynch Global Research disclaimer
SIGNIFICANT SPREAD TIGHTENING…
23
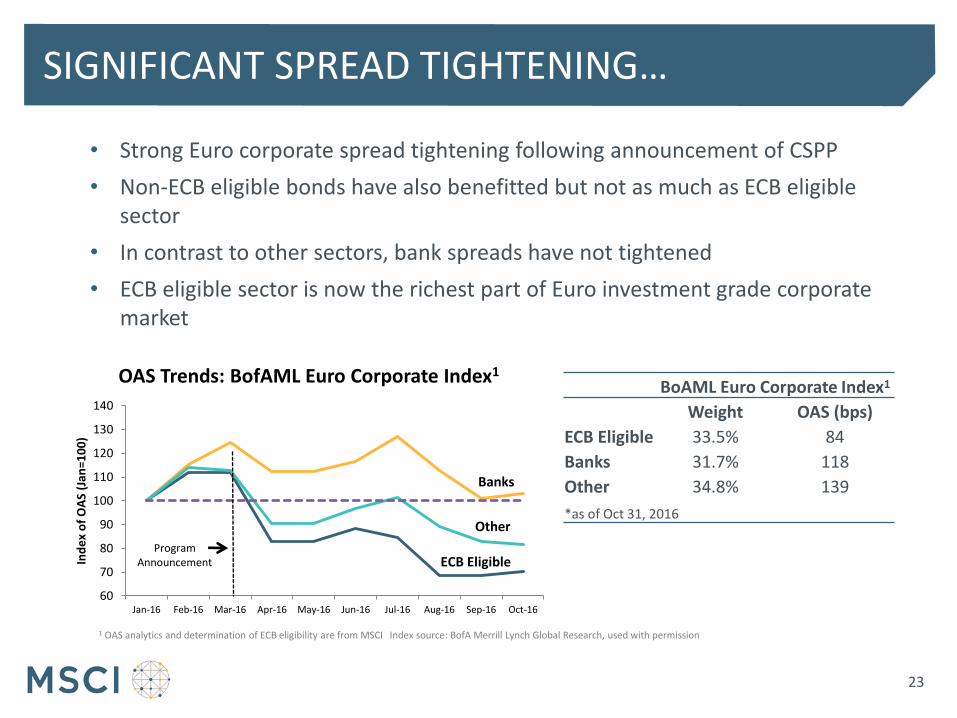
• Strong Euro corporate spread tightening following announcement of CSPP
• Non-ECB eligible bonds have also benefitted but not as much as ECB eligible sector
• In contrast to other sectors, bank spreads have not tightened
• ECB eligible sector is now the richest part of Euro investment grade corporate market
BoAML Euro Corporate Index1
Weight OAS (bps)
ECB Eligible 33.5% 84
Banks 31.7% 118
Other 34.8% 139
*as of Oct 31, 2016
1 OAS analytics and determination of ECB eligibility are from MSCI Index source: BofA Merrill Lynch Global Research, used with permission
60
70
80
90
100
110
120
130
140
Jan-16 Feb-16 Mar-16 Apr-16 May-16 Jun-16 Jul-16 Aug-16 Sep-16 Oct-16
Ind
ex
of
OA
S (J
an=1
00
)
OAS Trends: BofAML Euro Corporate Index1
ECB Eligible
Banks
Other
Program Announcement
…AND SURGING CORPORATE BOND ISSUANCE
24
-10
-5
0
5
10
15
20
25
Jan
-14
Feb
-14
Mar
-14
Ap
r-1
4
May
-14
Jun
-14
Jul-
14
Au
g-1
4
Sep
-14
Oct
-14
No
v-1
4
De
c-1
4
Jan
-15
Feb
-15
Mar
-15
Ap
r-1
5
May
-15
Jun
-15
Jul-
15
Au
g-1
5
Sep
-15
Oct
-15
No
v-1
5
De
c-1
5
Jan
-16
Feb
-16
Mar
-16
Ap
r-1
6
May
-16
Jun
-16
Jul-
16
Au
g-1
6
Sep
-16
MO
NTH
LY I
N €
BIL
LIO
NS
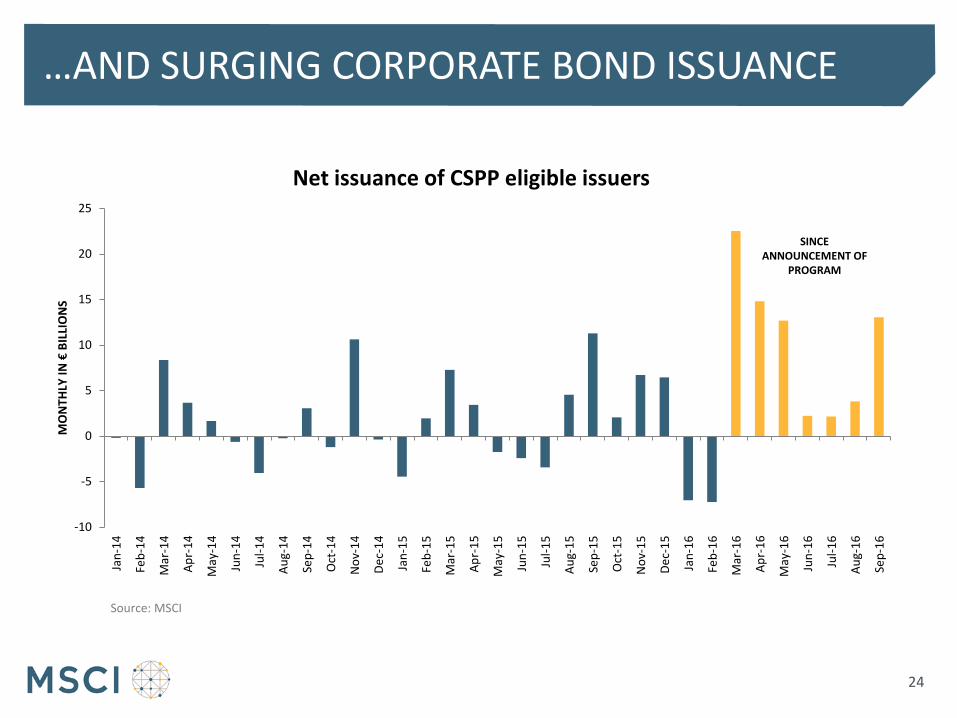
Net issuance of CSPP eligible issuers
SINCE ANNOUNCEMENT OF
PROGRAM
Source: MSCI

AND WHAT HAS BEEN THE IMPACT ON LIQUIDITY?
25
25
30
35
40
45
50
55
60
65
BLM
Bid
/Ask
(in
bp
s)
Liquidity Trends: MSCI BLM Model for Bid/Ask
ECB Eligible
Banks
Other
CSPP Purchases
Begin
*Bid/Ask on securities underlying the BofAML Euro Corporate Index
MSCI BLM Model • Estimates bond bid/ask spreads • Important variables impacting bid/ask:
─ spread duration ─ OAS ─ bond age ─ size of bond (e.g. $1billion)
• Model being updated with coverage extended to include 460,000 bonds
• Early concerns that ECB corporate bond buying would dry-up liquidity
• As measured by bid/ask spreads, liquidity conditions have not noticeably deteriorated since launch of program
PORTFOLIO POSITIONING
26
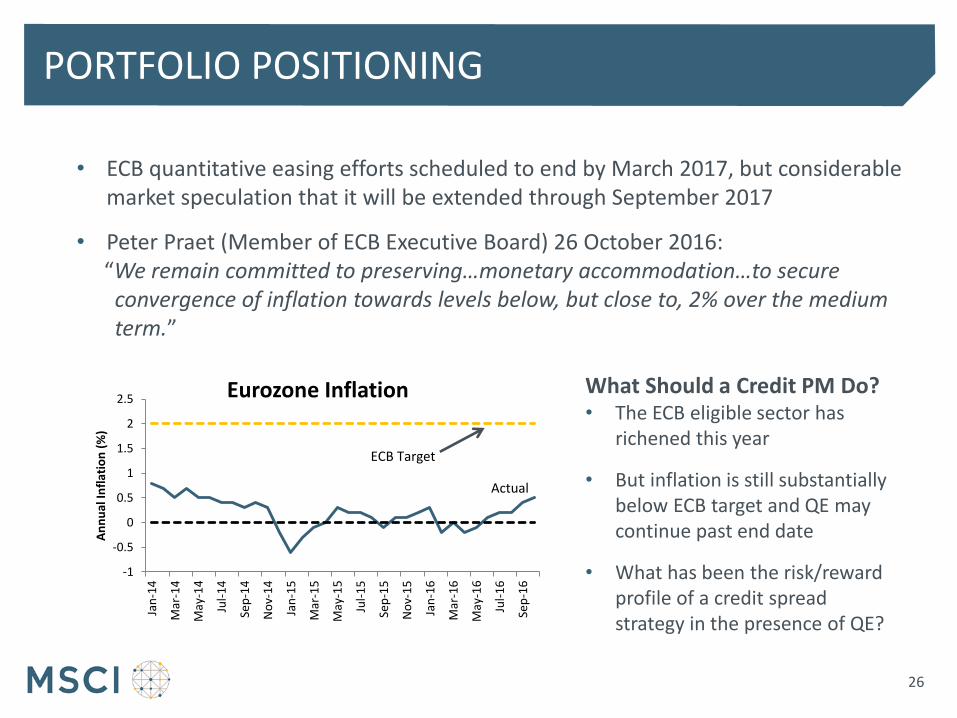
• ECB quantitative easing efforts scheduled to end by March 2017, but considerable market speculation that it will be extended through September 2017
• Peter Praet (Member of ECB Executive Board) 26 October 2016: “We remain committed to preserving…monetary accommodation…to secure
convergence of inflation towards levels below, but close to, 2% over the medium term.”
What Should a Credit PM Do? • The ECB eligible sector has
richened this year
• But inflation is still substantially below ECB target and QE may continue past end date
• What has been the risk/reward profile of a credit spread strategy in the presence of QE?
-1
-0.5
0
0.5
1
1.5
2
2.5
Jan
-14
Mar
-14
May
-14
Jul-
14
Sep
-14
No
v-1
4
Jan
-15
Mar
-15
May
-15
Jul-
15
Sep
-15
No
v-1
5
Jan
-16
Mar
-16
May
-16
Jul-
16
Sep
-16
An
nu
al In
flat
ion
(%
)
Eurozone Inflation
ECB Target
Actual

ANALYZING A STRATEGY FOR EUROPEAN CORPORATES:
27
Background
Portfolio Construction
Performance Analysis

INVESTOR PERSONA: EUROPEAN CREDIT PM
28
Type of Institution • Long Only Asset Manager
Benchmark • BoA Merrill Lynch Euro
Corporate Index
Investment Principles/Guidelines • Focus on credit strategies • Minimal interest rate risk • Avoid excessive issuer
concentration • Approximate risk budget of 125
bps of annual tracking error • Portfolio turnover not to exceed
60% per annum (5% per month)
Investment Perspective • Risk premia exists in the corporate
bond market. High spread bonds will outperform low spread bonds over longer periods of time.
• Banks, the largest sector in the index, are a tough investment call given lack of balance sheet transparency and the potential for government intervention
• Starting at the beginning of 2016, PM has a moderately positive view on the market
PORTFOLIO CONSTRUCTION: SETUP
29
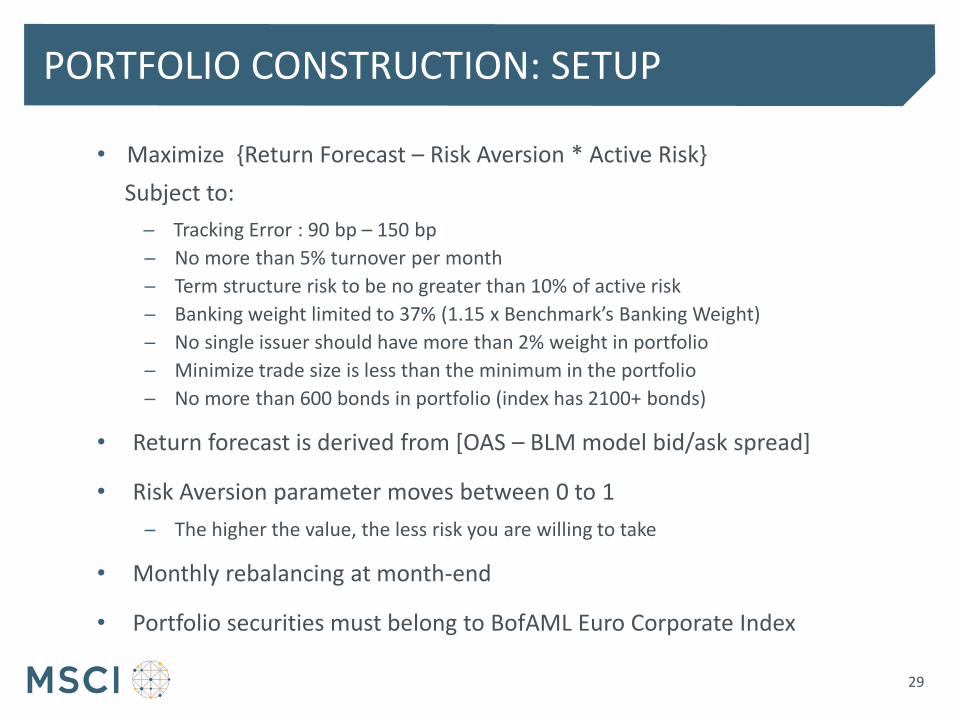
• Maximize {Return Forecast – Risk Aversion * Active Risk}
Subject to:
─ Tracking Error : 90 bp – 150 bp
─ No more than 5% turnover per month
─ Term structure risk to be no greater than 10% of active risk
─ Banking weight limited to 37% (1.15 x Benchmark’s Banking Weight)
─ No single issuer should have more than 2% weight in portfolio
─ Minimize trade size is less than the minimum in the portfolio
─ No more than 600 bonds in portfolio (index has 2100+ bonds)
• Return forecast is derived from [OAS – BLM model bid/ask spread]
• Risk Aversion parameter moves between 0 to 1
─ The higher the value, the less risk you are willing to take
• Monthly rebalancing at month-end
• Portfolio securities must belong to BofAML Euro Corporate Index
BARRA OPTIMIZER
30
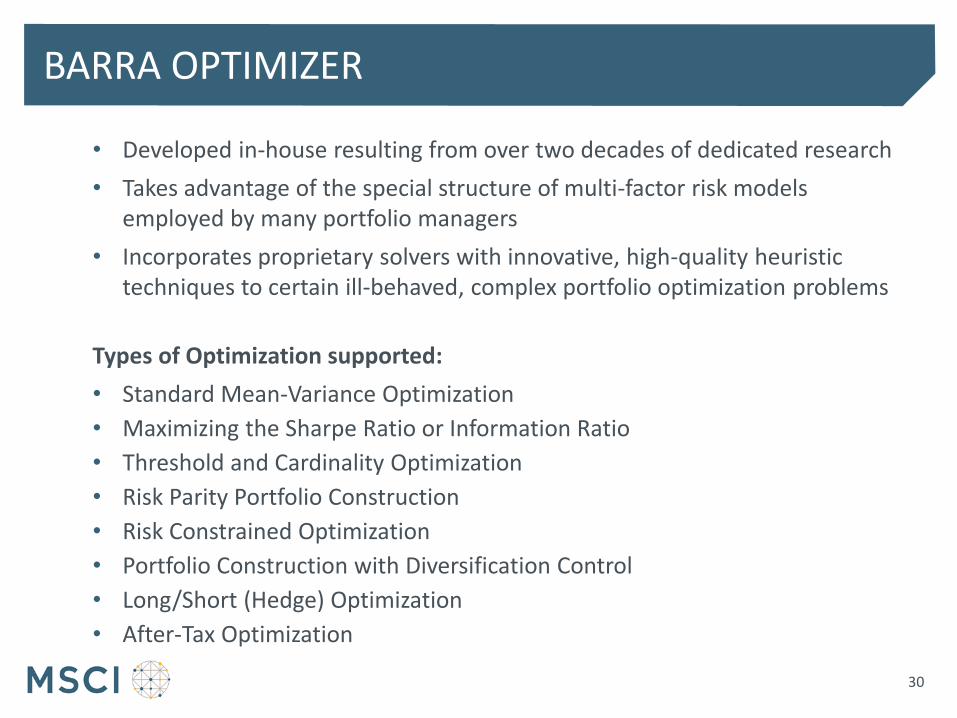
• Developed in-house resulting from over two decades of dedicated research
• Takes advantage of the special structure of multi-factor risk models employed by many portfolio managers
• Incorporates proprietary solvers with innovative, high-quality heuristic techniques to certain ill-behaved, complex portfolio optimization problems
Types of Optimization supported:
• Standard Mean-Variance Optimization
• Maximizing the Sharpe Ratio or Information Ratio
• Threshold and Cardinality Optimization
• Risk Parity Portfolio Construction
• Risk Constrained Optimization
• Portfolio Construction with Diversification Control
• Long/Short (Hedge) Optimization
• After-Tax Optimization
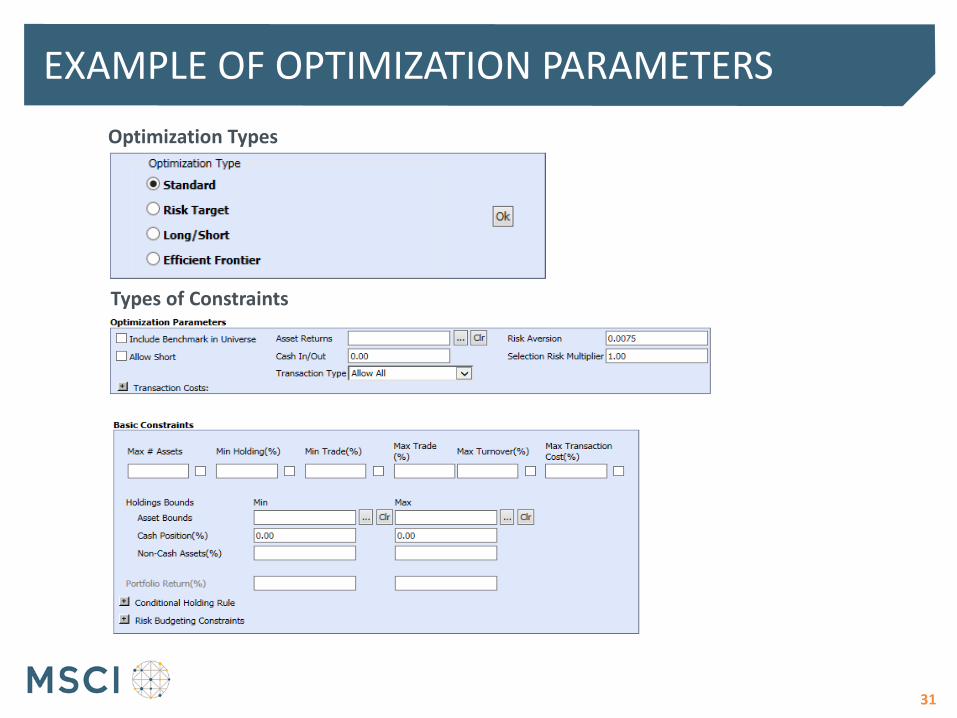
EXAMPLE OF OPTIMIZATION PARAMETERS
31
Optimization Types
Types of Constraints
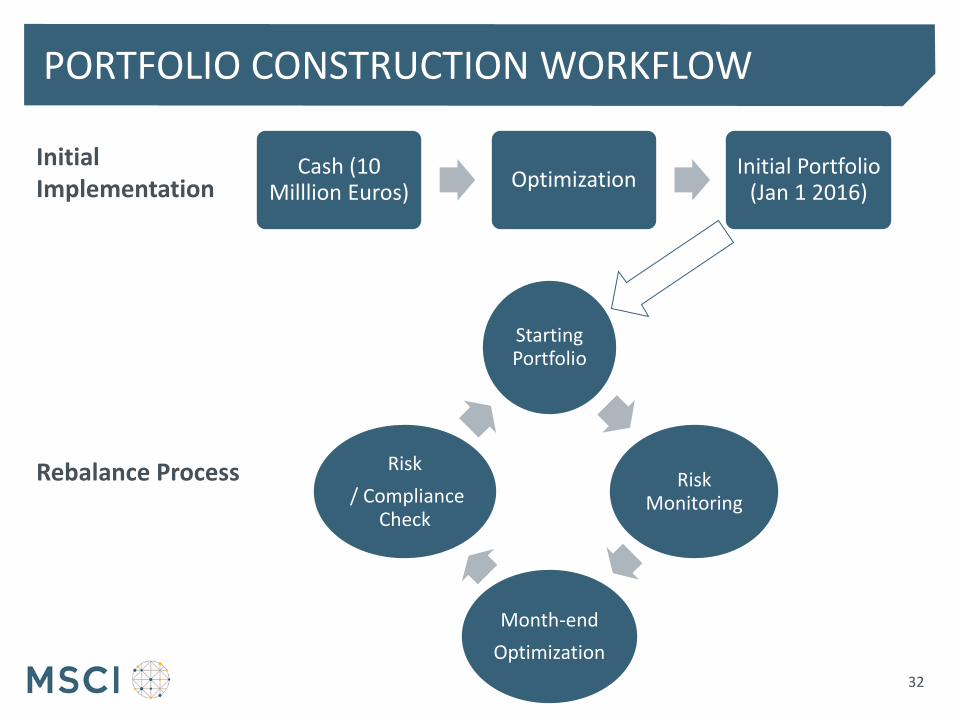
PORTFOLIO CONSTRUCTION WORKFLOW
32
Cash (10 Milllion Euros)
Optimization Initial Portfolio
(Jan 1 2016)
Starting Portfolio
Risk Monitoring
Month-end
Optimization
Risk
/ Compliance Check
Initial Implementation
Rebalance Process

PORTFOLIO CONSTRUCTION: OAS AND # OF ASSETS
33
• Portfolio OAS in excess of index OAS by 70-100 bps • Total Assets in portfolio ranges from 501 - 600
0
100
200
300
400
500
600
0
50
100
150
200
250
300
Jan-16 Feb-16 Mar-16 Apr-16 May-16 Jun-16 Jul-16 Aug-16 Sep-16 Oct-16
Ass
ets
in P
ort
folio
OA
S to
Ge
rman
Go
vt C
urv
e
OAS on Portfolio
OAS on BoAML Euro Corporate
1 OAS analytics from MSCI Index Source: BofA Merrill Lynch Global Research, used with permission

PORTFOLIO CONSTRUCTION: TRACKING ERROR
34
• Ex-ante tracking error ranges between 91 bp to 135 bps
50
70
90
110
130
150
170
190
Jan-16 Feb-16 Mar-16 Apr-16 May-16 Jun-16 Jul-16 Aug-16 Sep-16 Oct-16
Ex-A
nte
Tra
ckin
g Er
ror
(bp
s)
Ex-Ante TE vs BofAML Euro Corporate Index
PORTFOLIO CONSTRUCTION: OVER/UNDER WEIGHTS
35
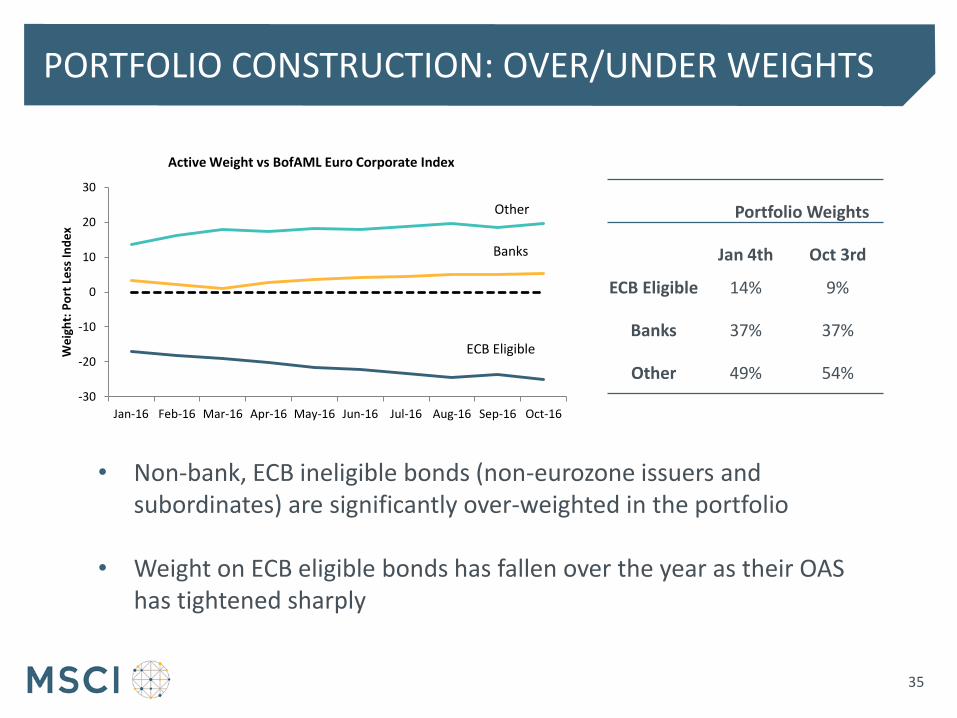
• Non-bank, ECB ineligible bonds (non-eurozone issuers and subordinates) are significantly over-weighted in the portfolio
• Weight on ECB eligible bonds has fallen over the year as their OAS
has tightened sharply
Portfolio Weights
Jan 4th Oct 3rd
ECB Eligible 14% 9%
Banks 37% 37%
Other 49% 54% -30
-20
-10
0
10
20
30
Jan-16 Feb-16 Mar-16 Apr-16 May-16 Jun-16 Jul-16 Aug-16 Sep-16 Oct-16
We
igh
t: P
ort
Le
ss I
nd
ex
Active Weight vs BofAML Euro Corporate Index
ECB Eligible
Banks
Other

TIME SERIES OF SPREAD % OF ACTIVE RISK
36
• Tracking error driven by spread risk (Average Contribution from spread = 90%) • Term Structure risk limited to a max of 10% of active risk, as per constraint
0 0.2 0.4 0.6 0.8 1 1.2 1.4 1.6
01.jan..16
01.febr..16
01.márc..16
01.ápr..16
01.máj..16
01.jún..16
01.júl..16
01.aug..16
01.szept..16
01.okt..16
01.nov..16
Spread Risk contribution to Tracking Error Volatility
Spread contribution
Tracking Error
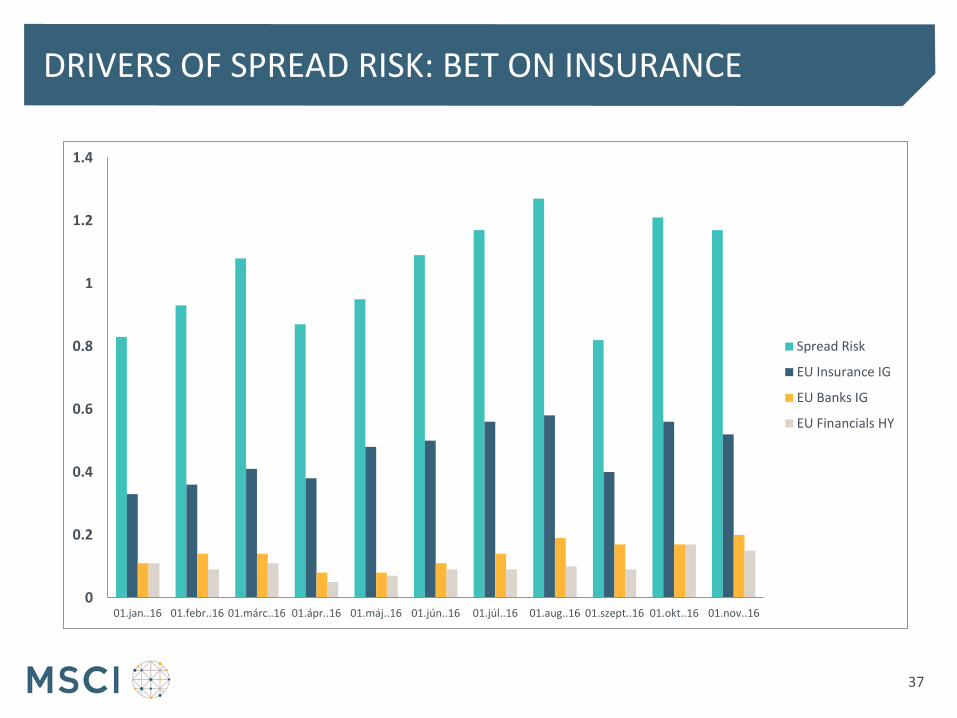
DRIVERS OF SPREAD RISK: BET ON INSURANCE
37
0
0.2
0.4
0.6
0.8
1
1.2
1.4
01.jan..16 01.febr..16 01.márc..16 01.ápr..16 01.máj..16 01.jún..16 01.júl..16 01.aug..16 01.szept..16 01.okt..16 01.nov..16
Spread Risk
EU Insurance IG
EU Banks IG
EU Financials HY
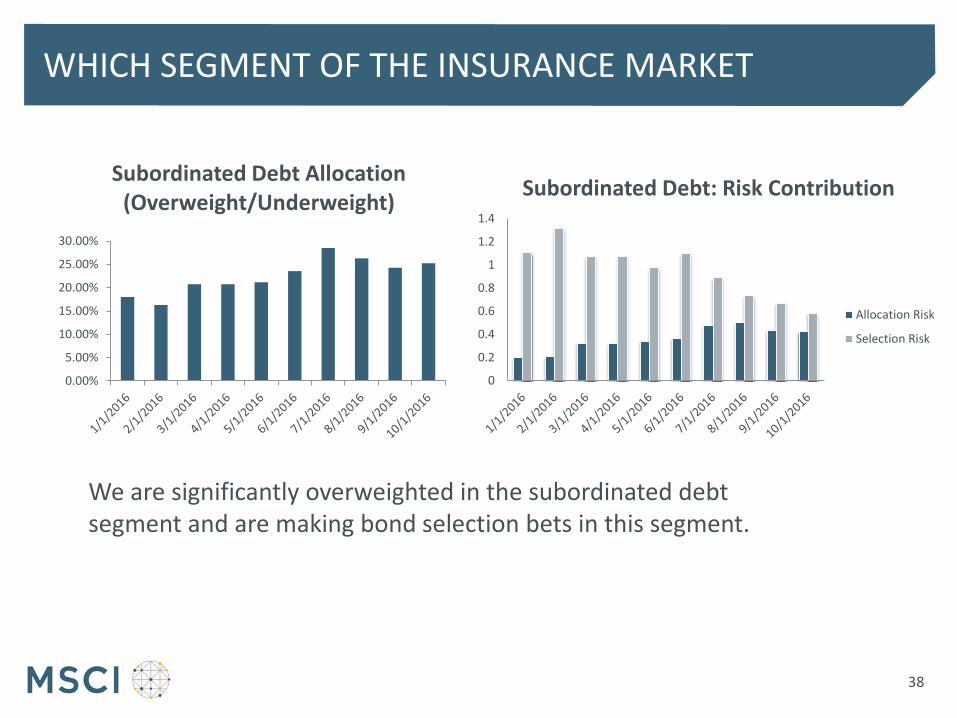
WHICH SEGMENT OF THE INSURANCE MARKET
38
0.00%
5.00%
10.00%
15.00%
20.00%
25.00%
30.00%
Subordinated Debt Allocation (Overweight/Underweight)
We are significantly overweighted in the subordinated debt segment and are making bond selection bets in this segment.
0
0.2
0.4
0.6
0.8
1
1.2
1.4
Subordinated Debt: Risk Contribution
Allocation Risk
Selection Risk
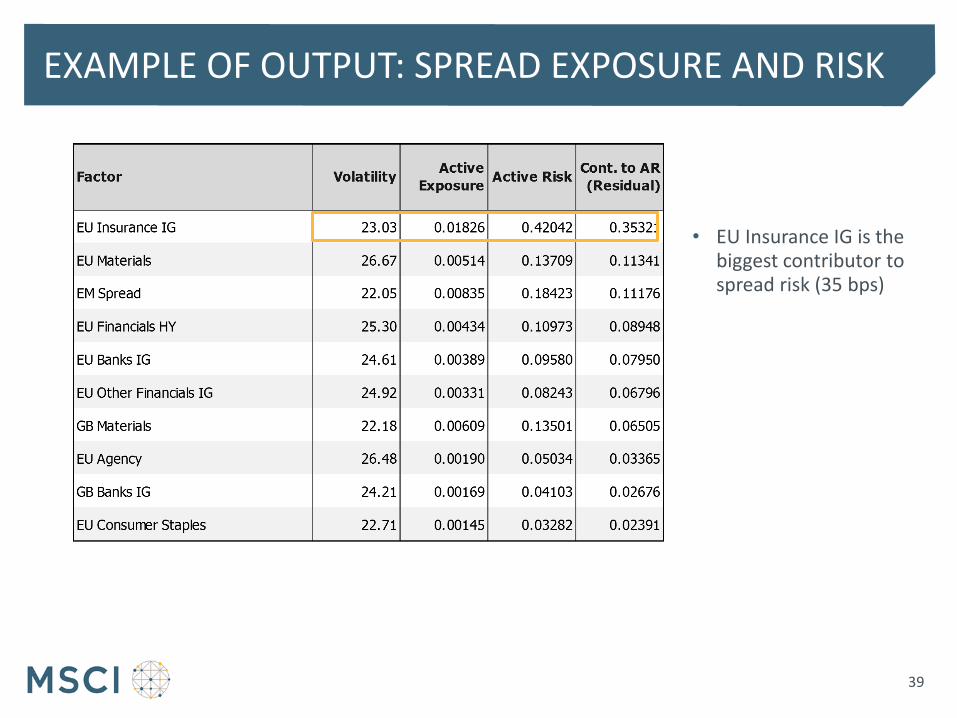
EXAMPLE OF OUTPUT: SPREAD EXPOSURE AND RISK
39
• EU Insurance IG is the biggest contributor to spread risk (35 bps)

ANALYZING TRACKING ERROR
40
• Tracking error drops substantially in September – why?
50
70
90
110
130
150
170
190
Jan-16 Feb-16 Mar-16 Apr-16 May-16 Jun-16 Jul-16 Aug-16 Sep-16 Oct-16
Ex-A
nte
Tra
ckin
g Er
ror
(bp
s)
Ex-Ante TE vs BoAML Euro Corporate Index
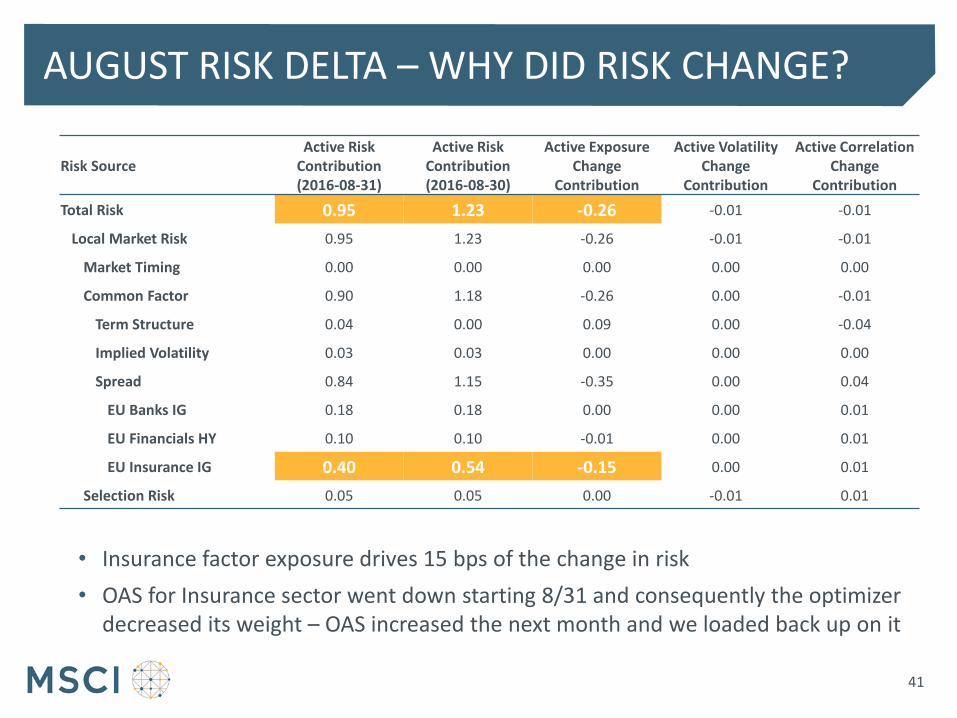
AUGUST RISK DELTA – WHY DID RISK CHANGE?
41
• Insurance factor exposure drives 15 bps of the change in risk
• OAS for Insurance sector went down starting 8/31 and consequently the optimizer decreased its weight – OAS increased the next month and we loaded back up on it
Risk Source Active Risk
Contribution (2016-08-31)
Active Risk Contribution (2016-08-30)
Active Exposure Change
Contribution
Active Volatility Change
Contribution
Active Correlation Change
Contribution
Total Risk 0.95 1.23 -0.26 -0.01 -0.01
Local Market Risk 0.95 1.23 -0.26 -0.01 -0.01
Market Timing 0.00 0.00 0.00 0.00 0.00
Common Factor 0.90 1.18 -0.26 0.00 -0.01
Term Structure 0.04 0.00 0.09 0.00 -0.04
Implied Volatility 0.03 0.03 0.00 0.00 0.00
Spread 0.84 1.15 -0.35 0.00 0.04
EU Banks IG 0.18 0.18 0.00 0.00 0.01
EU Financials HY 0.10 0.10 -0.01 0.00 0.01
EU Insurance IG 0.40 0.54 -0.15 0.00 0.01
Selection Risk 0.05 0.05 0.00 -0.01 0.01
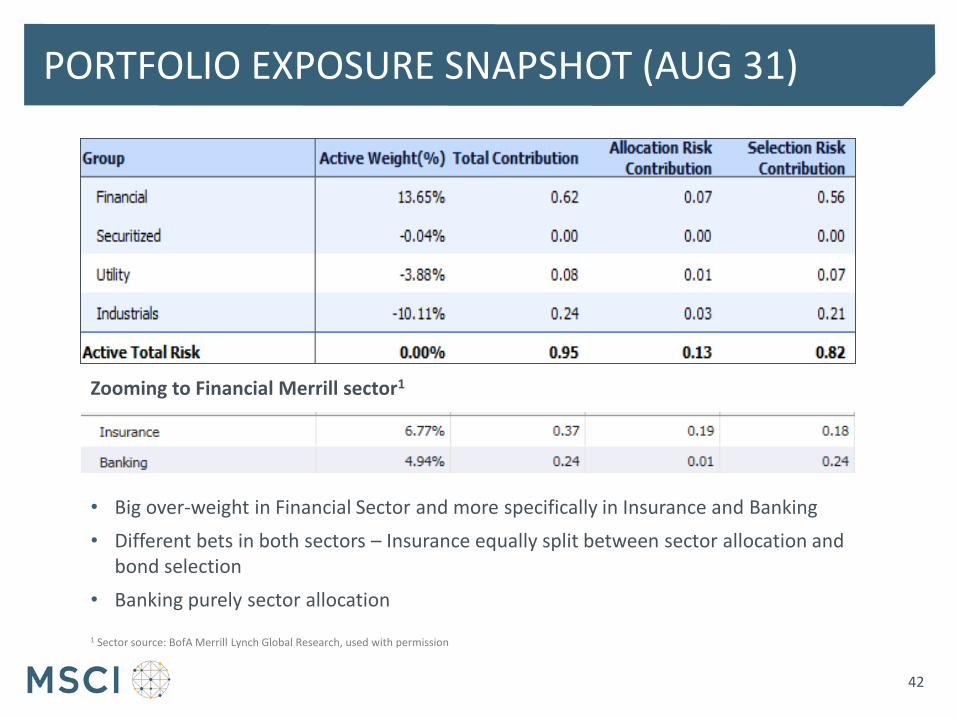
PORTFOLIO EXPOSURE SNAPSHOT (AUG 31)
42
• Big over-weight in Financial Sector and more specifically in Insurance and Banking
• Different bets in both sectors – Insurance equally split between sector allocation and bond selection
• Banking purely sector allocation
Zooming to Financial Merrill sector1
1 Sector source: BofA Merrill Lynch Global Research, used with permission
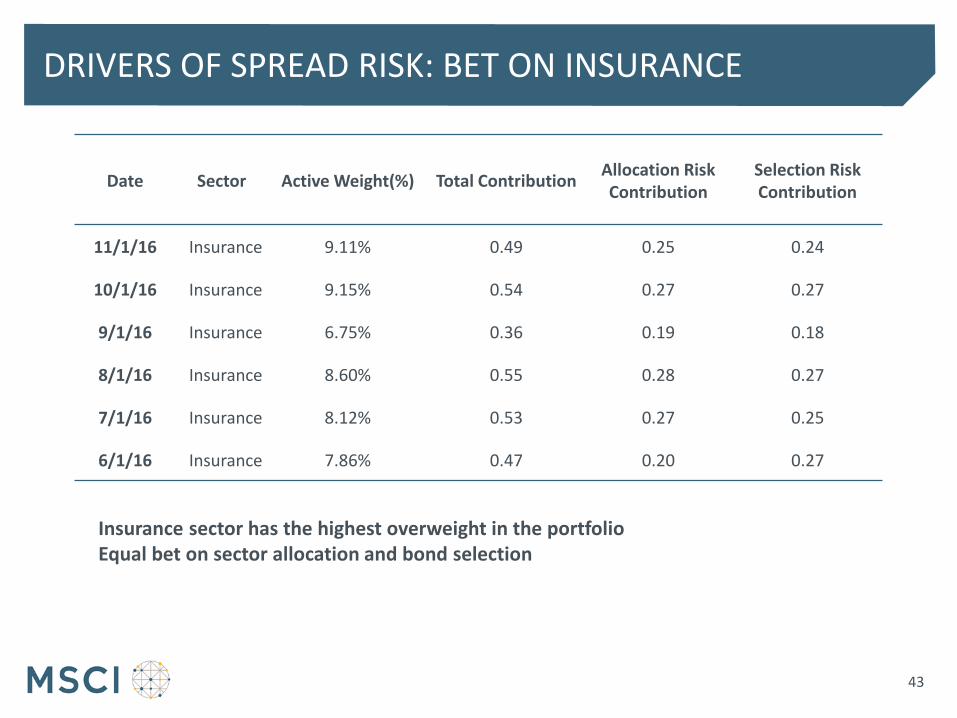
DRIVERS OF SPREAD RISK: BET ON INSURANCE
43
Date Sector Active Weight(%) Total Contribution Allocation Risk Contribution
Selection Risk Contribution
11/1/16 Insurance 9.11% 0.49 0.25 0.24
10/1/16 Insurance 9.15% 0.54 0.27 0.27
9/1/16 Insurance 6.75% 0.36 0.19 0.18
8/1/16 Insurance 8.60% 0.55 0.28 0.27
7/1/16 Insurance 8.12% 0.53 0.27 0.25
6/1/16 Insurance 7.86% 0.47 0.20 0.27
Insurance sector has the highest overweight in the portfolio Equal bet on sector allocation and bond selection

SUMMARY OF KEY TAKEAWAYS
44
• The high OAS spread strategy subject to constraints has been consistently applied for each month in 2016 YTD
• Over the course of the year, the optimizer increased the weight on ECB ineligible, non-bank bonds (particularly subordinates from the Insurance sector) and reduced the weight on ECB eligible bonds
• As of the end of October: − The portfolio was overweighting the ECB ineligible, non-bank sector
by 19 percentage points and was underweighting the ECB eligible sector by 25 percentage points
− Insurance and Banking comprised almost two-thirds of the portfolio’s active risk

ANALYZING A STRATEGY FOR EUROPEAN CORPORATES:
45
Background
Portfolio Construction
Performance Analysis

How can I attribute the performance of a credit spread strategy?
How did the ECB’s Corporate Sector Purchase Program (CSPP) impact the market?
How does MSCI’s solution allow us to smoothly transition from our current system and what is your roadmap?
QUESTIONS ON OUR CLIENTS’ MINDS
Answering these questions requires a Fixed Income Performance Attribution solution that is accurate, granular, and flexible
46

INTEGRATED ANALYSIS ON ONE SYSTEM
• Impossible to carry out risk and performance attribution in an integrated fashion if multiple systems are used from separate vendors
47
• Holdings & transactions loaded into one system only
• Multiple Analytics Solutions
• Increased efficiency and reduced total cost of software
HISTORICAL MARKET DATA, INDEX DATA AND TERMS AND CONDITIONS
REPORTING
PRICING

CORRESPONDENCE BETWEEN RISK AND PERFORMANCE
• Sources of risk correspond to drivers of return
• Carry corresponds to the “knowable” portion of return
• Risk is in excess of carry
Active Return
Currency
Return
Local
Return
Carry
Return
Unexplained Return
Spread Change Return
Paydown Return
Term Structure Change Return
Ex Ante to Ex Post
48
Active Risk
Currency
Risk
Local
Risk
Specific
Risk Spread Risk
Prepayment
Risk
Term Structure Risk
Active Base Return
Model Base Return
Currency Return
Local Return
Income Return
Paydown Return
Clean Price Return
Rolldown Term
Structure Change
TS 1 Key Rate Return
…
TS n Key Rate Return
Spread Change
Spread Market
Exposure
Spread Allocation
Spread Selection
Unexplained
Trading Impact
Pricing Impact
Look Through Impact
Benchmark Residual
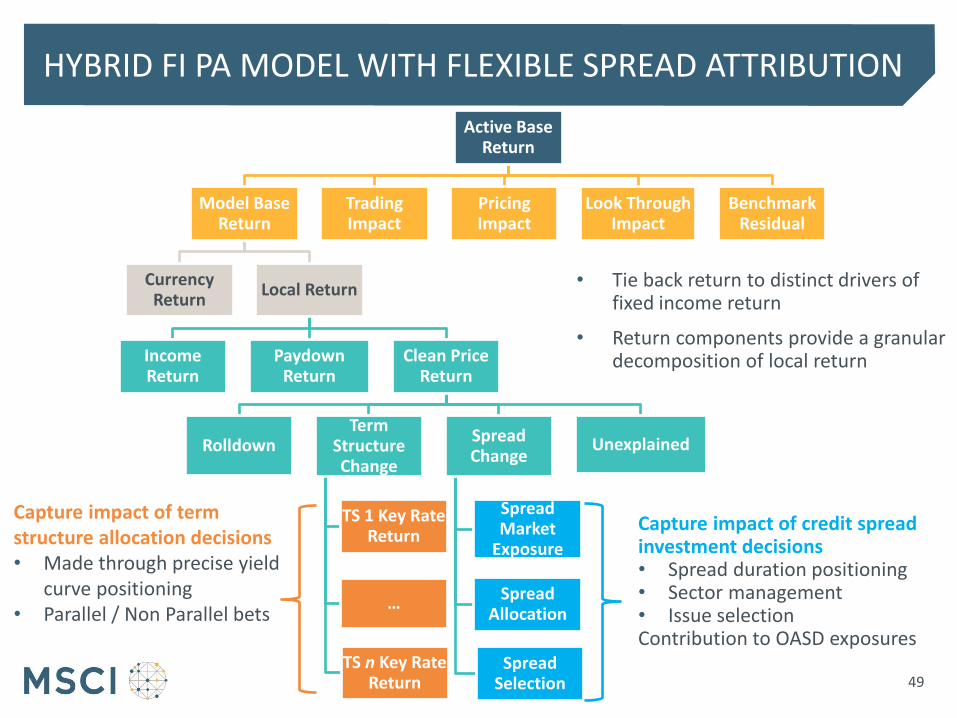
HYBRID FI PA MODEL WITH FLEXIBLE SPREAD ATTRIBUTION
49
Capture impact of credit spread investment decisions • Spread duration positioning • Sector management • Issue selection Contribution to OASD exposures
Capture impact of term structure allocation decisions • Made through precise yield
curve positioning • Parallel / Non Parallel bets
• Tie back return to distinct drivers of fixed income return
• Return components provide a granular decomposition of local return
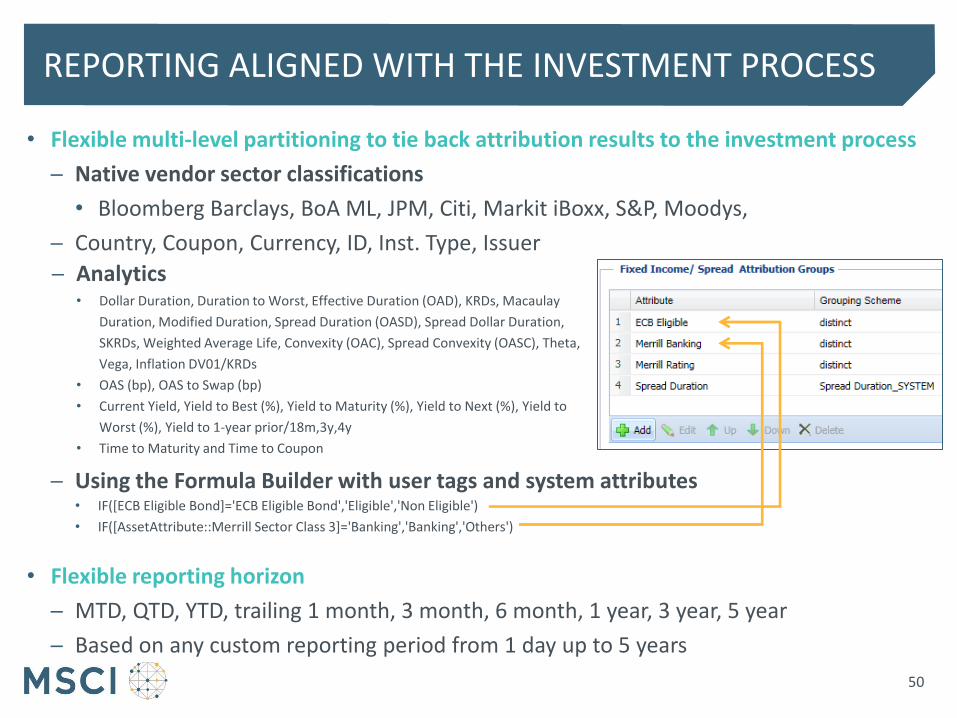
• Flexible multi-level partitioning to tie back attribution results to the investment process
─ Native vendor sector classifications
• Bloomberg Barclays, BoA ML, JPM, Citi, Markit iBoxx, S&P, Moodys,
─ Country, Coupon, Currency, ID, Inst. Type, Issuer
─ Using the Formula Builder with user tags and system attributes • IF([ECB Eligible Bond]='ECB Eligible Bond','Eligible','Non Eligible')
• IF([AssetAttribute::Merrill Sector Class 3]='Banking','Banking','Others')
• Flexible reporting horizon
─ MTD, QTD, YTD, trailing 1 month, 3 month, 6 month, 1 year, 3 year, 5 year
─ Based on any custom reporting period from 1 day up to 5 years
─ Analytics • Dollar Duration, Duration to Worst, Effective Duration (OAD), KRDs, Macaulay
Duration, Modified Duration, Spread Duration (OASD), Spread Dollar Duration,
SKRDs, Weighted Average Life, Convexity (OAC), Spread Convexity (OASC), Theta,
Vega, Inflation DV01/KRDs
• OAS (bp), OAS to Swap (bp)
• Current Yield, Yield to Best (%), Yield to Maturity (%), Yield to Next (%), Yield to
Worst (%), Yield to 1-year prior/18m,3y,4y
• Time to Maturity and Time to Coupon
REPORTING ALIGNED WITH THE INVESTMENT PROCESS
50
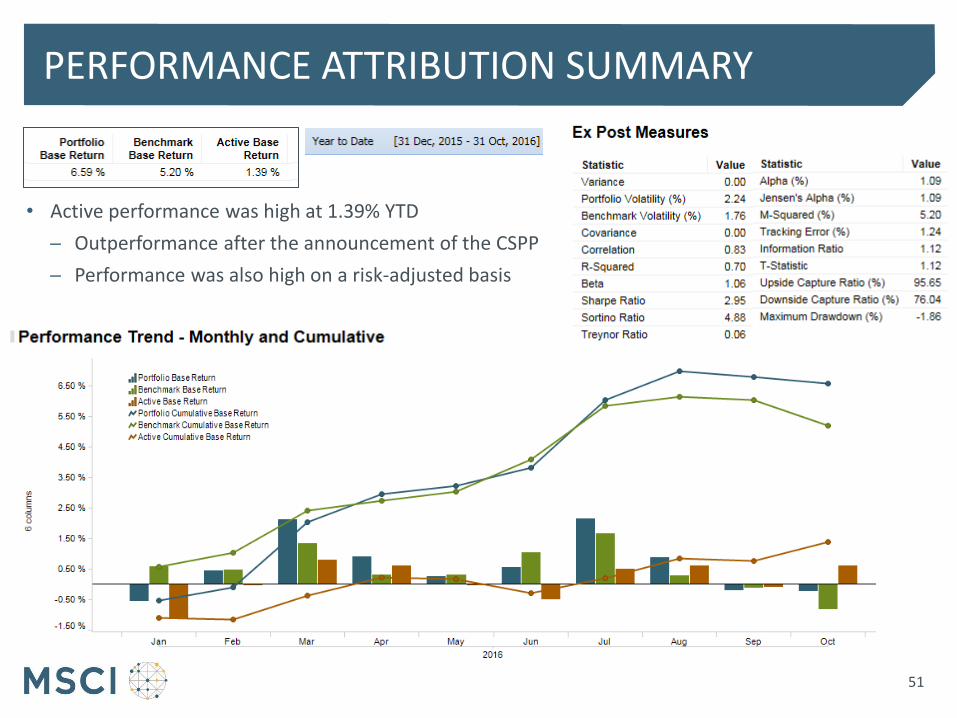
• Active performance was high at 1.39% YTD
─ Outperformance after the announcement of the CSPP
─ Performance was also high on a risk-adjusted basis
PERFORMANCE ATTRIBUTION SUMMARY
51
IMPACT OF SPREAD MANAGEMENT DECISIONS
52
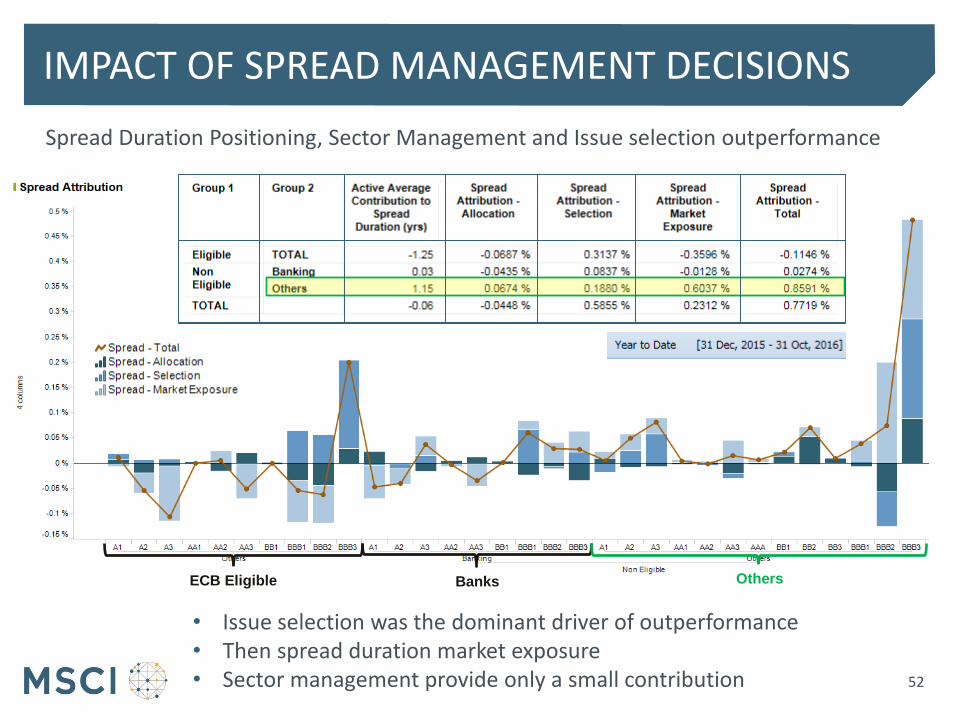
Spread Duration Positioning, Sector Management and Issue selection outperformance
ECB Eligible Banks
• Issue selection was the dominant driver of outperformance • Then spread duration market exposure • Sector management provide only a small contribution
Others
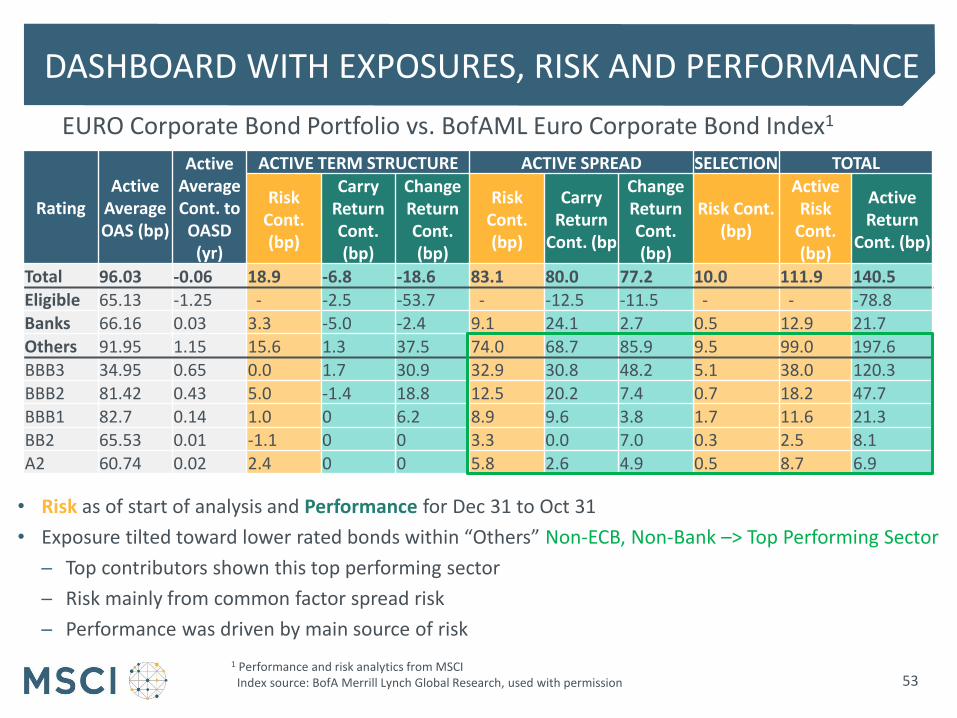
EURO Corporate Bond Portfolio vs. BofAML Euro Corporate Bond Index1
DASHBOARD WITH EXPOSURES, RISK AND PERFORMANCE
Source: MSCI
53
Rating Active
Average OAS (bp)
Active Average Cont. to
OASD (yr)
ACTIVE TERM STRUCTURE ACTIVE SPREAD SELECTION TOTAL
Risk Cont. (bp)
Carry Return Cont. (bp)
Change Return Cont. (bp)
Risk Cont. (bp)
Carry Return
Cont. (bp
Change Return Cont. (bp)
Risk Cont. (bp)
Active Risk
Cont. (bp)
Active Return
Cont. (bp)
Total 96.03 -0.06 18.9 -6.8 -18.6 83.1 80.0 77.2 10.0 111.9 140.5 Eligible 65.13 -1.25 - -2.5 -53.7 - -12.5 -11.5 - - -78.8 Banks 66.16 0.03 3.3 -5.0 -2.4 9.1 24.1 2.7 0.5 12.9 21.7 Others 91.95 1.15 15.6 1.3 37.5 74.0 68.7 85.9 9.5 99.0 197.6 BBB3 34.95 0.65 0.0 1.7 30.9 32.9 30.8 48.2 5.1 38.0 120.3
BBB2 81.42 0.43 5.0 -1.4 18.8 12.5 20.2 7.4 0.7 18.2 47.7 BBB1 82.7 0.14 1.0 0 6.2 8.9 9.6 3.8 1.7 11.6 21.3 BB2 65.53 0.01 -1.1 0 0 3.3 0.0 7.0 0.3 2.5 8.1
A2 60.74 0.02 2.4 0 0 5.8 2.6 4.9 0.5 8.7 6.9
• Risk as of start of analysis and Performance for Dec 31 to Oct 31
• Exposure tilted toward lower rated bonds within “Others” Non-ECB, Non-Bank –> Top Performing Sector
─ Top contributors shown this top performing sector
─ Risk mainly from common factor spread risk
─ Performance was driven by main source of risk
1 Performance and risk analytics from MSCI Index source: BofA Merrill Lynch Global Research, used with permission

PRICING IMPACT & TRADING IMPACT DASHBOARD
54
Pricing Impact from different price sources for common assets in the portfolio & benchmark, attribution in summary and for drilldown at asset, and group level
Trading Impact from differences in traded prices and closing prices – also available down to position-level attribution
Active Base Return 139 bps
Model Base Return
140.5 bps
Currency Return
Local Return 140.5 bps
Income Return 42.8 bps
Paydown Return 0.1 bps
Clean Price Return 97.6 bps
Rolldown 30.4 bps
Term Structure Change
-18.6 bps
Parallel -18.8 bps
Non Parallel 0.2 bps
Spread Change 77.2 bps
Spread Market Exposure 23.1 bps
Spread Allocation
-4.5 bps
Spread Selection 58.6 bps
Unexplained 8.6 bps
Trading Impact Pricing Impact
-1.5 bps Look Through
Impact Benchmark
Residual
HYBRID FI PA MODEL WITH FLEXIBLE SPREAD ATTRIBUTION
55
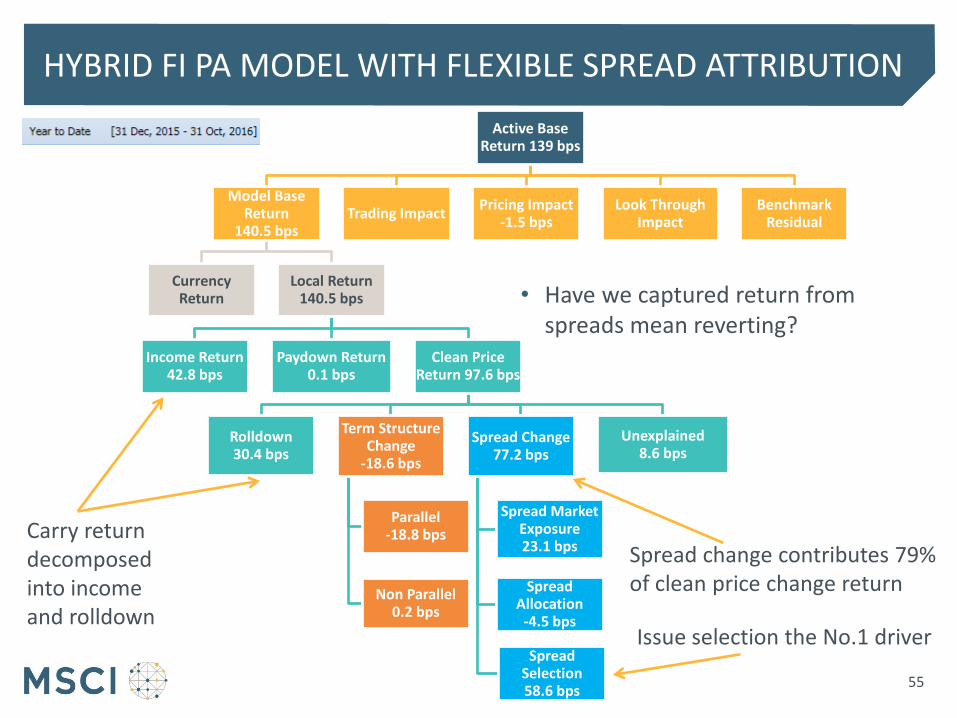
• Have we captured return from spreads mean reverting?
Spread change contributes 79% of clean price change return
Issue selection the No.1 driver
Carry return decomposed into income and rolldown
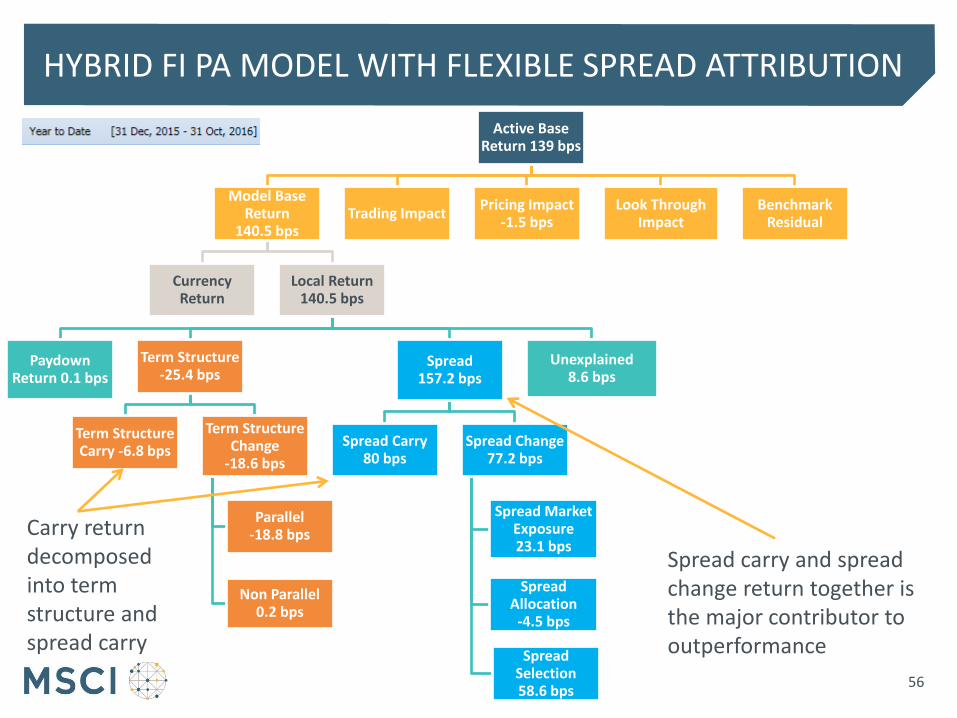
Active Base Return 139 bps
Model Base Return
140.5 bps
Currency Return
Local Return 140.5 bps
Paydown Return 0.1 bps
Term Structure -25.4 bps
Term Structure Carry -6.8 bps
Term Structure Change
-18.6 bps
Parallel -18.8 bps
Non Parallel 0.2 bps
Spread 157.2 bps
Spread Carry 80 bps
Spread Change 77.2 bps
Spread Market Exposure 23.1 bps
Spread Allocation
-4.5 bps
Spread Selection 58.6 bps
Unexplained 8.6 bps
Trading Impact Pricing Impact
-1.5 bps Look Through
Impact Benchmark
Residual
HYBRID FI PA MODEL WITH FLEXIBLE SPREAD ATTRIBUTION
56
Spread carry and spread change return together is the major contributor to outperformance
Carry return decomposed into term structure and spread carry

• Term Structure Change Return ─ Captured using an exposure-based approach
─ Return due to term structure exposure and observed shift at each rate in the relevant curve
─ Decomposed into term structure key rate returns
Key-Rate Duration at key rate k
• Insight into term structure key rate returns
─ Positive if key rates decrease
─ Negative if key rates increase
─ Magnitude depends on the sensitivity
Change in key rate k
, , , , ,
1
ΔK
term structure
j t k j t k j t
k
R KRD y
, , , , , ,Δkey rate
k j t k j t k j tR KRD y
TERM STRUCTURE CHANGE RETURN
57
58
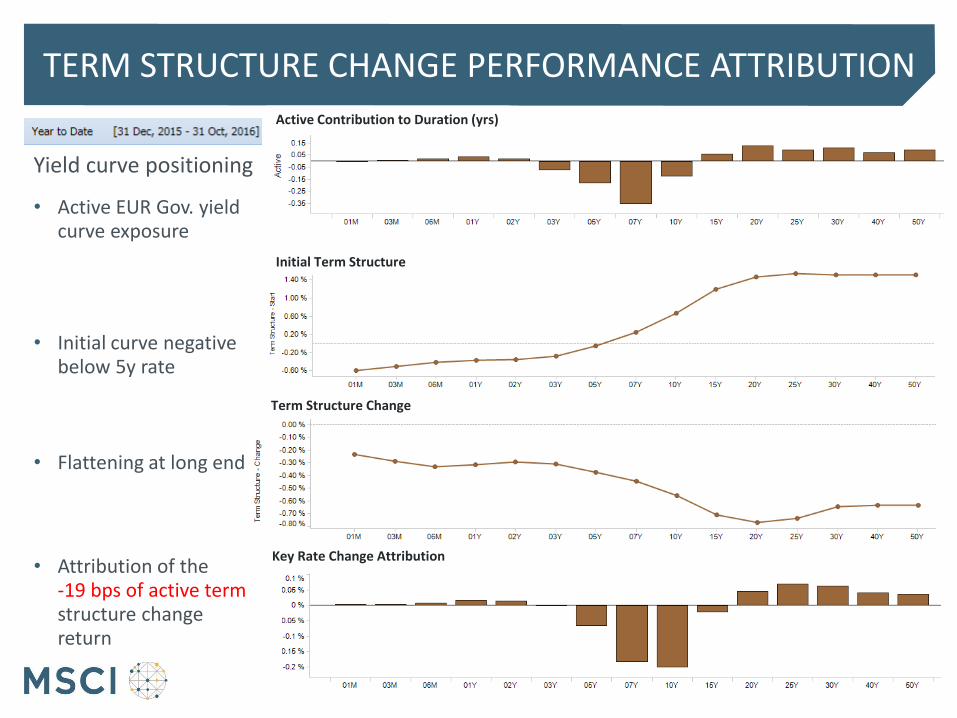
Yield curve positioning
TERM STRUCTURE CHANGE PERFORMANCE ATTRIBUTION
• Active EUR Gov. yield curve exposure
• Initial curve negative below 5y rate
• Flattening at long end
• Attribution of the -19 bps of active term structure change return
Initial Term Structure
Term Structure Change
Active Contribution to Duration (yrs)
Key Rate Change Attribution
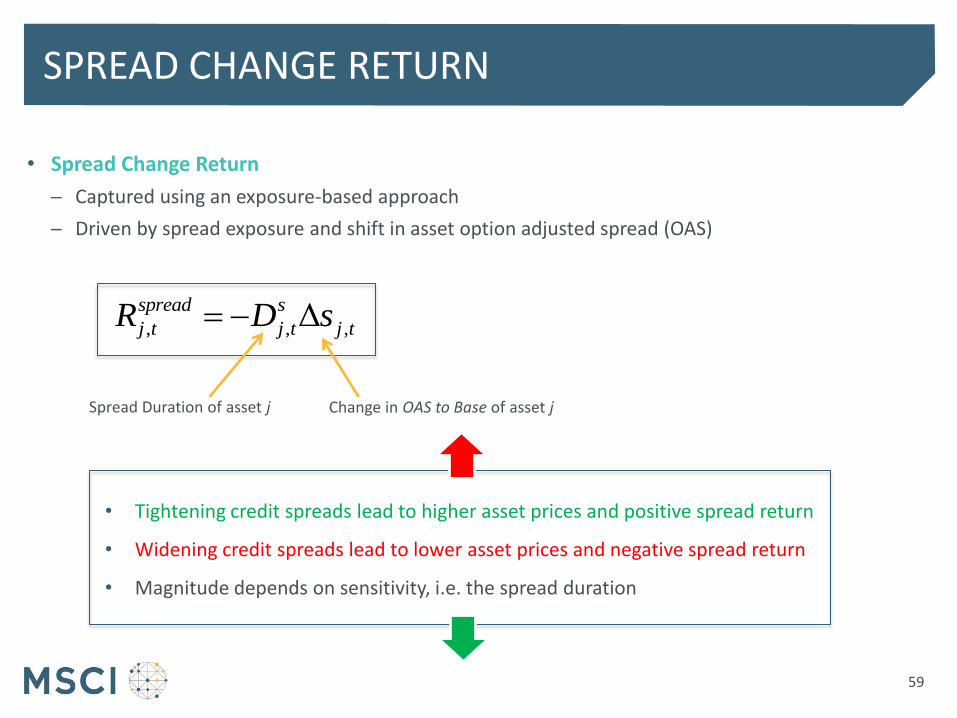
• Spread Change Return
─ Captured using an exposure-based approach
─ Driven by spread exposure and shift in asset option adjusted spread (OAS)
• Tightening credit spreads lead to higher asset prices and positive spread return
• Widening credit spreads lead to lower asset prices and negative spread return
• Magnitude depends on sensitivity, i.e. the spread duration
Spread Duration of asset j Change in OAS to Base of asset j
, , ,Δs
j t j t j t
spreadR D s
SPREAD CHANGE RETURN
59
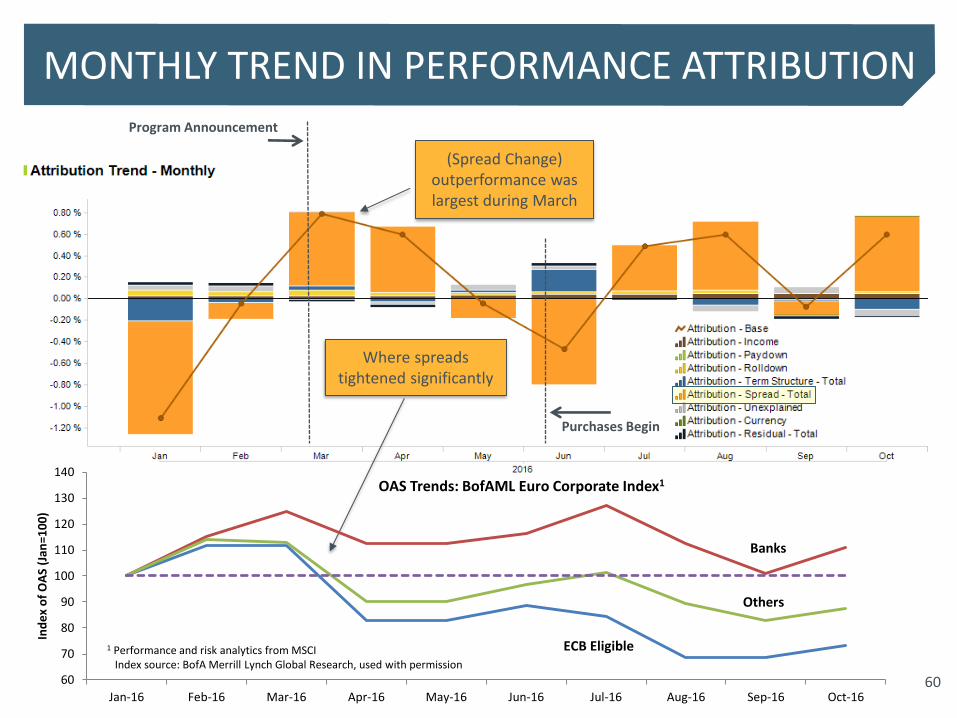
MONTHLY TREND IN PERFORMANCE ATTRIBUTION
Where spreads tightened significantly
60
(Spread Change) outperformance was largest during March
60
70
80
90
100
110
120
130
140
Jan-16 Feb-16 Mar-16 Apr-16 May-16 Jun-16 Jul-16 Aug-16 Sep-16 Oct-16
Ind
ex
of
OA
S (J
an=1
00
)
OAS Trends: BofAML Euro Corporate Index1
ECB Eligible
Banks
Others
1 Performance and risk analytics from MSCI Index source: BofA Merrill Lynch Global Research, used with permission
Program Announcement
Purchases Begin

• March: all spreads tightened, all sectors gained
─ 135 bps benchmark return
─ 155 bps from changes in spreads
HOW DID THE ECB’S CSPP PROGRAM IMPACT THE MARKET (INDEX)?
Benchmark Contribution to OASD (yrs)
Change in OAS (bp)
Benchmark Spread Change Contribution
Average OAS (bp)
ECB Eligible Banks Others
• Largest exposure to Non-Eligible Non-Bank bonds (Others)
─ Spreads decreased by 41bps from 180 bps
─ Gained 70 bps in spread contribution
• ECB bonds gained 54 bps, and Banks 31 bps
61
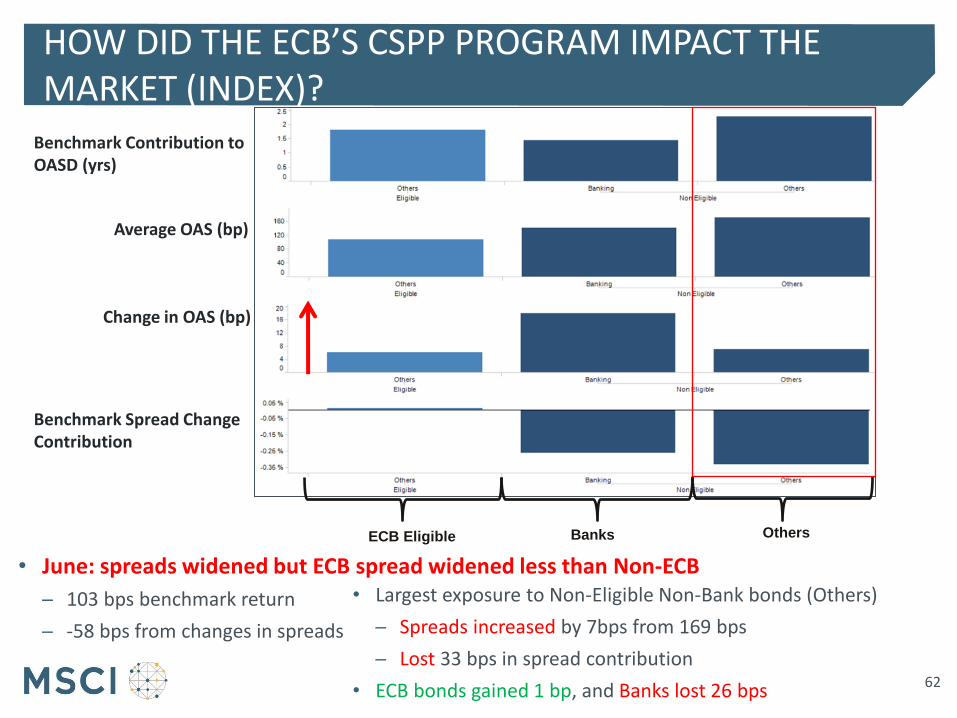
• June: spreads widened but ECB spread widened less than Non-ECB
─ 103 bps benchmark return
─ -58 bps from changes in spreads
HOW DID THE ECB’S CSPP PROGRAM IMPACT THE MARKET (INDEX)?
Benchmark Contribution to OASD (yrs)
Change in OAS (bp)
Benchmark Spread Change Contribution
Average OAS (bp)
ECB Eligible Banks Others
• Largest exposure to Non-Eligible Non-Bank bonds (Others)
─ Spreads increased by 7bps from 169 bps
─ Lost 33 bps in spread contribution
• ECB bonds gained 1 bp, and Banks lost 26 bps
62
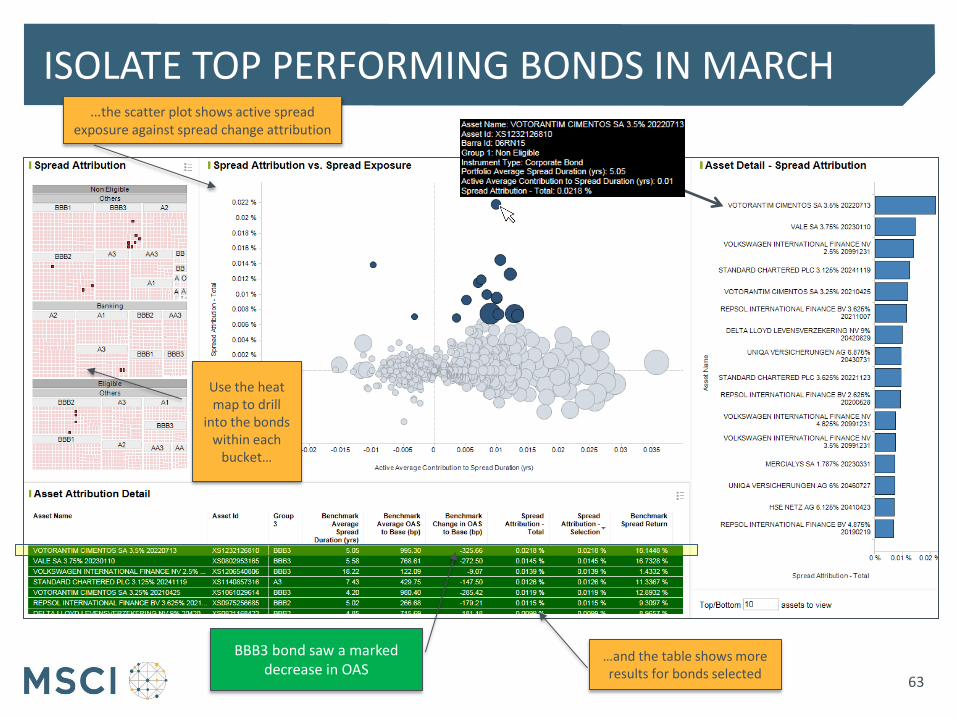
ISOLATE TOP PERFORMING BONDS IN MARCH
Use the heat map to drill
into the bonds within each
bucket…
…the scatter plot shows active spread exposure against spread change attribution
…and the table shows more results for bonds selected
63
BBB3 bond saw a marked decrease in OAS
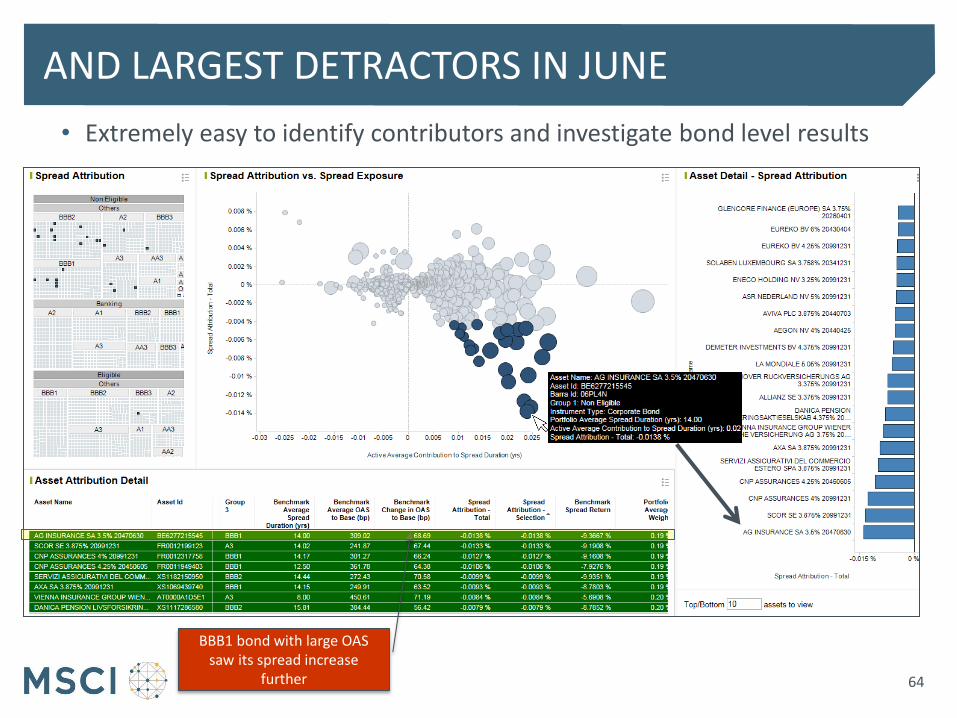
AND LARGEST DETRACTORS IN JUNE
64
BBB1 bond with large OAS saw its spread increase
further
• Extremely easy to identify contributors and investigate bond level results

• Investment strategy to select high OAS bonds outperformed the benchmark
─ Issue selection was the dominant driver of outperformance
─ Overweighting high OAS, non-ECB non-bank paid off in the long run
─ Performance was driven by main source of risk
─ Could have neutralized term structure risk better
• The ECB’s CSPP program impacted the whole market
─ All spreads tightened initially particularly ECB eligible bonds
─ March: Non-ECB bonds largest contributor to market performance
─ June: Non-ECB bonds largest detractor to market performance
SUMMARY OF RESULTS
65

PERFORMANCE ANALYTICS ROADMAP
66

MODEL EVOLUTION: CONSISTENT INVESTMENT IN FI ANALYTICS
67
• 2008 ─ Initial FI PA model released, term structure KRD effects & allocated spread return from residual
• 2011 ─ Returns Calculator introduced for limited instrument types
• 2013 ─ Income, Paydown, and Rolldown Return ─ Index data integrity ensured for 20,000+ indexes across 30+ vendors ─ Returns Calculator coverage expanded to 100+ instrument types ─ Look through for futures, composite, swaps & forwards
• 2014 ─ Visualization dashboards and returns/attribution results storage ─ Spread change return captured explicitly using change in OAS and spread duration ─ Multi-level portfolio partitioning, & 60+ FI-specific system grouping schemes
• 2016 ─ Transaction-based and trading impact ─ Price source flexibility and Pricing Impact ─ Precomputed analytics for common FI indexes ─ Currency hedging, Spread return for credit derivatives, Callable bonds valued to next call date
• 2017 ─ Term Structure Carry, Spread Carry, Convexity, Spread Convexity, repriced TS and OAS effects ─ DTS mismatch, DTS common factors, alignment with FI400 risk model, BEI, Implied Vol, Basis
1st
2nd
3rd
4th

FI PA PRODUCT DEVELOPMENT STRATEGY
68
Add flexibility, extend granularity and accuracy with reduction in unexplained return
Strategic model enhancements to help ensure a smooth transition for POINT clients*
More enhancements to be added in 2017
Existing FI PA model is used extensively by many BarraOne clients
2016 2017
• DTS Attribution • Further consistency
with FI400 risk model • RiskServer valuations
in PA
*Enhancements also benefit existing clients and clients switching from any vendor
4th Generation Fixed Income Performance Attribution

CARRY RETURN DECOMPOSITION & ENHANCED CURVE CHANGE AND SPREAD CHANGE DECOMPOSITION: UAT Q4 2016
69 69
• Add flexibility, extend granularity and
accuracy with reduction in unexplained
return
• Introducing:
─ Carry Return Decomposition
• Term Structure Carry, Spread Carry Return
• Income, Pull-to-Par, Rolldown Return
─ Term Structure Change Return &
Spread Change Return
• More accurate using repricing
• More granular with convexity, duration
and “rest of”
─ Unexplained Return reduced
• Highlighted results will be different from
the 3rd generation FI PA model
Illustrative results for a corporate bond

CARRY RETURN DECOMPOSITION & ENHANCED CURVE CHANGE AND SPREAD CHANGE DECOMPOSITION: UAT Q4 2016
70 70
Illustrative results for a corporate bond
• Alternative decompositions according
to investment process & granularity
required
─ Carry return distinct from market change
return or within overall term structure
and spread return
• View impact of time and market
change within curve and spread return
• Or separate out carry and market
change impact & view income,
rolldown and pull-to-par
• Highlighted results will be different
from the 3rd generation FI PA model
Base Return
Model Base Return
Currency Return
Local Return
Paydown Return
Term Structure Return
Term Structure Carry Return
Term Structure Change Return
Term Structure KRD Return
Term Structure Convexity
Return
Rest of TS Return
Spread Return
Spread Carry Return
Spread Carry Allocation
Spread Carry Selection
Spread Change Return*
DTS Beta / Mismatch
DTS Allocation
DTS Selection
Unexplained Return
Trading Impact
Pricing Impact
Look Through Impact
Explain relative spread change return using allocation-selection modified with contribution to DTS weights
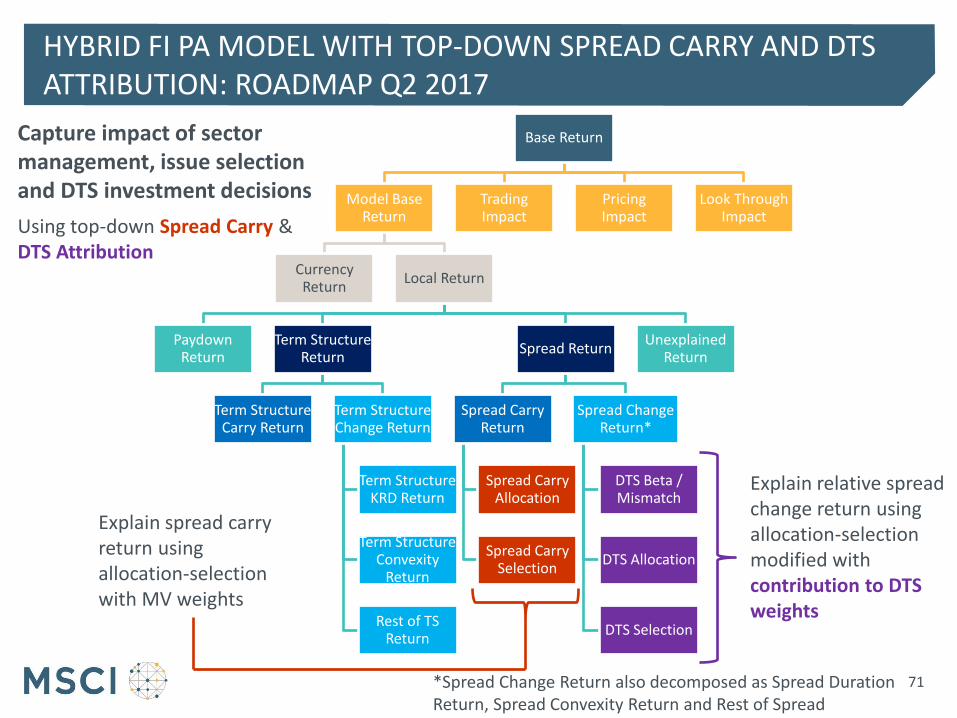
HYBRID FI PA MODEL WITH TOP-DOWN SPREAD CARRY AND DTS ATTRIBUTION: ROADMAP Q2 2017
71
Explain spread carry return using allocation-selection with MV weights
Using top-down Spread Carry & DTS Attribution
Capture impact of sector management, issue selection and DTS investment decisions
*Spread Change Return also decomposed as Spread Duration Return, Spread Convexity Return and Rest of Spread

Base Return
Model Base Return
Currency Return
Local Return
Paydown Return
Term Structure Return
Term Structure Carry Return
Term Structure Change Return
Term Structure KRD Return
Term Structure Convexity
Return
Rest of TS Return
Spread Return
Spread Carry Return
Spread Change Return
DTS Common Factor Return
Idiosyncratic Return
Unexplained Return
Trading Impact
Pricing Impact
Look Through Impact
HYBRID FI PA MODEL WITH COMMON FACTOR-BASED DTS ATTRIBUTION: ROADMAP H2 2017
72
Explain spread change return DTS common factor returns precisely aligned with FI400 risk model
Using common factor-based DTS Attribution
Capture impact of FI400 common factor exposure
BEI, Implied Vol, and Basis Return also on the roadmap for H2 2017

Active Base Return
Model Base Return
Carry Return
Currency Return
Currency Excess
Explicit Implicit
Cross Product
Local Excess
Market Timing
Local Residual
Allocation Selection
Common Factor
Equity
Industry Style
Fixed Income
Key Rates BEI Swap
Spread DTS Basis
IR Volatility
Alternatives
Commodity Hedge Fund
Equity Volatility Futures
Private Real
Estate
Private Equity
Country World
Specific Return
Trading Impact
Pricing Impact
Look Through Impact
Benchmark Residual
• Research in Progress ─ Plan to support all sources
of MIM common factor risk in Performance Attribution
• Equity factors already supported
• Support FI400 common factors
• Support private and HF common factors once data availability improves
INCORPORATING FIXED INCOME FI400 FACTORS AND MIM FACTORS IN PERFORMANCE ATTRIBUTION
73
Aligned with FI400 risk model Prerequisite: Valuation and Returns data
Feasible to begin support for “Core” factors once FI400 common factors are incorporated

SUMMARY
• Performance Attribution for Credit Portfolios
─ Best-of-breed solution, integrated with risk, with ongoing investment enables a smooth transition from current systems
─ Flexible FI PA model captures drivers of return with reporting aligned with your investment process
─ Built on strong foundations: benchmark data integrity, market data, asset coverage, valuation engine, price source flexibility, pricing impact, trading impact
Blog: What is the future of the ECB’s corporate bond program? Whitepaper: Analyzing Credit Alpha in an Integrated Risk and Performance Analysis
74

PERFORMANCE ANALYTICS SOLUTIONS
75
MODELS
Classic Attribution
Allocation, selection, interaction and currency explanation, equity & MAC
Equity Factor Attribution
Align sources of equity risk and return using Barra factor models
Fixed Income Attribution
Income, paydown, carry, pull-to-par, rolldown, term structure, spread return drivers captured
Multi-Portfolio Attribution
Strategic and tactical allocation, manager selection, benchmark & currency mismatch
DATA
Data Availability
• Reconciled benchmark data for 20,000+ fixed income, equity & commodity indexes
• Daily market data
• Fixed income terms and conditions
• Calculated returns and analytics for 100+ instrument types
Data Management
• Portfolio administration capability
• Management of user data and terms and conditions
• Full user control of data import and export
DELIVERY
Reporting
• Automated batch reporting
• Flexible to align with any investment process
• Trading impact & Pricing Impact
• Contribution/attribution from portfolio to asset level
• Look through into swaps, forwards, futures and composites
• Currency hedging
Visualization
• Deep insight through interactive dashboards
• View, analyze, and communicate results
• Processed automatically based on latest market, vendor and portfolio data
• MEASUREMENT – Portfolio gross/net return and attribution of intra-day P&L using asset-level transactions
• ATTRIBUTION – Granular attribution models covering all asset classes
• APPRAISAL – Ex post risk and risk-adjusted return measures
Best-of-Breed Solution for Fixed Income & Multi-Asset Class Integrated Risk and Performance Analytics

CLOSING REMARKS
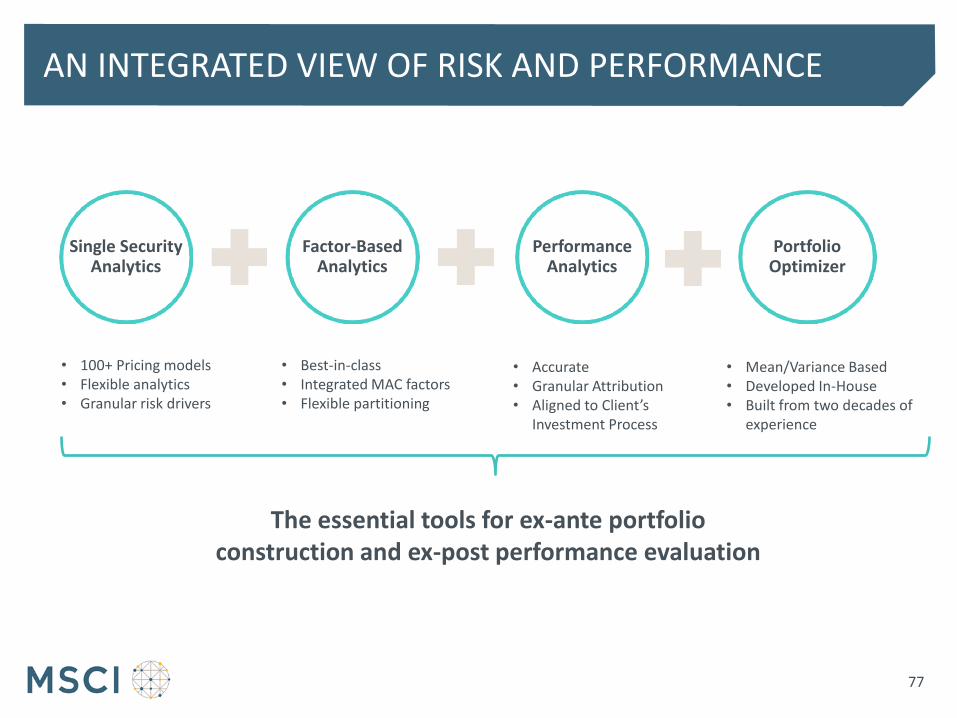
AN INTEGRATED VIEW OF RISK AND PERFORMANCE
77
Single Security Analytics
Factor-Based Analytics
Performance Analytics
Portfolio Optimizer
• 100+ Pricing models • Flexible analytics • Granular risk drivers
• Best-in-class • Integrated MAC factors • Flexible partitioning
• Accurate • Granular Attribution • Aligned to Client’s
Investment Process
• Mean/Variance Based • Developed In-House • Built from two decades of
experience
The essential tools for ex-ante portfolio construction and ex-post performance evaluation

APPENDIX
• Additional Performance Attribution Capabilities
• MSCI
• Disclaimers and Rights of Use
78
ADDITIONAL PERFORMANCE ATTRIBUTION CAPABILITIES
79

BENCHMARK DATA INTEGRITY AND INDEX COVERAGE
80
Daily reconciled index and constituent returns for +20,000 indexes from +30 vendors
Fixed Income
─ Bloomberg Barclays, BoA ML, JP Morgan, Markit iBoxx, Citigroup, Nomura, FTSE, Nikko, SIX Swiss, Thompson Reuters, Bloomberg Aus Bond, China Bond, HSBC, UBS
Equity
─ MSCI, S&P, FTSE, Russell, Australia-ASX, NASDAQ, Russell Nomura, STOXX, TOPIX
Commodity
─ Bloomberg, Deutsche Borse, S&P
Reconciliation from at least January 1, 2009, in general and more recently for newly added indexes
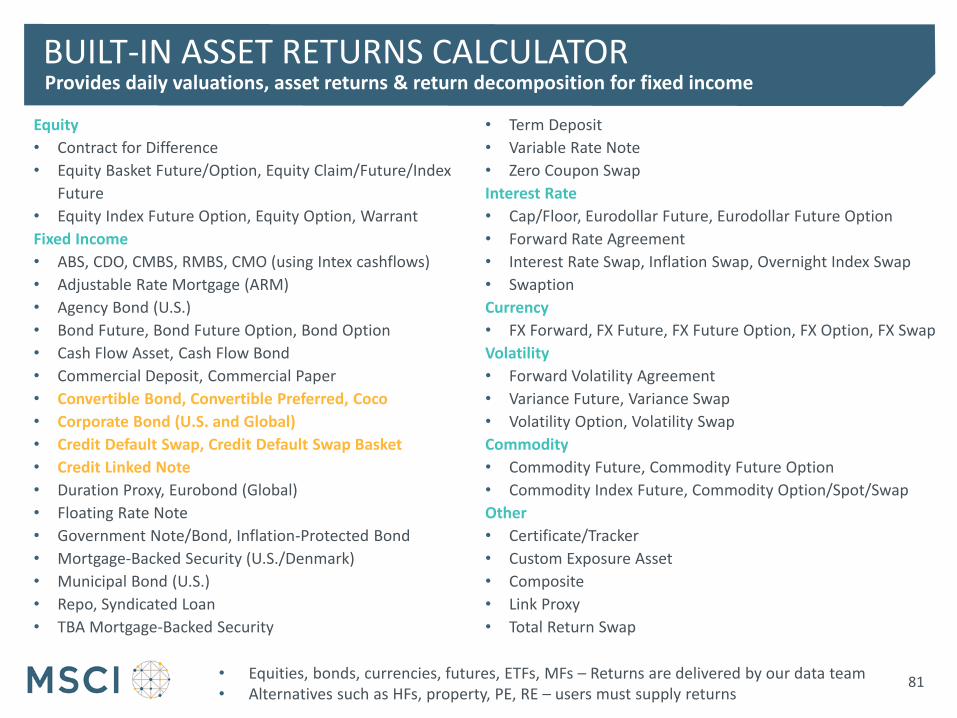
BUILT-IN ASSET RETURNS CALCULATOR
81
Provides daily valuations, asset returns & return decomposition for fixed income
Equity
• Contract for Difference
• Equity Basket Future/Option, Equity Claim/Future/Index
Future
• Equity Index Future Option, Equity Option, Warrant
Fixed Income
• ABS, CDO, CMBS, RMBS, CMO (using Intex cashflows)
• Adjustable Rate Mortgage (ARM)
• Agency Bond (U.S.)
• Bond Future, Bond Future Option, Bond Option
• Cash Flow Asset, Cash Flow Bond
• Commercial Deposit, Commercial Paper
• Convertible Bond, Convertible Preferred, Coco
• Corporate Bond (U.S. and Global)
• Credit Default Swap, Credit Default Swap Basket
• Credit Linked Note
• Duration Proxy, Eurobond (Global)
• Floating Rate Note
• Government Note/Bond, Inflation-Protected Bond
• Mortgage-Backed Security (U.S./Denmark)
• Municipal Bond (U.S.)
• Repo, Syndicated Loan
• TBA Mortgage-Backed Security
• Term Deposit
• Variable Rate Note
• Zero Coupon Swap
Interest Rate
• Cap/Floor, Eurodollar Future, Eurodollar Future Option
• Forward Rate Agreement
• Interest Rate Swap, Inflation Swap, Overnight Index Swap
• Swaption
Currency
• FX Forward, FX Future, FX Future Option, FX Option, FX Swap
Volatility
• Forward Volatility Agreement
• Variance Future, Variance Swap
• Volatility Option, Volatility Swap
Commodity
• Commodity Future, Commodity Future Option
• Commodity Index Future, Commodity Option/Spot/Swap
Other
• Certificate/Tracker
• Custom Exposure Asset
• Composite
• Link Proxy
• Total Return Swap
• Equities, bonds, currencies, futures, ETFs, MFs – Returns are delivered by our data team • Alternatives such as HFs, property, PE, RE – users must supply returns

ATTRIBUTION OF TRADING AND PRICING IMPACT
82
For Classic Brinson, Fixed Income and Equity Factor Attribution Portfolio
Base Return
Model Base
Return
Local Return
Currency Return
Trading Impact
Pricing Impact
Look Through Impact
Transactional Return vs. End-of-Day Return Impact of official performance differing from end-of-day holding-based performance • Reported at portfolio-level and
attributed to the asset-level since asset-level transactions are incorporated
End-of-Day Return vs. Portfolio Return using benchmark return source for common assets Impact of portfolio and benchmark having different price sources • For assets with a distinct price source for the portfolio and
benchmark • Reported at portfolio, group and asset level
Portfolio Return using BMK source for common assets vs. Look Through for Composites and Futures Impact of holding composites/futures rather than their constituents/underlyings • For futures and composites • Reported at portfolio, group and asset level
Further Attribution Dependent on the Model
End-of-Day Return uses the portfolio price source for all assets – common and off-benchmark

IMPORTANT FLEXIBILITY FOR PORTFOLIO-SPECIFIC PRICE SOURCE
83
• Flexibility to define portfolio-specific price and FX source
• Accurate portfolio return uses portfolio price source for all assets – common and off-benchmark
• Pricing Impact from different price sources for common assets in the portfolio & benchmark
Positions report and risk analysis also benefit from flexible portfolio-specific price source driven analytics
Important flexibility for price sources resulting in accurate returns and capture of pricing impact

TRANSACTIONS AND HOLDINGS
84
Transactions Combined with Holdings
Accurate capture of portfolio return
Time weighted rate of return following GIPS recommended calculations
Incorporating daily valuations, external cash flows, portfolio-level transactions, fees, taxes, commission payments, expenses
Supplement asset-level attribution with transactions
Incorporate asset-level transactions, i.e. buys, sells, revenue, coupon, paydown, dividend, margin, etc., in PA analytics
BarraOne Performance Analytics Solution
Data management tools helps clients manage and reconcile calculations
Results in official portfolio return Capture impact from differences in traded prices and closing prices
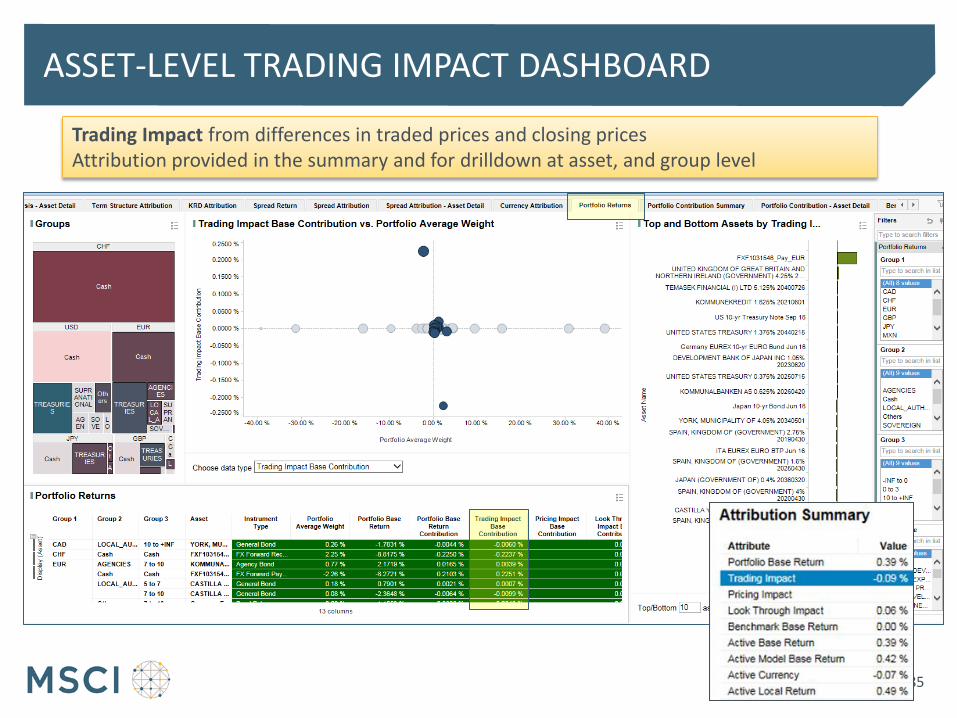
ASSET-LEVEL TRADING IMPACT DASHBOARD
85
Trading Impact from differences in traded prices and closing prices Attribution provided in the summary and for drilldown at asset, and group level

MSCI
86
ABOUT MSCI
87
For more than 40 years, MSCI’s research-based indexes and analytics have helped the world’s leading investors build and manage better portfolios. Clients rely on our offerings for deeper insights into the drivers of performance and risk in their portfolios, broad asset class coverage and innovative research.
Our line of products and services includes indexes, analytical models, data, real estate benchmarks and ESG research.
MSCI serves 98 of the top 100 largest money managers, according to the most recent P&I ranking.
For more information, visit us at www.msci.com.

AMERICAS
Americas 1 888 588 4567 *
Atlanta + 1 404 551 3212
Boston + 1 617 532 0920
Chicago + 1 312 675 0545
Monterrey + 52 81 1253 4020
New York + 1 212 804 3901
San Francisco + 1 415 836 8800
Sao Paulo + 55 11 3706 1360
Toronto + 1 416 628 1007
* = toll free
CONTACT US
88
EUROPE, MIDDLE EAST
& AFRICA
Cape Town + 27 21 673 0100
Frankfurt + 49 69 133 859 00
Geneva + 41 22 817 9777
London + 44 20 7618 2222
Milan + 39 02 5849 0415
Paris 0800 91 59 17 *
ASIA PACIFIC
China North 10800 852 1032 *
China South 10800 152 1032 *
Hong Kong + 852 2844 9333
Mumbai + 91 22 6784 9160
Seoul 00798 8521 3392 *
Singapore 800 852 3749 *
Sydney + 61 2 9033 9333
Taipei 008 0112 7513 *
Tokyo 81 3 5290 1555
msci.com

DISCLAIMERS AND RIGHTS OF USE
89

BOFA MERRILL LYNCH
89
In addition to the terms and conditions of any license agreement for MSCI information, services or products (“MSCI Products”) entered into with MSCI Inc.
and/or its affiliates (“MSCI”) by customers (“Customer(s)”), each Customer must comply with the terms and conditions required by third party suppliers
(“Supplier(s)”) regarding Customer’s use of Supplier content, data, software and other materials (“Materials”) within MSCI Products.
Merrill Lynch, Pierce, Fenner & Smith Incorporated and its affiliates (“BofAML”) indices and related information, the name “Bank of America Merrill Lynch”,
and related trademarks, are intellectual property licensed from BofAML. The BofAML indices and related information are for Customer’s internal use only
and may not be referenced, published or distributed externally, either on their own or as part of a blended benchmark, without BofAML’s prior written
approval. BofA Merrill Lynch index constituent reference and pricing data can only be used internally for purposes of benchmarking, performance
attribution, research, analysis and risk/compliance reporting related activities performed solely in connection with the BofA Merrill Lynch indices. For
avoidance of doubt, index constituent pricing data may not be used as a source for valuing a fund/portfolio unless Customer has entered into a direct
agreement with the relevant primary pricing source that BofAML has used to compile the index which permits such use. Index constituent reference and
pricing data may not be used to enhance or validate Customer’s own bond or other reference data or bond pricing product or service. MSCI’s products
have not been passed on as to their legality or suitability, and are not regulated, issued, endorsed, sold, or promoted by BofAML. BOFAML MAKES NO
WARRANTIES AND BEARS NO LIABILITY WITH RESPECT TO THE INDICES, INDEX DATA, ANY RELATED DATA, ITS TRADEMARKS, OR THE PRODUCT(S)
(INCLUDING WITHOUT LIMITATION, THEIR QUALITY, ACCURACY, SUITABILITY AND/OR COMPLETENESS).
Customer may create and distribute, transmit, license (offer to sell), or display/perform, in reports and other materials that Customer prepares for its
clients, information comparing Customer’s performance to a BofAML index; along with an immaterial amount of index data and derived data (such as
general characteristics and performance of an index or specific segments of the BofAML index), but not to include Bloomberg data, provided that Customer
includes materially the following language in such report or material:
Source BofA Merrill Lynch, used with permission. For Customer’s internal use only. BOFA MERRILL LYNCH IS LICENSING THE BOFA MERRILL LYNCH INDICES
AND RELATED DATA "AS IS," MAKES NO WARRANTIES REGARDING SAME, DOES NOT GUARANTEE THE SUITABILITY, QUALITY, ACCURACY, TIMELINESS,
AND/OR COMPLETENESS OF THE INDICES OR ANY DATA INCLUDED IN, RELATED TO, OR DERIVED THEREFROM, ASSUMES NO LIABILITY IN CONNECTION
WITH THEIR USE, AND DOES NOT SPONSOR, ENDORSE, OR RECOMMEND [Customer], OR ANY OF ITS PRODUCTS OR SERVICES.

This document and all of the information contained in it, including without limitation all text, data, graphs, charts (collectively, the “Information”) is the property of MSCI Inc. or its subsidiaries (collectively, “MSCI”), or MSCI’s licensors, direct or indirect suppliers or any third party involved in making or compiling any Information (collectively, with MSCI, the “Information Providers”) and is provided for informational purposes only. The Information may not be modified, reverse-engineered, reproduced or redisseminated in whole or in part without prior written permission from MSCI.
The Information may not be used to create derivative works or to verify or correct other data or information. For example (but without limitation), the Information may not be used to create indexes, databases, risk models, analytics, software, or in connection with the issuing, offering, sponsoring, managing or marketing of any securities, portfolios, financial products or other investment vehicles utilizing or based on, linked to, tracking or otherwise derived from the Information or any other MSCI data, information, products or services.
The user of the Information assumes the entire risk of any use it may make or permit to be made of the Information. NONE OF THE INFORMATION PROVIDERS MAKES ANY EXPRESS OR IMPLIED WARRANTIES OR REPRESENTATIONS WITH RESPECT TO THE INFORMATION (OR THE RESULTS TO BE OBTAINED BY THE USE THEREOF), AND TO THE MAXIMUM EXTENT PERMITTED BY APPLICABLE LAW, EACH INFORMATION PROVIDER EXPRESSLY DISCLAIMS ALL IMPLIED WARRANTIES (INCLUDING, WITHOUT LIMITATION, ANY IMPLIED WARRANTIES OF ORIGINALITY, ACCURACY, TIMELINESS, NON-INFRINGEMENT, COMPLETENESS, MERCHANTABILITY AND FITNESS FOR A PARTICULAR PURPOSE) WITH RESPECT TO ANY OF THE INFORMATION.
Without limiting any of the foregoing and to the maximum extent permitted by applicable law, in no event shall any Information Provider have any liability regarding any of the Information for any direct, indirect, special, punitive, consequential (including lost profits) or any other damages even if notified of the possibility of such damages. The foregoing shall not exclude or limit any liability that may not by applicable law be excluded or limited, including without limitation (as applicable), any liability for death or personal injury to the extent that such injury results from the negligence or willful default of itself, its servants, agents or sub-contractors.
Information containing any historical information, data or analysis should not be taken as an indication or guarantee of any future performance, analysis, forecast or prediction. Past performance does not guarantee future results.
The Information should not be relied on and is not a substitute for the skill, judgment and experience of the user, its management, employees, advisors and/or clients when making investment and other business decisions. All Information is impersonal and not tailored to the needs of any person, entity or group of persons.
None of the Information constitutes an offer to sell (or a solicitation of an offer to buy), any security, financial product or other investment vehicle or any trading strategy.
It is not possible to invest directly in an index. Exposure to an asset class or trading strategy or other category represented by an index is only available through third party investable instruments (if any) based on that index. MSCI does not issue, sponsor, endorse, market, offer, review or otherwise express any opinion regarding any fund, ETF, derivative or other security, investment, financial product or trading strategy that is based on, linked to or seeks to provide an investment return related to the performance of any MSCI index (collectively, “Index Linked Investments”). MSCI makes no assurance that any Index Linked Investments will accurately track index performance or provide positive investment returns. MSCI Inc. is not an investment adviser or fiduciary and MSCI makes no representation regarding the advisability of investing in any Index Linked Investments.
Index returns do not represent the results of actual trading of investible assets/securities. MSCI maintains and calculates indexes, but does not manage actual assets. Index returns do not reflect payment of any sales charges or fees an investor may pay to purchase the securities underlying the index or Index Linked Investments. The imposition of these fees and charges would cause the performance of an Index Linked Investment to be different than the MSCI index performance.
The Information may contain back tested data. Back-tested performance is not actual performance, but is hypothetical. There are frequently material differences between back tested performance results and actual results subsequently achieved by any investment strategy.
Constituents of MSCI equity indexes are listed companies, which are included in or excluded from the indexes according to the application of the relevant index methodologies. Accordingly, constituents in MSCI equity indexes may include MSCI Inc., clients of MSCI or suppliers to MSCI. Inclusion of a security within an MSCI index is not a recommendation by MSCI to buy, sell, or hold such security, nor is it considered to be investment advice.
Data and information produced by various affiliates of MSCI Inc., including MSCI ESG Research Inc. and Barra LLC, may be used in calculating certain MSCI indexes. More information can be found in the relevant index methodologies on www.msci.com.
MSCI receives compensation in connection with licensing its indexes to third parties. MSCI Inc.’s revenue includes fees based on assets in Index Linked Investments. Information can be found in MSCI Inc.’s company filings on the Investor Relations section of www.msci.com.
MSCI ESG Research Inc. is a Registered Investment Adviser under the Investment Advisers Act of 1940 and a subsidiary of MSCI Inc. Except with respect to any applicable products or services from MSCI ESG Research, neither MSCI nor any of its products or services recommends, endorses, approves or otherwise expresses any opinion regarding any issuer, securities, financial products or instruments or trading strategies and MSCI’s products or services are not intended to constitute investment advice or a recommendation to make (or refrain from making) any kind of investment decision and may not be relied on as such. Issuers mentioned or included in any MSCI ESG Research materials may include MSCI Inc., clients of MSCI or suppliers to MSCI, and may also purchase research or other products or services from MSCI ESG Research. MSCI ESG Research materials, including materials utilized in any MSCI ESG Indexes or other products, have not been submitted to, nor received approval from, the United States Securities and Exchange Commission or any other regulatory body.
Any use of or access to products, services or information of MSCI requires a license from MSCI. MSCI, Barra, RiskMetrics, IPD, FEA, InvestorForce, and other MSCI brands and product names are the trademarks, service marks, or registered trademarks of MSCI or its subsidiaries in the United States and other jurisdictions. The Global Industry Classification Standard (GICS) was developed by and is the exclusive property of MSCI and Standard & Poor’s. “Global Industry Classification Standard (GICS)” is a service mark of MSCI and Standard & Poor’s.
NOTICE AND DISCLAIMER
91
Top Related