


Languages
Pages
Legal

MOZAMBIQUE DISASTER RISK ASSESSMENT JANUARY 2020
From 18 to 27 November, in close coordination with Mozambique’s National Institute for Disaster Management (INGC), IOM Displacement Tracking Matrix (DTM) teams conducted a Disaster Risk Assessment at locality level (localidade), corresponding to the lowest administrative level in the country.
The central region of Mozambique faces significant challenges related to climate change, including increased flooding and increased vulnerability of the local populations. The results of the assessment show that 65 per cent of the localities (representing 324 localities) assessed were affected by Cyclone Idai, and that 84 per cent (representing 417 localities) of the localities are at risk of natural disasters, particularly rain and strong winds (85%) and floods (46%).
OVERVIEW
!
!!
!
!
!
!
!
!
!
!
!
!
!!
!
!
! !
!
!
! !
!
!
!
!
!!
!
!
!
!
!
!
!!!
! !
!
!!
!
!
!
!
!
!
!
!
! !
!
!!
!
!
!!
!
!!
!
!
!
!
! !
!
!!
!
!
!
!
!
!
!
!
!
!
!
!
!!
!
!
!
!
!!!
!
!
!!
!
!
!
!
!
!
!!!!!
!!!
!
!
!
!
!
!
!
!
!
!!
!
!!!
!!
!!
!
!
!!!
!
!
!!
!
!
!
!
!
! !
!!!
!
!
!
!
!
!
!
!
!
!
!
!
!
!
!
!
!
!
!
!
!
!
!
!
!
!
!!
!
!
!
!!
!
!!
!
!
!
!
!
!
!
!
!
!!
!
!
!
!
!
! !!
!
!!!
!!
!
!
!
!
!
!!
!
!
!
!
!!!!
!!!
!
! !
!!
!
!
!!
!
!
!
!
!
!
!
!
!
!
!
!
!
!
!
!
!
!!
!
!!
!
!
!
!
!
!
!
!
! !
!! !
!
!
!
!
!
!
!!!!!
!!
!!
!
!!
!!
!!
!!
!
!
!
!
!
!
!
!
!!
!
!
!
!!
!
!
!!
!
!
!
!!!
!
!!!! !
!
!!
!!
!
!
!!!!!
!
!
!
!
!
!
!
! !
!
!
!
!!
!
!!!!
!!
!!!!
!
!
!
!
!
!
!
!
!
!
!
!!!!
!!
!
!
!!!
!
!
!
!
!!
!
!
!
!
!
!
!
!!
!
!
!
!
!
!
!
!
!!
!
!
!!
!
!
!
!
!!
!
!!
!
!
! !!
!! !!!
!
!!!
!!
!!
!
!
!
!
!
!
!
!
!
!
!
! !
!
!!
!
!
!
!
!
!
!
!
!
!
!!
!
!!
!!
!!
!!
!
!
!
!!!
!!
!
!
!
!
!
!
!
Gile
MaraviaZumbu
Buzi
Machaze
GuroPebane
MagoeIle
Mocuba
Chiuta
Macossa
Moatize
Mopeia
Chifunde
Muanza
Lugela
Gurue
Doa
Caia
Macanga
Milange
Barue
DerreMorrumbala
Chibabava
Maringue
Changara
Cahora Bassa
GorongosaCheringoma
Marromeu
Machanga
Sussundenga
Mossurize
Tambara Mocubela
Alto Molocue
Chemba
Molumbo
Chinde
Vanduzi
Angonia
Marara
Tsangano
Dondo
Manica
Namarroi
GondolaNhamatanda
Mutarara
Mulevala
Nicoadala
Macate
Namacurra
Luabo
Maganja Da Costa
MaquivalInhassunge
Cidade Da Beira
Cidade De Tete
Cidade De Chimoio
Tete
Sofala
Zambezia
Manica
0 110 22055 km
! Covered locality
Not assessed
Provincial boundary
District boundary
I
This map is for illustration purposes only - names and boundaries on this map do not imply official endorsement or acceptance by IOM
DTM MOZAMBIQUE
This assessment covered 498 Localities (130 Administrative Posts) in 59 Districts of Manica, Sofala, Tete and Zambezia provinces. The DTM teams interviewed locality chiefs to capture information on flood, rain and strong wind risk, evacuation planning (identified evacuation routes and buildings), and access to services in these localities. The data in this report is based on responses of local authorities.
DTM REPORT
4Provinces
59Districts
130Administrative
Posts
498Localities
2
Post boundary
District boundary
Province boundary
Gile
MaraviaZumbu
Buzi
Machaze
Guro
Pebane
MagoeIle
Mocuba
Chiuta
Macossa
Moatize
Mopeia
Chifunde
Barue
Muanza
Lugela
Gurue
Doa
Derre
Caia
Macanga
Milange
Chibabava
Maringue
Changara
Cahora Bassa
GorongosaCheringoma
Marromeu
Machanga
Sussundenga
Mossurize
Tambara Mocubela
Chemba
Molumbo
Chinde
Vanduzi
Angonia
Marara
Tsangano
Dondo
Mulevala
Morrumbala
Alto Molocue
Manica
Namarroi
GondolaNhamatanda
Mutarara
Nicoadala
Macate
Namacurra
Luabo
Maganja Da Costa
Maquival
Inhassunge
Cidade Da Beira
Cidade De Tete
Cidade De Chimoio
Tete
Sofala
Zambezia
Manica
Not assessed
Population Vulnerability Level to Flood
Lower risk
Moderate
Moderate to high
High
Very high
RISK/VULNERABILITY ASSESSMENT
Flood Risk/Vulnerability by Locality
Flood Risk/Vulnerability by Post
In 38% of localities (representing 191 localities) populations are
vulnerable to flooding
In 41% of posts (representing 53 posts) populations are vulnerable
to flooding
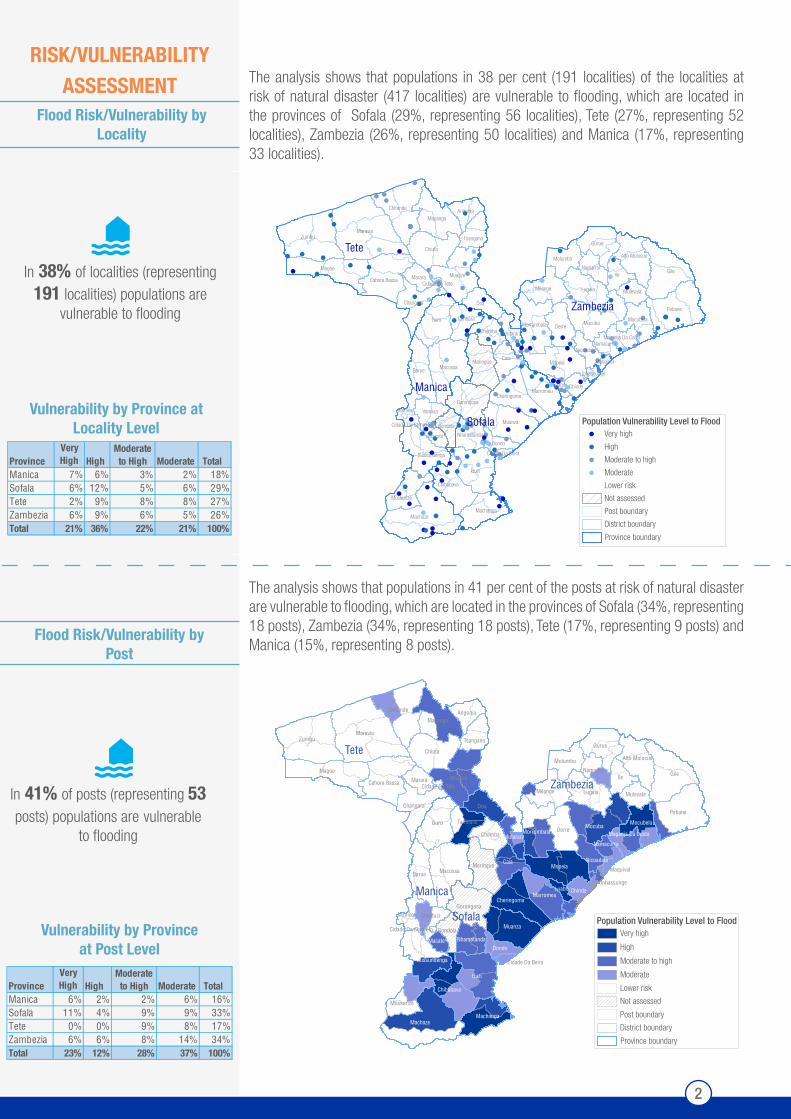
The analysis shows that populations in 41 per cent of the posts at risk of natural disaster are vulnerable to flooding, which are located in the provinces of Sofala (34%, representing 18 posts), Zambezia (34%, representing 18 posts), Tete (17%, representing 9 posts) and Manica (15%, representing 8 posts).
The analysis shows that populations in 38 per cent (191 localities) of the localities at risk of natural disaster (417 localities) are vulnerable to flooding, which are located in the provinces of Sofala (29%, representing 56 localities), Tete (27%, representing 52 localities), Zambezia (26%, representing 50 localities) and Manica (17%, representing 33 localities).
!!!
!
!
!
!
!
!!!
!
!
! !
!
!
!!
!
!!
! !
!
!!
!!
!! !
!
!
!
! !
!
!
!
! !
!
!
!
!
!
!
!
!
!
!
!
!
!
!!
!
!!
!
!
!
!
!!!
!
!
!
!
!!
!
!!
!
!
!!
!
!
!
!
!
!
!!
!
!
!!
!
!
!
!!!
!
!
!
!!!
!
!!
!
!
!
!
!
!!
!
!
!!
!
!
!
!!!
!
!
!
!
!
!
!
!
!
!
!
!
!
!
!
!
!
!
!
!
!
!
!
!
!
!
!
!
!!!
!
!!
!
!
! !!
!
!
!
!
!
!
!
!
!
!
!
!
!!
!
!!
!!
! !! !
!
!
!
!
Gile
MaraviaZumbu
Buzi
Machaze
Guro
Pebane
MagoeIle
Mocuba
Chiuta
Macossa
Moatize
Mopeia
Chifunde
Barue
Muanza
Lugela
Gurue
Doa
Derre
Caia
Macanga
Milange
Chibabava
Maringue
Changara
Cahora Bassa
GorongosaCheringoma
Marromeu
Machanga
Sussundenga
Mossurize
Tambara Mocubela
Chemba
Molumbo
Chinde
Vanduzi
Angonia
Marara
Tsangano
Dondo
Mulevala
Morrumbala
Alto Molocue
Manica
Namarroi
Gondola
Nhamatanda
Mutarara
Nicoadala
Macate
Namacurra
Luabo
Maganja Da Costa
Maquival
Inhassunge
Cidade Da Beira
Cidade De Tete
Cidade De Chimoio
Tete
Sofala
Zambezia
Manica
Population Vulnerability Level to Flood! Very high
! High
! Moderate to high
! Moderate
Lower risk
Not assessed
Post boundary
District boundary
Province boundary
ProvinceVery High High
Moderate to High Moderate Total
Manica 6% 2% 2% 6% 16%Sofala 11% 4% 9% 9% 33%Tete 0% 0% 9% 8% 17%Zambezia 6% 6% 8% 14% 34%Total 23% 12% 28% 37% 100%
ProvinceVery High High
Moderate to High Moderate Total
Manica 7% 6% 3% 2% 18%Sofala 6% 12% 5% 6% 29%Tete 2% 9% 8% 8% 27%Zambezia 6% 9% 6% 5% 26%Total 21% 36% 22% 21% 100%
Vulnerability by Province at Locality Level
Vulnerability by Province at Post Level
3
Gile
MaraviaZumbu
Buzi
Machaze
Guro
Pebane
MagoeIle
Mocuba
Chiuta
Macossa
Moatize
Mopeia
Chifunde
Barue
Muanza
Lugela
Gurue
Doa
Derre
Caia
Macanga
Milange
Changara
Gorongosa
Machanga
TambaraChemba
Molumbo
Vanduzi
Angonia
Marara
Dondo
Morrumbala
Chibabava
Maringue
Cahora Bassa
CheringomaMarromeu
Sussundenga
Mossurize
Mocubela
Alto Molocue
Chinde
Tsangano
Manica
Namarroi
GondolaNhamatanda
Mutarara
Mulevala
Nicoadala
Macate
Namacurra
Luabo
Maganja Da Costa
Maquival
Inhassunge
Cidade Da Beira
Cidade De Tete
Cidade De Chimoio
Tete
Sofala
Zambezia
Manica
Population Vulnerability Level to Strong Wind and Rain Risk
Lower risk
Moderate
Moderate to high
High
Very high
Not assessed
Post boundary
District boundary
Province boundary
!
!!!
!
!!!
!
!
!
!!
!!!
!
!
!!
!
!
! !
!
!
!
!
!!
!
!!
!
!
!
!!!
! !
!
!!
!
!
!
!
!
!
!
!
!!
!
!!
!
!
!!
!
!!
!
!
!
!
! !
!
!!
!
!
!
!
!
!
!
!
!
!
!
!
!!
!
!
!
!!!!
!
!
!!
!
!
!
!
!
!
!!!!!
!!!
!
!
!
!
!
!
!
!
!
!!
!
!!!
!!
!!
!
!
!!!
!
!
!!
!
!
!
!
!
! !
!!!
!
!
!
!
!
!
!
!
!
!
!
!
!
!
!
!
!
!
!
!!
!
!
!
!
!
!!
!
!
!
!!
!
!!
!
!
!
!
!
!
!
!
!
!!
!
!
!
!
!
! !!
!
!!!
!!
!
!
!
!
!
!!
!
!
!
!
!!!!
!!!
!
! !
!!
!
!
!!
!
!
!
!
!
!
!
!
!
!
!
!
!
!
!
!
!
!!
!
!!
!
!
!
!
!
!
!
!
! !
!! !
!
!
!
!
!
!
!!!!!
!!
!!
!
! !
!!
!!
!!
!
!
!
!
!
!
!
!
!!
!
!
!
!!
!
!!!
!
!
!
!!!
!
!!!! !
!
!!
!!
!
!
!!!!!
!
!
!
!!
!
!
! !
!
!
!
!!
!
!!!!
!!
!!!!
!
!
!
!!
!
!
!
!
!
!
!!!!
!!
!
!
!!!
!
!
!
!
!!
!
!
!
!
!
!
!
! !
!
!
!
!
!
!
!
!
!!
!
!
!!!
!
!
!
!!
!
!!
!
!
! !!
!! !!!
!
!!!
!!
!!
!
!
!
!
!
!
!
!
!
!
!
! !
!
!!
!
!
!
!
!
!
!
!
!
!
!!
!
!!
!!
! ! !!
!
!
!
!!!
!!
!!
!
!
!
!
!
Gile
MaraviaZumbu
Buzi
Machaze
Guro
Pebane
MagoeIle
Mocuba
Chiuta
Macossa
Moatize
Mopeia
Chifunde
Barue
Muanza
Lugela
Gurue
Doa
Derre
Caia
Macanga
Milange
Chibabava
Maringue
Changara
Cahora Bassa
GorongosaCheringoma
Marromeu
Machanga
Sussundenga
Mossurize
Tambara Mocubela
Chemba
Molumbo
Chinde
Vanduzi
Angonia
Marara
Tsangano
Dondo
Mulevala
Morrumbala
Alto Molocue
Manica
Namarroi
Gondola
Nhamatanda
Mutarara
Nicoadala
Macate
Namacurra
Luabo
Maganja Da Costa
Maquival
Inhassunge
Cidade Da Beira
Cidade De Tete
Cidade De Chimoio
Tete
Sofala
Zambezia
Manica
Population Vulnerability Level to Strong Wind and Rain Risk Level
! Very high
! High
! Moderate to high
! Moderate
! Lower risk
Not assessed
Post boundary
District boundary
Province boundary
In 71% of localities (representing 356 localities) populations are
vulnerable to strong wind and rain
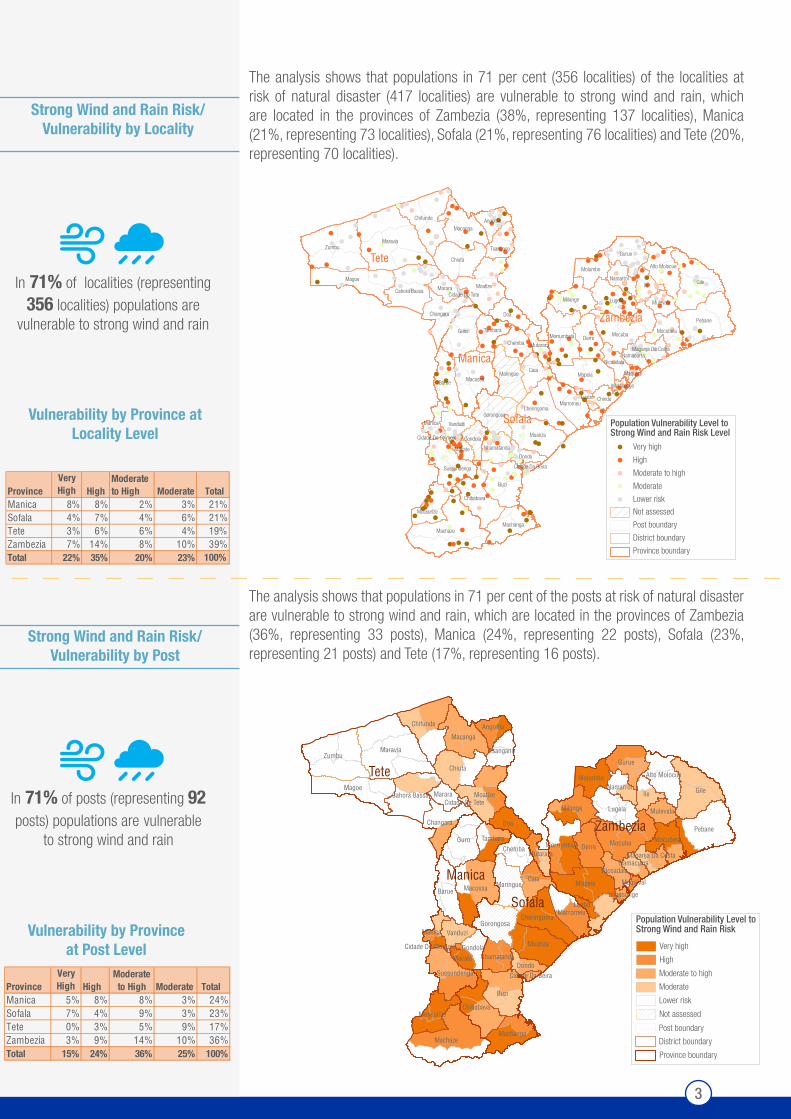
The analysis shows that populations in 71 per cent (356 localities) of the localities at risk of natural disaster (417 localities) are vulnerable to strong wind and rain, which are located in the provinces of Zambezia (38%, representing 137 localities), Manica (21%, representing 73 localities), Sofala (21%, representing 76 localities) and Tete (20%, representing 70 localities).
The analysis shows that populations in 71 per cent of the posts at risk of natural disaster are vulnerable to strong wind and rain, which are located in the provinces of Zambezia (36%, representing 33 posts), Manica (24%, representing 22 posts), Sofala (23%, representing 21 posts) and Tete (17%, representing 16 posts).
In 71% of posts (representing 92 posts) populations are vulnerable
to strong wind and rain
Strong Wind and Rain Risk/Vulnerability by Post
ProvinceVery High High
Moderate to High Moderate Total
Manica 5% 8% 8% 3% 24%Sofala 7% 4% 9% 3% 23%Tete 0% 3% 5% 9% 17%Zambezia 3% 9% 14% 10% 36%Total 15% 24% 36% 25% 100%
ProvinceVery High High
Moderate to High Moderate Total
Manica 8% 8% 2% 3% 21%Sofala 4% 7% 4% 6% 21%Tete 3% 6% 6% 4% 19%Zambezia 7% 14% 8% 10% 39%Total 22% 35% 20% 23% 100%
Strong Wind and Rain Risk/Vulnerability by Locality
Vulnerability by Province at Locality Level
Vulnerability by Province at Post Level
4
!
!!!
!
!!!
!
!
!
!!
!!
!
!
!
!!
!
!
! !
!
!
!
!
!!
!
!
!
!
!
!
!!!
! !
!
!!
!
!
!
!
!
!
!
!
!!
!
!!
!
!
!!
!
!!
!
!
!
!
! !
!
!!
!
!
!
!
!
!
!
!
!
!
!
!
!!
!
!
!
!
!!!
!
!
!!
!
!
!
!
!
!
!!!!!
!!!
!
!
!
!
!
!
!
!
!
!!
!
!!!
!!
!!
!
!
!!!
!
!
!!
!
!
!
!
!
! !
!!!
!
!
!
!
!
!
!
!
!
!
!
!
!
!
!
!
!
!
!
!
!!
!
!
!
!
!!
!
!
!
!!
!
!!
!
!
!
!
!
!
!
!
!
!!
!
!
!
!
!
! !!
!
!!!
!!
!
!
!
!
!
!!
!
!
!
!
!!!!
!!!
!
! !
!!
!
!
!!
!
!
!
!
!
!
!
!
!
!
!
!
!
!
!
!
!
!!
!
!!
!
!
!
!
!
!
!
!
! !
!! !
!
!
!
!
!
!
!!!!!
!!
!!
!
!!
!!
!!
!!
!
!
!
!
!
!
!
!
!!
!
!
!
!!
!
!
!!
!
!
!
!!!
!
!!!! !
!
!!
!!
!
!
!!!!!
!
!
!
!!
!
!
! !
!
!
!
!!
!
! !!!
!!
!!!!
!
!
!
!!
!
!
!
!
!
!
!!!!
!!
!
!
!!!
!
!
!
!
!!
!
!
!
!
!
!
!
!!
!
!
!
!
!
!
!
!
!!
!
!
!!
!
!
!
!
!!
!
!!
!
!
! !!
!! !!!
!
!!!
!!
!!
!
!
!
!
!
!
!
!
!
!
!
! !
!
!!
!
!
!
!
!
!
!
!
!
!
!!
!
!!
!!
!!
!!
!
!
!
!!!
!!
!
!
!
!
!
!
!
Gile
MaraviaZumbu
Buzi
Machaze
Guro
Pebane
MagoeIle
Mocuba
Chiuta
Macossa
Moatize
Mopeia
Chifunde
Muanza
Lugela
Gurue
Doa
Caia
Macanga
Milange
Barue
DerreMorrumbala
Chibabava
Maringue
Changara
Cahora Bassa
Gorongosa
Cheringoma Marromeu
Machanga
Sussundenga
Mossurize
Tambara Mocubela
Alto Molocue
Chemba
Molumbo
Chinde
Vanduzi
Angonia
Marara
Tsangano
Dondo
Manica
Namarroi
GondolaNhamatanda
Mutarara
Mulevala
Nicoadala
Macate
Namacurra
Luabo
Maganja Da Costa
Maquival
Inhassunge
Cidade Da Beira
Cidade De Tete
Cidade De Chimoio
Tete
Zambezia
Sofala
Manica
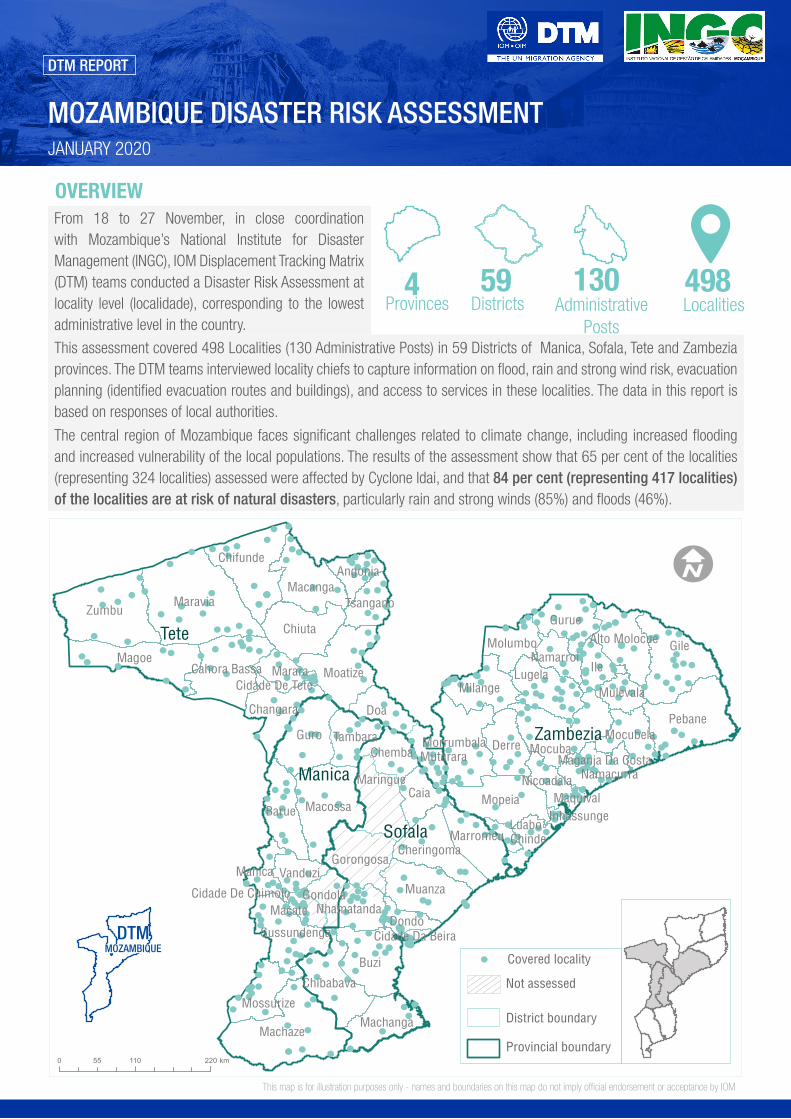
Physical constraint by Locality! No constraint! There is partial physical constraint! There is physical constraint
Covered districtDistrict boundaryProvincial boundary
Not assessed
39%
13%
48%
No physical access constraint
61%
1%
4%
8%
21%
22%
45%
Movements restrictions related to security
No access
No road access (only river)
Damaged Bridge
Closed Road
Damaged Road
There is partial physical access constraint
There is physical access constraint
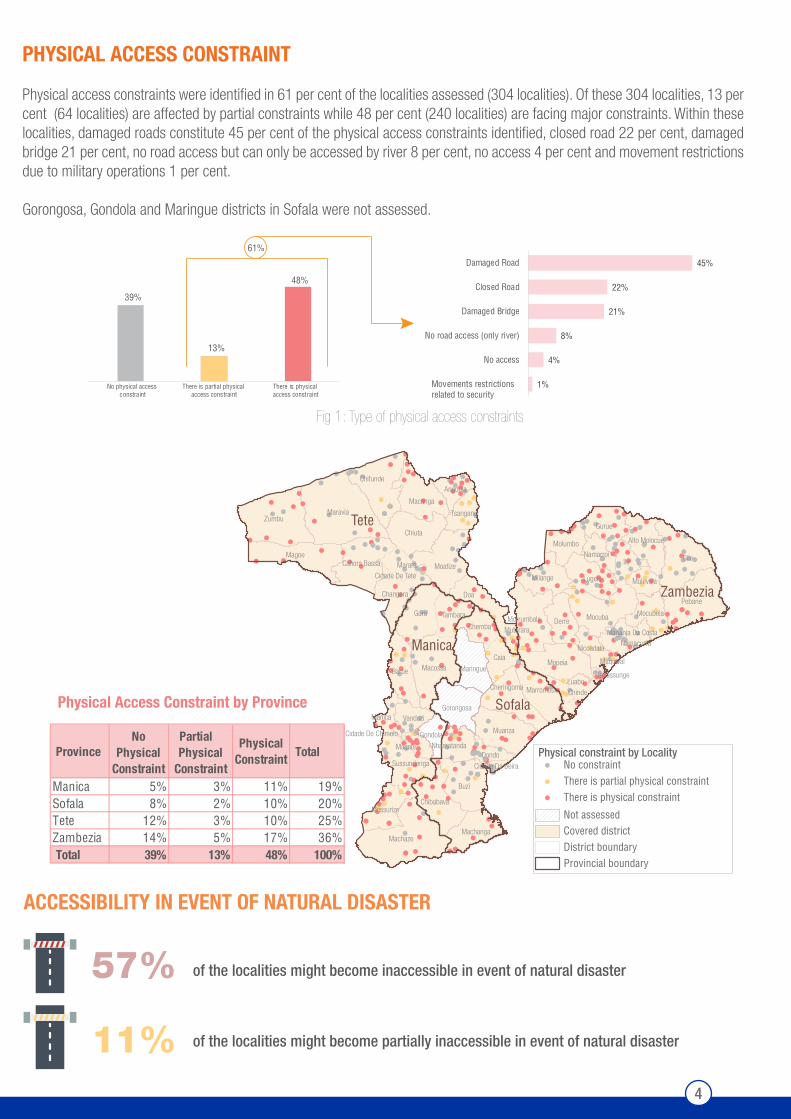
Physical access constraints were identified in 61 per cent of the localities assessed (304 localities). Of these 304 localities, 13 per cent (64 localities) are affected by partial constraints while 48 per cent (240 localities) are facing major constraints. Within these localities, damaged roads constitute 45 per cent of the physical access constraints identified, closed road 22 per cent, damaged bridge 21 per cent, no road access but can only be accessed by river 8 per cent, no access 4 per cent and movement restrictions due to military operations 1 per cent.
Gorongosa, Gondola and Maringue districts in Sofala were not assessed.
PHYSICAL ACCESS CONSTRAINT
ACCESSIBILITY IN EVENT OF NATURAL DISASTER
Fig 1: Type of physical access constraints
57%
11%
of the localities might become inaccessible in event of natural disaster
of the localities might become partially inaccessible in event of natural disaster
Province No
Physical Constraint
Partial Physical
Constraint
Physical Constraint
Total
Manica 5% 3% 11% 19%Sofala 8% 2% 10% 20%Tete 12% 3% 10% 25%Zambezia 14% 5% 17% 36% Total 39% 13% 48% 100%
Physical Access Constraint by Province
5
EVACUATION PLANNING
!
!!!
!
!!!
!
!
!
!!
!!!
!
!
!!
!
!
! !
!
!
!
!
!!
!
!!
!
!
!
!!!
! !
!
!!
!
!
!
!
!
!
!
!
!!
!
!!
!
!
!!
!
!!
!
!
!
!
! !
!
!!
!
!
!
!
!
!
!
!
!
!
!
!
!!
!
!
!
!!!!
!
!
!!
!
!
!
!
!
!
!!!!!
!!!
!
!
!
!
!
!
!
!
!
!!
!
!!!
!!
!!
!
!
!!!
!
!
!!
!
!
!
!
!
! !
!!!
!
!
!
!
!
!
!
!
!
!
!
!
!
!
!
!
!
!
!
!
!!
!
!
!
!
!!
!
!
!
!!
!
!!
!
!
!
!
!
!
!
!
!
!!
!
!
!
!
!
! !!
!
!!!
!!
!
!
!
!
!
!!
!
!
!
!
!!!!
!!!
!
! !
!!
!
!
!!
!
!
!
!
!
!
!
!
!
!
!
!
!
!
!
!
!
!!
!
!!
!
!
!
!
!
!
!
!
!!
!! !
!
!
!
!
!
!
!!!!!
!!
!!
!
! !
!!
!!
!!
!
!
!
!
!
!
!
!
!!
!
!
!
!!
!
!!!
!
!
!
!!!
!
!!!!!!
!!
!!
!
!
!!!!!
!
!
!
!
!
!
!
! !
!
!
!
!!
!
!
!!!
!!
!!!!
!
!
!
!!
!
!
!
!
!
!
!!!!
!!
!
!
!!!
!
!
!
!
!!
!
!
!
!
!
!
!
! !
!
!
!
!
!
!
!
!
!!
!
!
!!!
!
!
!
!!
!
!!
!
!
! !!
!! !!!
!
!!!
!!
!!
!
!
!
!
!
!
!
!
!
!
!
! !
!
!!
!
!
!
!
!
!
!
!
!
!
!!
!
!!
!!
! !! !
!
!
!
!!!
!!
!!
!
!
!
!
!
Gile
MaraviaZumbu
Buzi
Machaze
Guro
Pebane
Magoe
Ile
Mocuba
Chiuta
Macossa
Moatize
Mopeia
Chifunde
Barue
Muanza
Lugela
Doa
Derre
Milange
Chibabava
Maringue
Gorongosa
Cheringoma Marromeu
Sussundenga
Gurue
Caia
Macanga
Morrumbala
Changara
Cahora Bassa
Machanga
Mossurize
Tambara Mocubela
Alto Molocue
Chemba
Molumbo
Chinde
Vanduzi
Angonia
Marara
Tsangano
Dondo
Manica
Namarroi
Gondola
Nhamatanda
Mutarara
Mulevala
Nicoadala
Namacurra
Luabo
Maganja Da Costa
Maquival
Inhassunge
Cidade Da Beira
Cidade De Tete
Tete
Sofala
Zambezia
Manica
Evacuation Centre by Locality! No evacuation centre
! Availability of evacuation centre
Not assessed
Post boundary
District boundary
Province boundary
Evacuation Routes
Evacuation Centres
Localities with No Evacuation Centres
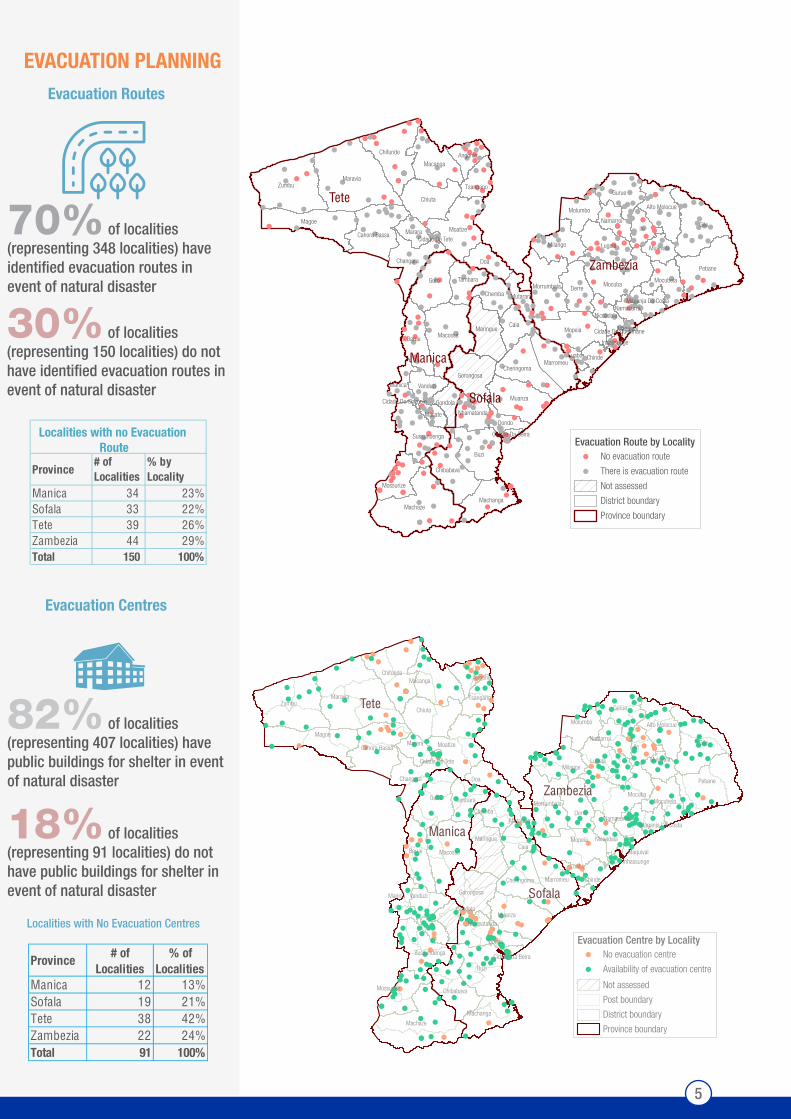
30% of localities (representing 150 localities) do not have identified evacuation routes in event of natural disaster
18% of localities (representing 91 localities) do not have public buildings for shelter in event of natural disaster
70% of localities (representing 348 localities) have identified evacuation routes in event of natural disaster
82% of localities (representing 407 localities) have public buildings for shelter in event of natural disaster
Province # of Localities
% by Locality
Manica 34 23%Sofala 33 22%Tete 39 26%Zambezia 44 29%Total 150 100%
Localities with no Evacuation Route
Province # of
Localities% of
LocalitiesManica 12 13%Sofala 19 21%Tete 38 42%Zambezia 22 24%Total 91 100%
!
!!!
!
!!!
!
!
!
!!
!!!
!
!
!!
!
!
! !
!
!
!
!
!!
!
!!
!
!
!
!!!
! !
!
!!
!
!
!
!
!
!
!
!
! !
!
!!
!
!
!!
!
!!
!
!
!
!
! !
!
!!
!
!
!
!
!
!
!
!
!
!
!
!
!!
!
!
!
!!!!
!
!
!!
!
!
!
!
!
!
!!!!!
!!!
!
!
!
!
!
!
!
!
!
!!
!
!!!
!!
!!
!
!
!!!
!
!
!!
!
!
!
!
!
! !
!!!
!
!
!
!
!
!
!
!
!
!
!
!
!
!
!
!
!
!
!
!!
!
!
!
!
!
!!
!
!
!
!!
!
!!
!
!
!
!
!
!
!
!
!
!!
!
!
!
!
!
! !!
!
!!!
!!
!
!
!
!
!
!!
!
!
!
!
!!!!
!!!
!
! !
!!
!
!
!!
!
!
!
!
!
!
!
!
!
!
!
!
!
!
!
!
!
!!
!
!!
!
!
!
!
!
!
!
!
!!
!! !
!
!
!
!
!
!
!!!!!
!!
!!
!
! !
!!
!!
!!
!
!
!
!
!
!
!
!
!!
!
!
!
!!
!
!!!
!
!
!
!!!
!
!!!!!!
!!
!!
!
!
!!!!!
!
!
!
!
!
!
!
! !
!
!
!
!!
!
!
!!!
!!
!!!!
!
!
!
!!
!
!
!
!
!
!
!!!!
!!
!
!
!!!
!
!
!
!
!!
!
!
!
!
!
!
!
! !
!
!
!
!
!
!
!
!
!!
!
!
!!!
!
!
!
!!
!
!!
!
!
! !!
!! !!!
!
!!!
!!
!!
!
!
!
!
!
!
!
!
!
!
!
! !
!
!!
!
!
!
!
!
!
!
!
!
!
!!
!
!!
!!
! ! !!
!
!
!
!!!
!!
!!
!
!
!
!
!
Gile
MaraviaZumbu
Buzi
Machaze
Guro
Pebane
MagoeIle
Mocuba
Chiuta
Macossa
Moatize
Mopeia
Chifunde
Barue
Muanza
Lugela
Gurue
Doa
Derre
Caia
Macanga
Milange
Chibabava
Maringue
Changara
Cahora Bassa
GorongosaCheringoma
Marromeu
Machanga
Sussundenga
Mossurize
Tambara Mocubela
Chemba
Molumbo
Chinde
Vanduzi
Angonia
Marara
Tsangano
Dondo
Mulevala
Morrumbala
Alto Molocue
Manica
Namarroi
Gondola
Nhamatanda
Mutarara
Nicoadala
Macate
Namacurra
Luabo
Maganja Da Costa
Maquival
Inhassunge
Cidade Da Beira
Cidade De Tete
Cidade De Chimoio
Tete
Sofala
Zambezia
Manica
Cidade De Quelimane
Evacuation Route by Locality! No evacuation route
! There is evacuation route
Not assessed
District boundary
Province boundary
6
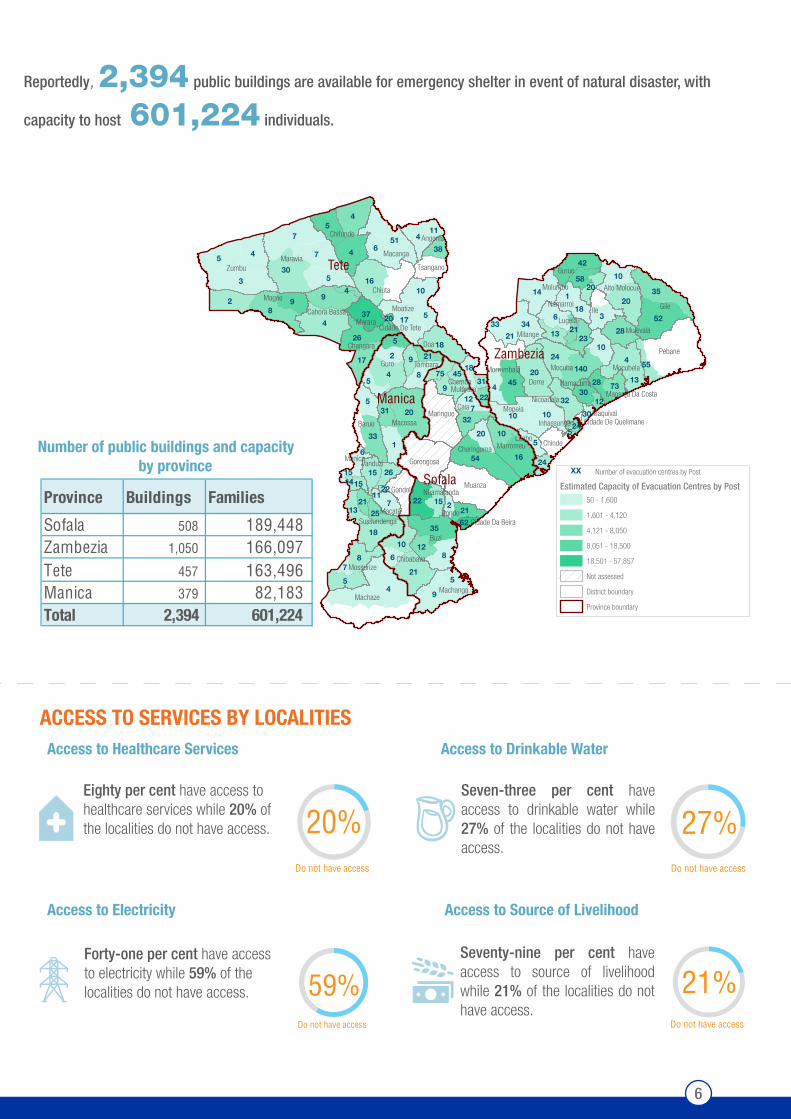
Forty-one per cent have access to electricity while 59% of the localities do not have access.
Seventy-nine per cent have access to source of livelihood while 21% of the localities do not have access.
59%Do not have access
21%Do not have access
Eighty per cent have access to healthcare services while 20% of the localities do not have access.
Seven-three per cent have access to drinkable water while 27% of the localities do not have access.
20%Do not have access
27%Do not have access
ACCESS TO SERVICES BY LOCALITIESAccess to Drinkable WaterAccess to Healthcare Services
Number of public buildings and capacity by province
Access to Electricity Access to Source of Livelihood
Reportedly, 2,394 public buildings are available for emergency shelter in event of natural disaster, with
capacity to host 601,224 individuals.
4
7
4
3
9
5 7
8
4
4
4 4
4
92
5
20
54
51
5
52
8
30
8
20
1
6
5
14
4
3
16
10
5
8
521
26
359
17
16
20
5
10
6
18
35
34
1
18
9 445
24
33
7
42
2
32
10
37
28
10
9
22
140
5
5
17
5
10
10
6
32
6
10
15
13
20
31
23
2115
73
2
12
58
21
30
18
38
13
18
28
26
13
25
45
11
7
24
21
12 22
31
55
7
20
75
4
21
21
15
33
12
62
30
15
524
11
20
2214
Gile
MaraviaZumbu
Buzi
Machaze
Guro
Pebane
Magoe
Ile
Mocuba
Chiuta
Macossa
Moatize
Mopeia
Chifunde
Barue
Muanza
Gurue
Doa
Derre
Caia
Macanga
Milange
Maringue
Gorongosa
Cheringoma Marromeu
Machanga
Chinde
Tsangano
Lugela
Morrumbala
Chibabava
Changara
Cahora Bassa
Sussundenga
Mossurize
Tambara Mocubela
Alto Molocue
Chemba
Molumbo
Vanduzi
Angonia
Marara
Dondo
Manica
Namarroi
Gondola Nhamatanda
Mutarara
Mulevala
Nicoadala
Macate
Namacurra
Luabo
Maganja Da Costa
MaquivalInhassunge
Cidade Da Beira
Cidade De Tete
Cidade De Quelimane
Tete
Sofala
Zambezia
Manica
XX Number of evacuation centres by Post
Estimated Capacity of Evacuation Centres by Post50 - 1,600
1,601 - 4,120
4,121 - 8,050
8,051 - 18,500
18,501 - 57,857
Not assessed
District boundary
Province boundary
Province Buildings Families
Sofala 508 189,448 Zambezia 1,050 166,097 Tete 457 163,496 Manica 379 82,183 Total 2,394 601,224
DTM IN MOZAMBIQUEIOM’s Displacement Tracking Matrix (DTM) is a system to track and monitor displacement and population mobility. It is designed to regularly and systematically capture, process and disseminate information to provide a better understanding of the movements and evolving needs of displaced populations. DTM has been implemented in Mozambique since 2013 with contextualized forms and tools for disaster and crisis responses in coordination with the INGC.
METHODOLOGYTo ensure a more robust targeted response for the humanitarian community, DTM provides key information and critical insights into the situation on internal displaced persons (IDPs), affected populations and returning populations across cyclone Idai affected areas. DTM implements three main components: daily tracking, baseline, and multi sectoral assessments.
Through the baseline locality assessments, DTM tracks the locations and sizes of the three core target populations categories, building an understanding of the main internal displacement patterns and dynamics in the affected region.
The disaster risk assessment was carried out through key informant interviews by DTM enumerators and SDPI (Service at District level for Planning and Infrastructures) focal points. Risk to natural disasters was not assessed based on geophysical conditions but based on local authorities knowledge on past exposure to disastrous events.
For more information or to report an alert, please contact:Claudia Pereira, DTM Project Coordinator: [email protected] [email protected].
DTM information products:http://displacement.iom.int/mozambique
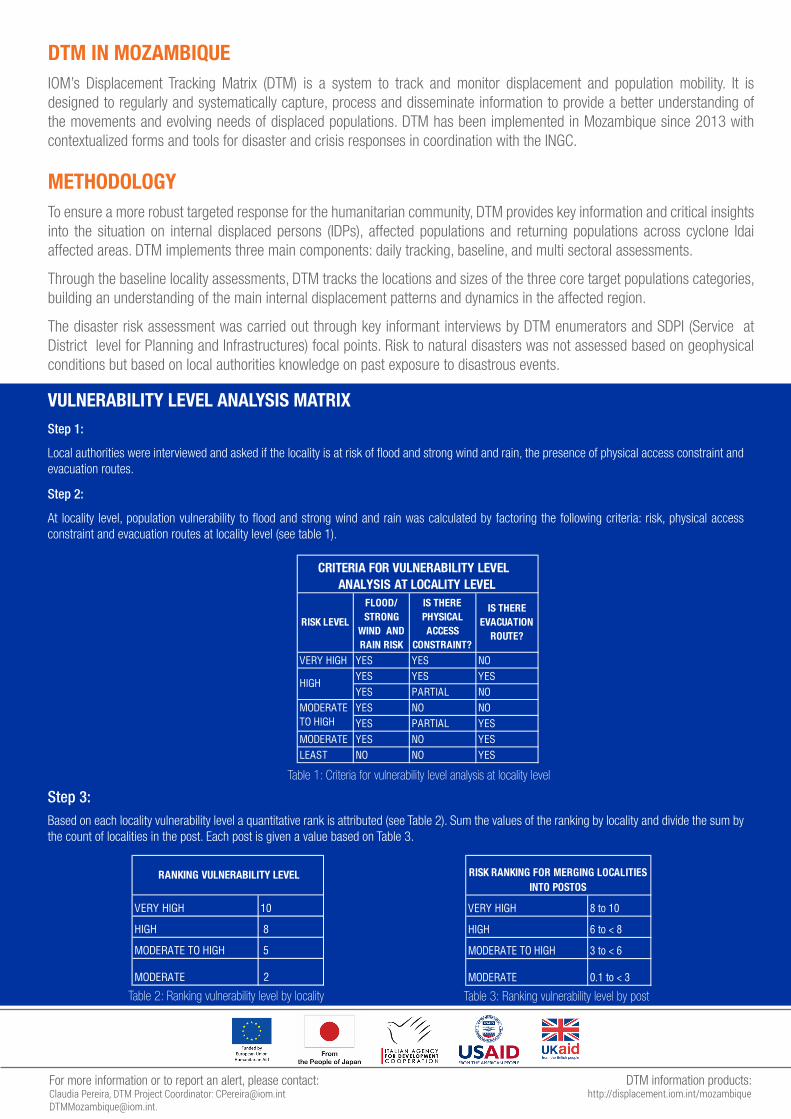
VULNERABILITY LEVEL ANALYSIS MATRIX
Table 1: Criteria for vulnerability level analysis at locality level
Table 3: Ranking vulnerability level by post Table 2: Ranking vulnerability level by locality
Step 1:
Local authorities were interviewed and asked if the locality is at risk of flood and strong wind and rain, the presence of physical access constraint and evacuation routes.
Step 2:
Step 3:Based on each locality vulnerability level a quantitative rank is attributed (see Table 2). Sum the values of the ranking by locality and divide the sum by the count of localities in the post. Each post is given a value based on Table 3.
At locality level, population vulnerability to flood and strong wind and rain was calculated by factoring the following criteria: risk, physical access constraint and evacuation routes at locality level (see table 1).
VERY HIGH YES YES NOYES YES YESYES PARTIAL NOYES NO NOYES PARTIAL YES
MODERATE YES NO YESLEAST NO NO YES
MODERATE TO HIGH
FLOOD/ STRONG
WIND AND RAIN RISK
CRITERIA FOR VULNERABILITY LEVEL ANALYSIS AT LOCALITY LEVEL
RISK LEVEL
IS THERE PHYSICAL ACCESS
CONSTRAINT?
IS THERE EVACUATION
ROUTE?
HIGH
VERY HIGH 8 to 10
HIGH 6 to < 8
MODERATE TO HIGH 3 to < 6
MODERATE 0.1 to < 3
RISK RANKING FOR MERGING LOCALITIES INTO POSTOS
VERY HIGH 10
HIGH 8
MODERATE TO HIGH 5
MODERATE 2
RANKING VULNERABILITY LEVEL
Top Related