


Languages
Pages
Legal


Monthly Commodities Report
July 2016

Monthly Commodities Report 2 Monday, 02 August 2016
Contents
1. Inflation Review
2. Weather Update
3. Kharif Crops Sowing Progress
4. Price Volatility in Agricultural Commodities (June 2016 – July 2016)
5. Price Movement in Major Internationally traded Agricultural Commodities
6. Markets and Trade Analysis of major Exchange Traded Commodities
A. Cereals : Maize , Wheat, Barley
B. Pulses: Chana
C. Oilseeds: Soybean, Rapeseed-Mustard seed
D. Spices: Coriander
E. Edible Oils: Soy oil
F. Manufactured Commodities : Sugar
G. Fibres: Cotton

Monthly Commodities Report 3 Monday, 02 August 2016
Inflation
Table 1: Food Articles – Classification and Weightage
Table 2: Non-Food Articles – Classification and Weightage
Commodity Classification
Weightage in
WPI
Total Number of Commodities in
the Group
Number of Commodities
Traded on NCDEX
Commodities Traded on NCDEX
Weightage of NCDEX traded Commodities
Fibre 0.877 6 1 Raw Cotton 0.705
Oil Seeds 1.780 11 2 Soybean, RM Seed
0.709
Other Non-Food
Articles 1.386 9 1 Guar seed, 0.048
Flowers 0.213 3 0 - 0
Total 4.257 29 4 1.462
Table 3: Manufactured Products - Classification and Weightage
Commodity Classification
Weightage in
WPI
Total Number of Commodities in
the Group
Number of Commodities
Traded on NCDEX
Commodities Traded on NCDEX
Weightage of NCDEX traded Commodities
Edible oils 3.042 10 2 Soy oil , Palm oil
0.780
Sugar, Khandsari, Gur
2.088 6 1 Sugar 1.737
Oil cakes 0.494 5 1 Cotton seed
oilcake 0.129
Total 5.625 21 4 2.646
Commodity Classification
Weightage in
WPI
Total Number of Commodities
in the Group
Number of Commodities
Traded on NCDEX
Commodities Traded on NCDEX
Weightage of NCDEX traded
Commodities
Cereals 3.373 7 3 Barley,
Wheat, Maize 1.350
Pulses 0.716 5 1 Gram 0.335
Vegetables 1.735 11 0 - 0
Fruits 2.107 13 0 - 0
Milk 3.238 1 0 - 0
Eggs, Meat & Fish 2.413 7 0 - 0
Condiments &
Spices 0.569 9 4
Turmeric, Chilli,
Coriander, Cumin 0.302
Other Food Articles 0.183 2 0 - 0
Total 14.337 55 8 1.987

Monthly Commodities Report 4 Monday, 02 August 2016
Inflation Review for the month of June 2016
The annual rate of inflation based on monthly WPI, stood at 1.62% for the month of June 2016 (over
June 2015) as compared to 0.79% for the previous month.
Food Articles inflation keeps on rising continuously for the last five months. It rose from 7.88 percent in
May 2016 to 8.18 percent in June 2016.
Pulses and Sugar are the major contributor to the food inflation. Although, Pulse prices have seen a
declining trend during past three months however sugar still remains a cause of concern as its prices
are rising from February onwards. Price of pulses rose 26.61 % in June, while sugar surged 26.09%
year-on-year during the month.
Oilseeds and edible oil inflation is well under control (below 5%) while Cereals prices have started
increasing.
Source: Office of the Economic Advisor, DIPP, Ministry of Commerce & Industry, GoI
Pulses, 26.6
Sugar, 26.1
-50
-40
-30
-20
-10
0
10
20
30
40
50
Jan-16 Feb-16 Mar-16 Apr-16 May-16 Jun-16Inflation (
%)
Jan-16
Feb-16
Mar-16
Apr-16
May-16
Jun-16
FOOD ARTICLES 6.46 3.91 4.09 4.70 7.88 8.18
CEREALS 2.91 3.30 4.41 4.24 4.60 6.32
PULSES 45.03 38.37 34.41 36.55 35.56 26.61
OIL SEEDS 5.76 3.46 3.52 6.07 2.73 2.52
EDIBLE OILS 1.64 2.40 3.38 5.41 3.60 3.42
SUGAR -0.55 5.23 9.05 17.34 22.30 26.09
CONDIMENTS & SPICES 17.09 13.65 11.64 12.31 12.96 7.97
Inflation: Jan 2016 to June 2016 (WPI Based)
Monthly Commodities Report 5 Monday, 02 August 2016
Major Commodities Contributing to Inflation during June 2016
Pulses : Urad, Gram and Tur Sugar : Marked price rise is seen Cereals : Barley, Maize and Wheat
All India Inflation rates (on point to point basis i.e. current month over same month of last year, i.e.,
June 2016 over June 2015), based on monthly WPI are presented below of major agricultural
commodities.
Trend of Rate of Inflation for Important Agricultural Commodities
COMMODITIES Jan-16 Feb-16 Mar-16 Apr-16 May-16 Jun-16
FOOD ARTICLES 6.46 3.91 4.09 4.70 7.88 8.18
CEREALS 2.91 3.30 4.41 4.24 4.60 6.32
Barley 2.27 4.84 4.86 18.78 22.00 25.54
Maize 11.43 12.49 8.95 9.24 13.48 16.66
Wheat 5.54 6.03 5.89 5.00 3.85 6.83
PULSES 45.03 38.37 34.41 36.55 35.56 26.61
Urad 66.87 61.51 59.82 59.01 64.92 59.12
Gram 48.06 40.58 34.78 38.50 35.71 33.01
Arhar (Tur) 70.40 56.27 45.08 45.38 41.16 22.79
Masur 23.70 17.49 12.16 15.68 15.35 0.82
Moong 3.80 2.82 7.04 9.00 7.05 -6.50
Sugar -0.55 5.23 9.05 17.34 22.30 26.09
CONDIMENTS & SPICES 17.09 13.65 11.64 12.31 12.96 7.97
Chillies(Dry) 23.61 29.89 29.91 34.93 32.73 26.37
Black Pepper -5.00 -3.13 6.35 9.63 11.65 7.10
Cumin 16.12 9.74 2.61 5.75 8.20 4.50
Turmeric 6.90 2.70 2.42 0.66 -0.08 -0.08
Coriander -9.09 -2.63 4.44 -1.05 -9.11 -17.41
OIL SEEDS 5.76 3.46 3.52 6.07 2.73 2.52
Soybean 2.71 4.21 7.14 13.19 -3.38 2.99
Rape & Mustard Seed 11.99 10.54 12.01 10.15 8.00 1.98
EDIBLE OILS 1.64 2.40 3.38 5.41 3.60 3.42
Mustard & Rapeseed Oil 11.99 10.54 12.01 10.15 8.00 1.98
Soybean Oil -2.14 -1.70 -0.53 2.07 2.47 3.28
Palm Oil -4.21 -2.40 -1.12 0.56 -0.08 1.78
Others
Raw Cotton 2.75 4.23 0.79 -2.68 -3.10 9.03
Cotton Seed Oil Cake 22.01 22.87 25.58 23.50 12.76 10.98
Guar Seed -27.23 -21.64 -24.34 -24.96 -30.40 -31.76
Source: Office of the Economic Advisor, DIPP, Ministry of Commerce & Industry, GoI

Monthly Commodities Report 6 Monday, 02 August 2016
Weather Update
June and July rainfall activities have so far remained satisfactory. Monsoon rainfall in the last two
months has been normal to excess in 25 out of 36 meteorological subdivisions. Gujarat still remains a
rainfall deficient state however by and large other states have seen normal rainfall activities.
Some important regions which contribute a major proportion of kharif season crop production namely
Maharashtra, Rajasthan and Madhya Pradesh have received ample rainfall to boost agricultural
activities. However, in some patches near to above normal rainfall was seen which may cause some
damage to the crop. At the same time, the crops in the Gujarat regions are water stressed thus the crop
growth may be adversely affected if monsoon rainfall activities do not improve in coming weeks.
Normal monsoon rainfall is seen at all India Level. The country received a cumulative seasonal rainfall
of 445.7 mm against a normal of 443.9 mm since 01 June – 30 July, 2016 (Departure: 0% from Long
Period Average) indicating a normal rainfall activity. Some states have received lesser rainfall however
majority of the states have received normal to excess rainfall.
The July rainfall over the country as whole has been 107% above the Long Period Average (LPA). The
rainfall during August is likely to be 104 ± 9% of LPA as was forecasted in June. Rainfall over the country
as a whole during second half of southwest monsoon season (August to September) is most likely to
be above normal (>106% of LPA) with a probability of 55%. Quantitatively, monsoon season rainfall for
the country as a whole is likely to be 106% of the long period average with a model error of ±4% as was
forecasted in June by IMD.
Region wise, the season rainfall is likely to be 108% of LPA over North-West India, 113% of LPA over
Central India, 113% of LPA over South Peninsula and 94% of LPA over North-East India all with a
model error of ± 8 %.
State Rainfall Map (1 June -30 July)
Source: IMD, New Delhi
Monthly Commodities Report 7 Monday, 02 August 2016
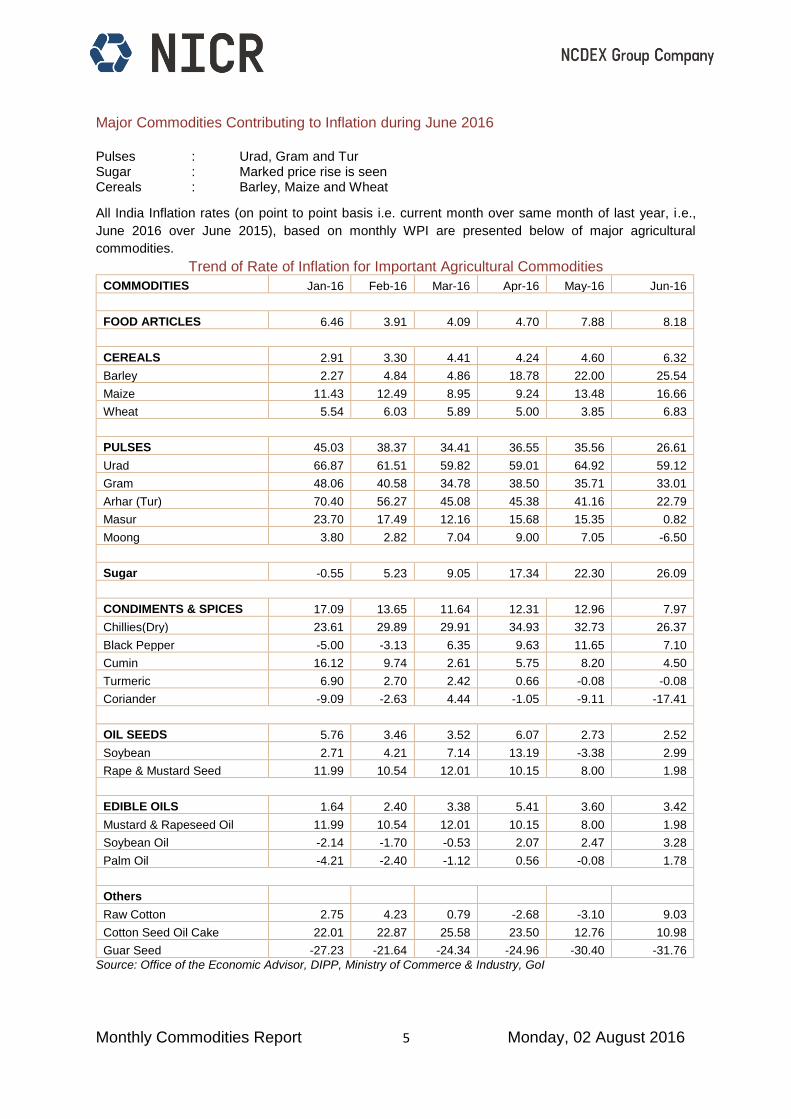
Kharif Crops Sowing Progress
Kharif sowing process is in full swing. About 75% of the normal sown area under kharif season is sown
till 29 July. As compared to last year, sowing is ahead by 6%. The total sown area at all India level as
on 29 July, 2016 stands at 799.51 lakh hectare as compared to 752.29 lakh hectare at this time last
year.
Sowing in the states like Andhra Pradesh, Karnataka, Maharashtra, Madhya Pradesh and Telengana
is running ahead while Rajasthan, Tamil Nadu, Haryana, Punjab and Chhattisgarh are lagging behind
from the previous year’s figures.
In terms of proportionate increase in sown area, pulse are running far ahead from other competing crop
registering about 41% increment in sown area compared to same period last year followed by oilseed
(8%). Cotton sowing is less by 9% this year compared to last year.
Pulses have been sown on 103% of the normal sown area. Sugarcane sowing is about 94% complete
of the normal area. Oilseeds have been sown on 86% of the normal sown area.
Guarseed sown area in Rajasthan has fallen by 43% as compared to the sown area during same period
last year. Only 35% of the normal sown area under Guarseed in Rajasthan is sown till 25 July 2016. In
Gujarat Guarseed sowing is less by 30% compared to last year.
In Telengana, as per market sources, the significant amount of cotton area is diverted towards soybean
and Moong (Green Gram).
All India Sowing Progress as on 29 July 2016 (all figures are in lakh ha)
As on 29 July 2016
Normal Area for Whole Kharif
Season
Share of
Crop in Normal
Area
Area sown Change over 2015-16 % of
Normal for
Whole Season
Share of Crop in Total Sown area of
India
2016-17
2015-16
Absolute Percentage 2016-17 2015-16
A B C D E = C-D F = E/D G = C/A H I
Total Cereals
592.37 56% 382.68 370.52 12.16 3% 65% 48% 49%
Total Oilseeds
185.59 17% 159.78 147.98 11.8 8% 86% 20% 20%
Total Pulses
107.59 10% 110.35 78.25 32.1 41% 103% 14% 10%
Cotton 120.34 11% 92.33 101.91 -9.58 -9% 77% 12% 14%
Sugarcane 49.96 5% 46.83 45.91 0.92 2% 94% 6% 6%
All Crops 1064.42 100% 799.51 752.29 47.22 6% 75% 100% 100% *Normal Area: it is the average of actual sown area of last 5 Years.
Data Source: MoAFW, GoI,
Major crops grown during Kharif Season
(i) Cereals : Paddy, Jowar, Bajra, Maize, Ragi
(ii) Pulses : Tur (Arhar), Moong, Urad
(iii) Oilseeds : Groundnut, Soybean, Sunflowerseed, Sesamum, Nigerseed, Castor seed
(iv) Cotton
(v) Guarseed
(vi) Sugarcane
(vii) Spices : Chilli and Turmeric

Monthly Commodities Report 8 Monday, 02 August 2016
Crop wise Sown Area Situation (all figures are in lakh ha)
As on 29 July 2016
Normal Area for Whole
Kharif Season
Area Sown Change over 2015-16 % of
Normal for
Whole Season
Share of Crop in Total Sown area of India
2016-17 2015-
16 Absolute Percentage 2016-17 2015-16
A B C D = B-C E = D/C F = B/A G H
Cereals
a) Rice 392.67 231.92 225.68 6.24 3% 59% 29% 30%
b) Bajra 81.63 52.23 58.07 -5.84 -10% 64% 7% 8%
c) Maize 73.50 75.94 66.12 9.82 15% 103% 9% 9%
d) Jowar 25.33 16.34 15.08 1.26 8% 65% 2% 2%
Total Cereals 592.37 382.68 370.52 12.16 3% 65% 48% 49%
Pulses
a) Tur (Arhar) 40.05 42.93 25.61 17.32 68% 107% 5% 3%
b) Urad 24.39 26.77 19.78 6.99 35% 110% 3% 3%
c) Moong 23.59 26.14 18.88 7.26 38% 111% 3% 3%
Total Pulses 107.59 110.35 78.25 32.1 41% 103% 14% 10%
Oilseeds
a) Soybean 106.36 109.16 106.27 2.89 3% 103% 14% 14%
b) Groundnut 43.77 38.57 28.7 9.87 34% 88% 5% 4%
c) Sesamum 18.23 9.42 10.9 -1.48 -14% 52% 1% 1%
d) Castorseed 11.48 1.04 1.21 -0.17 -14% 9% 0% 0%
Total Oilseeds 185.59 159.78 147.98 11.8 8% 86% 20% 20%
Other Cash Crops
Cotton 120.34 92.33 101.91 -9.58 -9% 77% 12% 14%
Sugarcane 49.96 46.83 45.91 0.92 2% 94% 6% 6%
Jute & Mesta 8.57 7.54 7.72 -0.18 -2% 88% 1% 1%
All Kharif Crops
Total Kharif Crops
1064.42 799.51 752.29 47.22 6% 75% 100% 100%
All Crops Kharif Crops Sowing Progress in Various States
All Crops
Normal Area for Whole Kharif
Season
State's Share
in Normal Kharif
Area of India
As on 29 July
Area sown Change over 2015-16 % of
Normal for
Whole Season
Share of State in Total sown area of
India
2016-17
2015-16
Absolute Percentage 2016-17 2015-16
A B C D E = C-D F = E/D G = C/A
H I
Maharashtra 149.26 14% 133.08 114.49 18.59 16% 89% 17% 15%
MP 118.70 11% 109.93 103.18 6.75 7% 93% 14% 14%
Rajasthan 112.79 11% 88.84 95.08 -6.24 -7% 79% 11% 13%
Uttar Pradesh 111.55 10% 91.35 90.82 0.53 1% 82% 11% 12%
Gujarat 77.70 7% 51.51 49.75 1.76 4% 66% 6% 7%
Karnataka 68.22 6% 50.21 33.12 17.09 52% 74% 6% 4%
West Bengal 49.84 5% 21.82 21.12 0.70 3% 44% 3% 3%
Orissa 47.79 4% 25.83 25.79 0.04 0% 54% 3% 3%
Chhattisgarh 44.75 4% 32.90 33.69 -0.79 -2% 74% 4% 4%
AP 41.75 4% 20.27 12.68 7.59 60% 49% 3% 2%
Telengana 39.96 4% 27.66 26.25 1.41 5% 69% 3% 3%
Bihar 38.05 4% 27.53 27.21 0.32 1% 72% 3% 4%
Punjab 35.67 3% 35.00 36.15 -1.15 -3% 98% 4% 5%
Tamil Nadu 30.95 3% 7.30 7.76 -0.46 -6% 24% 1% 1%
Haryana 25.24 2% 23.11 24.00 -0.89 -4% 92% 3% 3%
Jharkhand 18.85 2% 10.32 10.07 0.25 2% 55% 1% 1%
All India 1064.42 100% 799.51 752.29 47.22 6% 75% 100% 100%
Monthly Commodities Report 9 Monday, 02 August 2016
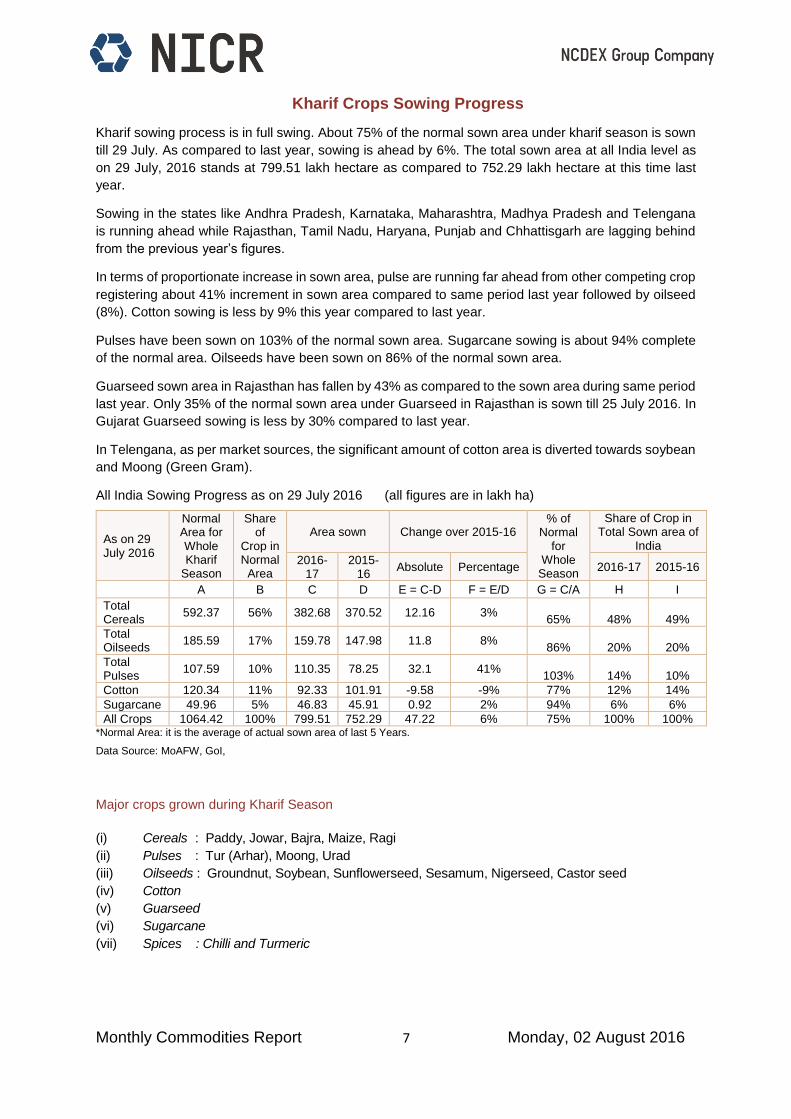
Crop wise Kharif Sowing Progress in various States ((all figures are in lakh ha)
Cereals
Rice
Normal Rice Area for
Whole Kharif Season
State's Share in Normal Kharif Rice
Area of India
As on 29 July
Area sown Change over 2015-16 % of
Normal for
Whole Season
Share of State in Total Rice sown
area of India
2016-17
2015-16
Absolute Percentage 2016-17 2015-16
A B C D E = C-D F = E/D G = C/A H I
Uttar Pradesh
58.40 15% 44.19 43.82 0.37 1% 76% 19% 19%
West Bengal 40.63 10% 15.71 14.74 0.97 7% 39% 7% 7%
Orissa 38.39 10% 17.21 17.49 -0.28 -2% 45% 7% 8%
Chhattisgarh 37.74 10% 27.65 28.24 -0.59 -2% 73% 12% 13%
Bihar 30.82 8% 18.80 18.89 -0.09 0% 61% 8% 8%
Punjab 28.48 7% 29.71 29.30 0.41 1% 104% 13% 13%
Assam 21.10 5% 13.13 13.93 -0.80 -6% 62% 6% 6%
Madhya Pradesh
18.46 5% 13.81 10.23 3.58 35% 75% 6% 5%
Andhra Pradesh
16.48 4% 4.48 3.81 0.67 18% 27% 2% 2%
Tamil Nadu 16.14 4% 2.15 1.94 0.21 11% 13% 1% 1%
Maharashtra 15.21 4% 6.35 4.68 1.67 36% 42% 3% 2%
Jharkhand 12.72 3% 5.04 5.46 -0.42 -8% 40% 2% 2%
Haryana 12.42 3% 10.18 11.74 -1.56 -13% 82% 4% 5%
Telengana 10.50 3% 1.91 1.19 0.72 61% 18% 1% 1%
All India 392.67 100% 231.92 225.68 6.24 3% 59% 100% 100%
Maize
Normal Maize Area for
Whole Kharif Season
State's Share in Normal Kharif Maize
Area of India
As on 29 July
Area sown Change over 2015-16 % of
Normal for
Whole Season
Share of State in Total Maize sown
area of India
2016-17
2015-16
Absolute Percentage 2016-17 2015-16
A B C D E = C-D F = E/D G = C/A H I
Karnataka 11.93 16% 11.00 7.80 3.20 41% 92% 14% 12%
Rajasthan 9.94 14% 9.45 8.36 1.09 13% 95% 12% 13%
Madhya Pradesh
9.08 12% 12.14 10.43 1.71 16% 134% 16% 16%
Maharashtra 7.41 10% 8.03 6.66 1.37 21% 108% 11% 10%
Uttar Pradesh
7.06 10% 6.74 7.15 -0.41 -6% 95% 9% 11%
Telengana 4.62 6% 5.10 3.49 1.61 46% 110% 7% 5%
Gujarat 3.63 5% 3.05 2.80 0.25 9% 84% 4% 4%
Jammu & Kashmir
3.06 4% 1.98 2.07 -0.09 -4% 65% 3% 3%
Himachal Pradesh
2.94 4% 2.97 2.95 0.02 1% 101% 4% 4%
Bihar 2.62 4% 4.18 3.95 0.23 6% 160% 6% 6%
Jharkhand 2.35 3% 2.47 2.35 0.12 5% 105% 3% 4%
Tamil Nadu 1.74 2% 0.08 0.10 -0.02 -20% 5% 0% 0%
Punjab 1.29 2% 1.45 1.46 -0.01 -1% 112% 2% 2%
Chhattisgarh 1.09 1% 1.76 1.71 0.05 3% 161% 2% 3%
Orissa 0.97 1% 1.91 1.84 0.07 4% 197% 3% 3%
Andhra Pradesh
0.83 1% 0.54 0.40 0.14 35% 65% 1% 1%
All India 73.5 100% 75.94 66.12 9.82 15% 103% 100% 100%

Monthly Commodities Report 10 Monday, 02 August 2016
Pulses (all figures are in lakh ha)
Pulses
Normal Pulse Area for
Whole Kharif Season
State's Share in Normal Kharif Pulse
Area of India
As on 29 July
Area sown Change over 2015-16 % of
Normal for
Whole Season
Share of State in Total Pulse sown
area of India
2016-17
2015-16
Absolute Percentage 2016-17 2015-16
A B C D E = C-D F = E/D G = C/A H I
Rajasthan 24.21 23% 22.95 19.00 3.95 21% 95% 21% 24%
Maharashtra 21.02 20% 23.38 14.91 8.47 57% 111% 21% 19%
Karnataka 13.48 13% 15.32 7.74 7.58 98% 114% 14% 10%
Madhya Pradesh
12.72 12% 17.80 13.23 4.57 35% 140% 16% 17%
Uttar Pradesh
8.82 8% 7.17 6.89 6.28 91% 81% 6% 9%
Gujarat 5.06 5% 3.87 2.45 2.04 83% 76% 4% 3%
Orissa 4.70 4% 3.40 3.04 0.36 12% 72% 3% 4%
Telengana 4.51 4% 5.58 3.16 2.42 77% 124% 5% 4%
Jharkhand 3.15 3% 2.73 2.08 0.65 31% 87% 2% 3%
Andhra Pradesh
2.62 2% 2.38 0.66 1.72 261% 91% 2% 1%
Tamil Nadu 2.16 2% 0.89 0.86 0.03 3% 41% 1% 1%
Chhattisgarh 2.11 2% 1.46 1.63 -0.17 -10% 69% 1% 2%
All India 107.59 100% 110.35 78.25 32.1 41% 103% 100% 100%
Tur (Arhar)
Normal Tur Area for
Whole Kharif Season
State's Share in Normal Kharif
Tur Area of India
As on 29 July
Area sown Change over 2015-16 % of
Normal area for Whole Season
Share of State in Total Tur Sown
area of India
2016-17
2015-16
Absolute Percentage 2016-17 2015-16
A B C D E = C-D F = E/D G = C/A H I
Maharashtra 12.13 30% 13.94 8.53 5.41 63% 115% 32% 33%
Karnataka 7.74 19% 10.01 3.34 6.67 200% 129% 23% 13%
Madhya Pradesh
5.08 13% 6.03 4.53 1.50 33% 119% 14% 18%
UP 3.13 8% 2.26 2.47 -0.21 -9% 72% 5% 10%
Telengana 2.80 7% 3.77 1.88 1.89 101% 135% 9% 7%
Gujarat 2.35 6% 2.42 1.64 0.78 48% 103% 6% 6%
Andhra Pradesh
2.04 5% 1.71 0.42 1.29 307% 84% 4% 2%
Jharkhand 1.61 4% 0.00 0.00 0.00 #DIV/0! 0% 0% 0%
Orissa 1.39 3% 0.95 1.01 -0.06 -6% 68% 2% 4%
All India 40.05 100% 42.93 25.61 17.32 68% 107% 100% 100%

Monthly Commodities Report 11 Monday, 02 August 2016
Urad
Normal Urad Area for
Whole Kharif Season
State's Share in Normal Kharif Urad
Area of India
As on 29 July
Area sown Change over 2015-16 % of
Normal for
Whole Season
Share of State in Total Urad Sown
area of India
2016-17
2015-16
Absolute Percentage 2016-17 2015-16
A B C D E = C-D F = E/D G = C/A H I
Madhya Pradesh
6.45 26% 9.72 7.49 2.23 30% 151% 36% 38%
UP 5.21 21% 4.51 4.07 0.44 11% 87% 17% 21%
Maharashtra 3.63 15% 4.11 2.35 1.76 75% 113% 15% 12%
Rajasthan 2.00 8% 3.51 2.07 1.44 70% 176% 13% 10%
Orissa 1.00 4% 0.94 0.74 0.20 27% 94% 4% 4%
Chhattisgarh 0.97 4% 0.53 0.66 -0.13 -20% 55% 2% 3%
Karnataka 0.93 4% 0.77 0.70 0.07 10% 83% 3% 4%
Jharkhand 0.93 4% 0.00 0.00 0.00 #DIV/0! 0% 0% 0%
Gujarat 0.90 4% 0.97 0.54 0.43 80% 108% 4% 3%
Tamil Nadu 0.53 2% 0.34 0.20 0.14 70% 64% 1% 1%
Andhra Pradesh
0.19 1% 0.33 0.04 0.29 725% 174% 1% 0%
All India 24.39 100% 26.77 19.78 6.99 35% 110% 100% 100%
Moong
Normal Moong Area
for Whole Kharif
Season
State's Share in Normal Kharif Moong Area of India
As on 29 July
Area sown Change over 2015-16 % of Normal
for Whole Season
Share of State in Total Moong Sown
area of India
2016-17
2015-16
Absolute Percentage 2016-17 2015-16
A B C D E = C-D F = E/D G = C/A H I
Rajasthan 10.05 41% 11.97 8.73 3.24 37% 119% 46% 46%
Maharashtra 4.33 18% 4.70 3.23 1.47 46% 109% 18% 17%
Karnataka 2.83 12% 3.74 2.76 0.98 36% 132% 14% 15%
Gujarat 1.36 6% 0.38 0.21 0.17 81% 28% 1% 1%
Telengana 1.29 5% 1.39 1.01 0.38 38% 108% 5% 5%
Orissa 1.05 4% 1.05 0.81 0.24 30% 100% 4% 4%
MP 1.02 4% 1.71 1.12 0.59 53% 168% 7% 6%
UP 0.48 2% 0.40 0.35 0.05 14% 83% 2% 2%
Andhra Pradesh
0.26 1% 0.28 0.15 0.13 87% 108% 1% 1%
All India 23.59 97% 26.14 18.88 7.26 38% 111% 100% 100%

Monthly Commodities Report 12 Monday, 02 August 2016
Oilseeds (all figures are in lakh ha)
Oilseeds
Normal Oilseeds Area for
Whole Kharif Season
State's Share in Normal Kharif
Oilseeds Area of India
As on 29 July
Area sown Change over 2015-16 % of Normal
for Whole Season
Share of State in Total oilseeds
sown area of India
2016-17
2015-16
Absolute Percentage 2016-17 2015-16
A B C D E = C-D F = E/D G = C/A H I
MP 64.34 35% 56.21 59.44 -3.23 -5% 87% 35% 40%
Maharashtra 36.01 19% 39.21 34.19 5.02 15% 109% 25% 23%
Gujarat 24.67 13% 17.08 14.39 2.69 19% 69% 11% 10%
Rajasthan 20.35 11% 17.18 18.59 -1.41 -8% 84% 11% 13%
AP 12.95 7% 7.94 3.54 4.40 124% 61% 5% 2%
Karnataka 9.85 5% 8.66 5.47 3.19 58% 88% 5% 4%
UP 4.45 2% 4.12 4.49 -0.37 -8% 93% 3% 3%
Tamil Nadu 2.92 2% 1.05 1.16 -0.11 -9% 36% 1% 1%
Telengana 2.73 1% 3.34 2.84 0.50 18% 122% 2% 2%
Chhattisgarh 2.18 1% 1.85 1.91 -0.06 -3% 85% 1% 1%
All India 185.59 100% 159.78 147.98 11.8 8% 86% 100% 100%
Groundnut
Normal Groundnut
Area for Whole Kharif
Season
State's Share in Normal Kharif
Groundnut Area of India
As on 29 July
Area sown Change over 2015-16 % of
Normal for
Whole Season
Share of State in Total Groundnut
sown area of India
2016-17
2015-16
Absolute Percentage 2016-17 2015-16
A B C D E = C-D F = E/D G = C/A H I
Gujarat 14.92 34% 15.02 12.62 2.40 19% 101% 39% 44%
AP 10.57 24% 7.39 3.22 4.17 130% 70% 19% 11%
Karnataka 5.05 12% 4.11 1.84 2.27 123% 81% 11% 6%
Rajasthan 4.24 10% 4.06 4.31 -0.25 -6% 96% 11% 15%
Maharashtra 2.48 6% 1.87 1.61 0.26 16% 75% 5% 6%
Tamil Nadu 2.32 5% 1.00 1.05 -0.05 -5% 43% 3% 4%
MP 2.12 5% 2.06 1.92 0.14 7% 97% 5% 7%
UP 0.93 2% 0.87 0.83 0.04 5% 94% 2% 3%
Chhattisgarh 0.27 1% 0.43 0.42 0.01 2% 159% 1% 1%
Telengana 0.21 0% 0.07 0.05 0.02 40% 33% 0% 0%
All India 43.77 100% 38.57 28.7 9.87 34% 88% 100% 100%
Soybean
Normal Soybean Area for
Whole Kharif Season
State's Share in Normal Kharif
Soybean Area of India
As on 29 July
Area sown Change over 2015-16 % of
Normal for Whole Season
Share of State in Total Soybean
sown area of India
2016-17
2015-16
Absolute Percentage 2016-17 2015-16
A B C D E = C-D F = E/D G = C/A H I
MP 58.30 55% 52.58 55.46 -2.88 -5% 90% 48% 52%
Maharashtra 32.24 30% 36.81 32.20 4.61 14% 114% 34% 30%
Rajasthan 9.60 9% 10.25 10.66 -0.41 -4% 107% 9% 10%
Karnataka 2.01 2% 3.05 2.66 0.39 15% 152% 3% 3%
Telengana 1.31 1% 2.86 2.42 0.44 18% 218% 3% 2%
Chhattisgarh 1.05 1% 1.32 1.35 -0.03 -2% 126% 1% 1%
Gujarat 0.58 1% 1.24 0.83 0.41 49% 214% 1% 1%
AP 0.50 0% 0.01 0.00 0.01 #DIV/0! 2% 0% 0%
UP 0.24 0% 0.35 0.31 0.04 13% 146% 0% 0%
All India 106.36 100% 109.16 106.27 2.89 3% 103% 100% 100%

Monthly Commodities Report 13 Monday, 02 August 2016
Other Commercial Crops (all figures are in lakh ha)
Cotton
Normal Cotton Area for Whole
Kharif Season
State's Share in Normal Kharif Cotton Area of India
As on 29 July
Area sown Change over 2015-16 % of
Normal for
Whole Season
Share of State in Total Cotton sown
area of India
2016-17
2015-16
Absolute Percentage 2016-17 2015-16
A B C D E = C-D F = E/D G = C/A H I
Maharashtra 41.19 34% 36.27 36.10 0.17 0% 88% 39% 35%
Gujarat 26.77 22% 20.38 23.48 -3.10 -13% 76% 22% 23%
Telengana 16.32 14% 11.22 15.21 -3.99 -26% 69% 12% 15%
Karnataka 6.24 5% 3.60 3.69 -0.09 -2% 58% 4% 4%
Madhya Pradesh
6.05 5% 5.27 5.42 -0.15 -3% 87% 6% 5%
Haryana 5.86 5% 4.98 5.81 -0.83 -14% 85% 5% 6%
Andhra Pradesh
5.84 5% 2.85 2.78 0.07 3% 49% 3% 3%
Punjab 4.87 4% 2.56 4.50 -1.94 -43% 53% 3% 4%
Rajasthan 4.27 4% 3.74 3.49 0.25 7% 88% 4% 3%
Tamil Nadu 1.44 1% 0.03 0.03 0.00 0% 2% 0% 0%
Orissa 1.09 1% 1.26 1.19 0.07 6% 116% 1% 1%
All India 120.34 100% 92.33 101.91 -9.58 -9% 77% 100% 100%
Sugarcane
Normal Sugarcane
Area for Whole Kharif
Season
State's Share in Normal Kharif
Sugarcane Area of India
As on 29 July
Area sown Change over 2015-16 % of
Normal for
Whole Season
Share of State in Total Kharif
Sugarcane sown area of India
2016-17
2015-16
Absolute Percentage 2016-17 2015-16
A B C D E = C-D F = E/D G = C/A H I
Uttar Pradesh
21.74 44% 21.79 20.52 1.27 6% 100% 47% 45%
Maharashtra 9.77 20% 7.62 8.21 -0.59 -7% 78% 16% 18%
Karnataka 4.36 9% 4.44 3.96 0.48 12% 102% 9% 9%
Tamil Nadu 3.17 6% 2.68 2.94 -0.26 -9% 85% 6% 6%
Bihar 2.46 5% 2.52 2.50 0.02 1% 102% 5% 5%
Gujarat 1.90 4% 1.87 2.03 -0.16 -8% 98% 4% 4%
Andhra Pradesh
1.52 3% 1.40 1.17 0.23 20% 92% 3% 3%
Uttrakhand 1.06 2% 0.86 0.90 -0.04 -4% 81% 2% 2%
Haryana 0.96 2% 1.13 1.13 0.00 0% 118% 2% 2%
Punjab 0.83 2% 0.94 0.70 0.24 34% 113% 2% 2%
All India 49.96 100% 46.83 45.91 0.92 2% 94% 100% 100%
Guarseed Normal Gaur
Area for Whole Kharif Season
As on 29 July
Area sown Change over 2015-16 % of Normal for Whole Season 2016-17 2015-16 Absolute Percentage
A C D E = C-D F = E/D G = C/A
Rajasthan 40.60 14.27 25.18 -10.91 -43% 35%
Gujarat 37.88 5.30 7.60 -2.30 -30% 14%
Monthly Commodities Report 14 Monday, 02 August 2016
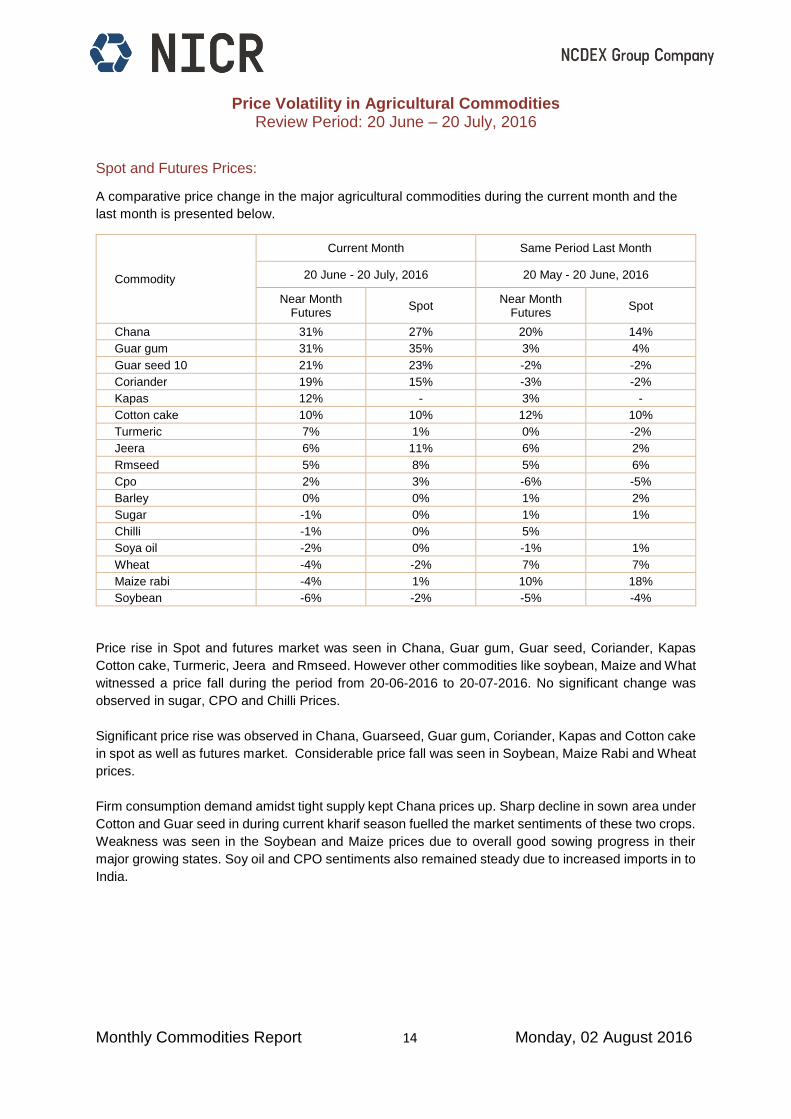
Price Volatility in Agricultural Commodities Review Period: 20 June – 20 July, 2016
Spot and Futures Prices:
A comparative price change in the major agricultural commodities during the current month and the
last month is presented below.
Commodity
Current Month Same Period Last Month
20 June - 20 July, 2016 20 May - 20 June, 2016
Near Month Futures
Spot Near Month
Futures Spot
Chana 31% 27% 20% 14%
Guar gum 31% 35% 3% 4%
Guar seed 10 21% 23% -2% -2%
Coriander 19% 15% -3% -2%
Kapas 12% - 3% -
Cotton cake 10% 10% 12% 10%
Turmeric 7% 1% 0% -2%
Jeera 6% 11% 6% 2%
Rmseed 5% 8% 5% 6%
Cpo 2% 3% -6% -5%
Barley 0% 0% 1% 2%
Sugar -1% 0% 1% 1%
Chilli -1% 0% 5%
Soya oil -2% 0% -1% 1%
Wheat -4% -2% 7% 7%
Maize rabi -4% 1% 10% 18%
Soybean -6% -2% -5% -4%
Price rise in Spot and futures market was seen in Chana, Guar gum, Guar seed, Coriander, Kapas
Cotton cake, Turmeric, Jeera and Rmseed. However other commodities like soybean, Maize and What
witnessed a price fall during the period from 20-06-2016 to 20-07-2016. No significant change was
observed in sugar, CPO and Chilli Prices.
Significant price rise was observed in Chana, Guarseed, Guar gum, Coriander, Kapas and Cotton cake
in spot as well as futures market. Considerable price fall was seen in Soybean, Maize Rabi and Wheat
prices.
Firm consumption demand amidst tight supply kept Chana prices up. Sharp decline in sown area under
Cotton and Guar seed in during current kharif season fuelled the market sentiments of these two crops.
Weakness was seen in the Soybean and Maize prices due to overall good sowing progress in their
major growing states. Soy oil and CPO sentiments also remained steady due to increased imports in to
India.
Monthly Commodities Report 15 Monday, 02 August 2016
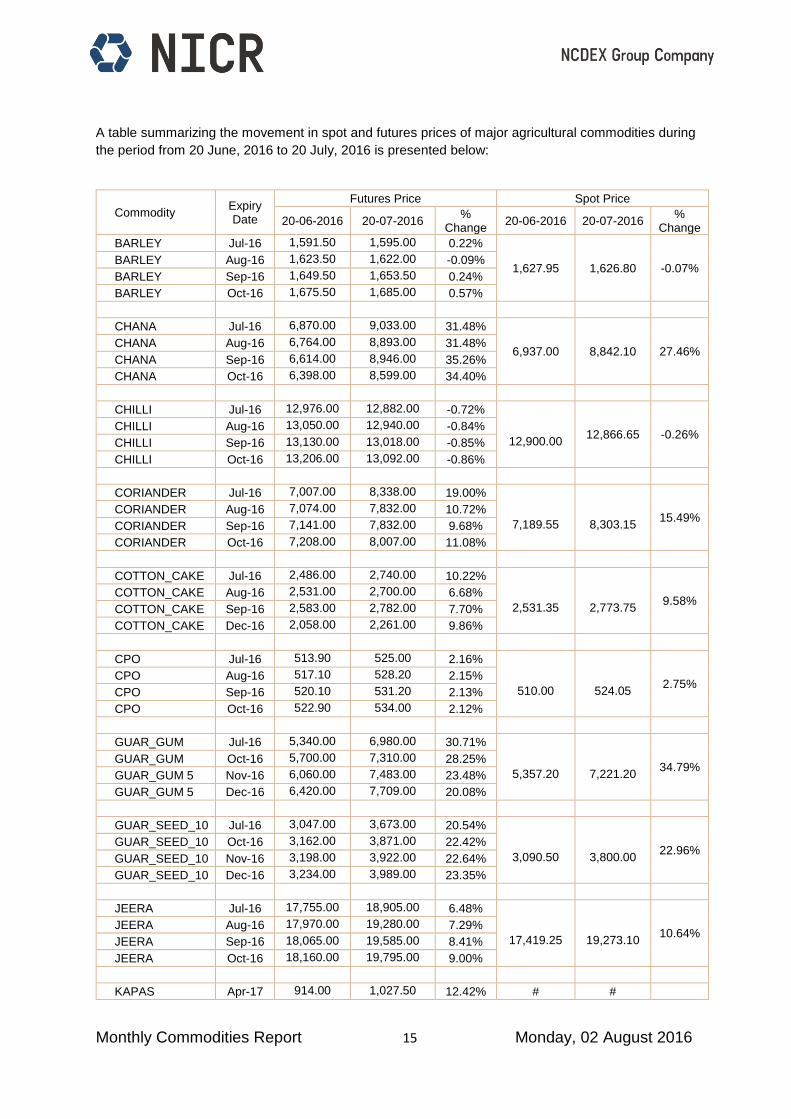
A table summarizing the movement in spot and futures prices of major agricultural commodities during
the period from 20 June, 2016 to 20 July, 2016 is presented below:
Commodity Expiry Date
Futures Price Spot Price
20-06-2016 20-07-2016 %
Change 20-06-2016 20-07-2016
% Change
BARLEY Jul-16 1,591.50 1,595.00 0.22%
1,627.95 1,626.80 -0.07% BARLEY Aug-16 1,623.50 1,622.00 -0.09%
BARLEY Sep-16 1,649.50 1,653.50 0.24%
BARLEY Oct-16 1,675.50 1,685.00 0.57%
CHANA Jul-16 6,870.00 9,033.00 31.48%
6,937.00 8,842.10 27.46% CHANA Aug-16 6,764.00 8,893.00 31.48%
CHANA Sep-16 6,614.00 8,946.00 35.26%
CHANA Oct-16 6,398.00 8,599.00 34.40%
CHILLI Jul-16 12,976.00 12,882.00 -0.72%
12,900.00
12,866.65 -0.26% CHILLI Aug-16 13,050.00 12,940.00 -0.84%
CHILLI Sep-16 13,130.00 13,018.00 -0.85%
CHILLI Oct-16 13,206.00 13,092.00 -0.86%
CORIANDER Jul-16 7,007.00 8,338.00 19.00%
7,189.55
8,303.15
15.49% CORIANDER Aug-16 7,074.00 7,832.00 10.72%
CORIANDER Sep-16 7,141.00 7,832.00 9.68%
CORIANDER Oct-16 7,208.00 8,007.00 11.08%
COTTON_CAKE Jul-16 2,486.00 2,740.00 10.22%
2,531.35
2,773.75
9.58% COTTON_CAKE Aug-16 2,531.00 2,700.00 6.68%
COTTON_CAKE Sep-16 2,583.00 2,782.00 7.70%
COTTON_CAKE Dec-16 2,058.00 2,261.00 9.86%
CPO Jul-16 513.90 525.00 2.16%
510.00
524.05
2.75% CPO Aug-16 517.10 528.20 2.15%
CPO Sep-16 520.10 531.20 2.13%
CPO Oct-16 522.90 534.00 2.12%
GUAR_GUM Jul-16 5,340.00 6,980.00 30.71%
5,357.20
7,221.20
34.79% GUAR_GUM Oct-16 5,700.00 7,310.00 28.25%
GUAR_GUM 5 Nov-16 6,060.00 7,483.00 23.48%
GUAR_GUM 5 Dec-16 6,420.00 7,709.00 20.08%
GUAR_SEED_10 Jul-16 3,047.00 3,673.00 20.54%
3,090.50
3,800.00
22.96% GUAR_SEED_10 Oct-16 3,162.00 3,871.00 22.42%
GUAR_SEED_10 Nov-16 3,198.00 3,922.00 22.64%
GUAR_SEED_10 Dec-16 3,234.00 3,989.00 23.35%
JEERA Jul-16 17,755.00 18,905.00 6.48%
17,419.25
19,273.10
10.64% JEERA Aug-16 17,970.00 19,280.00 7.29%
JEERA Sep-16 18,065.00 19,585.00 8.41%
JEERA Oct-16 18,160.00 19,795.00 9.00%
KAPAS Apr-17 914.00 1,027.50 12.42% # #
Monthly Commodities Report 16 Monday, 02 August 2016
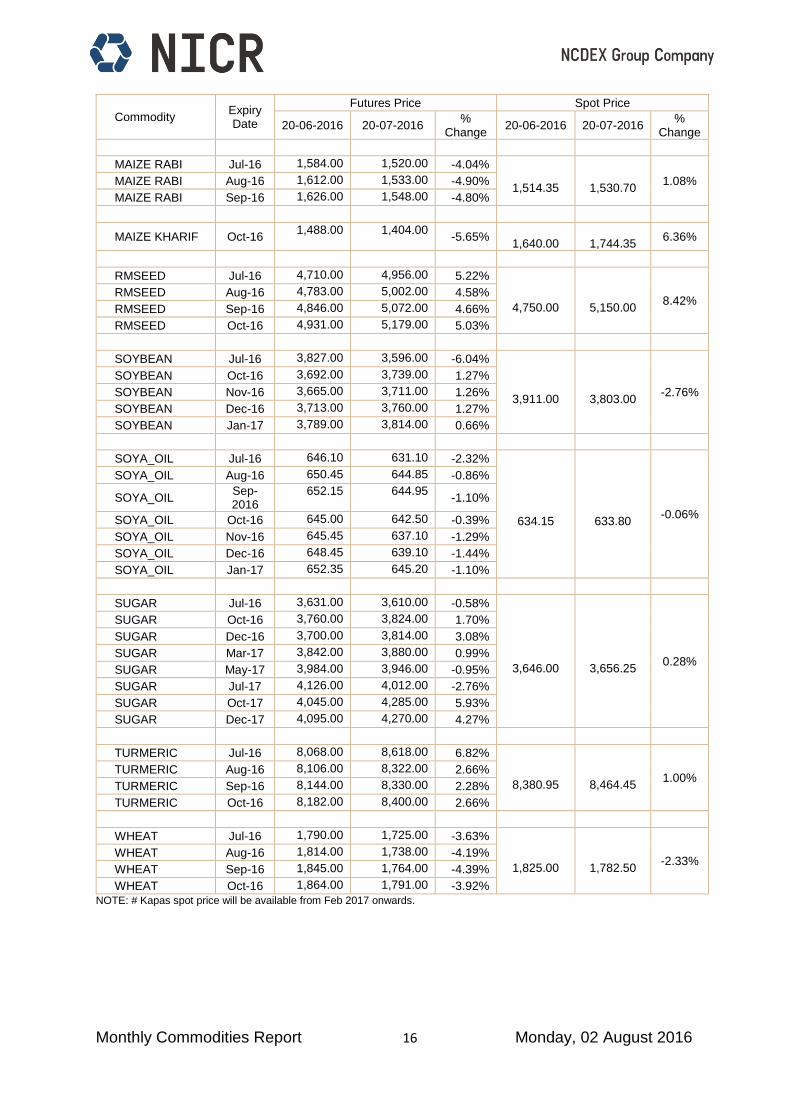
Commodity Expiry Date
Futures Price Spot Price
20-06-2016 20-07-2016 %
Change 20-06-2016 20-07-2016
% Change
MAIZE RABI Jul-16 1,584.00 1,520.00 -4.04%
1,514.35
1,530.70 1.08% MAIZE RABI Aug-16 1,612.00 1,533.00 -4.90%
MAIZE RABI Sep-16 1,626.00 1,548.00 -4.80%
MAIZE KHARIF Oct-16 1,488.00 1,404.00
-5.65%
1,640.00
1,744.35 6.36%
RMSEED Jul-16 4,710.00 4,956.00 5.22%
4,750.00
5,150.00
8.42% RMSEED Aug-16 4,783.00 5,002.00 4.58%
RMSEED Sep-16 4,846.00 5,072.00 4.66%
RMSEED Oct-16 4,931.00 5,179.00 5.03%
SOYBEAN Jul-16 3,827.00 3,596.00 -6.04%
3,911.00
3,803.00
-2.76%
SOYBEAN Oct-16 3,692.00 3,739.00 1.27%
SOYBEAN Nov-16 3,665.00 3,711.00 1.26%
SOYBEAN Dec-16 3,713.00 3,760.00 1.27%
SOYBEAN Jan-17 3,789.00 3,814.00 0.66%
SOYA_OIL Jul-16 646.10 631.10 -2.32%
634.15
633.80
-0.06%
SOYA_OIL Aug-16 650.45 644.85 -0.86%
SOYA_OIL Sep-2016
652.15 644.95 -1.10%
SOYA_OIL Oct-16 645.00 642.50 -0.39%
SOYA_OIL Nov-16 645.45 637.10 -1.29%
SOYA_OIL Dec-16 648.45 639.10 -1.44%
SOYA_OIL Jan-17 652.35 645.20 -1.10%
SUGAR Jul-16 3,631.00 3,610.00 -0.58%
3,646.00
3,656.25
0.28%
SUGAR Oct-16 3,760.00 3,824.00 1.70%
SUGAR Dec-16 3,700.00 3,814.00 3.08%
SUGAR Mar-17 3,842.00 3,880.00 0.99%
SUGAR May-17 3,984.00 3,946.00 -0.95%
SUGAR Jul-17 4,126.00 4,012.00 -2.76%
SUGAR Oct-17 4,045.00 4,285.00 5.93%
SUGAR Dec-17 4,095.00 4,270.00 4.27%
TURMERIC Jul-16 8,068.00 8,618.00 6.82%
8,380.95
8,464.45
1.00% TURMERIC Aug-16 8,106.00 8,322.00 2.66%
TURMERIC Sep-16 8,144.00 8,330.00 2.28%
TURMERIC Oct-16 8,182.00 8,400.00 2.66%
WHEAT Jul-16 1,790.00 1,725.00 -3.63%
1,825.00
1,782.50
-2.33% WHEAT Aug-16 1,814.00 1,738.00 -4.19%
WHEAT Sep-16 1,845.00 1,764.00 -4.39%
WHEAT Oct-16 1,864.00 1,791.00 -3.92%
NOTE: # Kapas spot price will be available from Feb 2017 onwards.

Monthly Commodities Report 17 Monday, 02 August 2016
Price Movement in Major Internationally traded Agricultural Commodities
Cotton prices in the international market rose by 11.74%. Commodities like Corn, Wheat, Soymeal, and
Soybean observed sharp fall in prices. Moderate price fall was seen in CPO and Soy oil prices.
A table summarizing the movement in futures prices of major internationally traded agricultural
commodities during the period from 20 June to 20 July, 2016 is presented below:
Commodity Exchange Price Unit
Price as on
Price as on
Change Major Specification
20-Jun-16 20-Jul-16
Cotton ICE Cents/Pound 64.39 71.95 11.74% Cotton No. 2 Futures, Strict Low Middling Staple Length:
1 2/32nd inc
Sugar LIFFE Dollar/MT 536.4 535.9 -0.09% No. 5- Refined Sugar
CPO BMD Ringgit/MT 2443 2387 -2.29% Crude Palm Kernel Oil in bulk unbleached of good
merchantable quality.
Soy Oil CBOT Cents/lb 31.64 30.71 -2.94% Crude soybean oil meeting
exchange -approved grades-expeller pressed
Soybean CBOT Cents/Bushel 1143.5 1027 -10.19% No.2- Yellow Soybean
Soy meal CBOT Dollar and Cents/short ton
402.7 352 -12.59% 48% Protein soybean meal
Wheat CBOT Cents/Bushel 473 413 -12.68% No. 2 Soft Red Winter
Corn CBOT Cents/Bushel 421.25 337.5 -19.88% No. 2 Yellow Maize
Note:
CBOT: Chicago Board of Trade (US), ICE: Intercontinental Exchange (US) LIFFE: The London International Financial Futures and Options Exchange (UK) BMD: Bursa Malaysia Derivatives (Malaysia); previously known as KLSE i.e. Kuala Lumpur Stock Exchange
Monthly Commodities Report 18 Monday, 02 August 2016
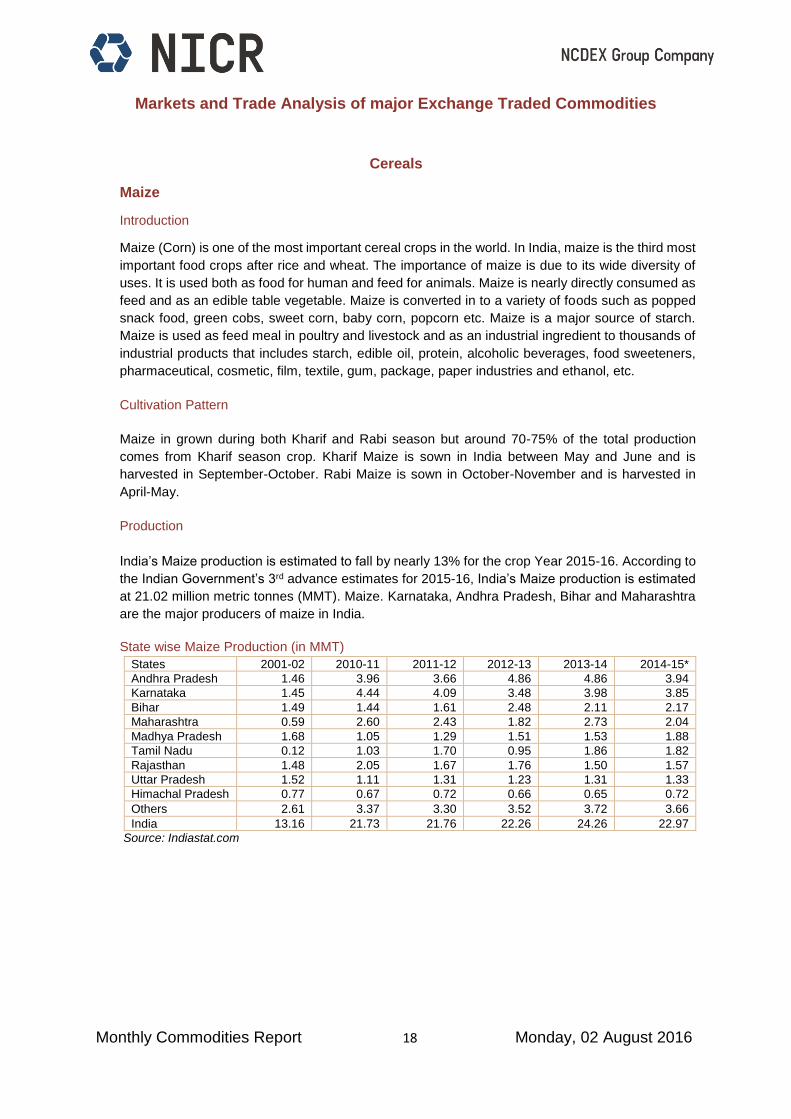
Markets and Trade Analysis of major Exchange Traded Commodities
Cereals
Maize
Introduction
Maize (Corn) is one of the most important cereal crops in the world. In India, maize is the third most
important food crops after rice and wheat. The importance of maize is due to its wide diversity of
uses. It is used both as food for human and feed for animals. Maize is nearly directly consumed as
feed and as an edible table vegetable. Maize is converted in to a variety of foods such as popped
snack food, green cobs, sweet corn, baby corn, popcorn etc. Maize is a major source of starch.
Maize is used as feed meal in poultry and livestock and as an industrial ingredient to thousands of
industrial products that includes starch, edible oil, protein, alcoholic beverages, food sweeteners,
pharmaceutical, cosmetic, film, textile, gum, package, paper industries and ethanol, etc.
Cultivation Pattern
Maize in grown during both Kharif and Rabi season but around 70-75% of the total production
comes from Kharif season crop. Kharif Maize is sown in India between May and June and is
harvested in September-October. Rabi Maize is sown in October-November and is harvested in
April-May.
Production
India’s Maize production is estimated to fall by nearly 13% for the crop Year 2015-16. According to
the Indian Government’s 3rd advance estimates for 2015-16, India’s Maize production is estimated
at 21.02 million metric tonnes (MMT). Maize. Karnataka, Andhra Pradesh, Bihar and Maharashtra
are the major producers of maize in India.
State wise Maize Production (in MMT)
States 2001-02 2010-11 2011-12 2012-13 2013-14 2014-15*
Andhra Pradesh 1.46 3.96 3.66 4.86 4.86 3.94
Karnataka 1.45 4.44 4.09 3.48 3.98 3.85
Bihar 1.49 1.44 1.61 2.48 2.11 2.17
Maharashtra 0.59 2.60 2.43 1.82 2.73 2.04
Madhya Pradesh 1.68 1.05 1.29 1.51 1.53 1.88
Tamil Nadu 0.12 1.03 1.70 0.95 1.86 1.82
Rajasthan 1.48 2.05 1.67 1.76 1.50 1.57
Uttar Pradesh 1.52 1.11 1.31 1.23 1.31 1.33
Himachal Pradesh 0.77 0.67 0.72 0.66 0.65 0.72
Others 2.61 3.37 3.30 3.52 3.72 3.66
India 13.16 21.73 21.76 22.26 24.26 22.97
Source: Indiastat.com
Monthly Commodities Report 19 Monday, 02 August 2016
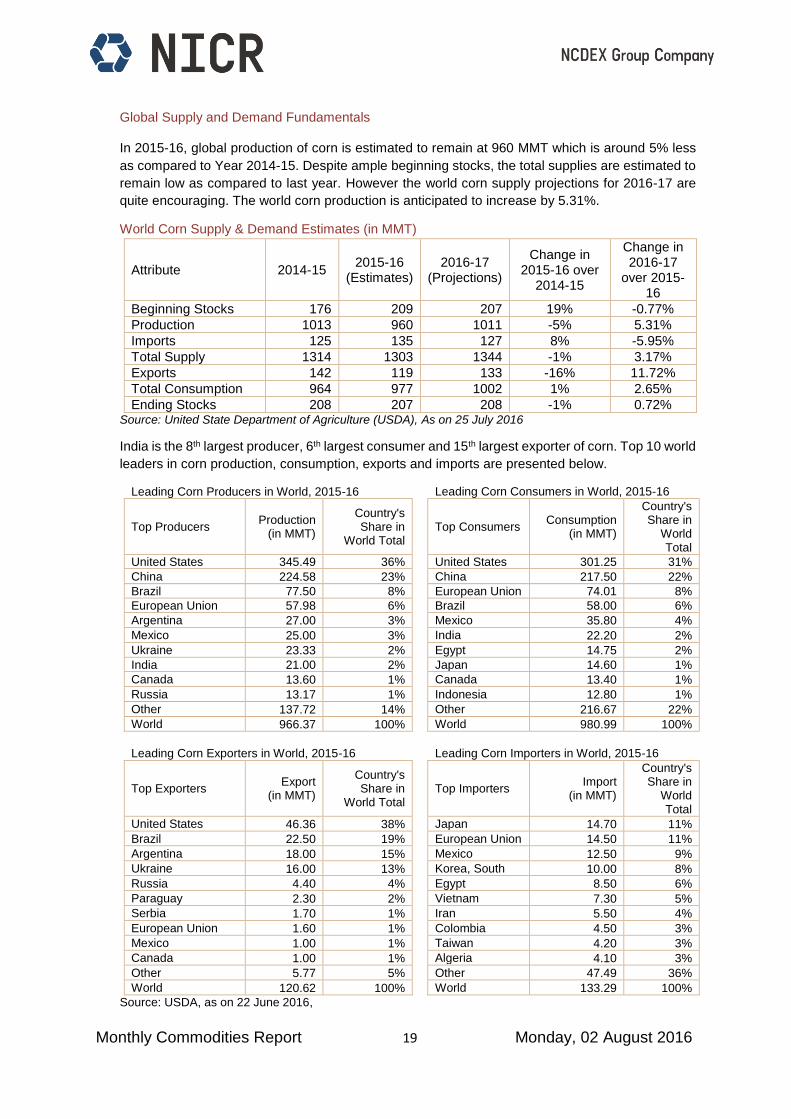
Global Supply and Demand Fundamentals In 2015-16, global production of corn is estimated to remain at 960 MMT which is around 5% less
as compared to Year 2014-15. Despite ample beginning stocks, the total supplies are estimated to
remain low as compared to last year. However the world corn supply projections for 2016-17 are
quite encouraging. The world corn production is anticipated to increase by 5.31%.
World Corn Supply & Demand Estimates (in MMT)
Attribute 2014-15 2015-16
(Estimates) 2016-17
(Projections)
Change in 2015-16 over
2014-15
Change in 2016-17
over 2015-16
Beginning Stocks 176 209 207 19% -0.77%
Production 1013 960 1011 -5% 5.31%
Imports 125 135 127 8% -5.95%
Total Supply 1314 1303 1344 -1% 3.17%
Exports 142 119 133 -16% 11.72%
Total Consumption 964 977 1002 1% 2.65%
Ending Stocks 208 207 208 -1% 0.72% Source: United State Department of Agriculture (USDA), As on 25 July 2016
India is the 8th largest producer, 6th largest consumer and 15th largest exporter of corn. Top 10 world
leaders in corn production, consumption, exports and imports are presented below.
Leading Corn Producers in World, 2015-16 Leading Corn Consumers in World, 2015-16
Top Producers Production
(in MMT)
Country's Share in
World Total
Top Consumers Consumption
(in MMT)
Country's Share in
World Total
United States 345.49 36% United States 301.25 31%
China 224.58 23% China 217.50 22%
Brazil 77.50 8% European Union 74.01 8%
European Union 57.98 6% Brazil 58.00 6%
Argentina 27.00 3% Mexico 35.80 4%
Mexico 25.00 3% India 22.20 2%
Ukraine 23.33 2% Egypt 14.75 2%
India 21.00 2% Japan 14.60 1%
Canada 13.60 1% Canada 13.40 1%
Russia 13.17 1% Indonesia 12.80 1%
Other 137.72 14% Other 216.67 22%
World 966.37 100% World 980.99 100%
Leading Corn Exporters in World, 2015-16 Leading Corn Importers in World, 2015-16
Top Exporters Export
(in MMT)
Country's Share in
World Total
Top Importers Import
(in MMT)
Country's Share in
World Total
United States 46.36 38% Japan 14.70 11%
Brazil 22.50 19% European Union 14.50 11%
Argentina 18.00 15% Mexico 12.50 9%
Ukraine 16.00 13% Korea, South 10.00 8%
Russia 4.40 4% Egypt 8.50 6%
Paraguay 2.30 2% Vietnam 7.30 5%
Serbia 1.70 1% Iran 5.50 4%
European Union 1.60 1% Colombia 4.50 3%
Mexico 1.00 1% Taiwan 4.20 3%
Canada 1.00 1% Algeria 4.10 3%
Other 5.77 5% Other 47.49 36%
World 120.62 100% World 133.29 100%
Source: USDA, as on 22 June 2016,
Monthly Commodities Report 20 Monday, 02 August 2016
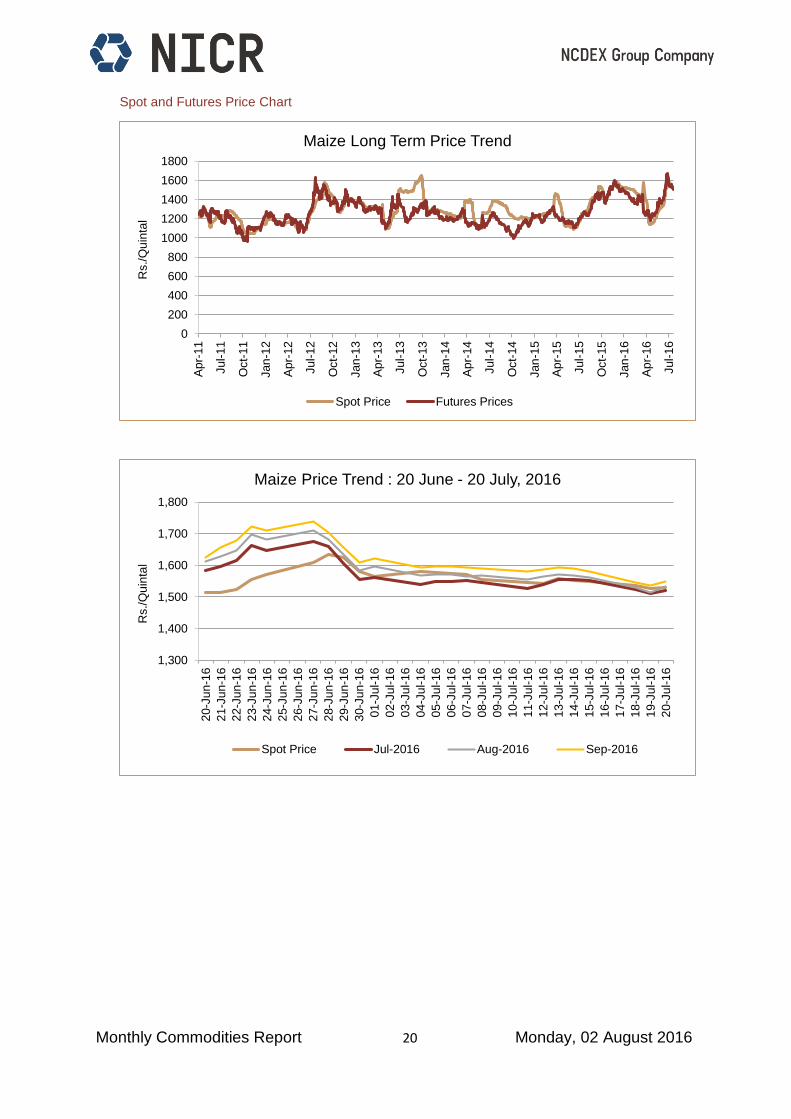
Spot and Futures Price Chart
0
200
400
600
800
1000
1200
1400
1600
1800
Ap
r-11
Jul-
11
Oct-
11
Jan
-12
Ap
r-12
Jul-
12
Oct-
12
Jan
-13
Ap
r-13
Jul-
13
Oct-
13
Jan
-14
Ap
r-14
Jul-
14
Oct-
14
Jan
-15
Ap
r-15
Jul-
15
Oct-
15
Jan
-16
Ap
r-16
Jul-
16
Rs./
Qu
inta
lMaize Long Term Price Trend
Spot Price Futures Prices
1,300
1,400
1,500
1,600
1,700
1,800
20-J
un-1
6
21-J
un-1
6
22-J
un-1
6
23-J
un-1
6
24-J
un-1
6
25-J
un-1
6
26-J
un-1
6
27-J
un-1
6
28-J
un-1
6
29-J
un-1
6
30-J
un-1
6
01-J
ul-1
6
02-J
ul-1
6
03-J
ul-1
6
04-J
ul-1
6
05-J
ul-1
6
06-J
ul-1
6
07-J
ul-1
6
08-J
ul-1
6
09-J
ul-1
6
10-J
ul-1
6
11-J
ul-1
6
12-J
ul-1
6
13-J
ul-1
6
14-J
ul-1
6
15-J
ul-1
6
16-J
ul-1
6
17-J
ul-1
6
18-J
ul-1
6
19-J
ul-1
6
20-J
ul-1
6
Rs./
Qu
inta
l
Maize Price Trend : 20 June - 20 July, 2016
Spot Price Jul-2016 Aug-2016 Sep-2016
Monthly Commodities Report 21 Monday, 02 August 2016
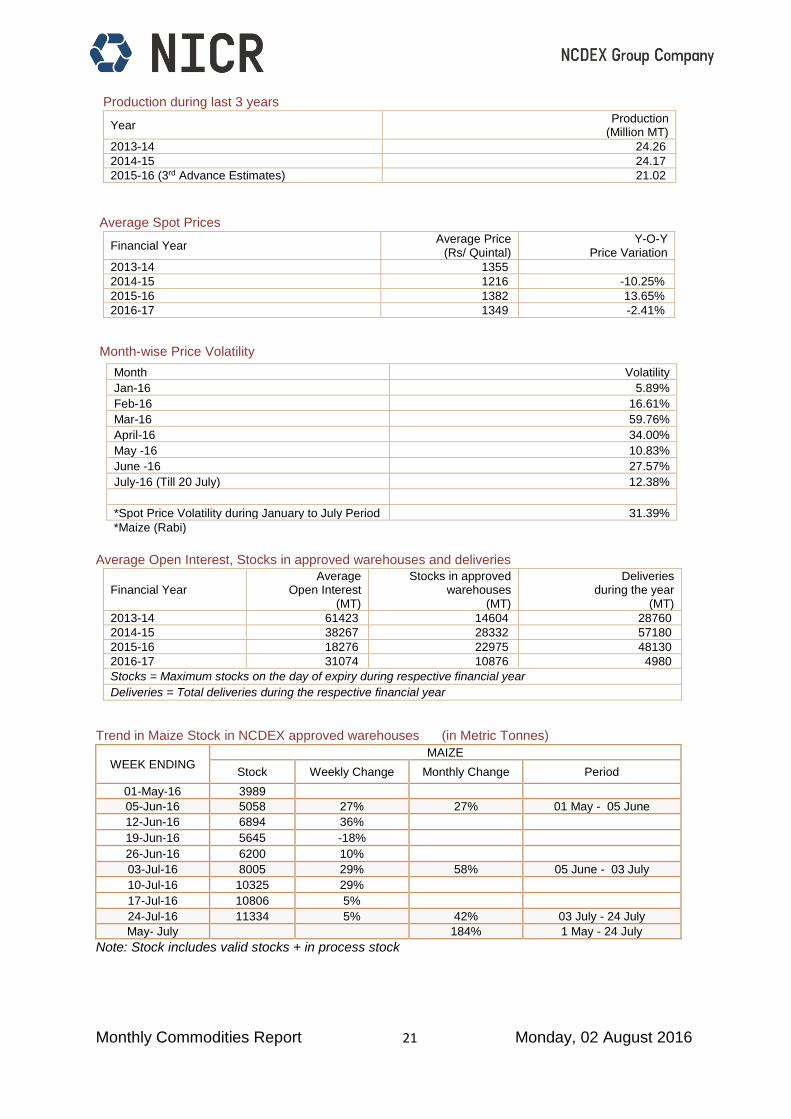
Production during last 3 years
Year Production
(Million MT)
2013-14 24.26
2014-15 24.17
2015-16 (3rd Advance Estimates) 21.02
Average Spot Prices
Financial Year Average Price
(Rs/ Quintal) Y-O-Y
Price Variation
2013-14 1355
2014-15 1216 -10.25%
2015-16 1382 13.65%
2016-17 1349 -2.41%
Month-wise Price Volatility
*Maize (Rabi)
Average Open Interest, Stocks in approved warehouses and deliveries
Financial Year Average
Open Interest (MT)
Stocks in approved warehouses
(MT)
Deliveries during the year
(MT)
2013-14 61423 14604 28760
2014-15 38267 28332 57180
2015-16 18276 22975 48130
2016-17 31074 10876 4980
Stocks = Maximum stocks on the day of expiry during respective financial year
Deliveries = Total deliveries during the respective financial year
Trend in Maize Stock in NCDEX approved warehouses (in Metric Tonnes)
WEEK ENDING MAIZE
Stock Weekly Change Monthly Change Period
01-May-16 3989
05-Jun-16 5058 27% 27% 01 May - 05 June
12-Jun-16 6894 36%
19-Jun-16 5645 -18%
26-Jun-16 6200 10%
03-Jul-16 8005 29% 58% 05 June - 03 July
10-Jul-16 10325 29%
17-Jul-16 10806 5%
24-Jul-16 11334 5% 42% 03 July - 24 July
May- July 184% 1 May - 24 July
Note: Stock includes valid stocks + in process stock
Month Volatility
Jan-16 5.89%
Feb-16 16.61%
Mar-16 59.76%
April-16 34.00%
May -16 10.83%
June -16 27.57%
July-16 (Till 20 July) 12.38%
*Spot Price Volatility during January to July Period 31.39%
Monthly Commodities Report 22 Monday, 02 August 2016
Markets and Trade
Weakness is seen in Maize domestic as well international prices during the period under review (20
June-20 July 2016).
Domestic Spot market prices fell by 2% while near month futures declined by 4%.
In international market (CBOT) Corn price fell by 19.88% during the period under review.
Kharif season Maize sown area has seen increment this year. The sown area at all India level is
increased by 9% as compared to previous year. Karnataka, Rajasthan and Madhya Pradesh have
witnessed an area increase by 32, 19 and 20% respectively by 22 July 2016.
Better sowing prospects in India and weak international markets have remained one of the most
important factors behind the weakness in the Maize prices during period under review.
Maize stocks at the NCDEX approved warehouses have shown increment of about 184% during
last three months. This has also resulted in to weakness in the market prices.
Arrivals have also declined amidst subdued demand.
As per 3rd Advance Estimate for 2015-16, maize production is estimated to be around 21.02 million
tonnes in 2015-16 as against 24.17 million tonnes produced in 2014-15 (down by 13%).
Indian state-run trading company PEC Ltd has floated a new international tender to buy and import
200,000 tonnes of non-GMO yellow corn (maize). Shipment is sought between Dec. 15, 2016 and
Jan. 31, 2017. Earlier, PEC received only one offer in a tender to import 120,000 tonnes of GMO-
free corn. The sole tender participant offered only 25,000 tonnes of corn due to difficulties in sourcing
non-GMO corn as it is grown by only few countries in the world. It is to be learnt that Indian
government has asked state trading houses to import an extra half a million tonnes of GMO-free
corn to curve rising prices and ease domestic supplies.
International
International corn prices at CBOT has also seen sharp fall (19.88%) during the period under review.
In 2015-16, global production of corn is estimated to remain at 960 MMT which is around 5% less
as compared to Year 2014-15. Despite ample beginning stocks, the total supplies are estimated to
remain low as compared to last year. However the world corn supply projections for 2016-17 are
quite encouraging. The world corn production is anticipated to increase by 5.31%.
Brazil corn production for 2015-16 is lowered 7.5 MMT. Argentina corn production for 2015-16 is
raised 1.0 MMT based on harvest data reported to date. Global 2016-17 coarse grain consumption
is lowered 3.3 MMT mainly due to reduction in corn feeding, mostly reflecting for the United States,
Brazil, China, EU, South Korea, and Indonesia.
EU corn imports are lowered for 2015-16 and 2016-17 with greater wheat and barley feeding.
Brazil corn exports are lowered for 2015-16 and 2016-17, down 4.0 MMT and 1.0 MMT,
respectively. Global 2016-17 corn ending stocks are projected 3.3 MMT higher mostly on a 2.1-
million-tonnes increase for China. Outside of China, corn stocks are 1.2 MMT higher with larger
stocks for the United States and Indonesia more than offsetting reductions for Brazil, Japan, and
Canada.
(Source: USDA)
Monthly Commodities Report 23 Monday, 02 August 2016
Wheat
Introduction
In India, wheat is the second most important food crop after rice. Wheat grain is a staple food used
to make flour for steamed breads, biscuits, cookies, cakes, breakfast cereal, pasta, noodles, and
for fermentation to make beer, other alcoholic beverages or biofuel. The principal parts of wheat
flour are gluten and starch. The by-products of milling whole grain are bran and germ. The whole
grain is a concentrated source of vitamins, minerals, and protein, while the refined grain is mostly
starch. Wheat starch is an important commercial product of wheat, but second in economic value
to wheat gluten.
Cultivation Pattern
Wheat is a major Rabi crop in India. Sowing takes place between October and November. The
maturity period ranges from 110-140 days depending on the variety and location. Harvesting takes
place between April and May.
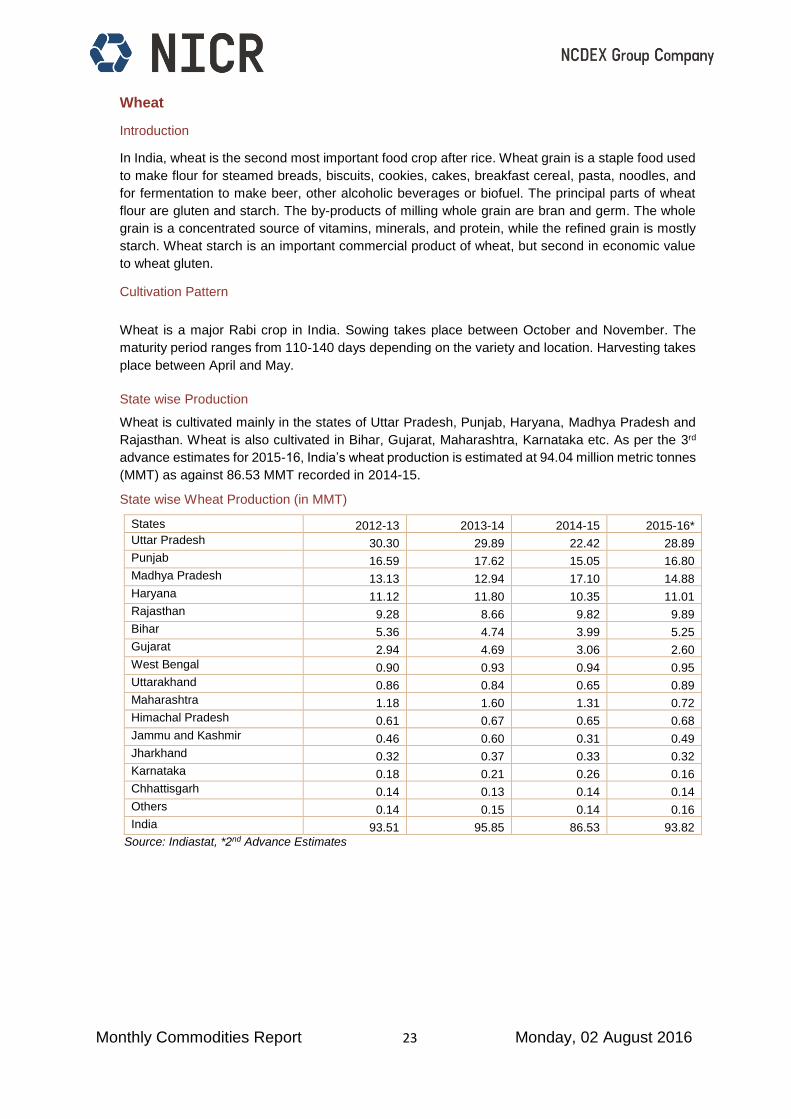
State wise Production
Wheat is cultivated mainly in the states of Uttar Pradesh, Punjab, Haryana, Madhya Pradesh and
Rajasthan. Wheat is also cultivated in Bihar, Gujarat, Maharashtra, Karnataka etc. As per the 3rd
advance estimates for 2015-16, India’s wheat production is estimated at 94.04 million metric tonnes
(MMT) as against 86.53 MMT recorded in 2014-15.
State wise Wheat Production (in MMT)
States 2012-13 2013-14 2014-15 2015-16*
Uttar Pradesh 30.30 29.89 22.42 28.89
Punjab 16.59 17.62 15.05 16.80
Madhya Pradesh 13.13 12.94 17.10 14.88
Haryana 11.12 11.80 10.35 11.01
Rajasthan 9.28 8.66 9.82 9.89
Bihar 5.36 4.74 3.99 5.25
Gujarat 2.94 4.69 3.06 2.60
West Bengal 0.90 0.93 0.94 0.95
Uttarakhand 0.86 0.84 0.65 0.89
Maharashtra 1.18 1.60 1.31 0.72
Himachal Pradesh 0.61 0.67 0.65 0.68
Jammu and Kashmir 0.46 0.60 0.31 0.49
Jharkhand 0.32 0.37 0.33 0.32
Karnataka 0.18 0.21 0.26 0.16
Chhattisgarh 0.14 0.13 0.14 0.14
Others 0.14 0.15 0.14 0.16
India 93.51 95.85 86.53 93.82
Source: Indiastat, *2nd Advance Estimates
Monthly Commodities Report 24 Monday, 02 August 2016
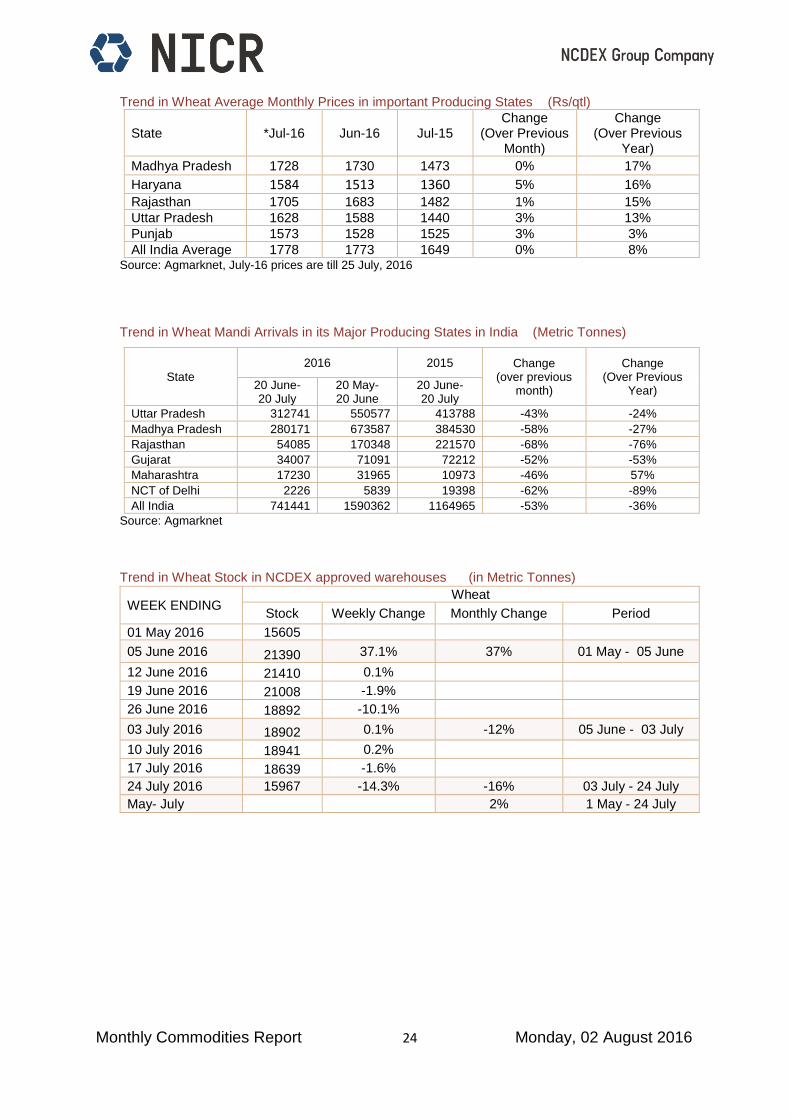
Trend in Wheat Average Monthly Prices in important Producing States (Rs/qtl)
State *Jul-16 Jun-16 Jul-15 Change
(Over Previous Month)
Change (Over Previous
Year)
Madhya Pradesh 1728 1730 1473 0% 17%
Haryana 1584 1513 1360 5% 16%
Rajasthan 1705 1683 1482 1% 15%
Uttar Pradesh 1628 1588 1440 3% 13%
Punjab 1573 1528 1525 3% 3%
All India Average 1778 1773 1649 0% 8% Source: Agmarknet, July-16 prices are till 25 July, 2016
Trend in Wheat Mandi Arrivals in its Major Producing States in India (Metric Tonnes)
State
2016 2015 Change (over previous
month)
Change (Over Previous
Year) 20 June- 20 July
20 May- 20 June
20 June- 20 July
Uttar Pradesh 312741 550577 413788 -43% -24%
Madhya Pradesh 280171 673587 384530 -58% -27%
Rajasthan 54085 170348 221570 -68% -76%
Gujarat 34007 71091 72212 -52% -53%
Maharashtra 17230 31965 10973 -46% 57%
NCT of Delhi 2226 5839 19398 -62% -89%
All India 741441 1590362 1164965 -53% -36%
Source: Agmarknet
Trend in Wheat Stock in NCDEX approved warehouses (in Metric Tonnes)
WEEK ENDING Wheat
Stock Weekly Change Monthly Change Period
01 May 2016 15605
05 June 2016 21390 37.1% 37% 01 May - 05 June
12 June 2016 21410 0.1%
19 June 2016 21008 -1.9%
26 June 2016 18892 -10.1%
03 July 2016 18902 0.1% -12% 05 June - 03 July
10 July 2016 18941 0.2%
17 July 2016 18639 -1.6%
24 July 2016 15967 -14.3% -16% 03 July - 24 July
May- July 2% 1 May - 24 July
Monthly Commodities Report 25 Monday, 02 August 2016
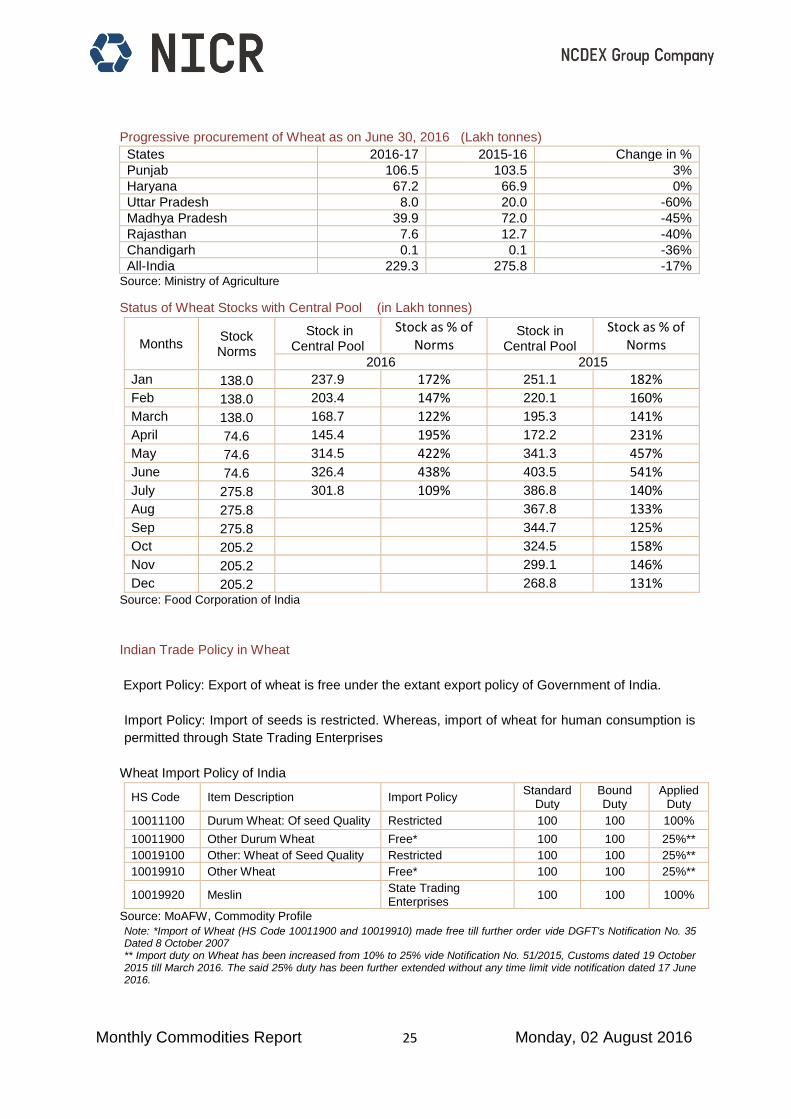
Progressive procurement of Wheat as on June 30, 2016 (Lakh tonnes)
States 2016-17 2015-16 Change in %
Punjab 106.5 103.5 3%
Haryana 67.2 66.9 0%
Uttar Pradesh 8.0 20.0 -60%
Madhya Pradesh 39.9 72.0 -45%
Rajasthan 7.6 12.7 -40%
Chandigarh 0.1 0.1 -36%
All-India 229.3 275.8 -17% Source: Ministry of Agriculture
Status of Wheat Stocks with Central Pool (in Lakh tonnes)
Months Stock Norms
Stock in Central Pool
Stock as % of Norms
Stock in Central Pool
Stock as % of Norms
2016 2015
Jan 138.0 237.9 172% 251.1 182% Feb 138.0 203.4 147% 220.1 160%
March 138.0 168.7 122% 195.3 141% April 74.6 145.4 195% 172.2 231% May 74.6 314.5 422% 341.3 457% June 74.6 326.4 438% 403.5 541%
July 275.8 301.8 109% 386.8 140% Aug 275.8 367.8 133%
Sep 275.8 344.7 125%
Oct 205.2 324.5 158% Nov 205.2 299.1 146%
Dec 205.2 268.8 131% Source: Food Corporation of India
Indian Trade Policy in Wheat
Export Policy: Export of wheat is free under the extant export policy of Government of India.
Import Policy: Import of seeds is restricted. Whereas, import of wheat for human consumption is
permitted through State Trading Enterprises
Wheat Import Policy of India
HS Code Item Description Import Policy Standard
Duty Bound Duty
Applied Duty
10011100 Durum Wheat: Of seed Quality Restricted 100 100 100%
10011900 Other Durum Wheat Free* 100 100 25%**
10019100 Other: Wheat of Seed Quality Restricted 100 100 25%**
10019910 Other Wheat Free* 100 100 25%**
10019920 Meslin State Trading Enterprises
100 100 100%
Source: MoAFW, Commodity Profile
Note: *Import of Wheat (HS Code 10011900 and 10019910) made free till further order vide DGFT's Notification No. 35 Dated 8 October 2007 ** Import duty on Wheat has been increased from 10% to 25% vide Notification No. 51/2015, Customs dated 19 October 2015 till March 2016. The said 25% duty has been further extended without any time limit vide notification dated 17 June 2016.
Monthly Commodities Report 26 Monday, 02 August 2016
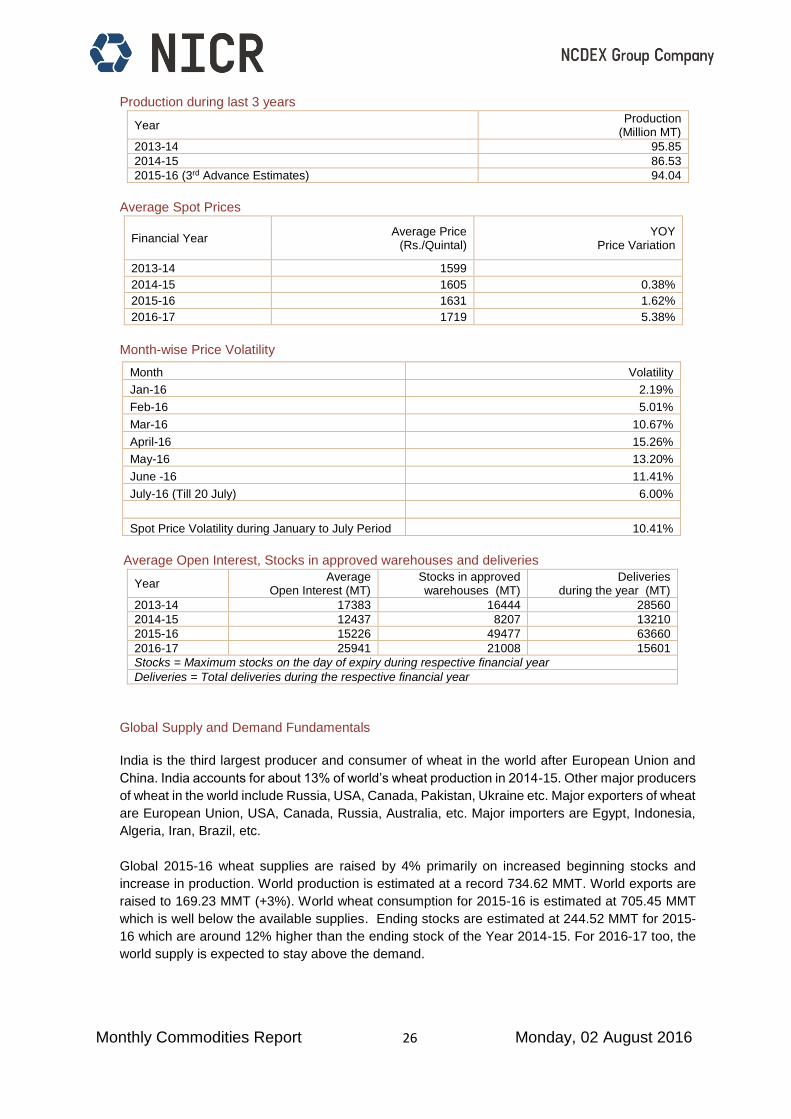
Production during last 3 years
Year Production
(Million MT)
2013-14 95.85
2014-15 86.53
2015-16 (3rd Advance Estimates) 94.04
Average Spot Prices
Financial Year Average Price
(Rs./Quintal) YOY
Price Variation
2013-14 1599
2014-15 1605 0.38%
2015-16 1631 1.62%
2016-17 1719 5.38%
Month-wise Price Volatility
Average Open Interest, Stocks in approved warehouses and deliveries
Year Average
Open Interest (MT) Stocks in approved warehouses (MT)
Deliveries during the year (MT)
2013-14 17383 16444 28560
2014-15 12437 8207 13210
2015-16 15226 49477 63660
2016-17 25941 21008 15601
Stocks = Maximum stocks on the day of expiry during respective financial year
Deliveries = Total deliveries during the respective financial year
Global Supply and Demand Fundamentals
India is the third largest producer and consumer of wheat in the world after European Union and
China. India accounts for about 13% of world’s wheat production in 2014-15. Other major producers
of wheat in the world include Russia, USA, Canada, Pakistan, Ukraine etc. Major exporters of wheat
are European Union, USA, Canada, Russia, Australia, etc. Major importers are Egypt, Indonesia,
Algeria, Iran, Brazil, etc.
Global 2015-16 wheat supplies are raised by 4% primarily on increased beginning stocks and
increase in production. World production is estimated at a record 734.62 MMT. World exports are
raised to 169.23 MMT (+3%). World wheat consumption for 2015-16 is estimated at 705.45 MMT
which is well below the available supplies. Ending stocks are estimated at 244.52 MMT for 2015-
16 which are around 12% higher than the ending stock of the Year 2014-15. For 2016-17 too, the
world supply is expected to stay above the demand.
Month Volatility
Jan-16 2.19%
Feb-16 5.01%
Mar-16 10.67%
April-16 15.26%
May-16 13.20%
June -16 11.41%
July-16 (Till 20 July) 6.00%
Spot Price Volatility during January to July Period 10.41%

Monthly Commodities Report 27 Monday, 02 August 2016
World Wheat Supply & Demand Estimates (in MMT)
Attributes 2014-15 2015-16
(Estimates) 2016-17
(Projections)
Change in 2015-16 over
2014-15
Projected Change in
2016-17 over 2015-16
Beginning Stocks 194.18 217.40 244.52 12% 12%
Production 727.85 734.62 738.51 1% 1%
MY Imports 158.84 167.18 164.20 5% -2%
Total Supply 1080.87 1119.20 1147.23 4% 3%
MY Exports 164.14 169.23 168.43 3% 0%
Total Consumption 699.32 705.45 725.11 1% 3%
Ending Stocks 217.40 244.52 253.70 12% 4%
Source: USDA, as on 25 July 2016,
India is the 3rd largest producer as well as consumer of Wheat. However it is neither a big exporter
nor a big importer of Wheat.
Leading Wheat Producers in World, 2015-16 Leading Wheat Consumers in World, 2015-16
Country Production
(MMT) Country's Share
in World Total
Country Consumption
(MMT)
Country's Share in
World Total
European Union 160.01 22% European Union 128.80 18%
China 130.19 18% China 112.00 16%
India 86.53 12% India 88.64 13%
Russia 61.04 8% Russia 37.00 5%
United States 55.84 8% United States 31.74 4%
Canada 27.60 4% Pakistan 24.40 3%
Ukraine 27.27 4% Egypt 19.20 3%
Pakistan 25.10 3% Turkey 18.00 3%
Australia 24.50 3% Iran 18.00 3%
Turkey 19.50 3% Ukraine 12.50 2%
Other 116.66 16% Other 215.15 30%
World 734.24 100% World 705.43 100%
Leading Wheat Exporters in World, 2015-16 Leading Wheat Importers in World, 2015-16
Country Export (MMT)
Country's Share in World Total
Country Import (MMT)
Country's Share in
World Total
European Union 33.00 20% Egypt 11.50 7%
Russia 24.50 15% Indonesia 9.10 5%
Canada 22.50 13% Algeria 8.10 5%
United States 21.09 13% European Union 6.70 4%
Australia 16.50 10% Brazil 6.00 4%
Ukraine 15.80 9% Japan 5.70 3%
Argentina 9.00 5% Morocco 4.70 3%
Kazakhstan 7.50 4% Thailand 4.50 3%
Turkey 5.50 3% Philippines 4.50 3%
Mexico 1.30 1% Mexico 4.50 3%
Other 11.59 7% Other 100.64 61%
World 168.28 100% World 165.94 100%
Source: USDA, June 2016

Monthly Commodities Report 28 Monday, 02 August 2016
Spot and Futures Price Chart
0
200
400
600
800
1,000
1,200
1,400
1,600
1,800
2,000
Ap
r-11
Jul-
11
Oct-
11
Jan
-12
Ap
r-12
Jul-
12
Oct-
12
Jan
-13
Ap
r-13
Jul-
13
Oct-
13
Jan
-14
Ap
r-14
Jul-
14
Oct-
14
Jan
-15
Ap
r-15
Jul-
15
Oct-
15
Jan
-16
Ap
r-16
Jul-
16
Rs./
Qu
inta
l
Wheat Long Term Price Trend
Spot Price Futures Price
1,600
1,650
1,700
1,750
1,800
1,850
1,900
1,950
20-J
un-1
6
21-J
un-1
6
22-J
un-1
6
23-J
un-1
6
24-J
un-1
6
25-J
un-1
6
26-J
un-1
6
27-J
un-1
6
28-J
un-1
6
29-J
un-1
6
30-J
un-1
6
01-J
ul-1
6
02-J
ul-1
6
03-J
ul-1
6
04-J
ul-1
6
05-J
ul-1
6
06-J
ul-1
6
07-J
ul-1
6
08-J
ul-1
6
09-J
ul-1
6
10-J
ul-1
6
11-J
ul-1
6
12-J
ul-1
6
13-J
ul-1
6
14-J
ul-1
6
15-J
ul-1
6
16-J
ul-1
6
17-J
ul-1
6
18-J
ul-1
6
19-J
ul-1
6
20-J
ul-1
6
Rs./
Qu
inta
l
Wheat Price Trend : 20 June - 20 July, 2016
Spot Price Jul-2016 Aug-2016 Sep-2016 Oct-2016 Nov-2016

Monthly Commodities Report 29 Monday, 02 August 2016
Markets and Trade
Wheat spot as well as near month futures prices fell by around 2 and 4 % respectively during the
period under review (20 June-20 July 2016). Wheat prices at CBOT fell by 12.68%.
Baring Madhya Pradesh, all other major wheat producing states like Rajasthan, Uttar Pradesh,
Punjab and Haryana witnessed slight increase in Wheat prices. But the wheat prices are higher
by more than 10% in most of the major wheat producing states. In Madhya Pradesh, the wheat
prices are higher by 17% compared to corresponding period last year. The prevailing mandi prices
are higher than MSP in these states.
Mandi Arrivals have declined by more than 50% in all these states as compared to previous
month, however the arrivals are around 30% low at all India basis compared to corresponding
period last year.
There has been continuous declines in the stock in the NCDEX approved warehouses in the past
two months due to withdrawal by the market participants reflecting that demand has remained
firm during previous months.
The Wheat stock in the July month with the central pool is about 109% of the prescribed norms for
the July-September quarter. However during 2015-16, it was about 140% of the prescribed norms.
It is to be noted that market get signals from the stock availability with the government and its time
to time disposal in the open market. This year Indian government missed the set wheat
procurement targets for 2016-17. The Wheat stock in the Central Pool as on 1 July 2016 was 301.8
lakh tonnes as against the stocking norms for Central Pool (Buffer Norms) of 275.8 lakh tonnes for
the quarter July-September. The annual requirement under National Food Security Act (NFSA) is
around 240 lakh tonnes.
Wheat procurement by the government agencies, has been down by 17% to around 229.3 lakh
tonnes during April- June 30, 2016 over the corresponding period of the last year. It must be noted
that government set the target of 280 lakh tonnes for wheat procurement for the wheat marketing
season 2016-17. The contribution of states like UP, Rajasthan and Madhya Pradesh in
Government procurement has reduced drastically in the range of 40-60% compared to last year’s
contribution.
The private agencies are also believed to procure about 60-65 lakh tonnes of wheat in Indian.
Production has fallen during 2015-16. Market estimates nearly 85 million metric tonnes (MMT)
however India government estimates wheat production to remain at 94.04 MMT as against 86.53
MMT recorded in 2014-15.
Unchanged import duty structure too has supported prices. Government has extended a 25% duty
on wheat imports in the month of June without specifying any time line to help curb cheap
shipments into the country in a surplus year. The Government in March 2016 had extended the
25% import duty on wheat by three months to June 30. The basic customs duty had been raised
to 25% from 10% in October 2015.
India may import the most wheat in a decade as output declines in the world’s second biggest
producer. Imports may total 5 million metric tonnes in 2016-17, the most since 200607, according
to the median estimate of seven traders surveyed by Bloomberg. Declining supply is prompting
flour millers in non-wheat growing states to buy grain from Food Corp. of India and some
processors have contracted to import from Australia and France. As much as 1 million metric
tonnes from the two countries have been contracted for import, sources said (Source: Live Mint,
21 June 2016)

Monthly Commodities Report 30 Monday, 02 August 2016
International
International wheat prices fell significantly by 12.68% during the period under review due to ample
supplies and better production outlook.
As per the Wheat Outlook report, USDA published in July 2016
The Global 2015-16 wheat supplies are raised by 4% primarily on increased beginning stocks and
increase in production. World production is estimated at a record 734.62 MMT. World exports are
raised to 169.23 MMT (+3%). World wheat consumption for 2015-16 is estimated at 705.45 MMT
which is well below the available supplies. Ending stocks are estimated at 244.52 MMT for 2015-
16 which are around 12% higher than the ending stock of the Year 2014-15. For 2016-17 too, the
world supply is expected to stay above the demand.
Projected 2016-17 world wheat production beats last year’s record this month. Increases for
exporting countries, coupled with some declines for importers, boost world wheat trade prospects.
Lower wheat quality and competitive prices encourage wheat feeding and raise projected global
consumption. Ending foreign stocks decline while U.S. stocks are projected substantially-higher.
Wheat growing conditions are almost perfect, with abundant precipitation boosting yields in most
countries across the globe, while temperatures are often beneficially cooler than usual.
On the European continent, higher wheat output is projected for Russia and Ukraine and the
countries of the south-eastern part of the continental European Union (EU). Wheat output in
Serbia, which is not part of the EU and borders it in the southeast, is expected to harvest a record-
high crop.
In North America, both the United States and Canada are benefitting from very good growing
conditions.
In the Southern Hemisphere, timely rains in Australia, where winter wheat planting has just been
completed, boosted yield prospects,
Higher wheat area in Argentina, where planting is still underway, is expected to underpin higher
output.
Wheat quality is also expected to be low this year in China. Strong rains in April and May in many
key producing regions (Anhui, Henan, Hubei, and Jiangsu,) during the crop grain fill and heavy
rains in June during the harvest reduced wheat quality in the country, expanding the share of feed
quality in wheat output. The wheat damaged by fusarium fungus, mold, or germination is not
suitable for milling purposes for human consumption, and will have to be sold at a big discount to
feed mills.
The combined 2016-17 output by the major foreign wheat exporters—EU, Canada, Australia,
Argentina, Russia, and Ukraine—is projected to increase by 2.5 million tonnes this month and by
4.4 million tonnes compared to last year. This will maintain ample exportable supplies buttressed
by 1.5-million-ton larger beginning stocks.
Australian wheat production is forecast to rise by 5 per cent in 2016–17 to 25.4 million tonnes,
mainly as a result of an expected increase in yields. The area planted to wheat is forecast to decline
by almost 1 per cent in 2016–17, reflecting higher expected returns from growing other crops such
as canola, oats and some pulses. The previous estimate in March was 24.5 million tonnes.
(Source: Australian Bureau of Agricultural and Resource Economics and Sciences -ABARES)
Monthly Commodities Report 31 Monday, 02 August 2016
Barley
Introduction
Barley is an annual cereal crop consumed as a major food and feed. Basically a grass crop, it
belongs to the family of Poaceae, and is considered to be the fourth most-important crop in the
world after wheat, maize and rice. This crop has been commercially grown for 10,000 years now.
The crop originated in the Middle East and in the lands of modern-day Ethiopia. As a wild grass it
was used as feed for animals during early periods, but with the progress of civilization it was
domesticated. Currently, it is used as food, feed and for the preparation of alcoholic beverages.
Seasonality
Barley is planted as a winter or summer crop in different countries. In the colder regions, barley is
planted in April or May as a summer crop; in the warmer regions, barley is planted between mid-
September to November. In India, it is cultivated as a Rabi crop. Sowing normally takes place
between October and December and harvested from March to April. The market arrivals start from
March onwards. In India, the crop duration of barley is around 120-150 days.
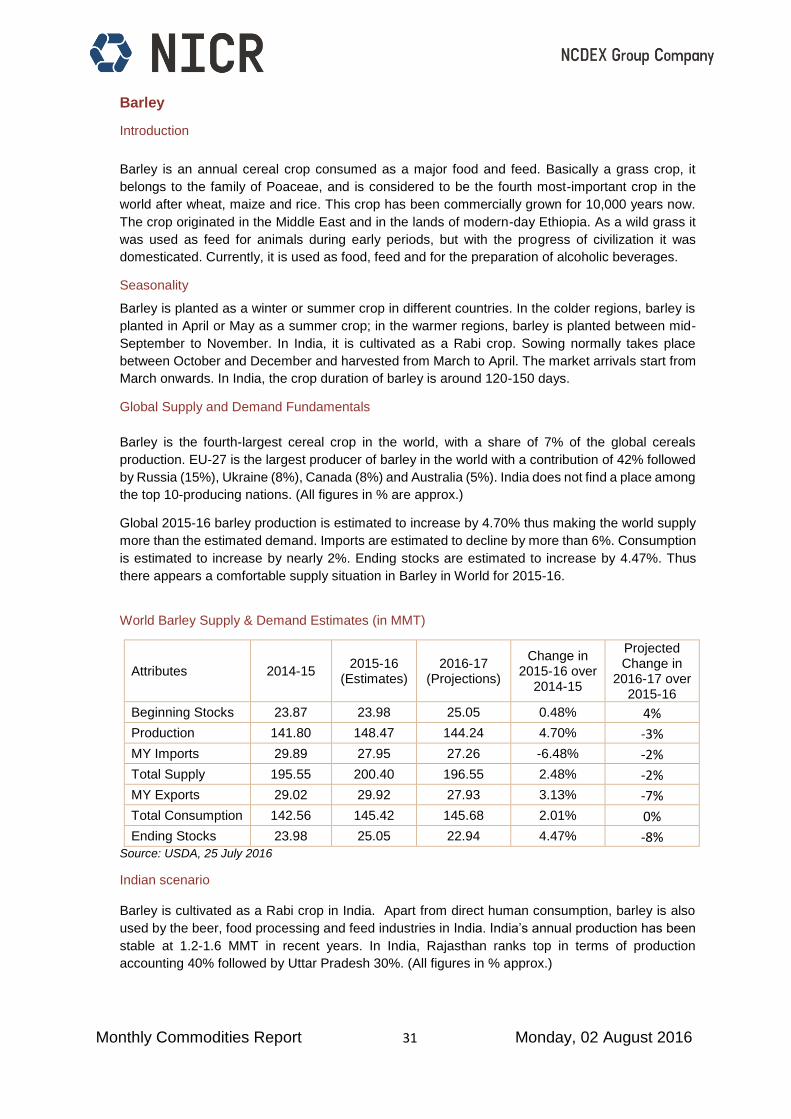
Global Supply and Demand Fundamentals
Barley is the fourth-largest cereal crop in the world, with a share of 7% of the global cereals
production. EU-27 is the largest producer of barley in the world with a contribution of 42% followed
by Russia (15%), Ukraine (8%), Canada (8%) and Australia (5%). India does not find a place among
the top 10-producing nations. (All figures in % are approx.)
Global 2015-16 barley production is estimated to increase by 4.70% thus making the world supply
more than the estimated demand. Imports are estimated to decline by more than 6%. Consumption
is estimated to increase by nearly 2%. Ending stocks are estimated to increase by 4.47%. Thus
there appears a comfortable supply situation in Barley in World for 2015-16.
World Barley Supply & Demand Estimates (in MMT)
Attributes 2014-15 2015-16
(Estimates) 2016-17
(Projections)
Change in 2015-16 over
2014-15
Projected Change in
2016-17 over 2015-16
Beginning Stocks 23.87 23.98 25.05 0.48% 4%
Production 141.80 148.47 144.24 4.70% -3%
MY Imports 29.89 27.95 27.26 -6.48% -2%
Total Supply 195.55 200.40 196.55 2.48% -2%
MY Exports 29.02 29.92 27.93 3.13% -7%
Total Consumption 142.56 145.42 145.68 2.01% 0%
Ending Stocks 23.98 25.05 22.94 4.47% -8% Source: USDA, 25 July 2016
Indian scenario
Barley is cultivated as a Rabi crop in India. Apart from direct human consumption, barley is also
used by the beer, food processing and feed industries in India. India’s annual production has been
stable at 1.2-1.6 MMT in recent years. In India, Rajasthan ranks top in terms of production
accounting 40% followed by Uttar Pradesh 30%. (All figures in % approx.)
Monthly Commodities Report 32 Monday, 02 August 2016
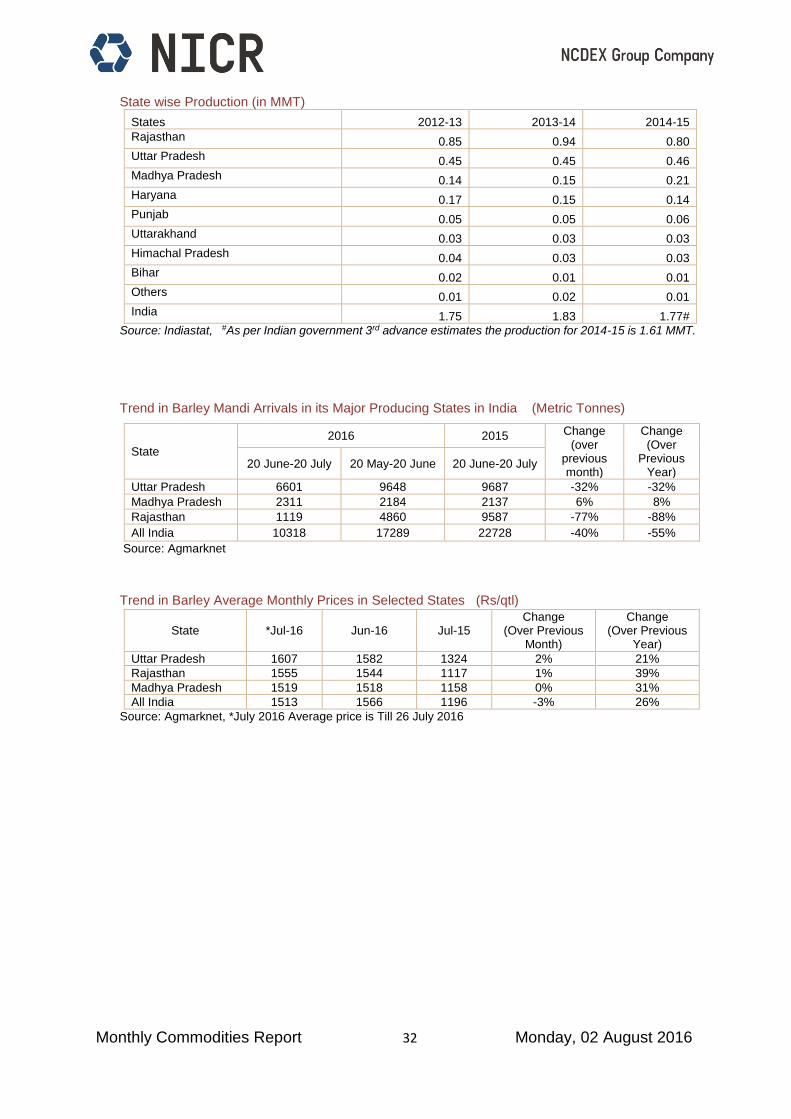
State wise Production (in MMT)
States 2012-13 2013-14 2014-15
Rajasthan 0.85 0.94 0.80
Uttar Pradesh 0.45 0.45 0.46
Madhya Pradesh 0.14 0.15 0.21
Haryana 0.17 0.15 0.14
Punjab 0.05 0.05 0.06
Uttarakhand 0.03 0.03 0.03
Himachal Pradesh 0.04 0.03 0.03
Bihar 0.02 0.01 0.01
Others 0.01 0.02 0.01
India 1.75 1.83 1.77#
Source: Indiastat, #As per Indian government 3rd advance estimates the production for 2014-15 is 1.61 MMT.
Trend in Barley Mandi Arrivals in its Major Producing States in India (Metric Tonnes)
State
2016 2015 Change (over
previous month)
Change (Over
Previous Year)
20 June-20 July 20 May-20 June 20 June-20 July
Uttar Pradesh 6601 9648 9687 -32% -32%
Madhya Pradesh 2311 2184 2137 6% 8%
Rajasthan 1119 4860 9587 -77% -88%
All India 10318 17289 22728 -40% -55%
Source: Agmarknet
Trend in Barley Average Monthly Prices in Selected States (Rs/qtl)
State *Jul-16 Jun-16 Jul-15 Change
(Over Previous Month)
Change (Over Previous
Year)
Uttar Pradesh 1607 1582 1324 2% 21%
Rajasthan 1555 1544 1117 1% 39%
Madhya Pradesh 1519 1518 1158 0% 31%
All India 1513 1566 1196 -3% 26%
Source: Agmarknet, *July 2016 Average price is Till 26 July 2016
Monthly Commodities Report 33 Monday, 02 August 2016
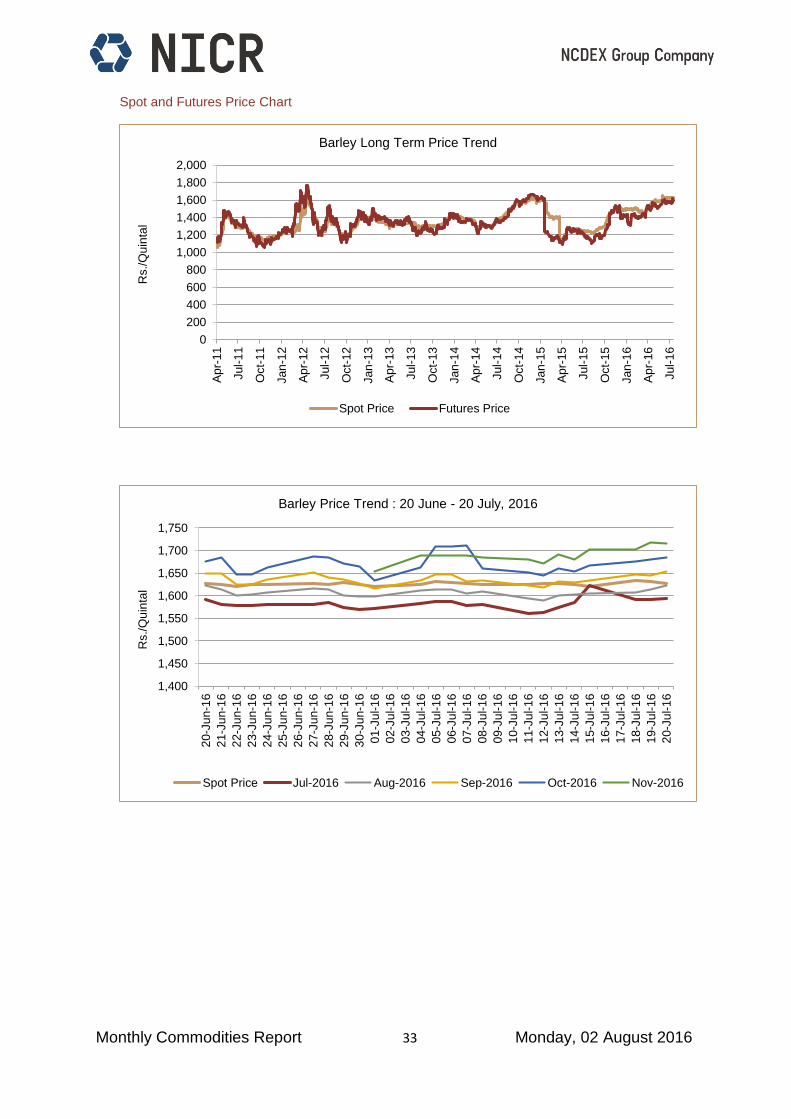
Spot and Futures Price Chart
0
200
400
600
800
1,000
1,200
1,400
1,600
1,800
2,000
Ap
r-11
Jul-
11
Oct-
11
Jan
-12
Ap
r-12
Jul-
12
Oct-
12
Jan
-13
Ap
r-13
Jul-
13
Oct-
13
Jan
-14
Ap
r-14
Jul-
14
Oct-
14
Jan
-15
Ap
r-15
Jul-
15
Oct-
15
Jan
-16
Ap
r-16
Jul-
16
Rs./
Qu
inta
lBarley Long Term Price Trend
Spot Price Futures Price
1,400
1,450
1,500
1,550
1,600
1,650
1,700
1,750
20-J
un-1
6
21-J
un-1
6
22-J
un-1
6
23-J
un-1
6
24-J
un-1
6
25-J
un-1
6
26-J
un-1
6
27-J
un-1
6
28-J
un-1
6
29-J
un-1
6
30-J
un-1
6
01-J
ul-1
6
02-J
ul-1
6
03-J
ul-1
6
04-J
ul-1
6
05-J
ul-1
6
06-J
ul-1
6
07-J
ul-1
6
08-J
ul-1
6
09-J
ul-1
6
10-J
ul-1
6
11-J
ul-1
6
12-J
ul-1
6
13-J
ul-1
6
14-J
ul-1
6
15-J
ul-1
6
16-J
ul-1
6
17-J
ul-1
6
18-J
ul-1
6
19-J
ul-1
6
20-J
ul-1
6
Rs./
Qu
inta
l
Barley Price Trend : 20 June - 20 July, 2016
Spot Price Jul-2016 Aug-2016 Sep-2016 Oct-2016 Nov-2016

Monthly Commodities Report 34 Monday, 02 August 2016
Production during last 3 years
Year Production
(Million MT)
2013-14 1.83
2014-15 1.61
2015-16 (3rd Advance Estimates) 1.62
Average Spot Prices
Financial Year Average prices
(Rs/Quintal) YOY
Price Variation
2013-14 1344
2014-15 1448 7.74%
2015-16 1356 -6.53%
2016-17 1600 17.99%
Month-wise Price Volatility
Average Open Interest, Stocks in approved warehouses and deliveries
Year Open Interest
(MT)
Stocks in approved warehouses
(MT)
Deliveries during the year
(MT)
2013-14 11497 30166 41280
2014-15 12248 10514 13220
2015-16 20897 15988 36690
2016-17 18267 12545 10190
Stocks = Maximum stocks on the day of expiry during respective financial year
Deliveries = Total deliveries during the respective financial year
Month Volatility
Jan-16 10.44%
Feb-16 10.52%
Mar-16 14.92%
April-16 10.93%
May-16 7.53%
June -16 11.28%
July-16 (Till 20 July) 6.59%
Spot Price Volatility during January to July Period 11.33%

Monthly Commodities Report 35 Monday, 02 August 2016
Markets and Trade
A very narrow range bound trade is observed in Barley prices during the period under review.
No significant change was observed in the spot and futures prices during 20 June-20 July
period.
The demand in the physical market is steady. Although mandi arrivals have declined
substantially but could not affect the prices due to steady demand. Further there is talk in the
market that the prices of imported Barley is almost same to that of physical market prices. Due
to which market prices are unable to go up.
As per the 3rd advance estimate for 2015-16 released by Ministry of Agriculture on May 09,
2016 Barley production is estimated to be around 1.62 MMT. Production stood at 1.61 MMT in
2014-15.
Winter Barley all over Ukraine is at the stage of complete ripeness. Crop condition is mostly
good. Rains and strong winds caused some crops lodging in the fields, which impeded field
works and further works with harvested grain. Ukraine Barley prices have also seen decline
both in export and domestic markets due to new crop good supply prospects. The average
grain productivity of Ukraine is 11% higher than last year.
India is likely to import a record high of 125,000 tonnes of barley in 2016-17 (April-March) from
Argentina, Australia and France due to a smaller domestic crop, industry officials said. India
imports around 10,000 tonnes of barley every year, but the purchase is seen nearly 12.5 fold
higher this year. The imports would be mainly carried out by the malt industry, which is facing
a shortage of the commodity in domestic markets. Two shipments of 50,000 tonnes each from
Australia are expected to reach Indian shores in two months. The deals for barley imports are
struck at $195 per tonne ( Rs. 13,217) free on board, way cheaper than the domestic prices
of Rs. 15,000-16,000 a tonne. (Source: The Hindu Business Line, 30 June 2016)
World 2015-16 barley production is estimated to increase by 4.70% thus making the world
supply more than the estimated demand. Imports are estimated to decline by more than 6%.
Consumption is estimated to increase by nearly 2%. Ending stocks are estimated to increase
by 4.47%. Thus there appears a comfortable supply situation in Barley in World for 2015-16.
The NCDEX has revised value at risk (VaR)-based initial margins for select commodities
including Barley. VaR-based initial margins are part of the exchange's risk management
framework. The exchange has also decided to have margin period of risk (MPOR) of two days
as a measure of underlying liquidity. This means the exchange will cover margins required for
two days and that will be based on liquidity. Commodities that are part of the revised margin
are sensitive commodities, such as sugar and chana or those having limited production or
marketable surplus such as barley, chilli, coriander, guar, jeera, turmeric, etc. These changes
are with effect from July 29, 2016.

Monthly Commodities Report 36 Monday, 02 August 2016
Pulses
Chana
Introduction
Chana or chickpea is an important pulse crop of India and is a rich source of protein and used as edible
seed and also for making flour. It is highly nutritious and ranks third amongst important legumes after
dry bean and peas. The two main types of Chana are desi and kabuli (also known as dollar Chana).
Among the total Chana production in the world, desi type contributes to 80% while rest is of kabuli type.
India is the largest producer of Chana contributing around 70% to the total global production. Desi
Chana is mainly grown in India and they are brown split peas and are relatively small in size with a
relatively thick seed coat while kabuli Chana are creamy whitish in color and bigger in size compare to
desi Chana with thin seed coat.
Cultivation Pattern
Chana is a Rabi crop in India. Sowing takes place between October and December. The maturity period
ranges from 90-110 days depending on the variety and location. Harvesting takes place between
February and April.
State wise Production (in MMT)
States 2011-12 2012-13 2013-14 2014-15
Madhya Pradesh 3.29 3.81 3.30 2.96
Rajasthan 1.06 1.28 1.64 0.91
Maharashtra 0.82 0.85 1.62 0.83
Karnataka 0.47 0.62 0.72 0.77
Andhra Pradesh 0.52 0.76 0.84 0.46
Uttar Pradesh 0.68 0.68 0.48 0.38
Chhattisgarh 0.24 0.29 0.21 0.29
Gujarat 0.27 0.17 0.31 0.19
Jharkhand 0.14 0.16 0.18 0.19
Bihar 0.08 0.09 0.07 0.06
Others 0.14 0.13 0.16 0.13
India 7.70 8.83 9.53 7.17
Source: Indiastat
Global Supply and Demand Fundamentals
India is the world’s largest pulse producer, consumer and importer. India accounts for around 66% of
world’s Chana production. India imports around 1.5 – 2 lakh tonnes of Chana annually. Australia,
Pakistan, Tanzania, Iran and Myanmar are the major sources for import for India.

Monthly Commodities Report 37 Monday, 02 August 2016
Spot and Futures Price Chart
0
1,000
2,000
3,000
4,000
5,000
6,000
7,000
8,000
9,000
10,000
Ap
r-11
Jul-
11
Oct-
11
Jan
-12
Ap
r-12
Jul-
12
Oct-
12
Jan
-13
Ap
r-13
Jul-
13
Oct-
13
Jan
-14
Ap
r-14
Jul-
14
Oct-
14
Jan
-15
Ap
r-15
Jul-
15
Oct-
15
Jan
-16
Ap
r-16
Jul-
16
Rs./
Qu
inta
l
Chana Long Term Price Trend
Spot Price Futures Price
5,000
5,500
6,000
6,500
7,000
7,500
8,000
8,500
9,000
9,500
20-J
un-1
6
21-J
un-1
6
22-J
un-1
6
23-J
un-1
6
24-J
un-1
6
25-J
un-1
6
26-J
un-1
6
27-J
un-1
6
28-J
un-1
6
29-J
un-1
6
30-J
un-1
6
01-J
ul-1
6
02-J
ul-1
6
03-J
ul-1
6
04-J
ul-1
6
05-J
ul-1
6
06-J
ul-1
6
07-J
ul-1
6
08-J
ul-1
6
09-J
ul-1
6
10-J
ul-1
6
11-J
ul-1
6
12-J
ul-1
6
13-J
ul-1
6
14-J
ul-1
6
15-J
ul-1
6
16-J
ul-1
6
17-J
ul-1
6
18-J
ul-1
6
19-J
ul-1
6
20-J
ul-1
6
Rs./
Qu
inta
l
Chana Price Trend : 20 June - 20 July, 2016
Spot Price Jul-2016 Aug-2016 Sep-2016 Oct-2016
1,000
3,000
5,000
7,000
9,000
11,000
13,000
15,000
Jan
-12
Ma
r-1
2
Ma
y-1
2
Jul-
12
Se
p-1
2
Nov-1
2
Jan
-13
Ma
r-1
3
Ma
y-1
3
Jul-
13
Se
p-1
3
Nov-1
3
Jan
-14
Ma
r-1
4
Ma
y-1
4
Jul-
14
Se
p-1
4
No
v-1
4
Jan
-15
Ma
r-1
5
Ma
y-1
5
Jul-
15
Se
p-1
5
Nov-1
5
Jan
-16
Ma
r-1
6
Ma
y-1
6
Jul-
16
Rs./
Qu
inta
l
Pulses: Long Term Price Trend
Chana Tur Urad Moong Masoor

Monthly Commodities Report 38 Monday, 02 August 2016
Chana: Monthly Average Price Trend in Spot, Futures, Wholesale and Retail Market (in Rs/qtl)
Average Monthly Price
NCDEX Spot
(Delhi) Change
NCDEX Near
Month Futures
Change
#Chana Dal
Wholesale Price at Delhi
Change
#Chana Dal
Retail Price at
Delhi
Change
Jan-16 4795 4678 5543 7313
Feb-16 4599 -4% 4215 -10% 5347 -4% 7241 -1%
Mar-16 4658 1% 4358 3% 5530 3% 7340 1%
Apr-16 5331 14% 5176 19% 6302 14% 7927 8%
May-16 5956 12% 5792 12% 6927 10% 8306 5%
Jun-16 7030 18% 6888 19% 7948 15% 9340 12%
Jul-16* 8553 22% 8545 24% 9398 18% 11080 19%
Change (January to July 2016)
78% 83% 70% 52%
*: Data is as on July 20, 2016 # Department of Consumer Affairs (Price Monitoring Cell), GoI
Trend in Monthly Average Prices of Major Pulses Trend in Spot Markets (in Rs/qtl)
Date Chana (Delhi) Change
Tur (Akola) Change
Urad (Jalgaon) Change
Moong* (Jodhpur) Change
Masoor (Indore)
Change
Jan-16 4,795 9041 10561 6908 5502
Feb-16 4,599 -4% 8270 -9% 10035 -5% 6533 -5% 4717 -14%
Mar-16 4,658 1% 8267 0% 10092 1% 6402 -2% 5155 9%
Apr-16 5,331 14% 9,029 9% 11,739 16% 6,561 2% 5,847 13%
May-16 5,963 12% 8,881 -2% 11,800 1% 6,198 -6% 5,797 -1%
Jun-16 7,030 18% 8,881 0% 11,057 -6% 5,869 -5% 5,875 1%
Jul-16** 8553 22% 9025 2% 10450 -5% 5765 -2% 6159 5%
Change (Jan-July 2016)
78% 0% -1% -17% 12%
**: Data is as on July 20, 2016
Source: Spot Prices are NCDEX Polled Prices at the above locations, *Agmarknet
Trend in Chana Average Monthly Prices in Various States (Rs/qtl)
State Jul-16 Jun-16 Jul-15 % Change(Over Previous Month)
% Change(Over Previous Year)
Telangana 7997 6117 4070 31% 96%
Haryana 7632 6007 4278 27% 78%
Madhya Pradesh 7683 6217 3919 24% 96%
Karnataka 7749 6294 4751 23% 63%
Gujarat 7976 6586 4312 21% 85%
Rajasthan 7700 6420 4152 20% 85%
Maharashtra 7596 6344 4151 20% 83%
Manipur 9171 7707 5976 19% 53%
Kerala 8699 7643 5698 14% 53%
Chhattisgarh 6843 6057 4037 13% 70%
Uttar Pradesh 6858 6154 4674 11% 47%
NCT of Delhi 6859 6290 4344 9% 58%
Uttarakhand 5200 4820 3175 8% 64%
Andhra Pradesh 5815 5393 3917 8% 48%
All India Average 7559 6477 4584 17% 65%
Source: Agmarknet
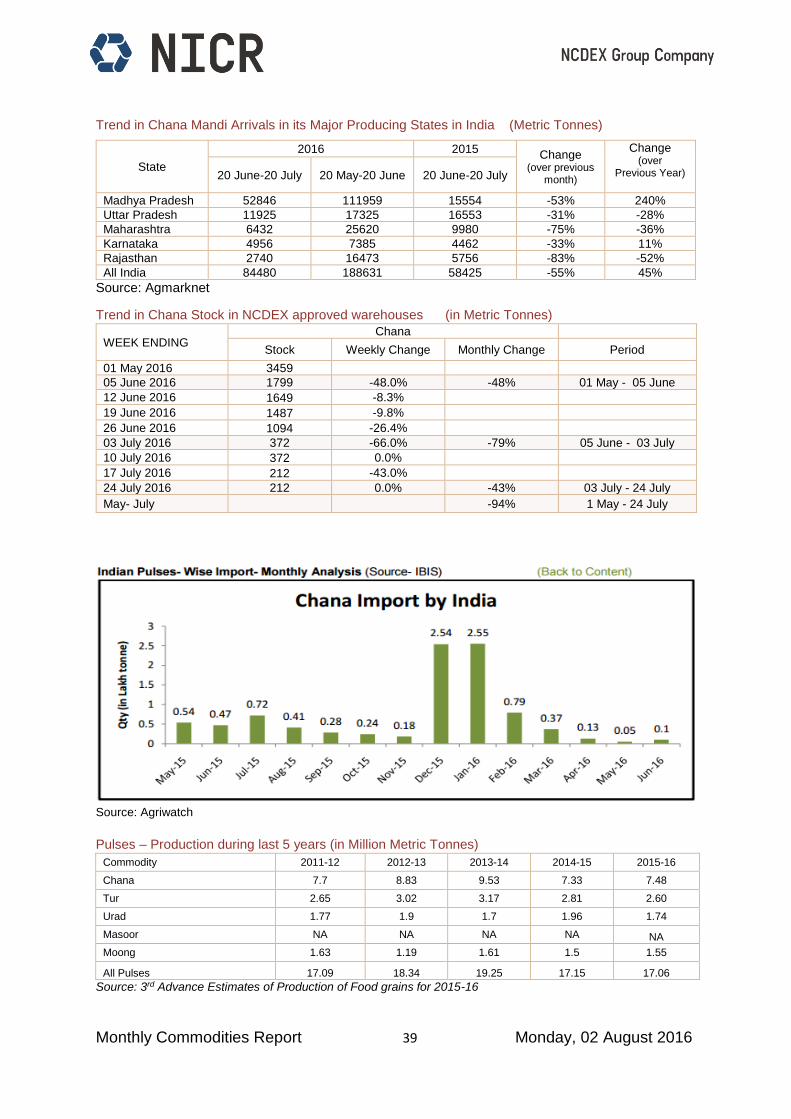
Monthly Commodities Report 39 Monday, 02 August 2016
Trend in Chana Mandi Arrivals in its Major Producing States in India (Metric Tonnes)
State
2016 2015 Change
(over previous month)
Change (over
Previous Year)
20 June-20 July 20 May-20 June 20 June-20 July
Madhya Pradesh 52846 111959 15554 -53% 240%
Uttar Pradesh 11925 17325 16553 -31% -28%
Maharashtra 6432 25620 9980 -75% -36%
Karnataka 4956 7385 4462 -33% 11%
Rajasthan 2740 16473 5756 -83% -52%
All India 84480 188631 58425 -55% 45%
Source: Agmarknet
Trend in Chana Stock in NCDEX approved warehouses (in Metric Tonnes)
WEEK ENDING Chana
Stock Weekly Change Monthly Change Period
01 May 2016 3459
05 June 2016 1799 -48.0% -48% 01 May - 05 June
12 June 2016 1649 -8.3%
19 June 2016 1487 -9.8%
26 June 2016 1094 -26.4%
03 July 2016 372 -66.0% -79% 05 June - 03 July
10 July 2016 372 0.0%
17 July 2016 212 -43.0%
24 July 2016 212 0.0% -43% 03 July - 24 July
May- July -94% 1 May - 24 July
Source: Agriwatch
Pulses – Production during last 5 years (in Million Metric Tonnes)
Commodity 2011-12 2012-13 2013-14 2014-15 2015-16
Chana 7.7 8.83 9.53 7.33 7.48
Tur 2.65 3.02 3.17 2.81 2.60
Urad 1.77 1.9 1.7 1.96 1.74
Masoor NA NA NA NA NA
Moong 1.63 1.19 1.61 1.5 1.55
All Pulses 17.09 18.34 19.25 17.15 17.06
Source: 3rd Advance Estimates of Production of Food grains for 2015-16

Monthly Commodities Report 40 Monday, 02 August 2016
Chana – Production during last 3 years
Year Production (MMT)
2013-14 9.53
2014-15 7.33
2015-16 (3rd Advance Estimates) 7.48
Average Spot Prices
Financial Year Average price (Rs/Quintal) YOY Price Variation
2013-14 3125
2014-15 3110 -0.48%
2015-16 4724 51.90%
2016-17 6570 39.08%
Month-wise Price Volatility
Average Open Interest, Stocks in approved warehouses and deliveries
Year Open Interest
(MT)
Stocks in approved warehouses
(MT)
Deliveries ‘ during the year
(MT)
2013-14 207837 155287 100000
2014-15 225825 122336 179220
2015-16 143775 139159 245330
2016-17 25255 3202 3520
Stocks = Maximum stocks on the day of expiry during respective financial year
Deliveries = Total deliveries during the respective financial year
Month Volatility
Jan-16 17.60%
Feb-16 24.30%
Mar-16 31.86%
April -16 62.15%
May-16 27.12%
June -16 39.45%
July-16 (Till 20 July) 66.63%
Spot Price Volatility during January to July Period 40.66%
Monthly Commodities Report 41 Monday, 02 August 2016
Markets and Trade
Upward trend continued uninterrupted in Chana physical as well as futures market during 20 June-
20 July period. Chana spot and futures prices increased by 27 and 31% respectively during the
period under review compared to corresponding period last month.
It must be noted that there has been a constant price rise in Chana prices in spot as well as futures
market. From January till July 2016. Chana Dal prices in wholesale as well as retail market also
increase substantially during last 6-7 months. Substantial prices rise was also seen in other pulses
like Tur, Urad and Masoor during April and May months. However after prediction of above normal
monsoon this year, prices of kharif grown pulses like Tur, Urad and Moong fell. Sharp rise in pulse
sown area this season also helped in curtailing the prices of these pulses. However Chana prices
continue to stay firm on strong demand and tight supply as the new Chana crop will only come
after March 2017.
The average monthly physical market prices increased substantially in all the major states like
Rajasthan (20%), Uttar Pradesh (11%), Madhya Pradesh (24%), Karnataka (23%) and Maharashtra
(20%). It is to be learnt that Chana prices in all these states are higher by about 70-90% from the
prices seen during same period last year.
The mandi arrivals are gradually reducing. About 83% decline in mandi arrivals was seen in
Rajasthan while other important states like Uttar Pradesh, Madhya Pradesh have seen a decline of
31% and 53% in mandi arrivals during the period under review compared to the previous month.
Traders have withdrawals almost 94% of the stocks deposited in the NCDEX approved warehouse
during last three months. It shows that firm physical market demand kept supporting the market
prices. Trader sources confirm that Chana demand has remained robust amidst empty pipe line.
This has provided enough support to the prices despite the fact that Government of India took
several steps to curb the rising prices of pulses including Chana in the past few months. The prices
of other pulses have come down
A string of festivals is starting from August on ward till October end. Thus increased consumption
demand is likely to remain. Trade sources forecast that the shortage of chana will continue to remain
there in medium term.
On 16 June 2016, SEBI directed the NCDEX to suspend trading in chana contracts and not launch
any new chana contracts till further orders. All the open positions in chana had to be squared off. No
fresh positions could be taken in the running contracts.
On 27 July 2016, the NCDEX closed out all running futures contracts in Chana being traded on the
Exchange (Circular No. NCDEX/Trading-077/2016/175) using its bye-laws, rules and regulations
and as per the directives of the Securities and Exchange Board of India (SEBI).
Russian imports will start during August month and onwards. Australian imports will start from
November-December month. Thus till then India has to depend upon own stocks to meet the
demand.
It is to be learnt that in order to curb the rising prices of pulses, Central government has informed
the States to put stock limit on all varieties of pulses. That too resulted in to less stock with the
millers.
The Government has decided to import lentils from Myanmar and Africa and beef up the buffer
stocks to check the spike in rates. India has submitted a draft agreement for import of tur from
Myanmar on government-to-government route. Many African countries have also shown interest to
supply lentils to India. As per the market estimates, Chana production is likely to be around 6.0 MMT as against 6.7 MMT
last year. As per Government, Chana production is estimated at 7.48 MMT, marginally higher from
7.33 MMT produced in 2014-15.
Central Government has also urged the States to exempt pulses from VAT and other local taxes.
It may help cool the prices of the pulses by 5% to 7%. Accordingly, Odisha government has
reduced the currently applicable 5% Vat on pulses to 1% for three months.
Monthly Commodities Report 42 Monday, 02 August 2016
To curb the price rise, government also took several steps like banning exports of all pulses except
kabuli chana and up to 10,000 MT in organic pulses and lentils. Imports of pulses is allowed at
zero import duty. Stock limit on pulses extended till Sept 30, 2016. Approved creation of buffer
stock of 1.5 Lakh MT of pulses for effective market intervention.
The Government has decided to import lentils from Myanmar and Africa and beef up the buffer
stocks to check the spike in prices. India has submitted a draft agreement for import of tur from
Myanmar on government-to-government route. India signed a Memorandum of Understanding
(MoU) with Mozambique for import of pulses either through the private channels or Government-
to-Government (G2G) sales through State Agencies nominated by the two countries. The MoU
aims at promoting the production of Pigeon Peas/Tur and other pulses in Mozambique by
encouraging progressive increase in the trading of these pulses. The MOU includes targets for
exports of Tur and other pulses from Mozambique to India for five financial years and aims at
doubling the trade from 100,000 tonnes in 2016-17 to 200,000 tonnes is 2020-21.
Government has approved creation of buffer stock of 1.7 lakh MT of pulses for effective market
intervention. It has released around 21,000 MT of pulses from the buffer stock (consisting of Tur
and Urad) to States/UTs at subsidized rates for retailing by them at not more than Rs 120/- per kg
to improve availability and stabilise prices.
In order to ensure continuous flow and to curb down rising prices of pulses, the government has
decided to increase the buffer stock of pulses from 1.5 Lakh tonnes to 8 Lakh tonnes. It also has
approved to import 3 Lakh tonnes of green lentil, 2 Lakh tonnes of yellow peas, 1Lakh tonnes of
red lentil and 20 thousand tonnes each of Urad and Pigeon peas. (Source: Agriwatch)
India is also exploring the possibility of importing pulses from Afghanistan to boost domestic supply
and to control retail prices. The imports could start with small quantity of about 100,000 tonnes.
(Business Standard dated July 20, 2016)
International
As per the reports from Canada Government, for 2016-17, the area under Chickpea seeded is
intended to decrease from 2015-16. Production is forecast to decrease to 80 kt (.08 million tonnes).
Supply is forecast to decrease more significantly due to lower production and lower carry-in stocks.
Exports are forecast to fall sharply from 2015-16 due to the limited supply and carry-out stocks are
expected to decrease. The average price is forecast to fall, due to larger world supply and lower
import demand from the Middle East, US and Pakistan.
Canadian dry pea seeded area for 2016-17 is expected to rise by 16% from 2015-16 to record 1.7
million ha due to higher returns relative to other crops. Production is expected to increase by 28%
to a record 4.1 million tonnes. However, supply is forecast to only increase marginally due to low
carry-in stocks. Exports are forecast to increase with India and China continuing to be Canada's
top markets. Carry-out stocks are also forecast to rise sharply but remain below average. The
average price is expected to decrease from 2015-16 due to expectations for larger Canadian
stocks and increased world supply.
For 2016-17, area seeded to lentils in Canada is expected to increase by 30% to a record 2.1
million ha, due to continued strong export demand and prices. Production is forecast to rise to a
record 3.26 million tonnes. However, the increase in supply is expected to be dampened by low
carry-in stocks. Exports are expected to be slightly higher than in 2015-16 at 2.4 Mt. Carry-out
stocks are forecast to increase sharply to a burdensome 0.65 Mt. The average price is forecast to
fall from 2015-16 due to record
According to the latest ABARES report, Australian Chickpea production forecast 2016-17 is around
8% greater than 2015-16. The production forecast is higher due to increase in area and favourable
weather condition till now. Australian chickpea harvesting starts from mid-September and crops
start hitting India market from October onwards.

Monthly Commodities Report 43 Monday, 02 August 2016
Oilseeds
Soybean
Introduction
Soybean, popularly known as ‘miracle bean’, is an important global crop. It has high nutritional
qualities and is used as sources of protein in animal feed, human food and in industries. It is used
in industries as a source of edible oil and the by-product of the oil extraction is the soybean cake
used as animal feed.
Almost the total beans produced in India are crushed and are used for meeting the growing demand
for soy meal and soy oil
Cultivation Pattern
Soybean is exclusively grown in the Kharif season in India, with sowing taking place after the first
monsoon showers in late June or early July. Sowing can extend up to end of July in different parts
of the country. The harvesting commences from September, with Maharashtra reporting the earliest
arrivals. October and November are the peak arrival months.
State wise Production
The state-wise production of soybean is shown in the table given below. Madhya Pradesh and,
Maharashtra are the major cultivators of this important oilseed.
State wise Production (in MMT)
States 2011-12 2012-13 2013-14 2014-15 2015-16
Madhya Pradesh 6.28 7.80 5.24 6.35 6.61
Maharashtra 3.97 4.67 4.75 2.49 3.19
Rajasthan 1.39 1.47 0.97 0.96 1.39
Karnataka 0.17 0.18 0.27 0.23 0.19
Andhra Pradesh 0.21 0.29 0.40 0.26 0.19
Chhattisgarh 0.08 0.13 0.09 0.08 0.08
Gujarat 0.03 0.05 0.04 0.06 0.07
Uttar Pradesh 0.02 0.02 0.02 0.04 0.05
Others 0.07 0.07 0.07 0.06 0.06
India 12.21 14.67 11.86 10.53 11.83
Source: Indiastat
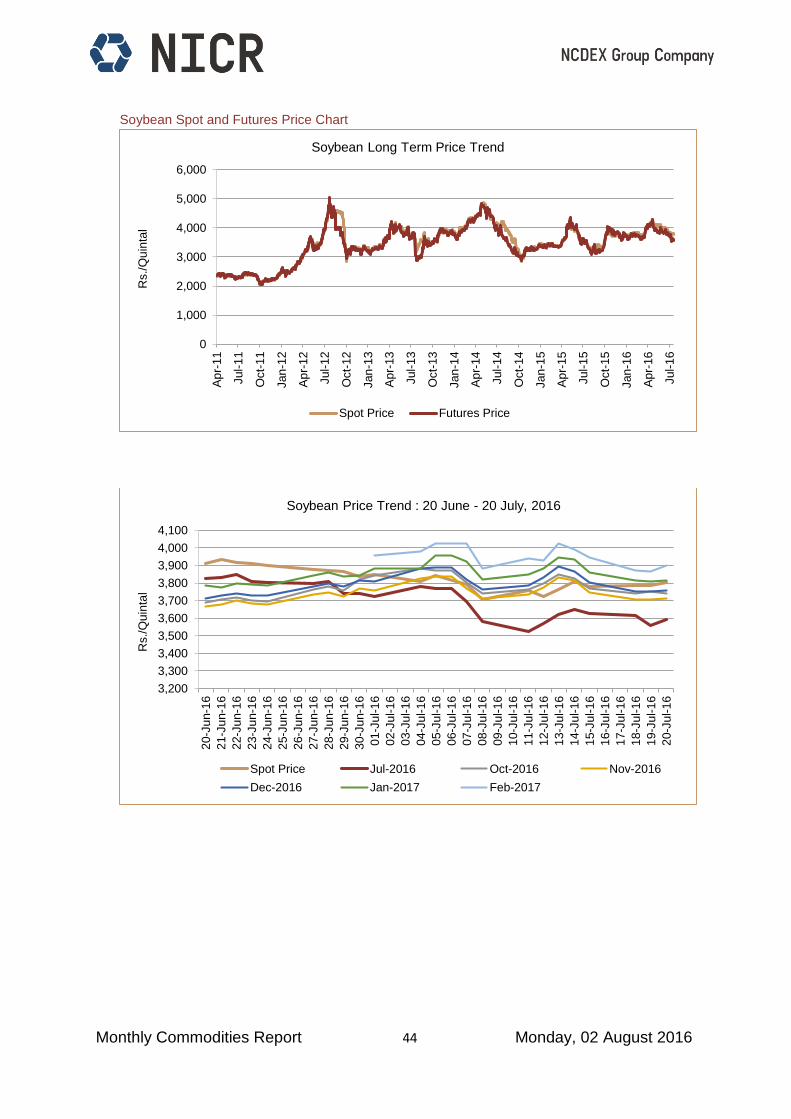
Monthly Commodities Report 44 Monday, 02 August 2016
Soybean Spot and Futures Price Chart
0
1,000
2,000
3,000
4,000
5,000
6,000
Ap
r-11
Jul-
11
Oct-
11
Jan
-12
Ap
r-12
Jul-
12
Oct-
12
Jan
-13
Ap
r-13
Jul-
13
Oct-
13
Jan
-14
Ap
r-14
Jul-
14
Oct-
14
Jan
-15
Ap
r-15
Jul-
15
Oct-
15
Jan
-16
Ap
r-16
Jul-
16
Rs./
Qu
inta
lSoybean Long Term Price Trend
Spot Price Futures Price
3,200
3,300
3,400
3,500
3,600
3,700
3,800
3,900
4,000
4,100
20-J
un-1
6
21-J
un-1
6
22-J
un-1
6
23-J
un-1
6
24-J
un-1
6
25-J
un-1
6
26-J
un-1
6
27-J
un-1
6
28-J
un-1
6
29-J
un-1
6
30-J
un-1
6
01-J
ul-1
6
02-J
ul-1
6
03-J
ul-1
6
04-J
ul-1
6
05-J
ul-1
6
06-J
ul-1
6
07-J
ul-1
6
08-J
ul-1
6
09-J
ul-1
6
10-J
ul-1
6
11-J
ul-1
6
12-J
ul-1
6
13-J
ul-1
6
14-J
ul-1
6
15-J
ul-1
6
16-J
ul-1
6
17-J
ul-1
6
18-J
ul-1
6
19-J
ul-1
6
20-J
ul-1
6
Rs./
Qu
inta
l
Soybean Price Trend : 20 June - 20 July, 2016
Spot Price Jul-2016 Oct-2016 Nov-2016
Dec-2016 Jan-2017 Feb-2017

Monthly Commodities Report 45 Monday, 02 August 2016
Trend in Soybean Mandi Arrivals in its Major Producing States in India (Metric Tonnes)
State 2016 2015
Change (over
previous month)
Change (over
Previous Year)
20 June-20 July 20 May-20 June 20 June-20 July
Madhya Pradesh 180130 237741 260263 -24% -31%
Rajasthan 28327 31040 38434 -9% -26%
Maharashtra 27141 67393 28845 -60% -6%
Chhattisgarh 13447 16454 11647 -18% 15%
All India 250919 355306 346597 -29% -28%
Source: Agmarknet
Trend in Soybean Average Monthly Prices in Major Producing States (Rs/qtl)
State Jul-16 Jun-16 Jul-15 % Change
(Over Previous Month) % Change
(Over Previous Year)
Madhya Pradesh 3494 3676 3231 -5% 8%
Rajasthan 3574 3689 3312 -3% 8%
Maharashtra 3554 3666 3384 -3% 5%
Telangana 3000 3062 2908 -2% 3%
Chhattisgarh 3556 3604 3293 -1% 8%
Karnataka 3652 3604 3261 1% 12%
Average 3775 3869 3436 -2% 10%
Source: Agmarknet
Trend in Soybean Stock in NCDEX approved warehouses (in Metric Tonnes)
WEEK ENDING Soybean
Stock Weekly Change Monthly Change Period
01 May 2016 21749
05 June 2016 27852 28.1% 28% 01 May - 05 June
12 June 2016 27186 -2.4%
19 June 2016 25880 -4.8%
26 June 2016 22482 -13.1%
03 July 2016 21315 -5.2% -23% 05 June - 03 July
10 July 2016 19289 -9.5%
17 July 2016 13326 -30.9%
24 July 2016 5450 -59.1% -74% 03 July - 24 July
May- July -75% 1 May - 24 July
Oilseeds – Production during last 5 years (in MMT)
Commodity 2011-12 2012-13 2013-14 2014-15 2015-16
Groundnut 6.96 4.70 9.71 7.40 6.89
Castor Seed 2.30 1.96 1.73 1.87 1.73
Sesamum 0.81 0.69 0.72 0.83 0.83
Nigerseed 0.10 0.10 0.10 0.08 0.08
RM Seed 6.60 8.03 7.88 6.28 6.85
Linseed 0.15 0.15 0.14 0.16 0.14
Safflower 0.15 0.11 0.11 0.09 0.08
Sunflower 0.52 0.54 0.50 0.43 0.34
Soybean 12.21 14.67 11.86 10.53 8.92
Total 29.80 30.94 32.75 27.51 25.90
Source: 2nd and 3rd Advance Estimates for 2015-16, GOI
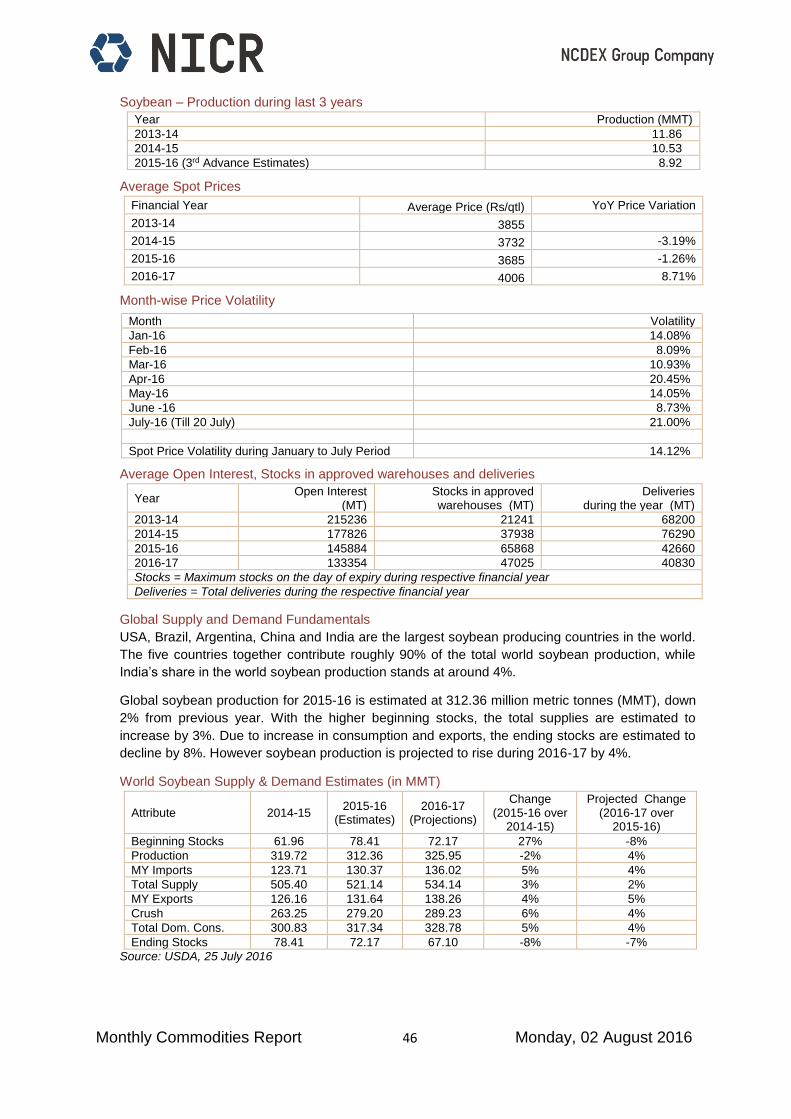
Monthly Commodities Report 46 Monday, 02 August 2016
Soybean – Production during last 3 years
Year Production (MMT)
2013-14 11.86
2014-15 10.53
2015-16 (3rd Advance Estimates) 8.92
Average Spot Prices
Financial Year Average Price (Rs/qtl) YoY Price Variation
2013-14 3855
2014-15 3732 -3.19%
2015-16 3685 -1.26%
2016-17 4006 8.71%
Month-wise Price Volatility
Average Open Interest, Stocks in approved warehouses and deliveries
Year Open Interest
(MT) Stocks in approved warehouses (MT)
Deliveries during the year (MT)
2013-14 215236 21241 68200
2014-15 177826 37938 76290
2015-16 145884 65868 42660
2016-17 133354 47025 40830
Stocks = Maximum stocks on the day of expiry during respective financial year
Deliveries = Total deliveries during the respective financial year
Global Supply and Demand Fundamentals
USA, Brazil, Argentina, China and India are the largest soybean producing countries in the world.
The five countries together contribute roughly 90% of the total world soybean production, while
India’s share in the world soybean production stands at around 4%.
Global soybean production for 2015-16 is estimated at 312.36 million metric tonnes (MMT), down
2% from previous year. With the higher beginning stocks, the total supplies are estimated to
increase by 3%. Due to increase in consumption and exports, the ending stocks are estimated to
decline by 8%. However soybean production is projected to rise during 2016-17 by 4%.
World Soybean Supply & Demand Estimates (in MMT)
Attribute 2014-15 2015-16
(Estimates) 2016-17
(Projections)
Change (2015-16 over
2014-15)
Projected Change (2016-17 over
2015-16)
Beginning Stocks 61.96 78.41 72.17 27% -8%
Production 319.72 312.36 325.95 -2% 4%
MY Imports 123.71 130.37 136.02 5% 4%
Total Supply 505.40 521.14 534.14 3% 2%
MY Exports 126.16 131.64 138.26 4% 5%
Crush 263.25 279.20 289.23 6% 4%
Total Dom. Cons. 300.83 317.34 328.78 5% 4%
Ending Stocks 78.41 72.17 67.10 -8% -7%
Source: USDA, 25 July 2016
Month Volatility
Jan-16 14.08%
Feb-16 8.09%
Mar-16 10.93%
Apr-16 20.45%
May-16 14.05%
June -16 8.73%
July-16 (Till 20 July) 21.00%
Spot Price Volatility during January to July Period 14.12%

Monthly Commodities Report 47 Monday, 02 August 2016
Markets and Trade
Weakness was seen in the soybean spot as well futures market during 20 June-20 July period.
International market sentiments too remained subdued during this period. Spot and near month
futures price fell by 2 and 6% respectively during the period under review.
Better production prospects due to good monsoon rains have turned down market sentiments.
Soybean is a kharif season crop. Sown area is 3% more than the last year’s figures till 29 July
2016. The sown area in the states like Telengana, Karnataka and Maharashtra has seen
increment while top soybean producer i.e. Madhya Pradesh has seen a decline of 5% in sown
area compared to same period last year. In Rajasthan, the sown area is declined by 4%. In the
states like Telengana soybean has replaced cotton sown area. In Maharashtra, pulses and Maize
has replaced the soybean sown area. Total oilseeds sown area has increased by 8% at all India
level.
Slack demand is seen in the domestic market. Arrivals too have declined substantially in the
major producing states.
Exports trend of soymeal and other oil meals has remained weak. The export of soybean meal
was reported just 5129 tonnes during April-June 2016 as against 34161 tonnes exported during
same period last year (a decline of 85%). (Source: Solvent Extractors’ Association of India (SEA)).
According to the third Advance estimates of farm output released by Ministry of Agriculture on
May 09, 2016, production of soybean is likely to fall to 8.92 MMT in 2015-16 from 10.53 MMT
produced in 2014-15. However, as per the Soybean Processors’ Association of India, the
soybean production for Year 2015-16 is estimated at 7.39 MMT. With carryover stock of 0.6 MMT,
the total soybean availability is estimated at 8.01 MMT. The seed available for crushing is
estimated at 6.1 MMT. Carry forward for next season i.e. for 2016-17 is estimated at .48 MMT.
The Soybean Processors’ Association of India (SOPA) has estimated the soybean production for
Year 2015-16 at 6.93 million tonnes, a downward revision from 7.38 million tonnes estimated
earlier. With carryover stock of 0.6 million tonnes, the total soybean availability is estimated at
8.01 million tonnes. The seed available for crushing is estimated at 6.1 million tonnes. Carry
forward for next season i.e. for 2016-17 is estimated at 0.48 million tonnes.
International
Soybean prices in international market also fell by 10.19%. Soybean meal prices also fell by
12.59% during the period under review.
Global soybean production for 2015-16 is estimated at 312.36 million metric tonnes (MMT), down
2% from previous year. With the higher beginning stocks, the total supplies are estimated to
increase by 3%. Due to increase in consumption and exports, the ending stocks are estimated to
decline by 8%. However soybean production is projected to rise during 2016-17 by 4%.
Global oilseed production for 2016-17 is projected at 536.4 million tonnes, up 2.6 million from last
month with U.S. soybean production accounting for most of the change.
Foreign oilseed production is projected at 421.1 million tonnes, up 0.1 million with higher
rapeseed and sunflower seed production mostly offset with lower forecasts for cottonseed and
copra.
Global oilseed ending stocks for 2016-17 are projected at 76.1 million tonnes, up 1.0 million with
higher soybean, rapeseed, and sunflower seed stocks only partly offset with lower peanut stocks.

Monthly Commodities Report 48 Monday, 02 August 2016
RM Seed
Introduction
In India, the mustard – rapeseed (RM Seed) is the most important oil seed crop after groundnut
and soybean accounting around 24 per cent of total oilseed production. Mustard seeds also known
as Rape, Oilseed rape, Rapeseeds and Canola are very widely cultivated throughout the world.
The seeds can come from three different plants: black mustard, brown Indian mustard, and white
mustard. Mustard seed is the third leading source of vegetable oil in the world after Soybean oil
and palm oil. It is world’s second leading sources of protein meal after soybean meal. Mustard
seeds oil content varies from 35% to 46%. It is the source of rapeseed/mustard seed oil and oilcake.
Mustard oil is widely used as medium of preservation for preparation of pickles, chutney and other
preparations. RM Meal being rich in protein and low in glucosinolate content is used as an ingredient
for cattle feed and poultry feed in India. It has high demand from the feed millers and is exported to
various foreign and Mediterranean Countries. Mustard oil has antifungal properties, hence
beneficial for body massage for control of skin diseases. Mustard seeds are also used in India as
well as in European countries like France, Italy as versatile spice for culinary preparations of fish,
meat, vegetables etc. Mustard seed contains “erucic acid” which has immense industrial
applications. ‘High Erucic Acid Rapeseed’ (HEAR) oil is the non-edible variety of oil, which is used
for industrial purposes. The global market for low erucic acid rapeseed oil is ever increasing.
Cultivation Pattern
Rapeseed- Mustard seed is a Rabi crop sown during October-November and harvested during
March-April.
State wise Production
According to the 3rd Advance Estimates for 2015-16 released on May 09, 2016, India’s production
of rapeseed-mustard seed is forecasted to be around 6.85 MMT.
Rajasthan is the largest producer of mustard seed in the country contributing more than 45% to the
country’s total mustard seed production followed by Madhya Pradesh, Haryana and Uttar Pradesh.
Each contribute around than 10% to the total production of the country
State wise Production (in MMT)
States 2011-12 2012-13 2013-14 2014-15
Rajasthan 2.98 3.81 3.80 2.90
Madhya Pradesh 0.87 0.92 0.84 0.72
Haryana 0.75 0.96 0.88 0.70
Uttar Pradesh 0.73 0.84 0.74 0.58
West Bengal 0.38 0.47 0.48 0.49
Gujarat 0.33 0.36 0.49 0.31
Assam 0.13 0.17 0.17 0.17
Jharkhand 0.12 0.15 0.14 0.13
Others 0.33 0.35 0.35 0.32
India 6.60 8.03 7.88 6.31
Source: Indiastat

Monthly Commodities Report 49 Monday, 02 August 2016
Trend in RMseed Mandi Arrivals in its Major Producing States in India (Metric Tonnes)
State
2016 2015 Change (over
previous month)
Change (over
Previous Year)
20 June-20 July 20 May-20 June 20 June-20 July
Rajasthan 48202 99440 101833 -52% -53%
Uttar Pradesh 31901 43378 35625 -26% -10%
Gujarat 17899 25010 19098 -28% -6%
West Bengal 10220 10922 11371 -6% -10%
Madhya Pradesh 6452 12777 9548 -50% -32%
Haryana 1410 3766 1771 -63% -20%
All India 116801 196173 180558 -40% -35%
Source: Agmarknet
Trend in RMseed Average Monthly Prices in selected States (Rs/qtl)
State Jul-16 Jun-16 Jul-15 Change
(Over Previous Month)
Change (Over Previous
Year)
Maharashtra 4420 3850 3569 15% 24%
Haryana 4273 3981 3798 7% 13%
Rajasthan 4348 4097 4031 6% 8%
NCT of Delhi 4107 3891 3763 6% 9%
Madhya Pradesh 4111 3912 3699 5% 11%
Uttar Pradesh 4119 3992 3880 3% 6%
All India Average 4428 4241 3874 4% 14%
Source: Agmarknet
Trend in RMSeed Stock in NCDEX approved warehouses (in Metric Tonnes)
WEEK ENDING RMSeed
Stock Weekly Change Monthly Change Period
01 May 2016 46268
05 June 2016 50599 9.4% 9% 01 May - 05 June
12 June 2016 50831 0.5%
19 June 2016 52043 2.4%
26 June 2016 53178 2.2%
03 July 2016 54071 1.7% 7% 05 June - 03 July
10 July 2016 54820 1.4%
17 July 2016 54637 -0.3%
24 July 2016 53387 -2.3% -1% 03 July - 24 July
May- July 15% 1 May - 24 July
Global Supply and Demand Fundamentals
The major contributors to global rapeseed production are European Union, Canada, China, India
and Australia.
Global production of Rapeseed stood at 68.18 MMT in 2015-16. For Year 2016-17, it is estimated
to fall at 66.54 MMT. Due to less beginning stocks, the total world supply is estimated to reduce by
5.83% during 2016-17.
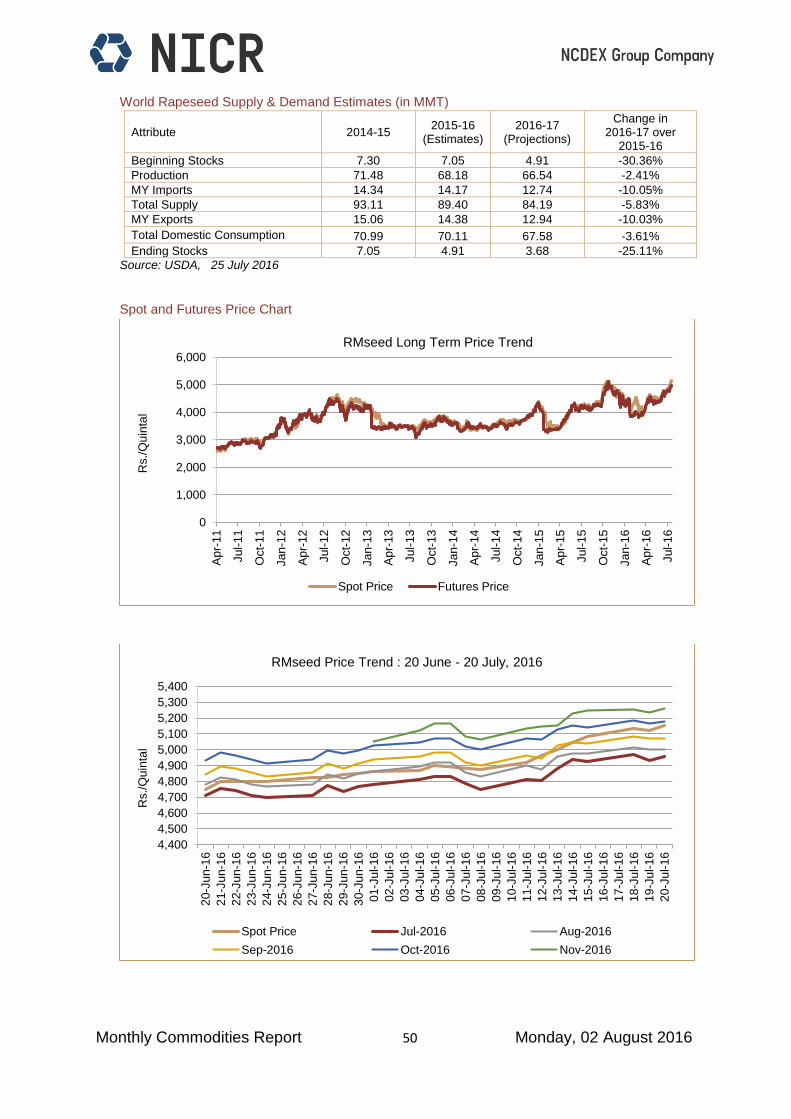
Monthly Commodities Report 50 Monday, 02 August 2016
World Rapeseed Supply & Demand Estimates (in MMT)
Attribute 2014-15 2015-16
(Estimates) 2016-17
(Projections)
Change in 2016-17 over
2015-16
Beginning Stocks 7.30 7.05 4.91 -30.36%
Production 71.48 68.18 66.54 -2.41%
MY Imports 14.34 14.17 12.74 -10.05%
Total Supply 93.11 89.40 84.19 -5.83%
MY Exports 15.06 14.38 12.94 -10.03%
Total Domestic Consumption 70.99 70.11 67.58 -3.61%
Ending Stocks 7.05 4.91 3.68 -25.11%
Source: USDA, 25 July 2016
Spot and Futures Price Chart
0
1,000
2,000
3,000
4,000
5,000
6,000
Ap
r-11
Jul-
11
Oct-
11
Jan
-12
Ap
r-12
Jul-
12
Oct-
12
Jan
-13
Ap
r-13
Jul-
13
Oct-
13
Jan
-14
Ap
r-14
Jul-
14
Oct-
14
Jan
-15
Ap
r-15
Jul-
15
Oct-
15
Jan
-16
Ap
r-16
Jul-
16
Rs./
Qu
inta
l
RMseed Long Term Price Trend
Spot Price Futures Price
4,400
4,500
4,600
4,700
4,800
4,900
5,000
5,100
5,200
5,300
5,400
20-J
un-1
6
21-J
un-1
6
22-J
un-1
6
23-J
un-1
6
24-J
un-1
6
25-J
un-1
6
26-J
un-1
6
27-J
un-1
6
28-J
un-1
6
29-J
un-1
6
30-J
un-1
6
01-J
ul-1
6
02-J
ul-1
6
03-J
ul-1
6
04-J
ul-1
6
05-J
ul-1
6
06-J
ul-1
6
07-J
ul-1
6
08-J
ul-1
6
09-J
ul-1
6
10-J
ul-1
6
11-J
ul-1
6
12-J
ul-1
6
13-J
ul-1
6
14-J
ul-1
6
15-J
ul-1
6
16-J
ul-1
6
17-J
ul-1
6
18-J
ul-1
6
19-J
ul-1
6
20-J
ul-1
6
Rs./
Qu
inta
l
RMseed Price Trend : 20 June - 20 July, 2016
Spot Price Jul-2016 Aug-2016
Sep-2016 Oct-2016 Nov-2016
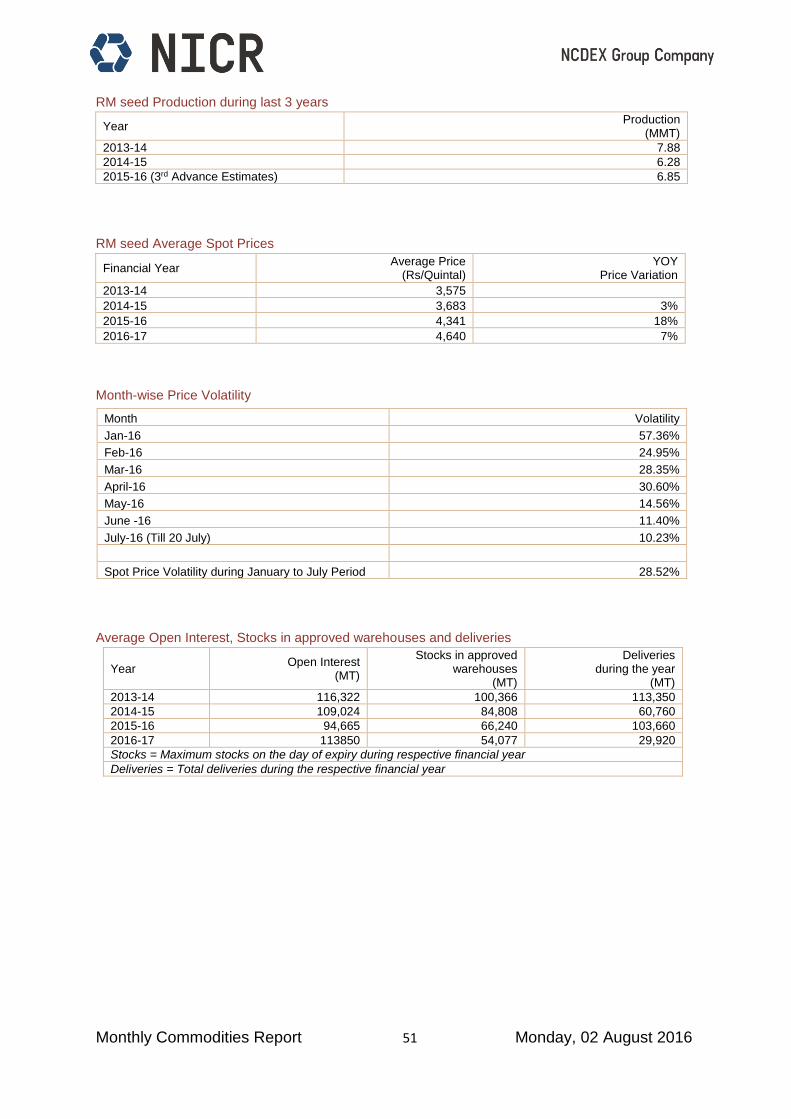
Monthly Commodities Report 51 Monday, 02 August 2016
RM seed Production during last 3 years
Year Production
(MMT)
2013-14 7.88
2014-15 6.28
2015-16 (3rd Advance Estimates) 6.85
RM seed Average Spot Prices
Financial Year Average Price
(Rs/Quintal) YOY
Price Variation
2013-14 3,575
2014-15 3,683 3%
2015-16 4,341 18%
2016-17 4,640 7%
Month-wise Price Volatility
Average Open Interest, Stocks in approved warehouses and deliveries
Year Open Interest
(MT)
Stocks in approved warehouses
(MT)
Deliveries during the year
(MT)
2013-14 116,322 100,366 113,350
2014-15 109,024 84,808 60,760
2015-16 94,665 66,240 103,660
2016-17 113850 54,077 29,920
Stocks = Maximum stocks on the day of expiry during respective financial year
Deliveries = Total deliveries during the respective financial year
Month Volatility
Jan-16 57.36%
Feb-16 24.95%
Mar-16 28.35%
April-16 30.60%
May-16 14.56%
June -16 11.40%
July-16 (Till 20 July) 10.23%
Spot Price Volatility during January to July Period 28.52%
Monthly Commodities Report 52 Monday, 02 August 2016
Markets and Trade
RM Seed prices increased by 5 and 8% respectively in futures and spot market during the period
under review.
Prices of other substitutes like soybean and soy oil fell.
Above normal monsoon prediction by IMD, has brightened the production of kharif oilseeds crops
like Soybean and Groundnut.
Arrivals have reduced significantly in all the major mandis. Demand has improved in the physical
mandis in the light of start of festival season.
The stocks at the NCDEX approved warehouses have marginally declined during the period under
review however they have increased by 15 % during the period from May till 24 July 2016.
Demand is likely to increase of mustard oil during rainy season in north and east India which will
continue to guide the market sentiments.
The RMseed meal exports from India has increased during June as compared to May. However
exports have declined by 62% for the period of April – June 2016.
According to the 3rd Advance Estimates for 2015-16 released on May 09, 2016, India’s production
of rapeseed-mustard seed is forecasted to be around 6.85 MMT in 2015-16. Production during
2014-15 stood at 6.28 MMT.
However, an oilseed industry trade body (COOIT) has forecasted India’s 2016-17 rapeseed-
mustard production at 5.8 MMT. Although market sources estimates crop output to remain only
near 5.5 MMT.
Thus there is large deviation in the crop estimates by various agencies which compelled value
chain participant to buy aggressively during the start of new crop season. Thus heavy buying
interest was seen during March and April in the major mandis of RMseed which in turn supported
the market sentiments.

Monthly Commodities Report 53 Monday, 02 August 2016
Spices
Coriander
Introduction
Coriander, commonly known as ‘Dhaniya’ is one of the oldest spices on record. It is an annual herb,
and forms an integral part of kitchens as well as various traditional medicines. Be it as a fresh herb
or as spice seeds, coriander is popular for its pleasant, aromatic flavor and also for its health-
nourishing qualities, which makes it an important commodity of international trade.
Depending on colours/shades major varieties of Coriander available in the Market are Badami,
Eagle, Scooter, Parrot, Double Parrot, Green and Super Green. Badami accounts for more than
50% of the total coriander produced in India.
Cultivation Pattern
Coriander is usually cultivated during Rabi season. It requires cool climate during growth stage and
warm dry climate at maturity. In India, coriander is sown during 15th October to 15th November. The
sowing period generally lasts till December and harvesting extends from January to April, while
arrivals start from January and continue till April. The crop matures in about 110 to 140 days. At
maturity, seeds turn to yellowish green colour.
State wise Production
A glance at a state-wise bifurcation reveals that coriander is grown in more than 10 states in India,
though its cultivation is mainly concentrated in north-western and central parts of the country, with
Rajasthan being the top cultivator as well as producer followed by Madhya Pradesh and Gujarat
State wise Production (in MMT)
States/UTs 2011-12 2012-13 2013-14 2014-15
Rajasthan 0.311 0.300 0.117 0.199
Madhya Pradesh 0.082 0.082 0.075 NA
Gujarat 0.032 0.032 0.032 0.064
Assam 0.045 0.050 0.053 0.054
Andhra Pradesh 0.026 0.026 0.005 0.021
Odisha 0.011 0.011 0.011 0.011
Haryana 0.003 0.004 0.004 0.004
Uttarakhand 0.004 0.004 0.004 0.004
Uttar Pradesh 0.004 0.004 0.004 0.003
Tamil Nadu 0.004 0.004 0.004 0.003
Others 0.011 0.007 0.003 0.004
India 0.533 0.524 0.314 0.462
Source: Indiastat
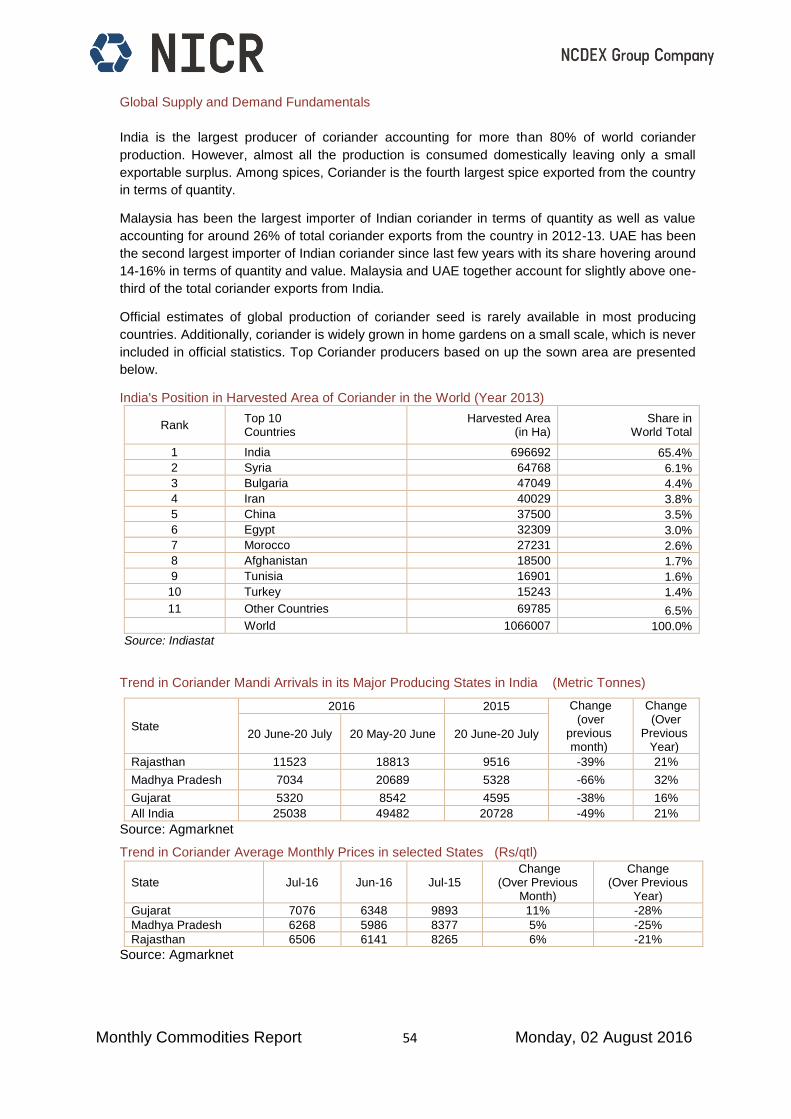
Monthly Commodities Report 54 Monday, 02 August 2016
Global Supply and Demand Fundamentals
India is the largest producer of coriander accounting for more than 80% of world coriander
production. However, almost all the production is consumed domestically leaving only a small
exportable surplus. Among spices, Coriander is the fourth largest spice exported from the country
in terms of quantity.
Malaysia has been the largest importer of Indian coriander in terms of quantity as well as value
accounting for around 26% of total coriander exports from the country in 2012-13. UAE has been
the second largest importer of Indian coriander since last few years with its share hovering around
14-16% in terms of quantity and value. Malaysia and UAE together account for slightly above one-
third of the total coriander exports from India.
Official estimates of global production of coriander seed is rarely available in most producing
countries. Additionally, coriander is widely grown in home gardens on a small scale, which is never
included in official statistics. Top Coriander producers based on up the sown area are presented
below.
India's Position in Harvested Area of Coriander in the World (Year 2013)
Rank Top 10 Countries
Harvested Area (in Ha)
Share in World Total
1 India 696692 65.4%
2 Syria 64768 6.1%
3 Bulgaria 47049 4.4%
4 Iran 40029 3.8%
5 China 37500 3.5%
6 Egypt 32309 3.0%
7 Morocco 27231 2.6%
8 Afghanistan 18500 1.7%
9 Tunisia 16901 1.6%
10 Turkey 15243 1.4%
11 Other Countries 69785 6.5%
World 1066007 100.0%
Source: Indiastat
Trend in Coriander Mandi Arrivals in its Major Producing States in India (Metric Tonnes)
State
2016 2015 Change (over
previous month)
Change (Over
Previous Year)
20 June-20 July 20 May-20 June 20 June-20 July
Rajasthan 11523 18813 9516 -39% 21%
Madhya Pradesh 7034 20689 5328 -66% 32%
Gujarat 5320 8542 4595 -38% 16%
All India 25038 49482 20728 -49% 21%
Source: Agmarknet
Trend in Coriander Average Monthly Prices in selected States (Rs/qtl)
State Jul-16 Jun-16 Jul-15 Change
(Over Previous Month)
Change (Over Previous
Year)
Gujarat 7076 6348 9893 11% -28%
Madhya Pradesh 6268 5986 8377 5% -25%
Rajasthan 6506 6141 8265 6% -21%
Source: Agmarknet

Monthly Commodities Report 55 Monday, 02 August 2016
Trend in Coriander Stock in NCDEX approved warehouses (in Metric Tonnes)
WEEK ENDING Coriander
Stock Weekly Change Monthly Change Period
01 May 2016 239
05 June 2016 2970 1142.7% 1143% 01 May - 05 June
12 June 2016 3366 13.3%
19 June 2016 3597 6.9%
26 June 2016 3826 6.4%
03 July 2016 4276 11.8% 44% 05 June - 03 July
10 July 2016 4545 6.3%
17 July 2016 4185 -7.9%
24 July 2016 4417 5.5% 3% 03 July - 24 July
May- July 1748% 1 May - 24 July
Spot and Futures Price Chart
0
2,000
4,000
6,000
8,000
10,000
12,000
14,000
Ap
r-11
Jul-
11
Oct-
11
Jan
-12
Ap
r-12
Jul-
12
Oct-
12
Jan
-13
Ap
r-13
Jul-
13
Oct-
13
Jan
-14
Ap
r-14
Jul-
14
Oct-
14
Jan
-15
Ap
r-15
Jul-
15
Oct-
15
Jan
-16
Ap
r-16
Jul-
16
Rs./
Qu
inta
l
Coriander Long Term Price Trend
Spot Price Futures Price
6,5006,7006,9007,1007,3007,5007,7007,9008,1008,3008,500
20-J
un-1
6
21-J
un-1
6
22-J
un-1
6
23-J
un-1
6
24-J
un-1
6
25-J
un-1
6
26-J
un-1
6
27-J
un-1
6
28-J
un-1
6
29-J
un-1
6
30-J
un-1
6
01-J
ul-1
6
02-J
ul-1
6
03-J
ul-1
6
04-J
ul-1
6
05-J
ul-1
6
06-J
ul-1
6
07-J
ul-1
6
08-J
ul-1
6
09-J
ul-1
6
10-J
ul-1
6
11-J
ul-1
6
12-J
ul-1
6
13-J
ul-1
6
14-J
ul-1
6
15-J
ul-1
6
16-J
ul-1
6
17-J
ul-1
6
18-J
ul-1
6
19-J
ul-1
6
20-J
ul-1
6
Rs./
Qu
inta
l
Coriander Price Trend : 20 June - 20 July, 2016
Spot Price Jul-2016 Aug-2016 Sep-2016 Oct-2016 Nov-2016

Monthly Commodities Report 56 Monday, 02 August 2016
Coriander – Production during last 3 years
Year Production (MMT)
2013-14# 0.314
2014-15# 0.462
2015-16* 0.440
Source: #: Indiastat, * Market Sources
Coriander Average Spot Prices
Financial Year Average Price (Rs/Quintal) YoY Price Variation
2013-14 6,901
2014-15 10162 47.25%
2015-16 10,049 -1.11%
2016-17 7,436 -26.01%
Month-wise Price Volatility
Average Open Interest, Stocks in approved warehouses and deliveries
Year Open Interest
(MT) Stocks in approved warehouses (MT)
Deliveries during the year (MT)
2013-14 46535 16730 29680
2014-15 55896 10887 9460
2015-16 49556 41400 56770
2016-17 25106 4156 6270
Stocks = Maximum stocks on the day of expiry during respective financial year
Deliveries = Total deliveries during the respective financial year
Markets and Trade
Significant price rise is seen in the coriander market during the period under review. Spot and
futures market increased by 15 and 19% respectively during 20 June-20 July period.
Demand by the exporters and other user industry has increased in the market in Rajasthan and
Gujarat region.
During last two months the arrivals have remained lower in its major producing state i.e. Gujarat
and Rajasthan regions.
Market sources opine that Gujarat has already supplied 90% of its stocks in the market till now and
traders are holding only 10% stocks with them. Trader sources confirm that Gujarat traders have
supplied their much stocks at comparatively lower prices.
Rajasthan and Madhya Pradesh traders and farmers are believed to be still hold substantial quantity
of Dhaniya in anticipation of further rise in prices in medium term.
Traders also say that the current stocks are not in parity with the current market prices.
Month Volatility
Jan-16 23.24%
Feb-16 20.38%
Mar-16 30.94%
April -16 29.47%
May-16 15.60%
June -16 10.71%
July-16 (Till 20 July) 25.13%
Spot Price Volatility during January to July Period 25.06%

Monthly Commodities Report 57 Monday, 02 August 2016
Edible oils
Soy Oil
Introduction
Soybean Oil is natural oil extracted from whole soybean. About 18-19% of soybean’s weight is
extracted as crude soybean oil. Soybean oil is the leading vegetable oil traded in the international
market, next only to palm oil.
Soybean oil is basically used in cooking as edible oil. It is also used to produce inedible products
such as paints, varnish, resins and plastics. Soy oil contains two types of fatty acids called omega-
3 fatty acid and omega-6 fatty acids. To produce soybean oil, the soybeans are cracked, adjusted
for moisture content, heated to between 140–190°F, rolled into flakes, and solvent-extracted with
hexanes. The oil is then refined, blended for different applications, and sometimes hydrogenated.
Soybean oils, both liquid and partially hydrogenated are sold as "vegetable oil," or are ingredients
in a wide variety of processed foods. Most of the remaining residue (soybean meal) is used as
animal feed. In India, crushing of soybean for soy oil and meal starts from October and it peaks
during the subsequent three-four months. Soybean oil Marketing Season in India begins from
November and ends in October.
Global Supply and Demand Fundamentals
As per the latest USDA report, global soybean oil production is estimated to rise by 6.4% during
2015-16. Export as well as import demand is also estimated to remain firm during the year.
Consumption demand from countries like India, China, and Indonesia is expected to remain firm.
Global soybean oil ending stocks are projected at 3.86 MMT, up 6.7 percent from 2014-15. For the
year 2016-17, the beginning stock, production as well as total supply is expected to further rise.
World Soybean Oil Supply & Demand Estimates (in MMT)
Attribute 2014-15 2015-16
(Estimates) 2016-17
(Projections)
Change in 2015-16 over
2014-15
Projected Change in 2016-17
over 2015-16
Beginning Stocks 3.63 3.62 3.87 -0.1% 6.7%
Production 49.06 52.19 53.82 6.4% 3.1%
MY Imports 10.08 11.72 11.01 16.3% -6.0%
Total Supply 62.77 67.53 68.70 7.6% 1.7%
MY Exports 11.10 12.47 11.96 12.3% -4.1%
Domestic Consumption 48.04 51.20 53.07 6.6% 3.7%
Ending Stocks 3.62 3.86 3.66 6.7% -5.1%
Source: USDA, 25 July 2016
Indian Soybean oil Supply & Demand Estimates (in MMT)
Attribute 2014-15 2015-16
(Estimates) 2016-17
(Projections) Change in 2015-16 over 2014-15
Projected Change in 2016-17 over 2015-16
Beginning Stocks 0.25 0.20 0.34 -19.1% 72.9%
Production 1.20 1.04 1.61 -13.6% 54.9%
MY Imports 2.80 4.00 3.30 42.9% -17.5%
Total Supply 4.25 5.24 5.26 23.3% 0.3%
Total Dom. Cons. 4.05 4.89 4.90 20.8% 0.2%
Ending Stocks 0.20 0.34 0.36 72.9% 3.2%
Source: USDA

Monthly Commodities Report 58 Monday, 02 August 2016
Spot and Futures Price Chart
0
100
200
300
400
500
600
700
800
900
Ap
r-11
Jul-
11
Oct-
11
Jan
-12
Ap
r-12
Jul-
12
Oct-
12
Jan
-13
Ap
r-13
Jul-
13
Oct-
13
Jan
-14
Ap
r-14
Jul-
14
Oct-
14
Jan
-15
Ap
r-15
Jul-
15
Oct-
15
Jan
-16
Ap
r-16
Jul-
16
Rs./
Qu
inta
lSoybean Oil Long Term Price Trend
Spot Price Future Price
600
610
620
630
640
650
660
670
20-J
un-1
6
21-J
un-1
6
22-J
un-1
6
23-J
un-1
6
24-J
un-1
6
25-J
un-1
6
26-J
un-1
6
27-J
un-1
6
28-J
un-1
6
29-J
un-1
6
30-J
un-1
6
01-J
ul-1
6
02-J
ul-1
6
03-J
ul-1
6
04-J
ul-1
6
05-J
ul-1
6
06-J
ul-1
6
07-J
ul-1
6
08-J
ul-1
6
09-J
ul-1
6
10-J
ul-1
6
11-J
ul-1
6
12-J
ul-1
6
13-J
ul-1
6
14-J
ul-1
6
15-J
ul-1
6
16-J
ul-1
6
17-J
ul-1
6
18-J
ul-1
6
19-J
ul-1
6
20-J
ul-1
6
Rs./
Qu
inta
l
Soybean Oil Price Trend : 20 June - 20 July, 2016
Spot Price Jul-2016 Aug-2016 Sep-2016 Oct-2016
Nov-2016 Dec-2016 Jan-2017 Feb-2017

Monthly Commodities Report 59 Monday, 02 August 2016
Soybean oil - Production during last 3 years
Year Production
(MMT)
2013-14 1.45
2014-15 1.20
2015-16 1.10
2016-17* 1.60
Source: USDA, *2016-17 are projections
Soybean oil Average Spot Prices
Financial Year Average Price
(Rs/10kg) YOY
Price Variation
2013-14 704
2014-15 647 -8.12%
2015-16 607 -6.12%
2015-16 638 5.12%
Month-wise Price Volatility
Average Open Interest
Year Open Interest
(MT)
2013-14 215291
2014-15 239258
2015-16 231595
2016-17 244158
Month Volatility
Jan-15 8.02%
Feb-16 6.24%
Mar-16 9.29%
April-16 18.57%
May-16 13.14%
June -16 7.73%
July-16 (Till 20 July) 9.87%
Spot Price Volatility during January to July Period 10.93%

Monthly Commodities Report 60 Monday, 02 August 2016
Markets and Trade
Sideways to marginally weak sentiments were seen in the physical as well as futures market. Spot
prices remained unchanged while futures prices fell by 2% during 20 June-20 July period.
The above normal monsoon prediction by IMD has brightened the kharif oilseeds crop production
prospects including soybean. This news has negatively impacted the market sentiments.
Trade sources opine that festivals are starting soon and Diwali will be celebrated in October. Till
than soybean oil from new soybean crop crushing will be not be available. Thus demand is likely to
increase significantly in medium term. Since the crushing from domestic new crop will start from mid-
October, the demand will largely be met through imported oil only. Thus international market
sentiments will guide Indian market prices in coming days.
The Solvent Extractors’ Association of India has compiled the Import data of Vegetable Oils (edible
& non-edible) for the month of June 2016. Import of vegetable oils during June, 2016 is reported at
11.69 MMT compared to 10.16 MMT in June, 2015. up by 15%. The overall import of vegetable oils
during first eight months of the current oil year 2015-16, Nov.’15 – June’16 is reported 9.76 MMT
compared to 8.85 MMT i.e. up by 10%. Soy oil imports during November –June 2015-16 touched
2.81 MMT as against 1.50 MMT imported in the corresponding period of the previous year, up by 87
% y-o-y.
Current stock of edible oils as on 1st July, 2016 at various ports is estimated at 0.88 MMT (CPO 0.28
MMT, RBD Palmolein 0.18 MMT, Degummed Soybean Oil 0.30 MMT, Crude Sunflower Oil 0.11
MMT and 13,000 tons of Rapeseed (Canola) Oil) and about 1.44 MMT in pipelines. Total stock at
ports and in pipelines marginally decreased to 2.32 MMT tons from 2.33 MMT in June 2016. India’s
monthly requirement is about 16.5 lakh tons and operate at 30 days stock against which currently
holding stock over 2.32 MMT equal to 42 days requirements. The overall stock as on 1st July, 2016
has decreased by 10,000 tons compared to 1st June, 2016.
The import of RBD Palmolein during the first eight months of the current oil year i.e. from November
2015 to June 2016 doubled and reached at 1.78 MMT from 0.91 MMTreplacing import of CPO and
expected to increase further in the coming months.
The SEA of India warns that the alarming increase in import of RBD Palmolein, is seriously hurting
the domestic refining industry. This situation has arisen due to the fact that currently the landed cost
of RBD olein (finished product) is same as that of Crude Palm Oil (raw material). Due to this
situation, the domestic refining industry is facing severe crisis of underutilization of capacity and is
on the verge of closure. Presently tax on export of CPO from Indonesia/Malaysia is higher by 5% in
comparison to Refined Palm Oil/Olein. This differential will keep increasing with increase in prices
of Palm Oil in the origins. Therefore duty differential in India has to be made variable to be in line
with the differential duty prevailing in Malaysia/Indonesia and justify to increase in duty difference
between crude and refined vegetable oils from 7.5% to 15%. (Source: SEA of India)
International
Weakness was seen in the International soy oil market. At CBOT, soy oil prices fell by 2.94%
compared to previous month. Higher production estimates have weighted down the market
sentiments.
As per the latest USDA report, global soybean oil production is estimated to rise by 6.4% during
2015-16. Export as well as import demand is also estimated to remain firm during the year.
Consumption demand from countries like India, China, and Indonesia is expected to remain firm.
Global soybean oil ending stocks are projected at 3.86 MMT, up 6.7 percent from 2014-15. For the
year 2016-17, the beginning stock, production as well as total supply is expected to further rise.
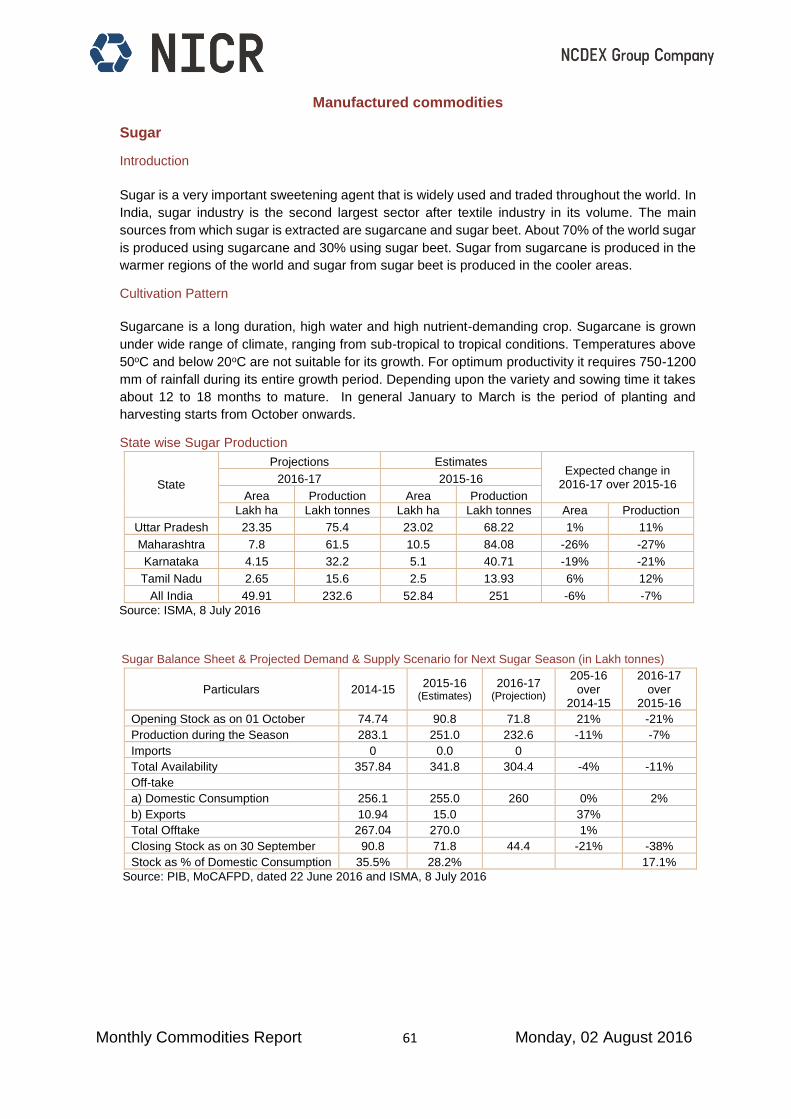
Monthly Commodities Report 61 Monday, 02 August 2016
Manufactured commodities
Sugar
Introduction
Sugar is a very important sweetening agent that is widely used and traded throughout the world. In
India, sugar industry is the second largest sector after textile industry in its volume. The main
sources from which sugar is extracted are sugarcane and sugar beet. About 70% of the world sugar
is produced using sugarcane and 30% using sugar beet. Sugar from sugarcane is produced in the
warmer regions of the world and sugar from sugar beet is produced in the cooler areas.
Cultivation Pattern
Sugarcane is a long duration, high water and high nutrient-demanding crop. Sugarcane is grown
under wide range of climate, ranging from sub-tropical to tropical conditions. Temperatures above
50oC and below 20oC are not suitable for its growth. For optimum productivity it requires 750-1200
mm of rainfall during its entire growth period. Depending upon the variety and sowing time it takes
about 12 to 18 months to mature. In general January to March is the period of planting and
harvesting starts from October onwards.
State wise Sugar Production
State
Projections Estimates Expected change in
2016-17 over 2015-16 2016-17 2015-16
Area Production Area Production
Lakh ha Lakh tonnes Lakh ha Lakh tonnes Area Production
Uttar Pradesh 23.35 75.4 23.02 68.22 1% 11%
Maharashtra 7.8 61.5 10.5 84.08 -26% -27%
Karnataka 4.15 32.2 5.1 40.71 -19% -21%
Tamil Nadu 2.65 15.6 2.5 13.93 6% 12%
All India 49.91 232.6 52.84 251 -6% -7%
Source: ISMA, 8 July 2016
Sugar Balance Sheet & Projected Demand & Supply Scenario for Next Sugar Season (in Lakh tonnes)
Particulars 2014-15 2015-16
(Estimates) 2016-17
(Projection)
205-16 over
2014-15
2016-17 over
2015-16
Opening Stock as on 01 October 74.74 90.8 71.8 21% -21%
Production during the Season 283.1 251.0 232.6 -11% -7%
Imports 0 0.0 0
Total Availability 357.84 341.8 304.4 -4% -11%
Off-take
a) Domestic Consumption 256.1 255.0 260 0% 2%
b) Exports 10.94 15.0 37%
Total Offtake 267.04 270.0 1%
Closing Stock as on 30 September 90.8 71.8 44.4 -21% -38%
Stock as % of Domestic Consumption 35.5% 28.2% 17.1%
Source: PIB, MoCAFPD, dated 22 June 2016 and ISMA, 8 July 2016

Monthly Commodities Report 62 Monday, 02 August 2016
Sugar Inflation
All India Inflation rates (on point to point basis i.e. current month over same month of last year, i.e.,
June 2016 over June 2015), based on monthly Wholesale Price Index (WPI) are presented below
of sugar and food articles.
Inflation for Sugar
Commodities Jan-16 Feb-16 Mar-16 Apr-16 May-16 June-16
Food Articles 6.46 3.91 4.09 4.70 7.88 8.18
Sugar -0.55 5.23 9.05 17.34 22.30 26.09
Source: Office of the Economic Advisor, DIPP, Ministry of Commerce & Industry, GoI
The Sugar inflation is highest after pulses in essential commodities. The more rise is seen from
March month onwards.
Trend in Sugar Stock in NCDEX approved warehouses (in Metric Tonnes)
WEEK ENDING Sugar
Stock Weekly Change Monthly Change Period
01 May 2016 65661
05 June 2016 11698 -82.2% -82% 01 May - 05 June
12 June 2016 9910 -15.3%
19 June 2016 10809 9.1%
26 June 2016 11399 5.5%
03 July 2016 11719 2.8% 0% 05 June - 03 July
10 July 2016 12309 5.0%
17 July 2016 10370 -15.8%
24 July 2016 9921 -4.3% -15% 03 July - 24 July
May- July -85% 1 May - 24 July
Global Supply and Demand Fundamentals
Brazil is the leading sugar producing country across the globe followed by India. Over 3/4ths of the
total sugar produced is consumed domestically in the countries in which it is produced, and the
rest is traded around the globe which is often termed as World Sugar.
World Sugar Supply & Demand Estimates (in Lakh tonnes)
Attribute 2014-15 2015-16 2016-17 Change in 2015-16
over 2014-15
Change in 2016-17 over
2015-16
Beginning Stocks 439.28 457.62 377.63 4% -17%
Sugar Production 1772.24 1649.23 1693.31 -7% 3%
Total Imports 508.83 544.37 556.16 7% 2%
Total Supply 2720.35 2651.22 2627.1 -3% -1%
Total Exports 550.32 548.71 556.32 0% 1%
Dom. Consumption 1704.39 1717.99 1736.37 1% 1%
Ending Stocks 457.62 377.63 328.28 -17% -13%
Source: USDA, 29 July 2016
The sugar season for 2016-17 starts with a sharp decline in the beginning stock as can be seen
from the below Table. The world sugar production is expected to improve slightly. However the total
world supply is estimated to remain 1% below from the year 2015-16. The major decline in
production is seen in India. However, other major producers like Brazil and Thailand are expected
to witness some increment in the production.
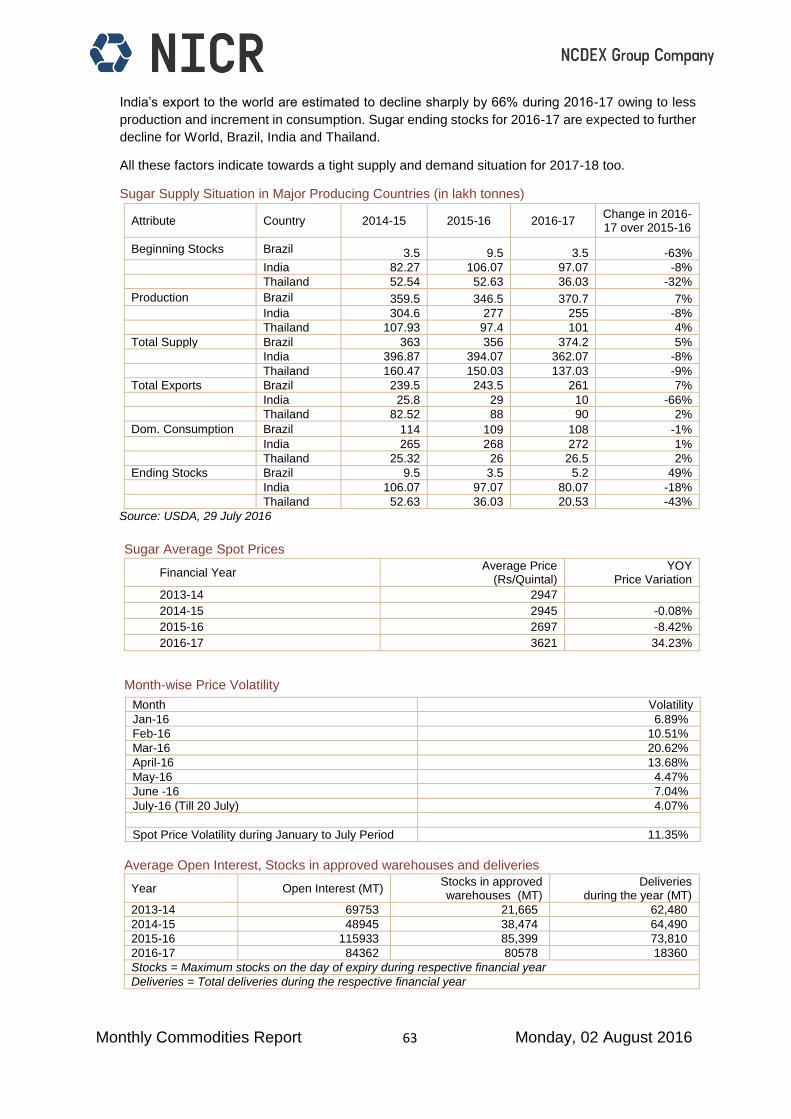
Monthly Commodities Report 63 Monday, 02 August 2016
India’s export to the world are estimated to decline sharply by 66% during 2016-17 owing to less
production and increment in consumption. Sugar ending stocks for 2016-17 are expected to further
decline for World, Brazil, India and Thailand.
All these factors indicate towards a tight supply and demand situation for 2017-18 too.
Sugar Supply Situation in Major Producing Countries (in lakh tonnes)
Attribute Country 2014-15 2015-16 2016-17 Change in 2016-17 over 2015-16
Beginning Stocks Brazil 3.5 9.5 3.5 -63%
India 82.27 106.07 97.07 -8%
Thailand 52.54 52.63 36.03 -32%
Production Brazil 359.5 346.5 370.7 7%
India 304.6 277 255 -8%
Thailand 107.93 97.4 101 4%
Total Supply Brazil 363 356 374.2 5%
India 396.87 394.07 362.07 -8%
Thailand 160.47 150.03 137.03 -9%
Total Exports Brazil 239.5 243.5 261 7%
India 25.8 29 10 -66%
Thailand 82.52 88 90 2%
Dom. Consumption Brazil 114 109 108 -1%
India 265 268 272 1%
Thailand 25.32 26 26.5 2%
Ending Stocks Brazil 9.5 3.5 5.2 49%
India 106.07 97.07 80.07 -18%
Thailand 52.63 36.03 20.53 -43%
Source: USDA, 29 July 2016
Sugar Average Spot Prices
Financial Year Average Price
(Rs/Quintal) YOY
Price Variation
2013-14 2947
2014-15 2945 -0.08%
2015-16 2697 -8.42%
2016-17 3621 34.23%
Month-wise Price Volatility
Average Open Interest, Stocks in approved warehouses and deliveries
Year Open Interest (MT) Stocks in approved warehouses (MT)
Deliveries during the year (MT)
2013-14 69753 21,665 62,480
2014-15 48945 38,474 64,490
2015-16 115933 85,399 73,810
2016-17 84362 80578 18360
Stocks = Maximum stocks on the day of expiry during respective financial year
Deliveries = Total deliveries during the respective financial year
Month Volatility
Jan-16 6.89%
Feb-16 10.51%
Mar-16 20.62%
April-16 13.68%
May-16 4.47%
June -16 7.04%
July-16 (Till 20 July) 4.07%
Spot Price Volatility during January to July Period 11.35%

Monthly Commodities Report 64 Monday, 02 August 2016
Spot and Futures Price Chart
Comparison of Domestic Sugar prices with International prices
0
1,000
2,000
3,000
4,000
Ap
r-11
Jul-
11
Oct-
11
Jan
-12
Ap
r-12
Jul-
12
Oct-
12
Jan
-13
Ap
r-13
Jul-
13
Oct-
13
Jan
-14
Ap
r-14
Jul-
14
Oct-
14
Jan
-15
Ap
r-15
Jul-
15
Oct-
15
Jan
-16
Ap
r-16
Jul-
16
Rs./Q
uin
tal
Sugar Long Term Price Trend
Spot Price Futures Price
3,000
3,500
4,000
4,500
5,000
20
-Jun-1
6
21
-Jun-1
6
22
-Jun-1
6
23
-Jun-1
6
24
-Jun-1
6
25
-Jun-1
6
26
-Jun-1
6
27
-Jun-1
6
28
-Jun-1
6
29
-Jun-1
6
30
-Jun-1
6
01
-Jul-1
6
02
-Jul-1
6
03
-Jul-1
6
04
-Jul-1
6
05
-Jul-1
6
06
-Jul-1
6
07
-Jul-1
6
08
-Jul-1
6
09
-Jul-1
6
10
-Jul-1
6
11
-Jul-1
6
12
-Jul-1
6
13
-Jul-1
6
14
-Jul-1
6
15
-Jul-1
6
16
-Jul-1
6
17
-Jul-1
6
18
-Jul-1
6
19
-Jul-1
6
20
-Jul-1
6
Rs./Q
uin
tal
Sugar Price Trend : 20 June - 20 July, 2016
Spot Price Jul-2016 Oct-2016 Dec-2016 Mar-2017
May-2017 Jul-2017 Oct-2017 Dec-2017 Mar-2018
0100200300400500600
0
1,000
2,000
3,000
4,000
01
-Oct-
15
16
-Oct-
15
31
-Oct-
15
15
-No
v-1
5
30
-No
v-1
5
15
-De
c-1
5
30
-De
c-1
5
14
-Jan-1
6
29
-Jan-1
6
13
-Feb
-16
28
-Feb
-16
14
-Mar-
16
29
-Mar-
16
13
-Ap
r-16
28
-Ap
r-16
13
-May-1
6
28
-May-1
6
12
-Jun-1
6
27
-Jun-1
6
12
-Jul-1
6
27
-Jul-1
6
(US
D/M
T)
(Rs./
Quin
tal)
Sugar: Domestic vs. International Sugar (Refined Sugar No. 5)
Sugar M Spot Refined Sugar (Sugar no. 5 -LIFFE)
0.00
100.00
200.00
300.00
400.00
500.00
0
500
1,000
1,500
2,000
2,500
3,000
3,500
4,000
01
-Oct-
15
15
-Oct-
15
29
-Oct-
15
12
-No
v-1
5
26
-No
v-1
5
10
-De
c-1
5
24
-De
c-1
5
07
-Jan-1
6
21
-Jan-1
6
04
-Feb
-16
18
-Feb
-16
03
-Mar-
16
17
-Mar-
16
31
-Mar-
16
14
-Ap
r-16
28
-Ap
r-16
12
-May-1
6
26
-May-1
6
09
-Jun-1
6
23
-Jun-1
6
07
-Jul-1
6
21
-Jul-1
6
($/M
T)
(Rs./
Quin
tal)
Sugar: Domestic vs. International Sugar (Raw Sugar No. 11)
Sugar M Spot Raw Sugar (No. 11- ICE)

Monthly Commodities Report 65 Monday, 02 August 2016
Sugar Price Review since the start of current marketing season (1 Oct 2015-28 July 2016)
Sugar M Grade Domestic Prices:
Sugar Season (2015-16)
Price (Rs/qtl) 01-Oct-15 28-Jul-16 Change
Spot 2,556.50 3,751.25 47%
Futures 2,530.00 3,824.00 51%
Sugar Season (2014-15)
01-Oct-14 28-Jul-15
Spot 3,002.50 2,155.00 -28%
Futures 2,885.00 2,184.00 -24%
Source: NCDEX
Sugar International Prices
Sugar Sugar Season (2015-16)
Unit Exchange 01-Oct-15 28-Jul-16 Change
Refined Sugar 384.00 518.10 35% US $/MT LIFFE
Raw Sugar 298.29 417.47 40% US $/MT ICE
Source: Reuters
Price Trend
It can be observed that Sugar prices have increased since the start of the Sugar marketing
season (October 2015). Spot and futures prices rose by 47 and 51% respectively during the
last 10 months. Sugar prices witnessed declining trend during same period last year due to
excess supply.
However during April 2016 some short term fall in prices was seen in the Sugar spot and futures
prices due to various steps taken by the government to contain price rise in essential
commodities. The major one is the imposition of stock holding limits on the Sugar. The same
was imposed on 29 April 2016. It is interesting to note that market anticipated this move of
government many days well before from the date of its actual announcement and this started
reflecting in to the downward price trend which started from 18 April 2016.
Sugar prices in international markets have also increased significantly during the period under
review. Refined Sugar increased by 35% while raw sugar climbed by 40% since October 2015
till 28 July 2016.
Markets and Trade
During the period of 20 June-20 July 2016, a narrow range bound movement was seen in Sugar
prices in domestic market. Negligible change was seen in spot and futures prices. However, sugar
prices have increased since start of October 2015 due to strong fundamentals of demand and
supply.
Production is estimated to be lower in the year 2015-16 due to deficit rainfall. It is projected to
further reduce during 2016-17.
The Indian Sugar Mills Association (ISMA) estimated Indian sugar production at 251 lakh tonnes
for this marketing year; 2015-16 (01 Oct, 2015 – 30 Sep, 2016). Sugar production was 283.1
MMT in the year 2014-15.
Sugar Production for 2016-17 (1 Oct 2016-30 Sept 2017) is projected to decline by 7% from 2015-
16. It may remain at 232.6 lakh tonnes. That would be the lowest output since the production of
18.9 MMT in 2009-10.

Monthly Commodities Report 66 Monday, 02 August 2016
With the domestic demand set to top 260 lakh tonnes, the inventory (closing stock) of about 71.8
lakh tonnes will be substantially depleted, opening the door for imports.
Thus production fall in current season as well as anticipation of further fall in next season is
supporting the market sentiments.
Further, a string of festivals will start from August and continue till October end when the biggest
Hindu festival “Diwali” will be celebrated on 30 October. Thus this fundamental factor will keep on
guiding the market direction in medium term.
Earlier, to keep the domestic prices of Sugar under check, Government has decided to impose
export duty of 20% on the export of raw Sugar, white or refined Sugar. Accordingly, Notification
No.37/2016-Customs, dated 16.06.2016 has been issued in this regard.
In a latest move, to rationalize the sugar supply in the domestic market and stabilize prices, the
India government is considering reintroducing a sugar release order mechanism, under which the
central government decided how much each mill will sell sugar in the open market. The release
order mechanism was scrapped in 2013 when the sugar industry was partially decontrolled.
Global Sugar prices rose sharply thus to restrict the exports from India, Government had to take
this decision. The duty is, however, lower than 25 percent proposed by the Agricultural Ministry.
India, the world's second largest Sugar producer after Brazil, has exported 169 lakh tonnes of
Sugar so far in the 2015-16 marketing year (October-September) and around 85-86 lakh tonnes
is expected to be dispatched by mills. However, new exports deal would be discouraged with
this decision.
Earlier market witnessed continued upward movement due to which Government of India had to
issue Sugar control order directing the state governments to impose stock holding limits on Sugar.
Due to this step the availability in the physical market improved. Stocks in the NCDEX approved
warehouses also fell drastically from May to June month.
Better monsoon forecast has brightened the Sugarcane production which may boost the supply
during next Sugar year.
However, traders expect that tight current supply and demand fundamentals will continue to keep
prices firm.
Trade participants opine that mills are keeping tight supply in the market just to maintain market
prices up in the physical markets.
International
International prices also rose significantly due to tighter supply outlook from top three leading
producers, viz; Brazil, India and Thailand.
Sugar International prices have remained firm during the period under review due to predicted
shortfall in Sugar in India. As per USDA production estimates, Sugar production for three major
sugar producers i.e. India, Brazil and Thailand is expected to change by -8%, 7% and 4%
respectively during 2016-17 as compared to 2015-16.
For 2016-17, the world beginning stock are projected to decline by 17%, total supply by 1% and
ending stocks by 13%.
The Exports from India are feared to decline by 66% during 2016-17 due to tight domestic supply
and demand fundamentals.
The Brazil which is the biggest sugar producer would be able to contribute to world sugar supplies.
Its production is expected to increase by 7%.
Overall Indian market supply and demand dynamics will continue to guide the world market
sentiments in medium to long term.
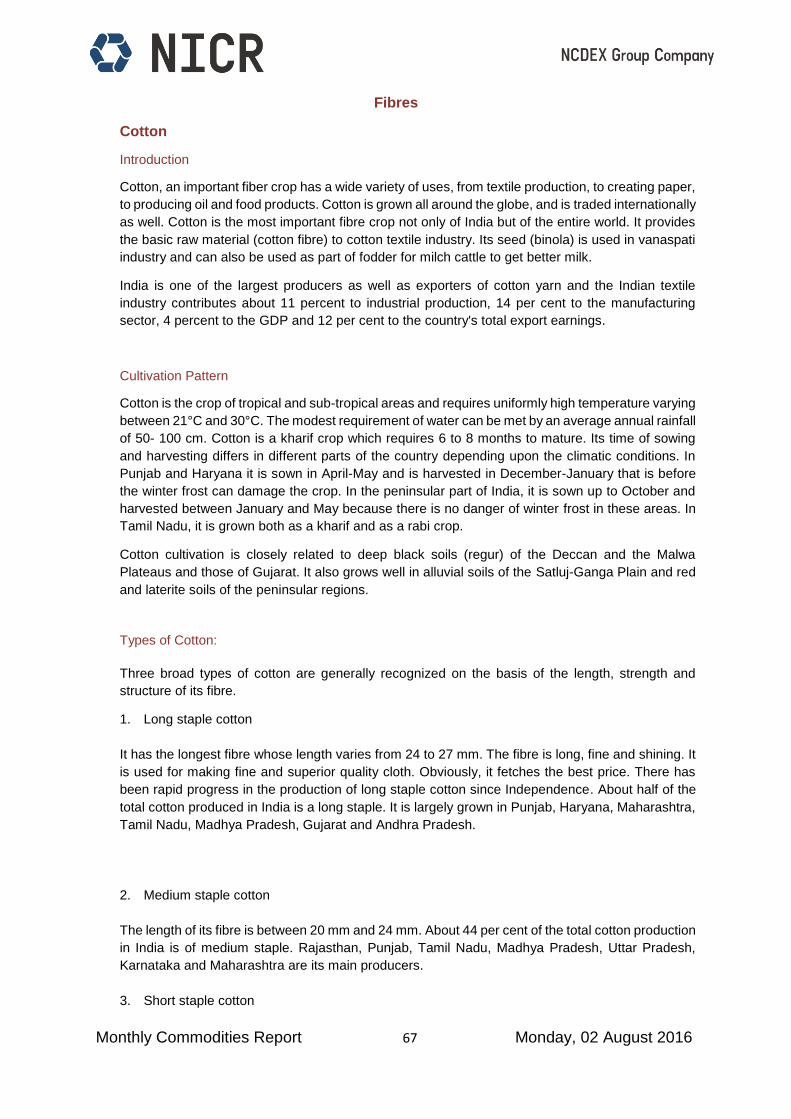
Monthly Commodities Report 67 Monday, 02 August 2016
Fibres
Cotton
Introduction
Cotton, an important fiber crop has a wide variety of uses, from textile production, to creating paper,
to producing oil and food products. Cotton is grown all around the globe, and is traded internationally
as well. Cotton is the most important fibre crop not only of India but of the entire world. It provides
the basic raw material (cotton fibre) to cotton textile industry. Its seed (binola) is used in vanaspati
industry and can also be used as part of fodder for milch cattle to get better milk.
India is one of the largest producers as well as exporters of cotton yarn and the Indian textile
industry contributes about 11 percent to industrial production, 14 per cent to the manufacturing
sector, 4 percent to the GDP and 12 per cent to the country's total export earnings.
Cultivation Pattern
Cotton is the crop of tropical and sub-tropical areas and requires uniformly high temperature varying
between 21°C and 30°C. The modest requirement of water can be met by an average annual rainfall
of 50- 100 cm. Cotton is a kharif crop which requires 6 to 8 months to mature. Its time of sowing
and harvesting differs in different parts of the country depending upon the climatic conditions. In
Punjab and Haryana it is sown in April-May and is harvested in December-January that is before
the winter frost can damage the crop. In the peninsular part of India, it is sown up to October and
harvested between January and May because there is no danger of winter frost in these areas. In
Tamil Nadu, it is grown both as a kharif and as a rabi crop.
Cotton cultivation is closely related to deep black soils (regur) of the Deccan and the Malwa
Plateaus and those of Gujarat. It also grows well in alluvial soils of the Satluj-Ganga Plain and red
and laterite soils of the peninsular regions.
Types of Cotton:
Three broad types of cotton are generally recognized on the basis of the length, strength and
structure of its fibre.
1. Long staple cotton
It has the longest fibre whose length varies from 24 to 27 mm. The fibre is long, fine and shining. It
is used for making fine and superior quality cloth. Obviously, it fetches the best price. There has
been rapid progress in the production of long staple cotton since Independence. About half of the
total cotton produced in India is a long staple. It is largely grown in Punjab, Haryana, Maharashtra,
Tamil Nadu, Madhya Pradesh, Gujarat and Andhra Pradesh.
2. Medium staple cotton
The length of its fibre is between 20 mm and 24 mm. About 44 per cent of the total cotton production
in India is of medium staple. Rajasthan, Punjab, Tamil Nadu, Madhya Pradesh, Uttar Pradesh,
Karnataka and Maharashtra are its main producers.
3. Short staple cotton
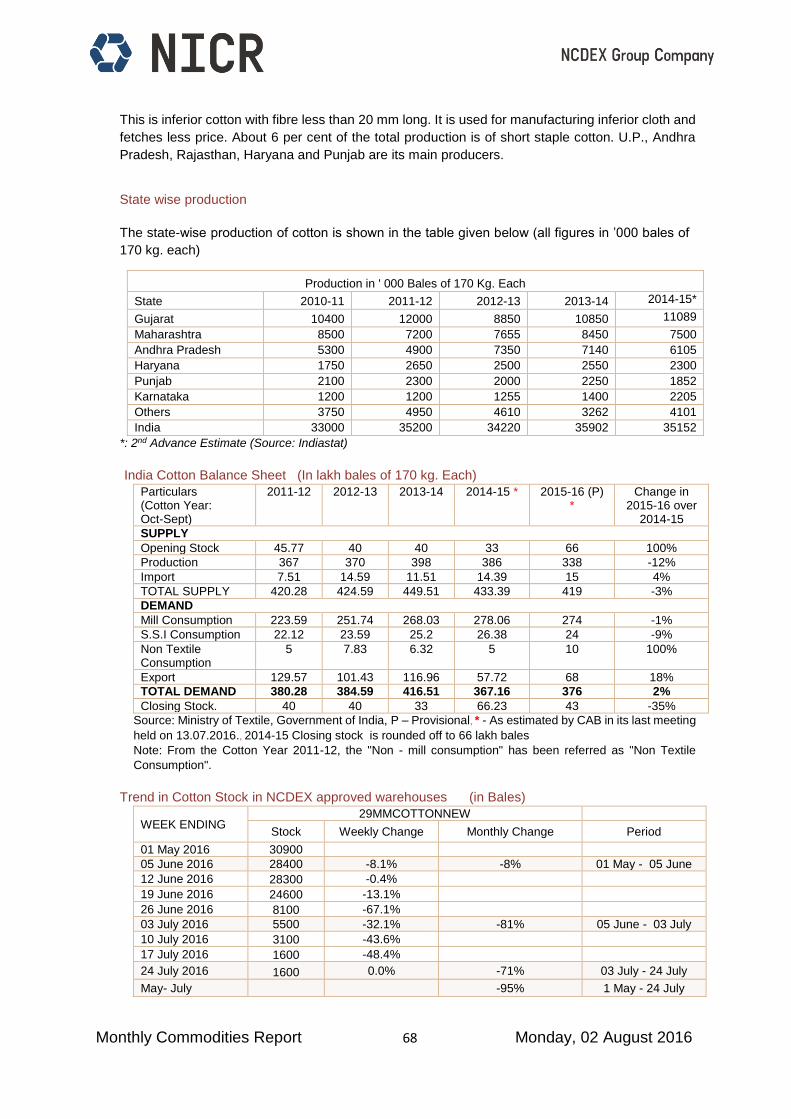
Monthly Commodities Report 68 Monday, 02 August 2016
This is inferior cotton with fibre less than 20 mm long. It is used for manufacturing inferior cloth and
fetches less price. About 6 per cent of the total production is of short staple cotton. U.P., Andhra
Pradesh, Rajasthan, Haryana and Punjab are its main producers.
State wise production
The state-wise production of cotton is shown in the table given below (all figures in ’000 bales of
170 kg. each)
Production in ' 000 Bales of 170 Kg. Each
State 2010-11 2011-12 2012-13 2013-14 2014-15*
Gujarat 10400 12000 8850 10850 11089
Maharashtra 8500 7200 7655 8450 7500
Andhra Pradesh 5300 4900 7350 7140 6105
Haryana 1750 2650 2500 2550 2300
Punjab 2100 2300 2000 2250 1852
Karnataka 1200 1200 1255 1400 2205
Others 3750 4950 4610 3262 4101
India 33000 35200 34220 35902 35152
*: 2nd Advance Estimate (Source: Indiastat)
India Cotton Balance Sheet (In lakh bales of 170 kg. Each)
Particulars (Cotton Year: Oct-Sept)
2011-12 2012-13 2013-14 2014-15 * 2015-16 (P) *
Change in 2015-16 over
2014-15
SUPPLY
Opening Stock 45.77 40 40 33 66 100%
Production 367 370 398 386 338 -12%
Import 7.51 14.59 11.51 14.39 15 4%
TOTAL SUPPLY 420.28 424.59 449.51 433.39 419 -3%
DEMAND
Mill Consumption 223.59 251.74 268.03 278.06 274 -1%
S.S.I Consumption 22.12 23.59 25.2 26.38 24 -9%
Non Textile Consumption
5 7.83 6.32 5 10 100%
Export 129.57 101.43 116.96 57.72 68 18%
TOTAL DEMAND 380.28 384.59 416.51 367.16 376 2%
Closing Stock. 40 40 33 66.23 43 -35%
Source: Ministry of Textile, Government of India, P – Provisional, * - As estimated by CAB in its last meeting
held on 13.07.2016., 2014-15 Closing stock is rounded off to 66 lakh bales
Note: From the Cotton Year 2011-12, the "Non - mill consumption" has been referred as "Non Textile
Consumption".
Trend in Cotton Stock in NCDEX approved warehouses (in Bales)
WEEK ENDING 29MMCOTTONNEW
Stock Weekly Change Monthly Change Period
01 May 2016 30900
05 June 2016 28400 -8.1% -8% 01 May - 05 June
12 June 2016 28300 -0.4%
19 June 2016 24600 -13.1%
26 June 2016 8100 -67.1%
03 July 2016 5500 -32.1% -81% 05 June - 03 July
10 July 2016 3100 -43.6%
17 July 2016 1600 -48.4%
24 July 2016 1600 0.0% -71% 03 July - 24 July
May- July -95% 1 May - 24 July

Monthly Commodities Report 69 Monday, 02 August 2016
Global Supply and Demand Fundamentals
The largest producers of cotton, are China and India. Most of this production is consumed by their
respective textile industries. The largest exporters of raw cotton are the United States.
World Cotton Supply & Demand Estimates (in Million Bales)
Attributes 2014-15 2015-16 2016-17
(Projections) Change in 2016-17 over 2015-16
Beginning Stocks 103.2 112.5 100.3 -10.84%
Production 119.1 97.9 102.5 4.73%
Imports 35.7 34.3 34.4 0.16%
Total Supply 258.0 244.7 237.2 -3.07%
Exports 35.4 34.3 34.4 0.16%
Total Dom. Consumption 110.2 110.1 111.5 1.29%
Ending Stocks 112.5 100.3 91.3 -8.96%
Source: USDA
Spot and Futures Price Chart
0
200
400
600
800
1,000
1,200
1,400
Ap
r-11
Jul-
11
Oct-
11
Jan
-12
Ap
r-12
Jul-
12
Oct-
12
Jan
-13
Ap
r-13
Jul-
13
Oct-
13
Jan
-14
Ap
r-14
Jul-
14
Oct-
14
Jan
-15
Ap
r-15
Jul-
15
Oct-
15
Jan
-16
Ap
r-16
Jul-
16
Rs./
20
kg
Kapas Long Term Price Trend (April Expiry)
800
850
900
950
1,000
1,050
20-J
un-1
6
21-J
un-1
6
22-J
un-1
6
23-J
un-1
6
24-J
un-1
6
25-J
un-1
6
26-J
un-1
6
27-J
un-1
6
28-J
un-1
6
29-J
un-1
6
30-J
un-1
6
01-J
ul-1
6
02-J
ul-1
6
03-J
ul-1
6
04-J
ul-1
6
05-J
ul-1
6
06-J
ul-1
6
07-J
ul-1
6
08-J
ul-1
6
09-J
ul-1
6
10-J
ul-1
6
11-J
ul-1
6
12-J
ul-1
6
13-J
ul-1
6
14-J
ul-1
6
15-J
ul-1
6
16-J
ul-1
6
17-J
ul-1
6
18-J
ul-1
6
19-J
ul-1
6
20-J
ul-1
6
Rs./
20
kg
Kapas Price Trend : 20 June - 20 July, 2016
Feb-2017 Mar-2017 Apr-2017
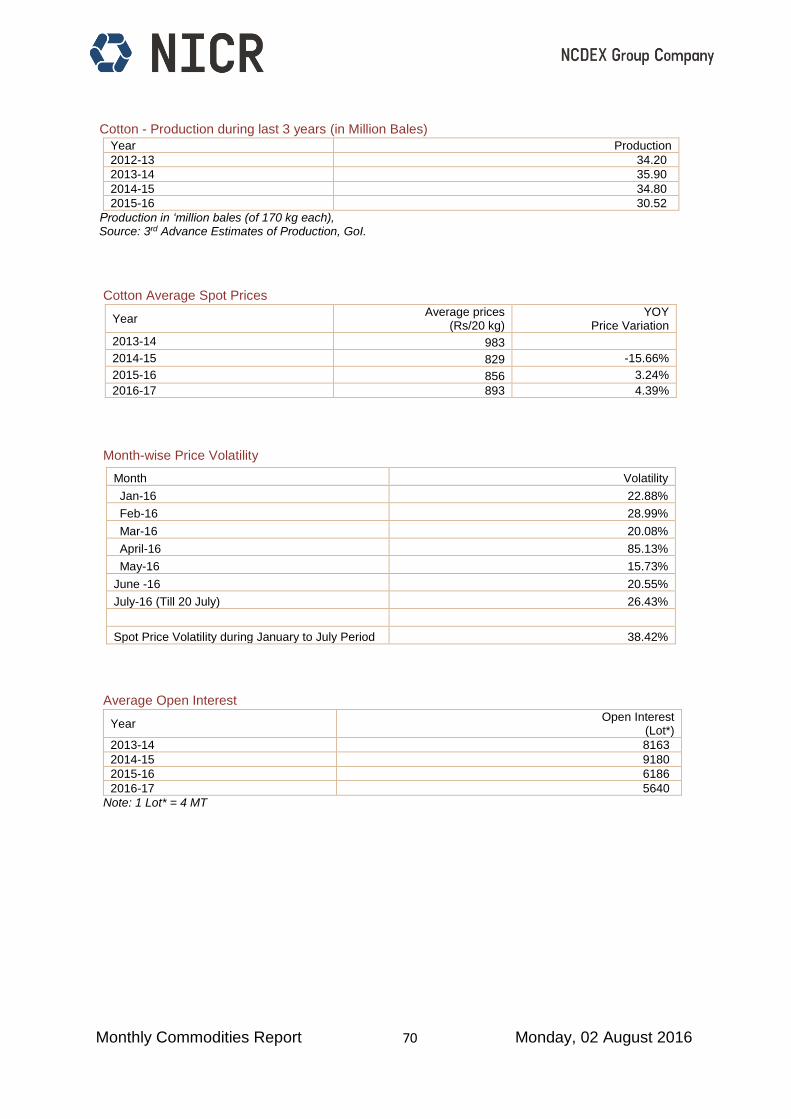
Monthly Commodities Report 70 Monday, 02 August 2016
Cotton - Production during last 3 years (in Million Bales)
Year Production
2012-13 34.20
2013-14 35.90
2014-15 34.80
2015-16 30.52
Production in ‘million bales (of 170 kg each), Source: 3rd Advance Estimates of Production, GoI.
Cotton Average Spot Prices
Year Average prices
(Rs/20 kg) YOY
Price Variation
2013-14 983
2014-15 829 -15.66%
2015-16 856 3.24%
2016-17 893 4.39%
Month-wise Price Volatility
Average Open Interest
Year Open Interest
(Lot*)
2013-14 8163
2014-15 9180
2015-16 6186
2016-17 5640
Note: 1 Lot* = 4 MT
Month Volatility
Jan-16 22.88%
Feb-16 28.99%
Mar-16 20.08%
April-16 85.13%
May-16 15.73%
June -16 20.55%
July-16 (Till 20 July) 26.43%
Spot Price Volatility during January to July Period 38.42%
Monthly Commodities Report 71 Monday, 02 August 2016
Markets and Trade
For the last two months the cotton prices have seen increment. Cotton futures market prices
increased by 12% during 20 June-20 July period. Prices have got support due decline in cotton
sown area in India.
The country's total area sown to cotton remained lower by 9 per cent at 92.33 lakh hectares so
far in 2016-17 compared with 101.91 lakh hectares during same period last year. Late onset of
monsoon is blamed for the less coverage in the central and southern area. However in the states
like Punjab and Haryana farmers have avoided cotton due to fear of whitefly pest attach.
The cotton sown area has declined in the states like Gujarat (-13%), Telengana (-2-14%). In
Punjab and Haryana farmers shifted to other crops after incurring huge losses due to whitefly
pest attack last year. Total area is down as farmers were scared to grow cotton fearing whitefly
pest attack that had damaged the crop massively in these two states last year. Farmers did not
opt for cotton despite prices ruling high in the market at present. Instead, farmers have shifted to
pulses, paddy and other crops in these states. However, in State like Gujarat late monsoon arrival
and deficit rainfall till date is considered a major reason of decline in cotton sown area.
In the states like Telengana, the farmers have shifted from cotton towards other lucrative crops
like pulses, soybean and Maize.
The Cotton Advisory Board has reduced its estimates for domestic cotton production for the 2015-
16. The cotton production is estimated to remain at 338 lakh bales as against the earlier estimates
of 352 lakh bales.274 lakh bales. The cotton closing stock for the current season are estimated
at 43 lakh bales. Consumption is estimated at 274 lakh bales. Cotton imports may remain near
15 lakh bales. However it may go up by 2-3 lakh bales.
India is likely to import from Africa and Australia. China stocks are lowered that too have fuelled
the international market prices. It is to be learnt that cotton international prices have risen by
11.74 % during the period under review.
Minimum Support Price (MSP) of cotton has been revised upwardly for the year 2015-16 by Rs
50 for each of Medium and Long staple. The MSP of Medium staple cotton has been revised to
Rs 3800 whereas, that of Long staple has been revised to Rs. 4100.
International
International cotton improved substantially (11.74%) during the period under review.
For 2016-17, world production and beginning stocks are forecast down, due to lower production
in India and Pakistan which more than offset higher production in the United States and Australia.
Consumption is forecast higher due to a large increase in China being only partially offset by
declines in India and Pakistan. World trade is higher, largely on the smaller crop in Pakistan
pushing up import demand.
U.S. Production is up sharply on higher planted area and continued favourable weather. Higher
exports and lower beginning stocks more than offset the increase in production and ending stocks
are forecast down. The U.S. season-average farm price forecast is raised 2 cents to 59
cents/pound.
For 2015-16, world consumption is raised, largely due to higher demand in China, resulting in
lower ending stocks. Global trade is largely unchanged. U.S. exports are raised to 9.2 million.
The U.S. season-average farm price is unchanged at 58 cents/pound.

Monthly Commodities Report 72 Monday, 02 August 2016
Disclaimer
---------------------------------------------------------------------------------------------------------------------------
This Report is for general information of the recipients. The views and opinions expressed in this
document may or may not match the views of the reader. It does not constitute a personal
recommendation or take into account the particular investment objectives, financial situations, or other
needs of the reader. This document is not intended to be and must not be taken as the basis for any
investment decision. It should be noted that the information contained herein is from publicly available
data or other sources believed to be reliable. We are not soliciting any action based upon this material.
Neither NCDEX, nor any person connected with it, accepts any liability arising from the use of this
document.
Top Related