


Languages
Pages
Legal

Monitoring of Air pollution using Wireless Sensor Networks
Abstract
Air pollution being one of the major factors affecting
the environment and nature`s chores. Monitoring it is
of vital importance on our part, as we human beings
are bestowed the most by mother earth. Considering
the degree of importance, monitoring of air pollution
caused by the automobiles should not just be restricted
to one time pre-commission reports or the time based
checks, but have a continuous check to keep the air
pollution within a permissible limit. In this paper we
are proposing an approach using chemical sensors to
constantly check emissions from vehicles to monitor
and maintain the best emission level to reduce the
pollution due to automobile carbon emission. The
simulation results show that dynamic monitoring of
carbon emission can be done to effectively curb pollution from vehicles.
Keywords—monitoring; pre-commission; air pollution;
carbon emission
1. INTRODUCTION WIRELESS sensor network (WSN) refers to a
group of spatially dispersed and dedicated sensors for
monitoring and recording the physical conditions of the
environment and organizing the collected data at a
central location. WSNs measure environmental conditions like temperature, sound, pollution levels,
humidity, wind speed and direction, pressure, etc.
A WSN consists of few hundreds to thousands of
sensor nodes. The sensor node equipment includes a
radio transceiver along with an antenna, a
microcontroller, an interfacing electronic circuit and an
energy source usually a battery. The size of the sensor
nodes can also range from the size of a shoe box to as
small as the size of a grain of dust
In recent days carbon emission from the
automobiles are being the major cause of air
pollution[1]. Periodic emission test is being done to
control the same. An emission test cycle is a protocol
contained in an emission standard to allow repeatable
and comparable measurement of exhaust emissions for
different engines or vehicles. Test cycles specify the
specific conditions under which the engine or vehicle is
operated during the emission test. Specified parameters in a test cycle include a range of operating temperature,
speed, and load. Ideally these are specified so as to
accurately and realistically represent the range of
conditions under which the vehicle or engine will be
operated in actual use. Because it is impractical to test
an engine or vehicle under every possible combination
of speed, load, and temperature, this may not actually
be the case. Vehicle and engine manufacturers may
exploit the limited number of test conditions in the
cycle by programming their engine management
systems to control emissions[2] to regulated levels at
the specific test points contained in the cycle, but create
a great deal more pollution under conditions
experienced in real operation but not represented in the
test cycle. This result in real emissions higher than the
standards is supposed to allow, undermining the
standards and public health.
1.1. APPLICATION OF WIRELESS
SENSOR NETWORKS
Of many, the below listed applications are well known
applications of WSN[3,4,5] along with their brief
description:
a) Area monitoring
Area monitoring is a common application of WSNs. In area monitoring, the WSN is deployed over a
region where some phenomenon is to be monitored. A
military example is the use of sensors detects enemy
intrusion; a civilian example is the Geo-fencing of gas
or oil pipelines.
b) Health care monitoring
The medical applications can be of two types:
wearable and implanted. Wearable devices are used on
the body surface of a human or just at close proximity
of the user. The implantable medical devices are those
that are inserted inside human body. There are many
other applications too e.g. body position measurement
Kiran Kumar S Dept. of ISE
BMS College of Engineering Bangalore, India
M Dakshayini Department of ISE
BMS College of Engineering Bangalore, India
Kiran Kumar S, Int.J.Computer Technology & Applications,Vol 5 (3),1213-1218
IJCTA | May-June 2014 Available [email protected]
1213
ISSN:2229-6093
and location of the person, overall monitoring of ill patients in hospitals and at homes.
c) Forest fire detection
A network of Sensor Nodes can be installed in a
forest to detect when a fire has started. The nodes can
be equipped with sensors to measure temperature,
humidity and gases which are produced by fire in the
trees or vegetation. The early detection is crucial for a
successful action of the fire-fighters; thanks to Wireless
Sensor Networks, the fire brigade will be able to know
when a fire is started and how it is spreading.
d) Landslide detection
A landslide detection system makes use of a
wireless sensor network to detect the slight movements
of soil and changes in various parameters that may
occur before or during a landslide. Through the data
gathered it may be possible to know the occurrence of landslides long before it actually happens.
e) Water quality monitoring
Water quality monitoring involves analysing water
properties in dams, rivers, lakes & oceans, as well as
underground water reserves. The use of many wireless
distributed sensors enables the creation of a more
accurate map of the water status, and allows the
permanent deployment of monitoring stations in
locations of difficult access, without the need of manual
data retrieval.
f) Natural disaster prevention
Wireless sensor networks can effectively act to
prevent the consequences of natural disasters, like
floods. Wireless nodes have successfully been
deployed in rivers where changes of the water levels have to be monitored in real time.
g) Industrial monitoring
1) Machine health monitoring
Wireless sensor networks have been developed for
machinery condition-based maintenance (CBM) as they
offer significant cost savings and enable new
functionality. In wired systems, the installation of
enough sensors is often limited by the cost of wiring.
Previously inaccessible locations, rotating machinery,
hazardous or restricted areas, and mobile assets can
now be reached with wireless sensors.
2) Data logging
Wireless sensor networks are also used for the
collection of data for monitoring of environmental
information; this can be as simple as the monitoring of
the temperature in a fridge to the level of water in overflow tanks in nuclear power plants. The statistical
information can then be used to show how systems have been working. The advantage of WSNs over
conventional loggers is the "live" data feed that is
possible.
h) Water/Waste water monitoring
Monitoring the quality and level of water includes
many activities such as checking the quality of
underground or surface water and ensuring a country’s
water infrastructure for the benefit of both human and
animal.
i) Applications of WSN for Air pollution
monitoring
Wireless sensor networks have been deployed in
several cities (Stockholm, London and Brisbane) to
monitor the concentration of dangerous gases for
citizens. These can take advantage of the ad hoc
wireless links rather than wired installations, which
also make them more mobile for testing readings in different areas.
Air pollution is a major issue that needs to be
addressed, since it has some very serious effect on
health. This leads to respiratory disorders.
My proposed solution of monitoring the hazardous
pollutants is to dynamically and continuously check the
emission from the vehicle every moment the vehicle is
running there by drastically reducing any chance of
polluting vehicle going undetected.
Rest of the paper is organized as follows, section 2
explains System model, Existing system and proposed
system, section III briefs about the Simulation model,
section IV explains the working of the flowchart,
section V describes the CRC cards, section VI gives the pseudo code of the system and section VII concludes
this work.
2. SYSTEM MODEL As there was less number of vehicles and the
amount of air pollution by the automobile emission was
very less, Until 1992 India protected its automobile
industry using license. Many two wheel, three wheel
and four wheel vehicles lacked catalytic converters. Per
vehicle emissions were amongst the highest in the world. The refining of oil and supply of fuel was
owned, regulated and run by the government and the
fuel quality was lax.
In 2005, India adopted emission standard of Bharat
Stage IV for vehicles, which is equivalent to Euro IV
European standards for vehicle emissions.
Kiran Kumar S, Int.J.Computer Technology & Applications,Vol 5 (3),1213-1218
IJCTA | May-June 2014 Available [email protected]
1214
ISSN:2229-6093
Nevertheless, the old pre-2005 vehicles, and even pre-1992 vehicles are still on Indian streets [13].
Bharat stage IV emission standards are emission
standards instituted by Government of India to regulate
the output of air pollutants from internal combustion
engine equipment’s, including motor vehicles. The
standards and the timeline for implementation are set
by the Central Pollution Control Board under the
Ministry of Environment & Forests.
The standards, based on European regulations were
first introduced in 2000. Progressively stringent norms
have been rolled out since then .All new vehicles
manufactured after the implementation of the norms
have to be compliant with the regulations. Since
October 2010, Bharat stage III norms have been
enforced across the country. In 13 major cities, Bharat
stage IV emission norms are in place since April 2010.
The phasing out of 2 stroke engine for two wheelers,
the introduction of electronic controls have been due to
the regulations related to vehicular emissions.
While the norms help in bringing down pollution
levels, it invariably results in increased vehicle cost due
to the improved technology & higher fuel prices.
However, this increase in private cost is offset by
savings in health costs for the public, as there is lesser
amount of disease causing particulate matter and
pollution in the air.
The first emission norms were introduced in India in
1991 for petrol and 1992 for diesel vehicles. These
were followed by making the Catalytic converter
mandatory for petrol vehicles and the introduction of unleaded petrol in the market.
On April 29th 1999 the Supreme Court of India
ruled that all vehicles in India have to meet Euro I or
India 2000 norms by June 1st 1999 and Euro II will be
mandatory in the NCR by April 2000. Car makers were
not prepared for this transition and in a subsequent
judgment the implementation date for Euro II was not
enforced.
In 2002, the Indian government accepted the report
submitted by the Mashelkar committee. The committee
proposed a road map for the roll out of Euro based
emission norms for India. It also recommended a
phased implementation of future norms with the
regulations being implemented in major cities first and
extended to the rest of the country after a few years. Based on the recommendations of the committee, the
National Auto Fuel policy was announced officially in 2003. The roadmaps for implementation of the Bharat
Stage norms were laid out till 2010. The policy also
created guidelines for auto fuels, reduction of pollution
from older vehicles and R&D for air quality data
creation and health administration.
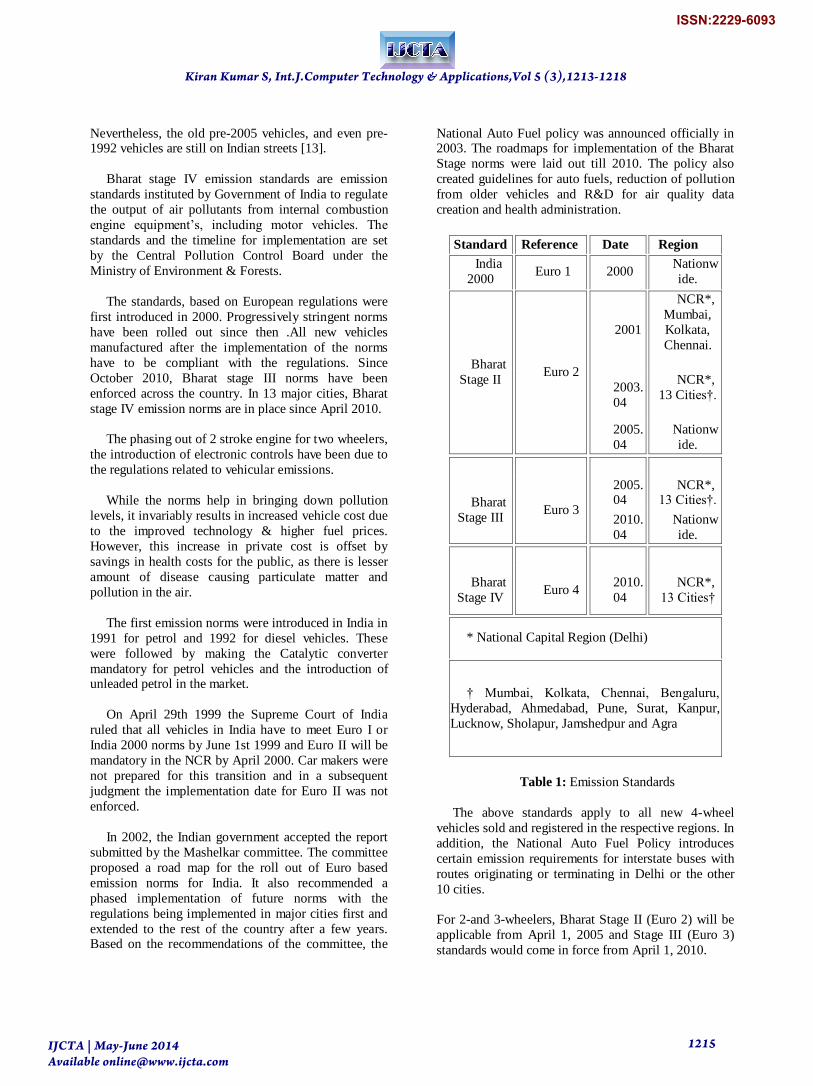
Standard Reference Date Region
India
2000 Euro 1 2000
Nationw
ide.
Bharat
Stage II Euro 2
2001
NCR*,
Mumbai,
Kolkata,
Chennai.
2003.
04
NCR*,
13 Cities†.
2005.
04 Nationw
ide.
Bharat
Stage III Euro 3
2005.04
NCR*,
13 Cities†.
2010.
04 Nationw
ide.
Bharat
Stage IV Euro 4
2010.
04
NCR*,
13 Cities†
* National Capital Region (Delhi)
† Mumbai, Kolkata, Chennai, Bengaluru,
Hyderabad, Ahmedabad, Pune, Surat, Kanpur,
Lucknow, Sholapur, Jamshedpur and Agra
Table 1: Emission Standards
The above standards apply to all new 4-wheel
vehicles sold and registered in the respective regions. In
addition, the National Auto Fuel Policy introduces
certain emission requirements for interstate buses with
routes originating or terminating in Delhi or the other
10 cities.
For 2-and 3-wheelers, Bharat Stage II (Euro 2) will be
applicable from April 1, 2005 and Stage III (Euro 3)
standards would come in force from April 1, 2010.
Kiran Kumar S, Int.J.Computer Technology & Applications,Vol 5 (3),1213-1218
IJCTA | May-June 2014 Available [email protected]
1215
ISSN:2229-6093
2.1. EXISTING SYSTEM
Currently we have Emission Testing Centers to check
out the Quality of Emission from an Automobile. This
emission test centers will be affiliated to the transport
Department of the local/central government. They test
the Vehicles/Automobiles in the Test result: Idling.
This emission testing centers would check only for the
CO (carbon monoxide) and HC (hydro chloride)
content from the emission of the automobile.
If in case the Automobile emits more than the
permissible value then a Case would be filed against
the Vehicle. The amount of contents emitted by the
automobile would be recorded in the column Measured
Unit.
These centers mainly work according to the Vehicle
Meets Emission Standards Prescribed by rule 115(2) of
central Motor vehicle Rules 1989.
Accordingly the certificate given by the test centers
would be valid for Six months from the date of test.
This certificate would also include Photo of the vehicle
in which the Number plate details would be present. It
would also contain some more details of the vehicle
like Vehicle Number, Month and year of
manufacturing, Odometer/Speedometer reading, Type
of the Fuel etc.
The Main Disadvantages that are Associated with
Emission Testing Centers are
a) These centers are Static.
b) The Automobile Owner has to Waste his Precious
time in taking the Vehicle personally to the test
centers.
c) There is a check on limited contents of the
pollution.
d) The Actions taken are not quite effective.
e) There is no Continuous check on the condition of
the Testing Centers.
f) Test centers are limited.
g) These test centers are not efficient and they do not
match the current generation.
2.2. PROPOSED SYSTEM MODEL The proposed system would dynamically and
continuously monitor the emission from an automobile.
The sensors are placed or fixed to the automobiles near
to the exhaust and these sensors are given a minimum
threshold values. When the emission exceeds the
minimum threshold value the sensor communicates
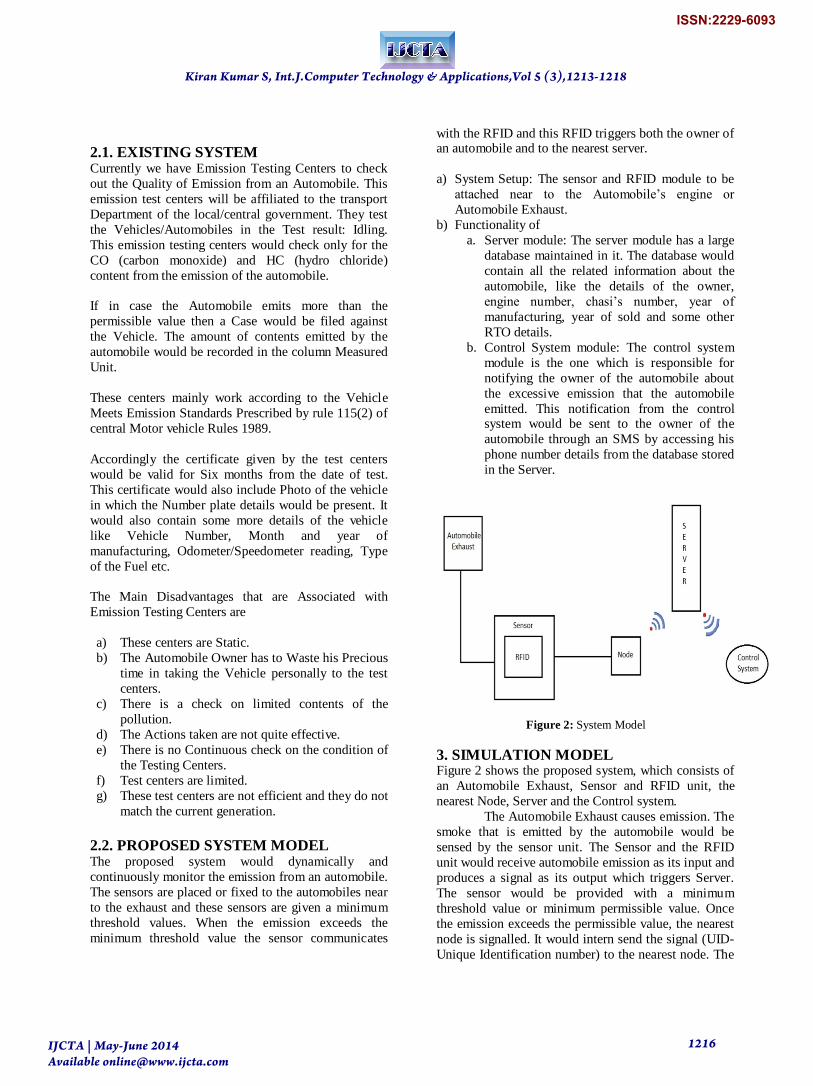
with the RFID and this RFID triggers both the owner of an automobile and to the nearest server.
a) System Setup: The sensor and RFID module to be
attached near to the Automobile’s engine or
Automobile Exhaust.
b) Functionality of
a. Server module: The server module has a large
database maintained in it. The database would
contain all the related information about the
automobile, like the details of the owner,
engine number, chasi’s number, year of
manufacturing, year of sold and some other
RTO details.
b. Control System module: The control system
module is the one which is responsible for
notifying the owner of the automobile about
the excessive emission that the automobile
emitted. This notification from the control system would be sent to the owner of the
automobile through an SMS by accessing his
phone number details from the database stored
in the Server.
Figure 2: System Model
3. SIMULATION MODEL Figure 2 shows the proposed system, which consists of
an Automobile Exhaust, Sensor and RFID unit, the
nearest Node, Server and the Control system.
The Automobile Exhaust causes emission. The
smoke that is emitted by the automobile would be
sensed by the sensor unit. The Sensor and the RFID
unit would receive automobile emission as its input and
produces a signal as its output which triggers Server.
The sensor would be provided with a minimum
threshold value or minimum permissible value. Once
the emission exceeds the permissible value, the nearest
node is signalled. It would intern send the signal (UID-
Unique Identification number) to the nearest node. The
Kiran Kumar S, Int.J.Computer Technology & Applications,Vol 5 (3),1213-1218
IJCTA | May-June 2014 Available [email protected]
1216
ISSN:2229-6093
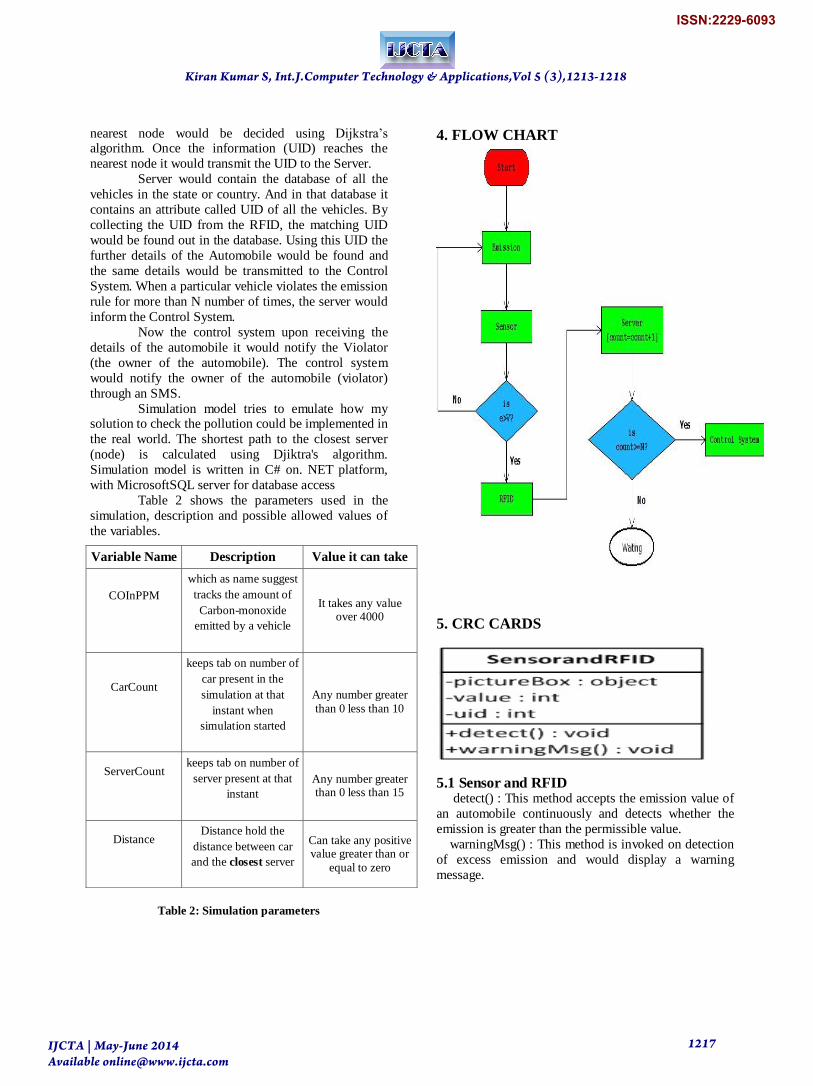
nearest node would be decided using Dijkstra’s algorithm. Once the information (UID) reaches the
nearest node it would transmit the UID to the Server.
Server would contain the database of all the
vehicles in the state or country. And in that database it
contains an attribute called UID of all the vehicles. By
collecting the UID from the RFID, the matching UID
would be found out in the database. Using this UID the
further details of the Automobile would be found and
the same details would be transmitted to the Control
System. When a particular vehicle violates the emission
rule for more than N number of times, the server would
inform the Control System.
Now the control system upon receiving the
details of the automobile it would notify the Violator
(the owner of the automobile). The control system
would notify the owner of the automobile (violator)
through an SMS.
Simulation model tries to emulate how my solution to check the pollution could be implemented in
the real world. The shortest path to the closest server
(node) is calculated using Djiktra's algorithm.
Simulation model is written in C# on. NET platform,
with MicrosoftSQL server for database access
Table 2 shows the parameters used in the
simulation, description and possible allowed values of
the variables.
Table 2: Simulation parameters
4. FLOW CHART
5. CRC CARDS
5.1 Sensor and RFID detect() : This method accepts the emission value of
an automobile continuously and detects whether the
emission is greater than the permissible value.
warningMsg() : This method is invoked on detection
of excess emission and would display a warning
message.
Variable Name Description Value it can take
COInPPM
which as name suggest
tracks the amount of
Carbon-monoxide
emitted by a vehicle
It takes any value over 4000
CarCount
keeps tab on number of
car present in the
simulation at that
instant when
simulation started
Any number greater
than 0 less than 10
ServerCount
keeps tab on number of
server present at that
instant
Any number greater than 0 less than 15
Distance
Distance hold the
distance between car
and the closest server
Can take any positive value greater than or
equal to zero
Kiran Kumar S, Int.J.Computer Technology & Applications,Vol 5 (3),1213-1218
IJCTA | May-June 2014 Available [email protected]
1217
ISSN:2229-6093
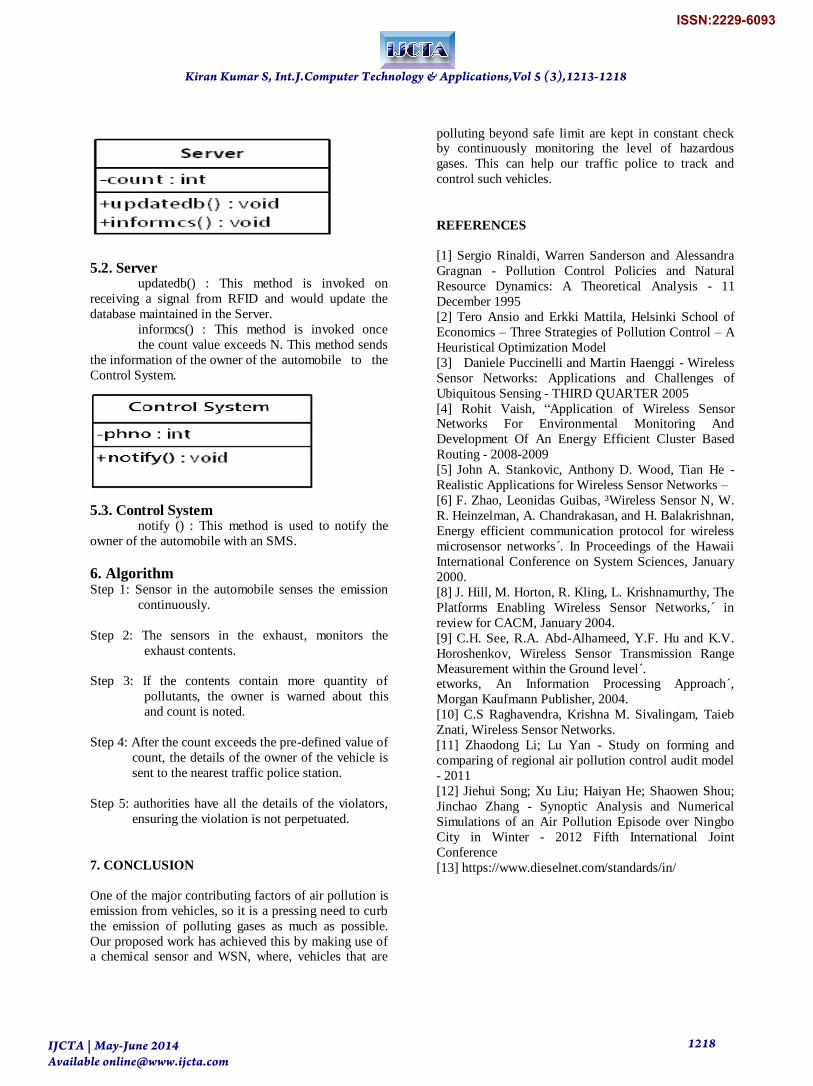
5.2. Server updatedb() : This method is invoked on
receiving a signal from RFID and would update the
database maintained in the Server.
informcs() : This method is invoked once
the count value exceeds N. This method sends
the information of the owner of the automobile to the
Control System.
5.3. Control System
notify () : This method is used to notify the
owner of the automobile with an SMS.
6. Algorithm Step 1: Sensor in the automobile senses the emission
continuously.
Step 2: The sensors in the exhaust, monitors the
exhaust contents.
Step 3: If the contents contain more quantity of
pollutants, the owner is warned about this
and count is noted.
Step 4: After the count exceeds the pre-defined value of
count, the details of the owner of the vehicle is
sent to the nearest traffic police station.
Step 5: authorities have all the details of the violators,
ensuring the violation is not perpetuated.
7. CONCLUSION
One of the major contributing factors of air pollution is
emission from vehicles, so it is a pressing need to curb
the emission of polluting gases as much as possible.
Our proposed work has achieved this by making use of a chemical sensor and WSN, where, vehicles that are
polluting beyond safe limit are kept in constant check by continuously monitoring the level of hazardous
gases. This can help our traffic police to track and
control such vehicles.
REFERENCES
[1] Sergio Rinaldi, Warren Sanderson and Alessandra
Gragnan - Pollution Control Policies and Natural
Resource Dynamics: A Theoretical Analysis - 11
December 1995
[2] Tero Ansio and Erkki Mattila, Helsinki School of
Economics – Three Strategies of Pollution Control – A
Heuristical Optimization Model
[3] Daniele Puccinelli and Martin Haenggi - Wireless
Sensor Networks: Applications and Challenges of
Ubiquitous Sensing - THIRD QUARTER 2005
[4] Rohit Vaish, “Application of Wireless Sensor Networks For Environmental Monitoring And
Development Of An Energy Efficient Cluster Based
Routing - 2008-2009
[5] John A. Stankovic, Anthony D. Wood, Tian He -
Realistic Applications for Wireless Sensor Networks –
[6] F. Zhao, Leonidas Guibas, ³Wireless Sensor N, W.
R. Heinzelman, A. Chandrakasan, and H. Balakrishnan,
Energy efficient communication protocol for wireless
microsensor networks .́ In Proceedings of the Hawaii
International Conference on System Sciences, January
2000.
[8] J. Hill, M. Horton, R. Kling, L. Krishnamurthy, The
Platforms Enabling Wireless Sensor Networks, ́ in
review for CACM, January 2004.
[9] C.H. See, R.A. Abd-Alhameed, Y.F. Hu and K.V.
Horoshenkov, Wireless Sensor Transmission Range
Measurement within the Ground level .́ etworks, An Information Processing Approach´,
Morgan Kaufmann Publisher, 2004.
[10] C.S Raghavendra, Krishna M. Sivalingam, Taieb
Znati, Wireless Sensor Networks.
[11] Zhaodong Li; Lu Yan - Study on forming and
comparing of regional air pollution control audit model
- 2011
[12] Jiehui Song; Xu Liu; Haiyan He; Shaowen Shou;
Jinchao Zhang - Synoptic Analysis and Numerical
Simulations of an Air Pollution Episode over Ningbo
City in Winter - 2012 Fifth International Joint
Conference
[13] https://www.dieselnet.com/standards/in/
Kiran Kumar S, Int.J.Computer Technology & Applications,Vol 5 (3),1213-1218
IJCTA | May-June 2014 Available [email protected]
1218
ISSN:2229-6093
Top Related