


Languages
Pages
Legal


© 2015 IBM Corporation
IT Service Management
Monitoring and Log Management in Hybrid Cloud Environments
Ingo Averdunk, Dipl.-Inform.
November 11, 2015

© 2015 IBM Corporation
Monitoring and Log Management
2
Agenda
Overview Hybrid Service Management
Monitoring
Log Management
Closing
Source: If applicable, describe source origin

© 2015 IBM Corporation
Monitoring and Log Management
3
Agenda
Overview Hybrid Service Management
Monitoring
Log Management
Closing
Source: If applicable, describe source origin

© 2015 IBM Corporation
Monitoring and Log Management
IT Service Management encompasses:
• the methods, tools and processes by which IT departments support and enable their
ecosystem to deliver business services
• the framework by which effectiveness and value of IT services are measured
• support for Agile, DevOps and Waterfall methodologies
• both engineering and operations domains
• both pre-production and production phases/environments
Key ITSM domains and capabilities include, but are not limited to:
• Hosting a catalog of IT services, facilitating and coordinating the efficient request for and
fulfilment of those services
• Managing Business Process Availability & Resiliency through the enabling technology
• IT Service Assurance – including Health/Performance of as well as Identification,
Analysis and Resolution of issues associated with technology-enabled services
• Full life-cycle management of IT assets – be them hardware, software, application or
virtual (e.g. cloud)
What is IT Service Management ?
4
© 2015 IBM Corporation
Monitoring and Log Management
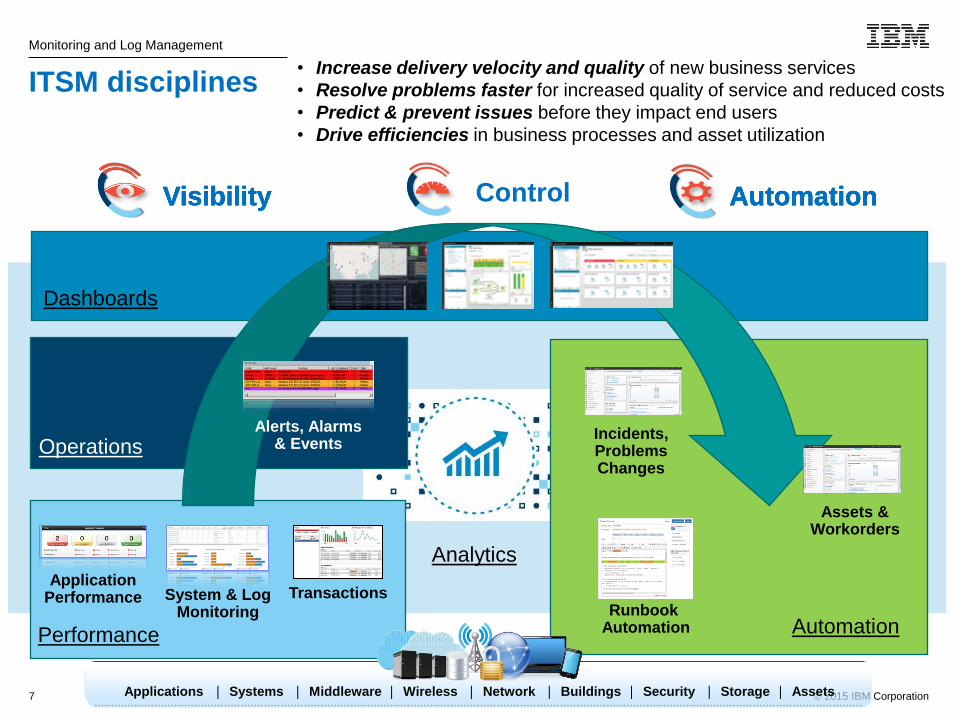
Applications | Systems | Middleware | Wireless | Network | Buildings | Security | Storage | Assets
Performance
Operations
Automation
Dashboards
Visibility Automation Visibility Control Automation Visibility Automation Visibility Automation
Analytics Application
Performance System & Log Monitoring
Transactions
Assets & Workorders
Incidents, Problems Changes
Alerts, Alarms & Events
Runbook Automation
• Increase delivery velocity and quality of new business services
• Resolve problems faster for increased quality of service and reduced costs
• Predict & prevent issues before they impact end users
• Drive efficiencies in business processes and asset utilization
ITSM disciplines
7

© 2015 IBM Corporation
Monitoring and Log Management
Cloud Enabled Back office systems
Cloud First Digital engagement
etc. ERP
HR DB
The era of Cloud requires digital engagement, rapid delivery of client facing applications, and new consumption models with focus on business outcomes and end user experience.
Monitoring and analytics are no long an option but an assumed requirement.
Analytic-driven insights across domains
Infrastructure & Ops Dynamic & Composable
Application Lifecycle
DevOps
Consumable Engage, Deploy, Use Flexible SaaS, On-Prem, Hybrid
Breadth and depth of coverage
The nature & requirements of Applications are evolving…
8

© 2015 IBM Corporation
Monitoring and Log Management
Rapid iterations
Develop Build Test Deploy
Systems of Record Develop Build Test Deploy
Systems of Engagement
Production
Production
Virtualize
Slower iterations
Virtualize
3: Accelerate
2: Integrate 1: Transform
Two-Speed IT is Today’s Reality
9
© 2015 IBM Corporation
Monitoring and Log Management
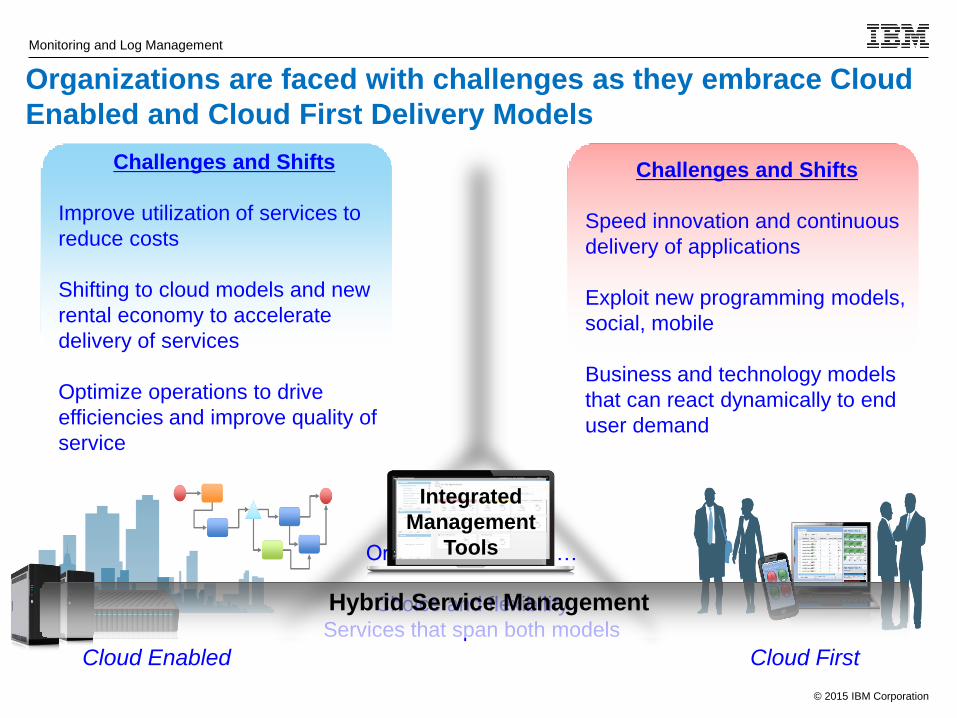
Cloud Enabled Cloud First
Organizations need …
Choice and flexibility
Services that span both models
Organizations are faced with challenges as they embrace Cloud
Enabled and Cloud First Delivery Models
Challenges and Shifts
Improve utilization of services to
reduce costs
Shifting to cloud models and new
rental economy to accelerate
delivery of services
Optimize operations to drive
efficiencies and improve quality of
service
Challenges and Shifts
Speed innovation and continuous
delivery of applications
Exploit new programming models,
social, mobile
Business and technology models
that can react dynamically to end
user demand
Integrated
Management
Tools
Hybrid Service Management

© 2015 IBM Corporation
Monitoring and Log Management
11
Agenda
Overview Hybrid Service Management
Monitoring
Log Management
Closing
Source: If applicable, describe source origin

© 2015 IBM Corporation
Monitoring and Log Management
Performance Management in the new IT Demand Environment
12
A new level of performance requirements for traditional Operations….
Service Delivery
E-commerce 24/7 Business Model
How business is done today with
customers are demanding even
more…
New technology and mobile
applications
Keeping pace with consumer
trends is challenging
Customer Retention
Mean Time To Repair (MTTR)
Financial Impact
Immediate transactions and
execution from any device is
expected.
CIO Line of Business Executive
IT Operations Manager

© 2015 IBM Corporation
Monitoring and Log Management
Who Uses APM & Why do they Care
Manages the infrastructure that runs the applications.
End users
Devices
Web Servers App Servers Databases
Talks to end users, ensuring they have a great experience
and that the application succeeds.
Olivia the Application Owner
Kevin the IT Operations specialist
Writes the code that runs on web and app
servers and delivers value to the end users.
Eric the Application Developer
APM = Application Perfomance Management 13

© 2015 IBM Corporation
Monitoring and Log Management
Application Performance Management Reducing & Preventing Outages and Slowdowns for the 24/7 Application World
IBM Application Performance Management can help
Resolve issues before your business is impacted
Identify
performance
issues
beforehand
Isolate where
the problem is
occurring 1 2 3
End users
Devices Web Servers App Servers Databases
The Network
Applications consist of many parts, understanding issues can be complex
Unified user interface provides a single view across on-premise, public, and private cloud applications. Best in class monitoring coverage: operating systems, middleware, packaged applications, transaction tracking and mainframe systems. Simplified problem resolution with dashboards that identify applications and application components with issues.
Visibility to end user experience of proprietary applications, identifies problems before SLAs are impacted. Quickly isolate bottlenecks affecting application performance by tracking 100% of application transactions through the entire application domain. Navigate from application status to application components to code level details in context using the same UI.
Method level statistics triggered automatically provides visibility and details into source code problems at the exact moment of an issue.
Search and diagnose problems using an integrated search facility which can quickly determine recommended actions to resolve issues.
Integrated Predictive Insights predicts potential outages when metrics exhibit anomalous behavior.
14
© 2015 IBM Corporation
Monitoring and Log Management
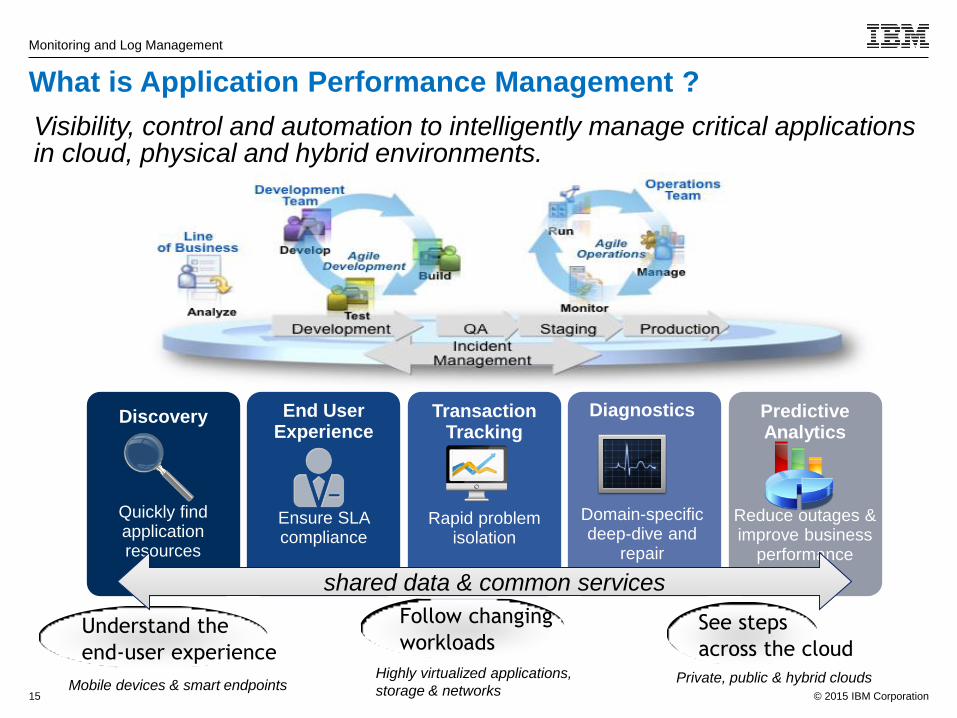
Understand the
end-user experience
Follow changing
workloads
Mobile devices & smart endpoints Private, public & hybrid clouds Highly virtualized applications,
storage & networks
Discovery
Quickly find application resources
End User Experience
Ensure SLA compliance
Transaction Tracking
Rapid problem isolation
Diagnostics
Domain-specific deep-dive and
repair
Predictive Analytics
Reduce outages & improve business
performance
shared data & common services
See steps
across the cloud
Visibility, control and automation to intelligently manage critical applications in cloud, physical and hybrid environments.
What is Application Performance Management ?
15
© 2015 IBM Corporation
Monitoring and Log Management
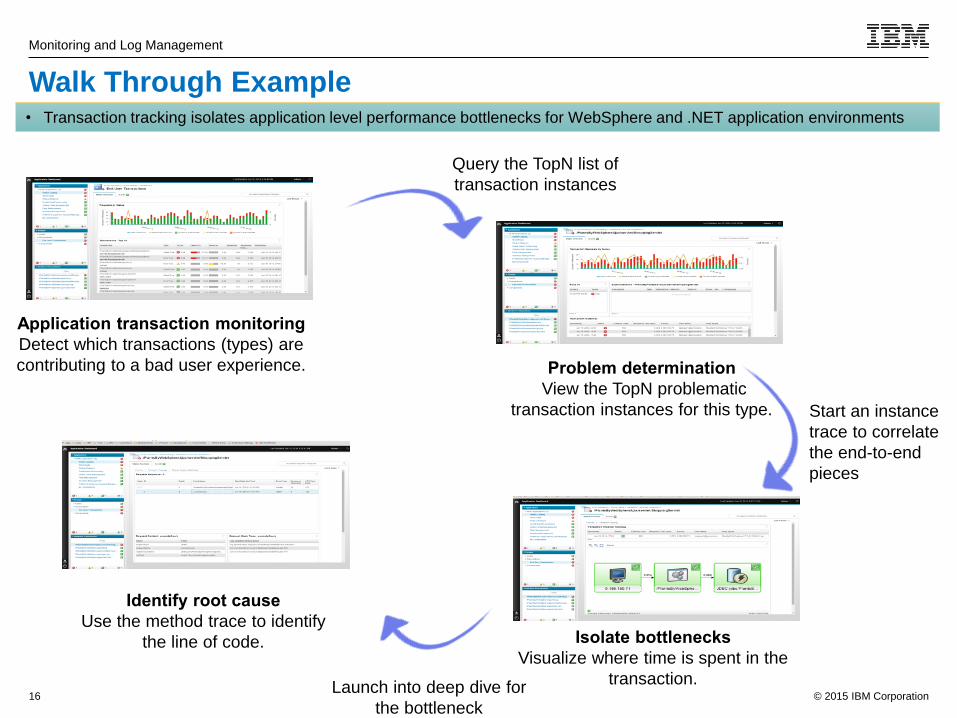
Walk Through Example • Transaction tracking isolates application level performance bottlenecks for WebSphere and .NET application environments
Query the TopN list of
transaction instances
Start an instance
trace to correlate
the end-to-end
pieces
Launch into deep dive for
the bottleneck
Application transaction monitoring
Detect which transactions (types) are
contributing to a bad user experience. Problem determination
View the TopN problematic
transaction instances for this type.
Isolate bottlenecks
Visualize where time is spent in the
transaction.
Identify root cause
Use the method trace to identify
the line of code.
16
© 2015 IBM Corporation
Monitoring and Log Management
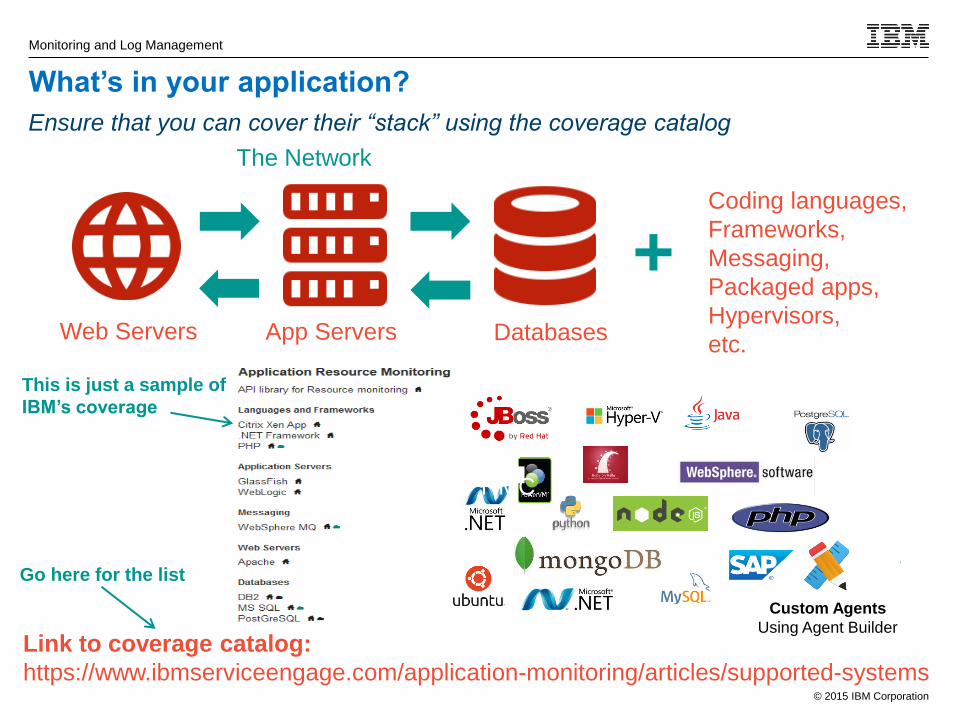
Ensure that you can cover their “stack” using the coverage catalog
Web Servers App Servers Databases
The Network
+ Coding languages,
Frameworks,
Messaging,
Packaged apps,
Hypervisors,
etc.
Link to coverage catalog:
https://www.ibmserviceengage.com/application-monitoring/articles/supported-systems
This is just a sample of
IBM’s coverage
Go here for the list
HMC
Custom Agents
Using Agent Builder
What’s in your application?

© 2015 IBM Corporation
Monitoring and Log Management
Broad Support across the IT Landscape
https://ibm.biz/BdXtZh
18

© 2015 IBM Corporation
Monitoring and Log Management
Monitoring WebSphere Application Server instances
• Node name
• Server status
• Slowest response time
(ms)
• JVM memory usage
• Logs status
• Connection pool status
• Heap usage
© Copyright IBM Corporation 2015 19
© 2015 IBM Corporation
Monitoring and Log Management
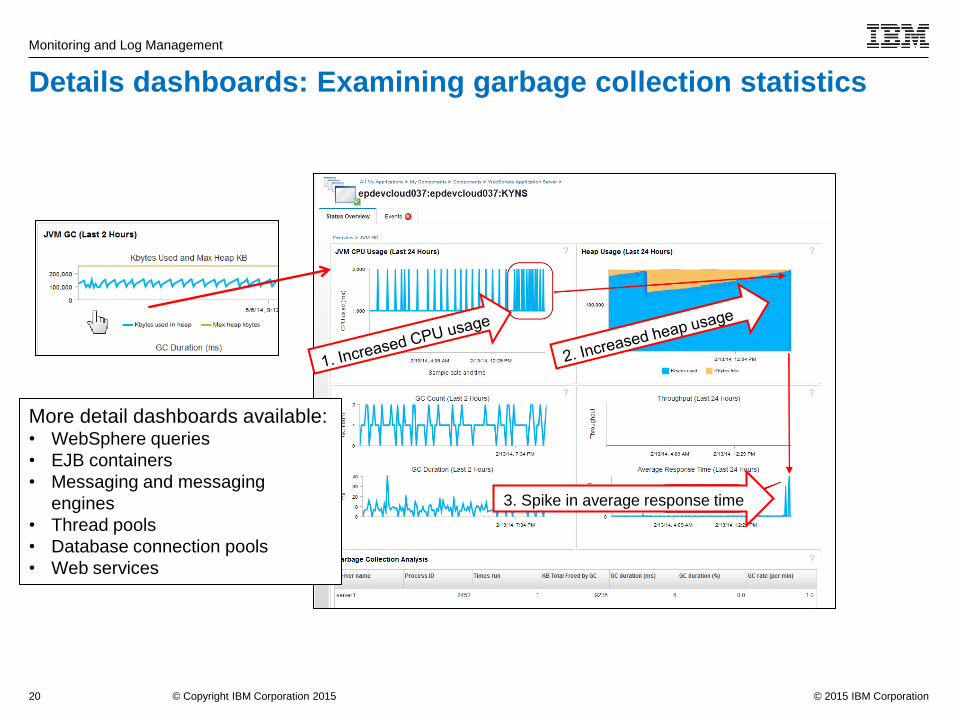
Details dashboards: Examining garbage collection statistics
More detail dashboards available: • WebSphere queries
• EJB containers
• Messaging and messaging
engines
• Thread pools
• Database connection pools
• Web services
© Copyright IBM Corporation 2015
3. Spike in average response time
20

© 2015 IBM Corporation
Monitoring and Log Management
24x7 Global Website Monitoring – Points of Presence
© 2015 IBM Corporation
Monitoring and Log Management
IBM Confidential
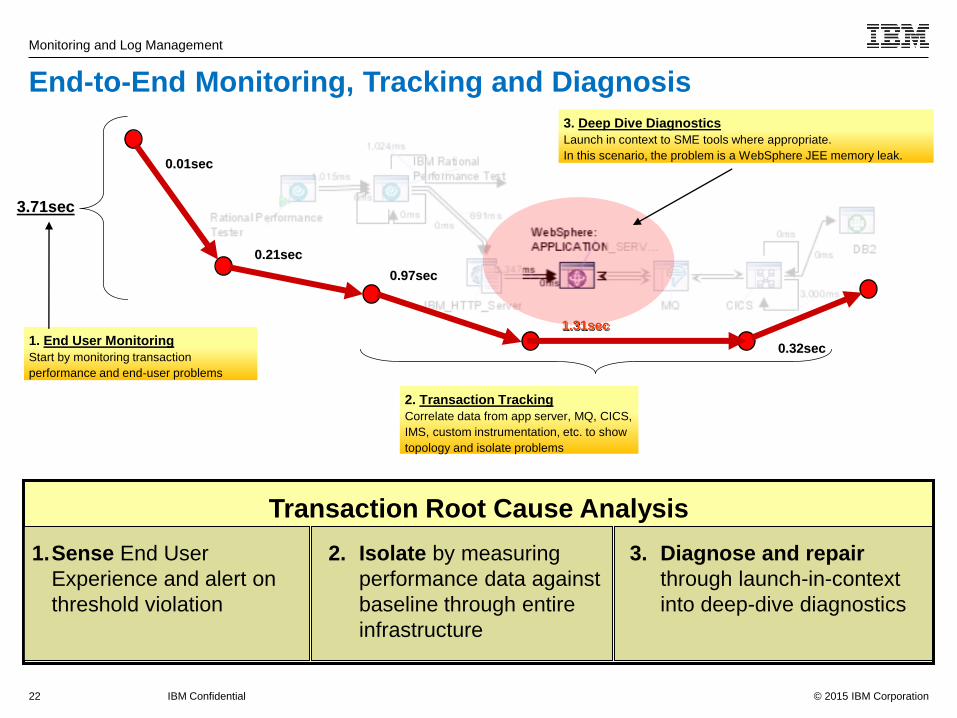
End-to-End Monitoring, Tracking and Diagnosis
22
Transaction Root Cause Analysis
3. Diagnose and repair
through launch-in-context
into deep-dive diagnostics
0.97sec
0.01sec
0.21sec
0.32sec
3.71sec
1. End User Monitoring
Start by monitoring transaction
performance and end-user problems
2. Transaction Tracking
Correlate data from app server, MQ, CICS,
IMS, custom instrumentation, etc. to show
topology and isolate problems
1.Sense End User
Experience and alert on
threshold violation
2. Isolate by measuring
performance data against
baseline through entire
infrastructure
3. Deep Dive Diagnostics
Launch in context to SME tools where appropriate.
In this scenario, the problem is a WebSphere JEE memory leak.
1.31sec 1.31sec
© 2015 IBM Corporation
Monitoring and Log Management
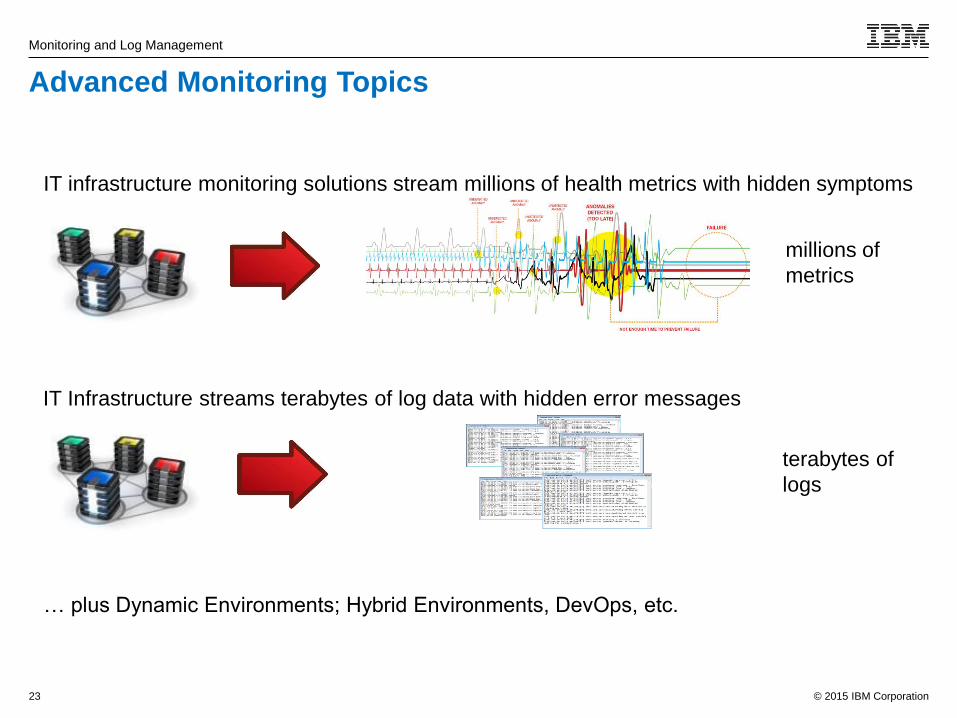
Advanced Monitoring Topics
23
millions of
metrics
terabytes of
logs
IT infrastructure monitoring solutions stream millions of health metrics with hidden symptoms
IT Infrastructure streams terabytes of log data with hidden error messages
… plus Dynamic Environments; Hybrid Environments, DevOps, etc.

© 2015 IBM Corporation
Monitoring and Log Management
Challenge: Reacting to performance thresholds is not enough. IT Staffs must become proactive to ensure mission critical applications never go down.
Anomaly Detection Alerting before potential issues become service impacting,
enabling IT to shift from reactive to proactive
Automated Threshold Maintenance No complex manual intervention to setup & maintain
with 5 times faster processing
On-Prem and SaaS Predictive Insights now available as a Service, providing
additional value to our Performance Management solutions
Supports Heterogeneous Environments Out-of-the-box integrations to IBM APM/ITM or 3rd-party
monitoring solutions
IBM Operations Analytics – Predictive Insights
24

© 2015 IBM Corporation
Monitoring and Log Management
Statistical models can discover mathematical relationships between metrics
The extent this can be achieved depends on a number of factors, such as: range and type of data, availability of
data, and stability of environment. Analytics falls back to a single metric if metrics are unrelated.
Core Banking Application
z/OS
ESB
AIX
Java / WAS
RHEL
Oracle
Windows
Application
Internet Banking
G
I
B
D
C
E
F
H
A
Internet Banking
Multivariate Analytics
25

© 2015 IBM Corporation
Monitoring and Log Management
Granger based analytics learns the mathematical relationship between metrics Web Response Time
WRT Bad
WRT Good
User Requests
Time
Web Response
Time
Anomaly Event Business Impacted
Early Warning
Learns „Web Response Time‟ has a normal causal relationship
with „User Requests‟ - WRT gets slower as user load gets
higher.
If this healthy historical relationship breaks down, say due to a
memory leak, an anomaly is raised immediately
The problem is detected even while WRT service is “good”
Emerging problems cab be detected even while service level are good in absolute term
G
I
B
D
C
E
F
H
A
Internet Banking
Web Response Time
User Requests
Example Scenario: Internet Banking Application
26

© 2015 IBM Corporation
Monitoring and Log Management
Simplify view into the health of the Application Environment
State of the Art Dashboard
Take guesswork out of end user
experience with smart drill downs
Easy to understand dashboards
Quickly renders data
Customizable with a wide variety of
charts and graphs and data sources
Runs on mobile devices
27

© 2015 IBM Corporation
Monitoring and Log Management
Contextual Service Visibility
28
Balanced
Scorecards &
KPIs
Realtime
Event & Root
Cause Views
SLA
Performance
Tracking
Realtime
Service
Dependency
Views
Contextual Views
of Federated
Data/Intelligence
© 2015 IBM Corporation
Monitoring and Log Management
29
Agenda
Overview Hybrid Service Management
Monitoring
Log Management
Closing
Source: If applicable, describe source origin

© 2015 IBM Corporation
Monitoring and Log Management
30

© 2015 IBM Corporation
Monitoring and Log Management
Applications | Systems | Workloads | Wireless | Network | Voice | Security | Mainframe | Storage | Assets
Business Outcome
Capabilities
IBM Big Data Platform
IBM or 3rd Party
Solutions
Operational Environment
Optimize across your IT app infrastructure
Search quickly across massive amounts of data
Faster Problem Resolution
Proactively avoid problems before they occur
Proactive Outage Avoidance Optimized Performance
Rave InfoSphere BigInsights Streams
Operations Analytics
Application
Performance Alerts, Alarms &
Events System & Log
Monitoring
Documentation
Transactions Assets &
Workorders
Apache Solr DB2
Optimize Search Predict
Operational IT Analytics Solution
31

© 2015 IBM Corporation
Monitoring and Log Management
Challenge: To diagnose service problems in applications and the infrastructure supporting them involves analyzing incredible amounts
of data
Logs Metrics Events Documentation
IT Operations
App Support
Service Desk
Search and Visualize
Normalize Consolidate Collect
Insight Packs
Search
32
© 2015 IBM Corporation
Monitoring and Log Management
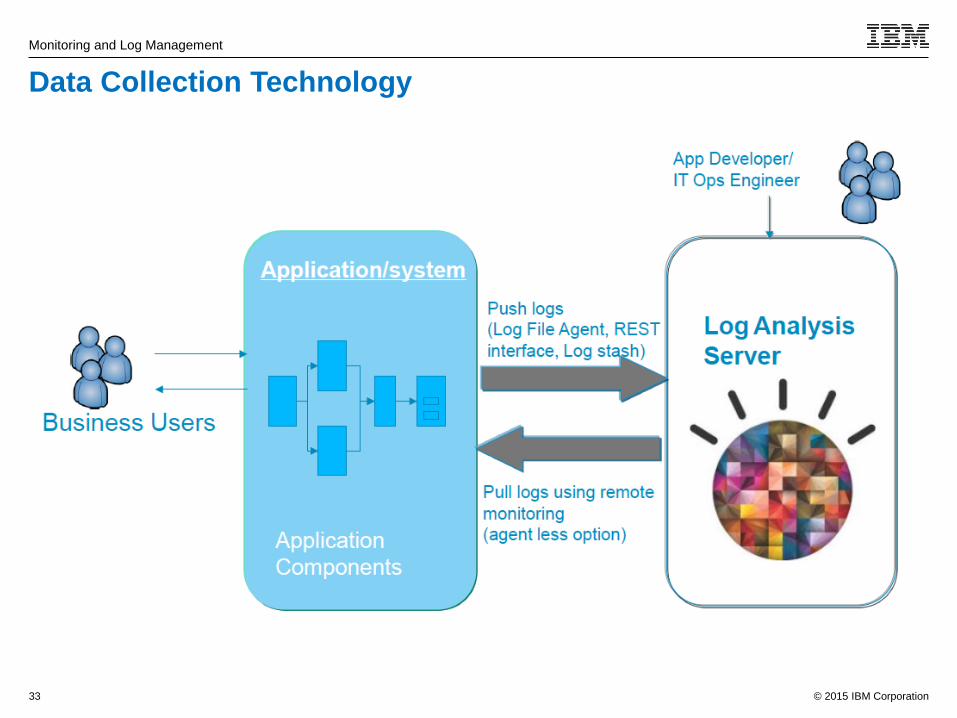
Data Collection Technology
33
© 2015 IBM Corporation
Monitoring and Log Management
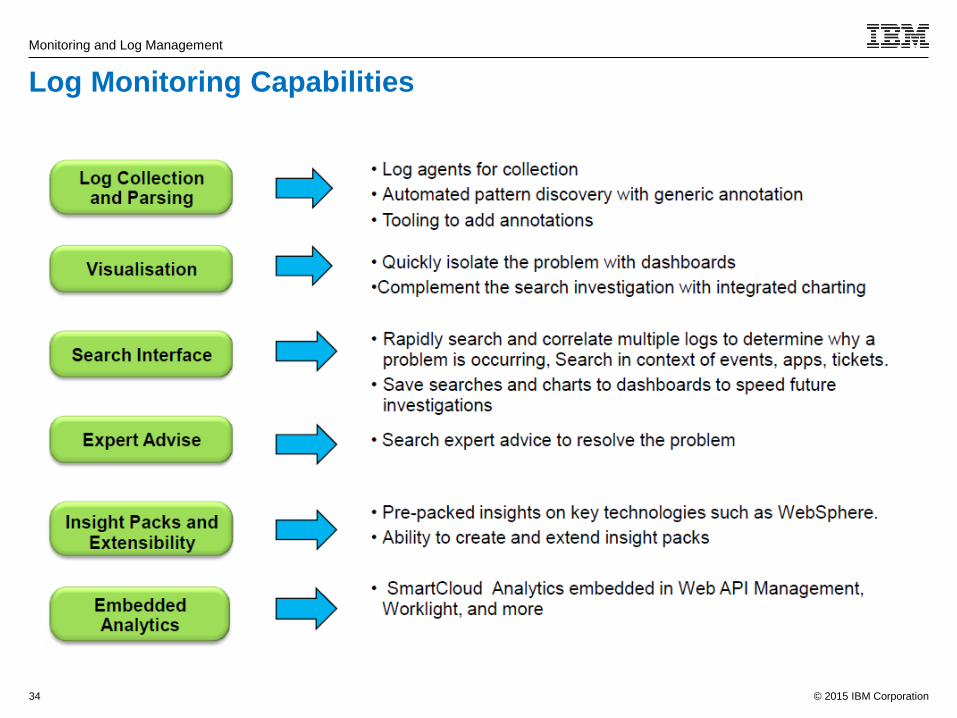
Log Monitoring Capabilities
34

© 2015 IBM Corporation
Monitoring and Log Management
Extraction of Meaning
35
© 2015 IBM Corporation
Monitoring and Log Management
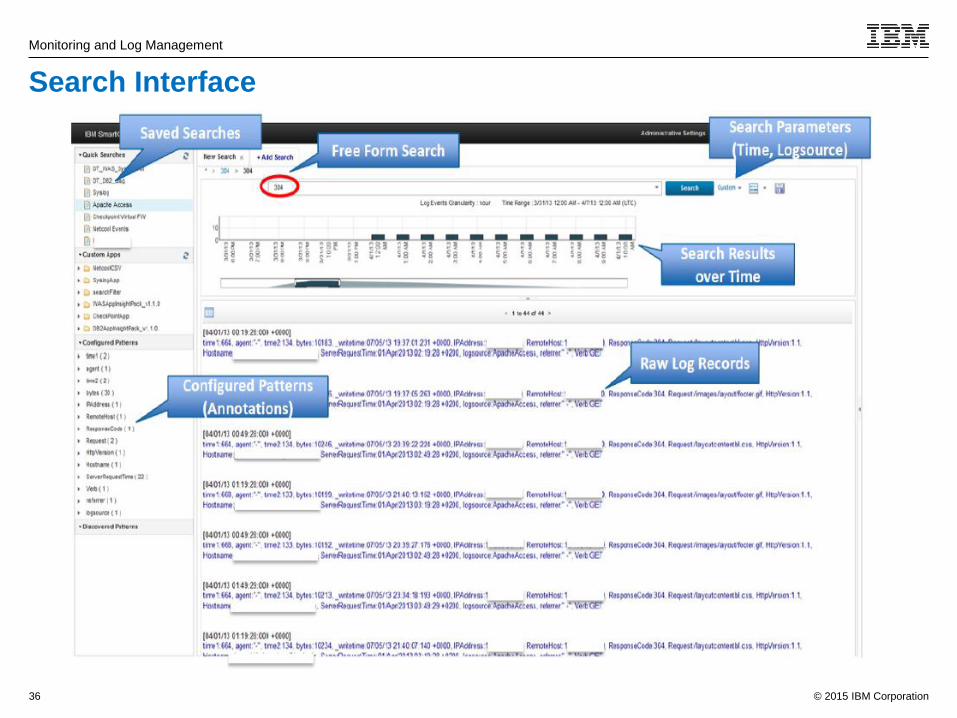
Search Interface
36

© 2015 IBM Corporation
Monitoring and Log Management
Visualization
37

© 2015 IBM Corporation
Monitoring and Log Management
38
Agenda
Overview Hybrid Service Management
Monitoring
Log Management
Closing
Source: If applicable, describe source origin

© 2015 IBM Corporation
Monitoring and Log Management
Summary
Resource Monitoring is „table stakes“, all monitoring aspects need to be considered
– Response time tracking from multiple PoP„s
– Transaction Tracking
– Application Diagnostics
– Logfile Monitoring and Search
Characteristics of the Cloud impose new requirements for Service Management
– Dynamics, Scale
– DevOps Culture
Today„s Service Management needs to bring traditional datacenter („SoR“) and cloud-first
environments („SoE“) together: Hybrid Management
– Composite Applications spanning SoR and SoE
– Service Integration, Multi-vendor
Understand the different users („personas“)
– Operations
– Development
– Service Managers, Account Managers 39
DevOps, EnvOps
© 2015 IBM Corporation
Monitoring and Log Management
Food for thought
With Redundany, Chaos Monkeys, Circuit Breaker, do you still need monitoring ?
With Dynamics of a cloud operating environment, are Configuration Management Databases
(CMDB) / Configuration Management Systems (CMS) still valid ?
Is there a fundamental difference between Metrics, Logfiles, and Events ?
40
Top Related