


Languages
Pages
Legal


Monitoring and evaluation – nets
John Miller
Monitoring and Evaluation
RBM/WHO Malaria
April 18, 2023
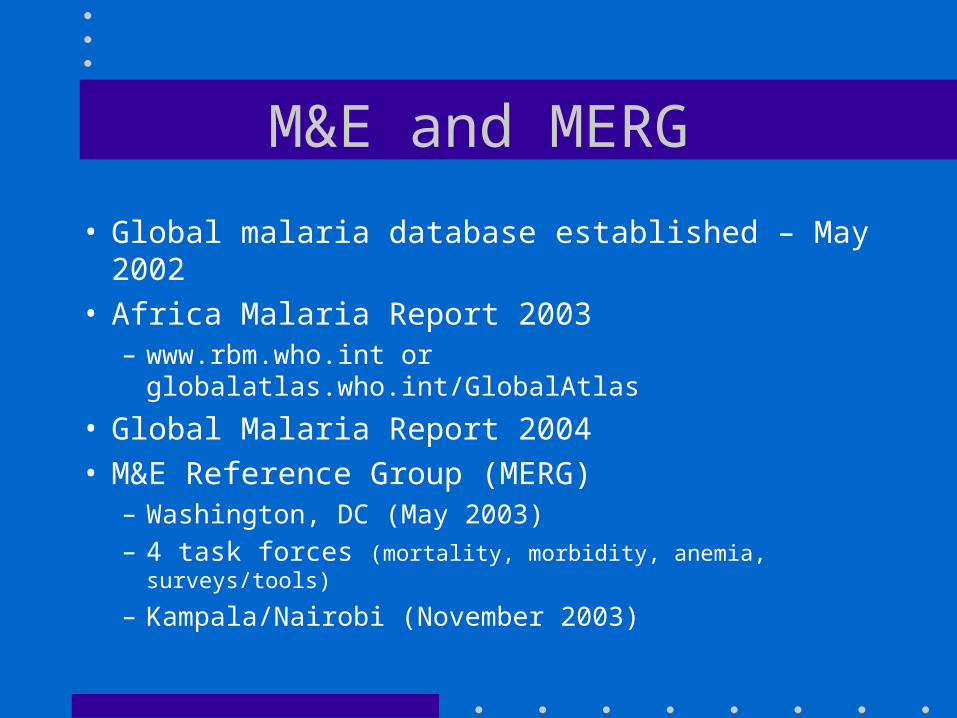
M&E and MERG
• Global malaria database established – May 2002• Africa Malaria Report 2003
– www.rbm.who.int or globalatlas.who.int/GlobalAtlas
• Global Malaria Report 2004• M&E Reference Group (MERG)
– Washington, DC (May 2003)– 4 task forces (mortality, morbidity, anemia, surveys/tools)
– Kampala/Nairobi (November 2003)
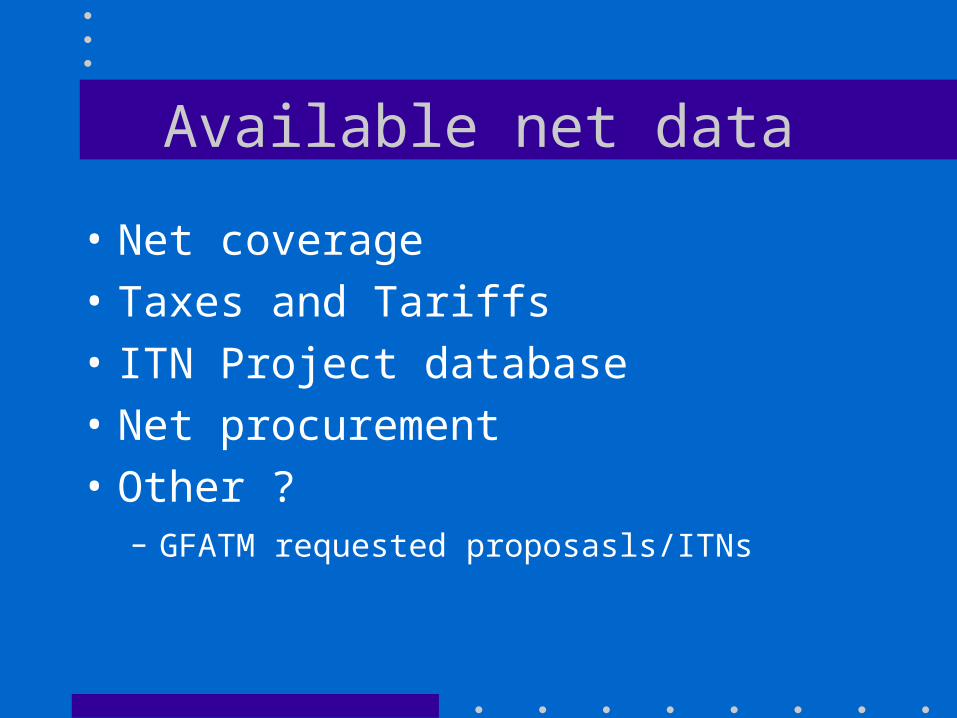
Available net data
• Net coverage
• Taxes and Tariffs
• ITN Project database
• Net procurement
• Other ?– GFATM requested proposasls/ITNs
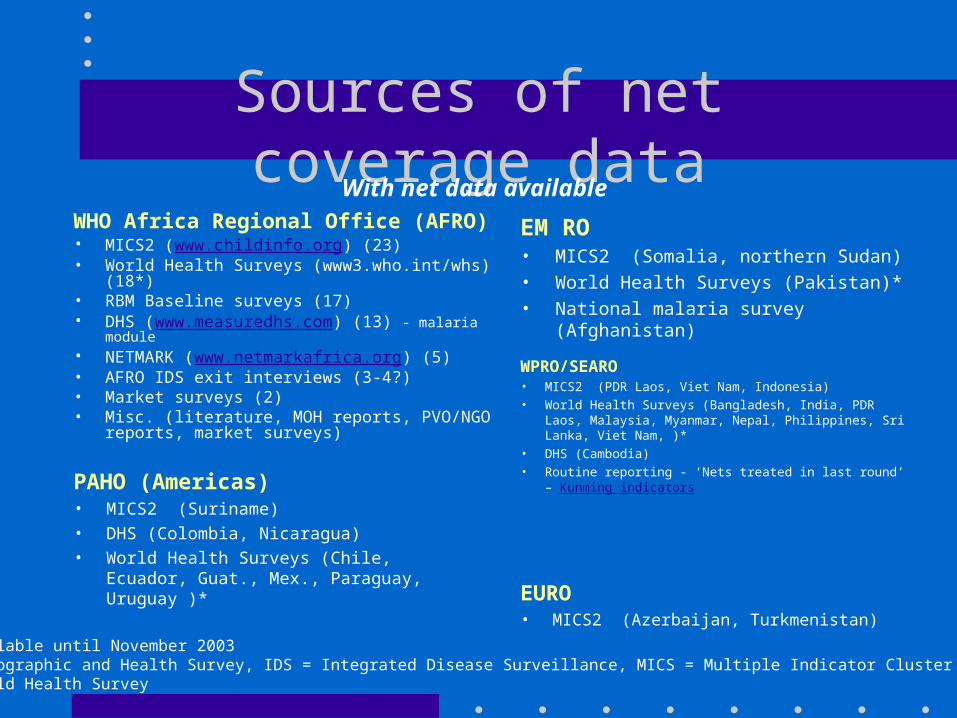
Sources of net coverage data
WHO Africa Regional Office (AFRO)• MICS2 (www.childinfo.org) (23)• World Health Surveys (www3.who.int/whs) (18*)• RBM Baseline surveys (17)• DHS (www.measuredhs.com) (13) - malaria module• NETMARK (www.netmarkafrica.org) (5)• AFRO IDS exit interviews (3-4?)• Market surveys (2)• Misc. (literature, MOH reports, PVO/NGO reports,
market surveys)
EM RO• MICS2 (Somalia, northern Sudan)
• World Health Surveys (Pakistan)*
• National malaria survey (Afghanistan)
With net data available
•not available until November 2003DHS = Demographic and Health Survey, IDS = Integrated Disease Surveillance, MICS = Multiple Indicator Cluster Survey, WHS = World Health Survey
PAHO (Americas)• MICS2 (Suriname)
• DHS (Colombia, Nicaragua)
• World Health Surveys (Chile, Ecuador, Guat., Mex., Paraguay, Uruguay )*
WPRO/SEARO• MICS2 (PDR Laos, Viet Nam, Indonesia) • World Health Surveys (Bangladesh, India, PDR Laos, Malaysia,
Myanmar, Nepal, Philippines, Sri Lanka, Viet Nam, )*• DHS (Cambodia)• Routine reporting - ‘Nets treated in last round’ – Kunming
indicators
EURO• MICS2 (Azerbaijan, Turkmenistan)

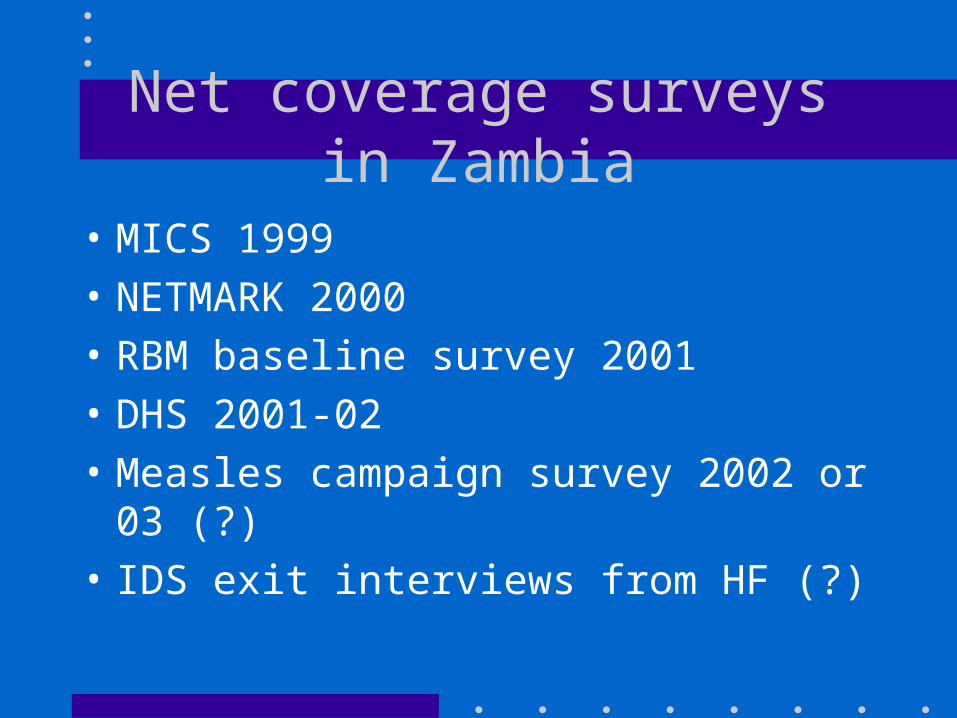
Net coverage surveys in Zambia
• MICS 1999
• NETMARK 2000
• RBM baseline survey 2001
• DHS 2001-02
• Measles campaign survey 2002 or 03 (?)
• IDS exit interviews from HF (?)
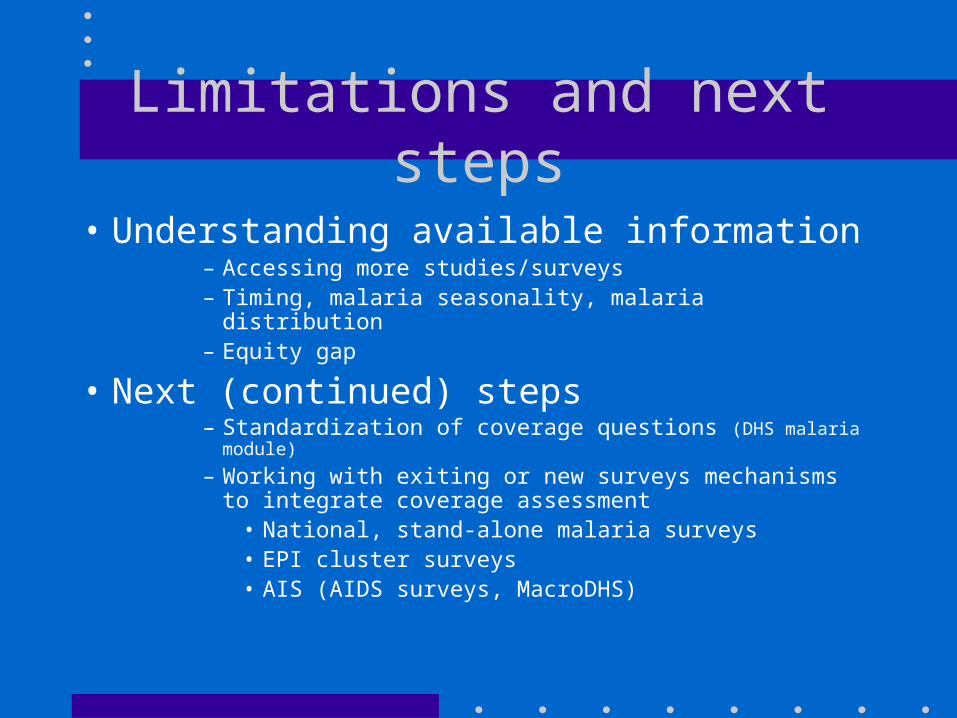
Limitations and next steps
• Understanding available information– Accessing more studies/surveys– Timing, malaria seasonality, malaria distribution– Equity gap
• Next (continued) steps– Standardization of coverage questions (DHS malaria module)
– Working with exiting or new surveys mechanisms to integrate coverage assessment
• National, stand-alone malaria surveys• EPI cluster surveys• AIS (AIDS surveys, MacroDHS)
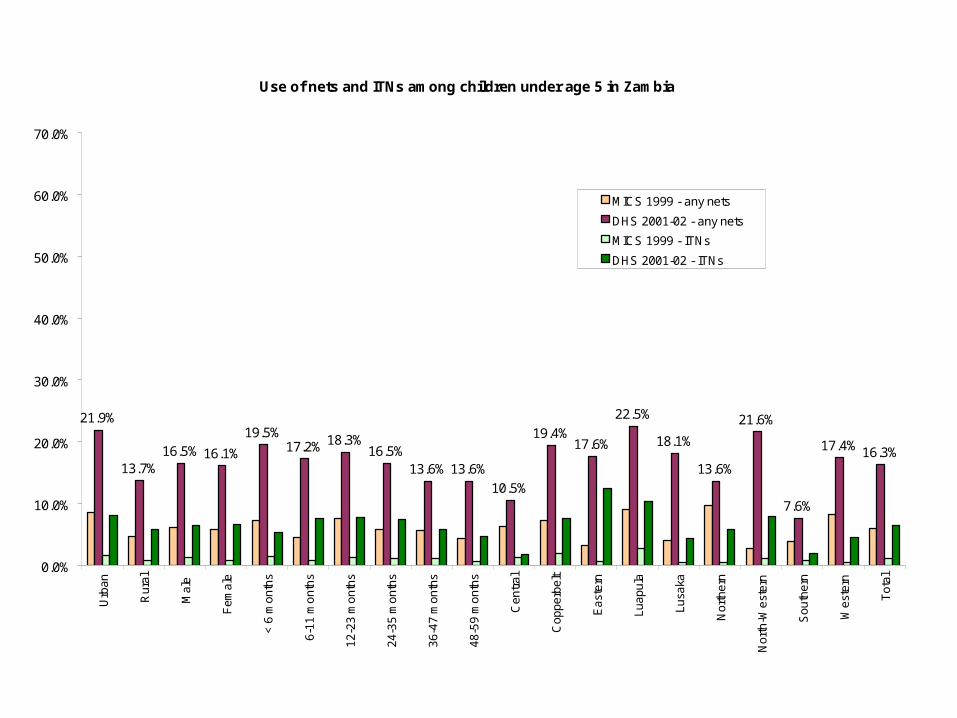
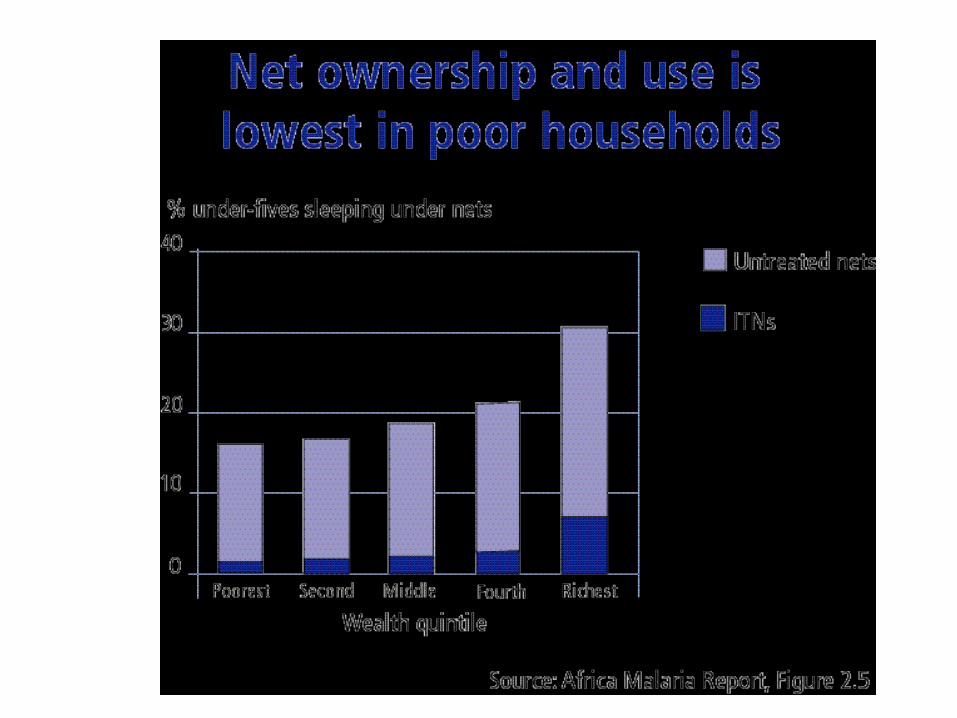
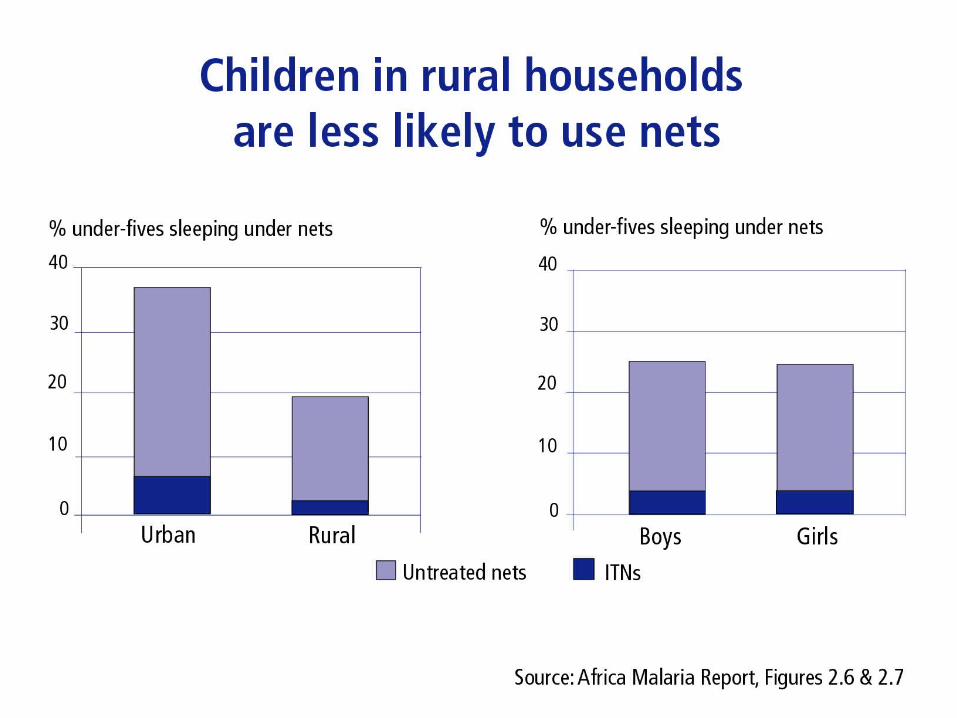
Use of nets and ITNs among children under age 5 in Zambia
21.9%
13.7%16.5% 16.1%
19.5%17.2% 18.3%
16.5%13.6% 13.6%
10.5%
19.4%17.6%
22.5%
18.1%
13.6%
21.6%
7.6%
17.4% 16.3%
0.0%
10.0%
20.0%
30.0%
40.0%
50.0%
60.0%
70.0%
Urb
an
Ru
ral
Ma
le
Fe
ma
le
< 6
mo
nth
s
6-1
1 m
on
ths
12
-23
mo
nth
s
24
-35
mo
nth
s
36
-47
mo
nth
s
48
-59
mo
nth
s
Ce
ntr
al
Co
pp
erb
elt
Ea
ste
rn
Lu
ap
ula
Lu
saka
No
rth
ern
No
rth
-We
ste
rn
So
uth
ern
We
ste
rn
To
tal
MICS 1999 - any nets
DHS 2001-02 - any nets
MICS 1999 - ITNs
DHS 2001-02 - ITNs
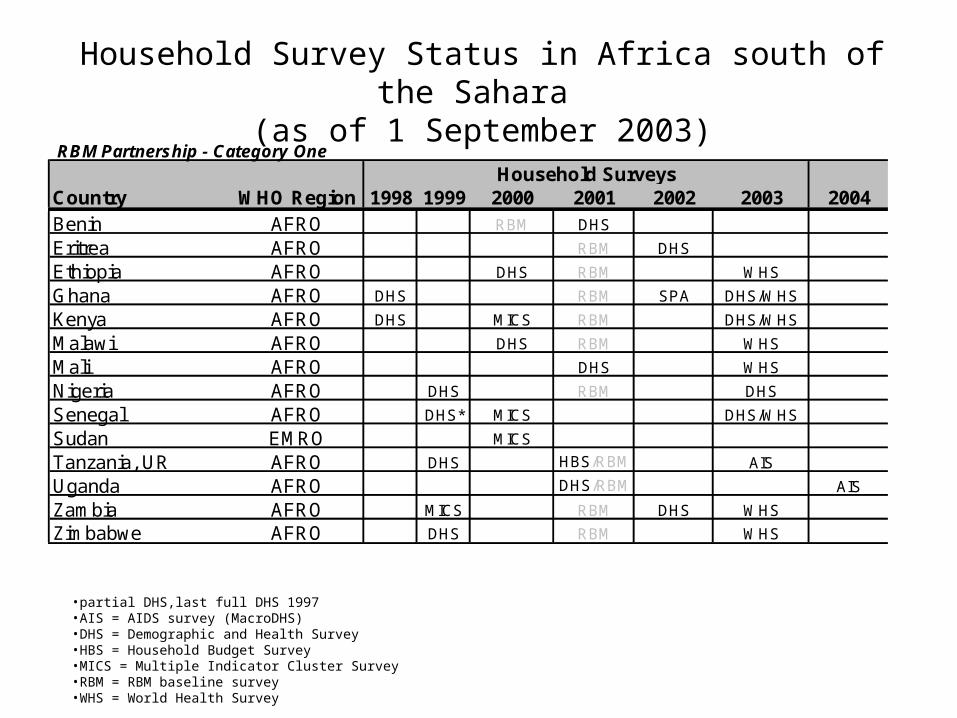
RBM Partnership - Category One
Country WHO Region 1998 1999 2000 2001 2002 2003 2004Benin AFRO RBM DHS
Eritrea AFRO RBM DHS
Ethiopia AFRO DHS RBM WHS
Ghana AFRO DHS RBM SPA DHS/WHS
Kenya AFRO DHS MICS RBM DHS/WHS
Malawi AFRO DHS RBM WHS
Mali AFRO DHS WHS
Nigeria AFRO DHS RBM DHS
Senegal AFRO DHS* MICS DHS/WHS
Sudan EMRO MICS
Tanzania, UR AFRO DHS HBS/RBM AIS
Uganda AFRO DHS/RBM AIS
Zambia AFRO MICS RBM DHS WHS
Zimbabwe AFRO DHS RBM WHS
Household Surveys
Household Survey Status in Africa south of the Sahara (as of 1 September 2003)
•partial DHS,last full DHS 1997•AIS = AIDS survey (MacroDHS)•DHS = Demographic and Health Survey•HBS = Household Budget Survey•MICS = Multiple Indicator Cluster Survey•RBM = RBM baseline survey•WHS = World Health Survey
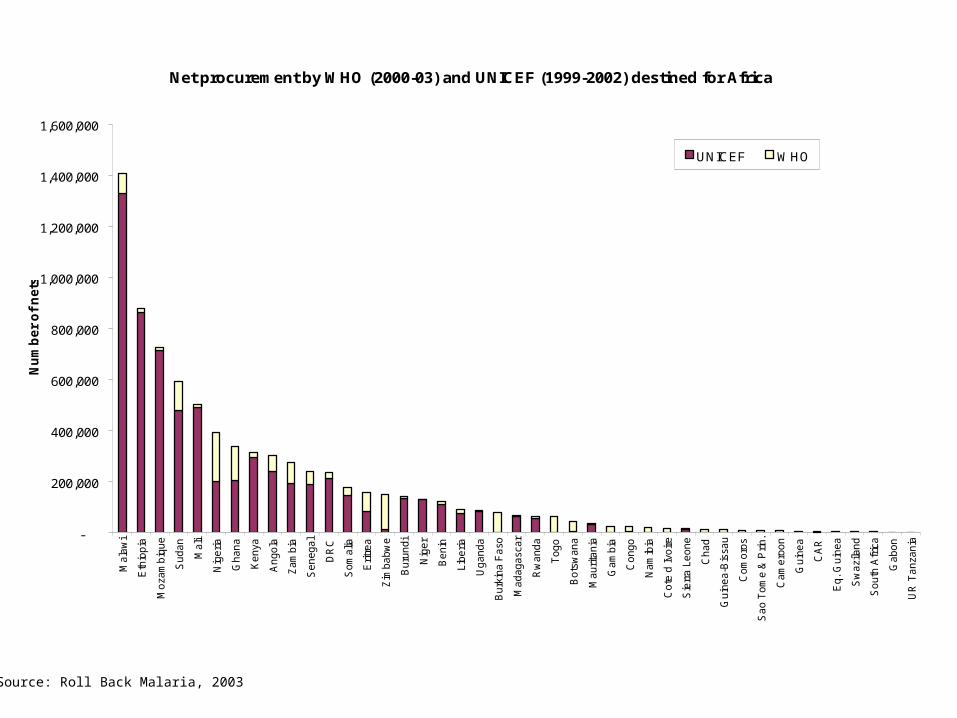
Net procurement by WHO (2000-03) and UNICEF (1999-2002) destined for Africa
-
200,000
400,000
600,000
800,000
1,000,000
1,200,000
1,400,000
1,600,000M
ala
wi
Eth
iopia
Mo
zam
biq
ue
Su
dan
Ma
li
Nig
eria
Ghana
Ke
nya
An
gola
Zam
bia
Se
nega
l
DR
C
So
ma
lia
Eri
trea
Zim
babw
e
Bu
rundi
Nig
er
Be
nin
Lib
eria
Ugand
a
Bu
rkin
a F
aso
Ma
da
gasc
ar
Rw
an
da
Togo
Bo
tsw
ana
Ma
uri
tan
ia
Gam
bia
Congo
Nam
ibia
Cote
d I
voir
e
Sie
rra L
eo
ne
Chad
Guin
ea-B
issa
u
Com
oro
s
Sa
o T
om
e &
Pri
n.
Cam
ero
on
Guin
ea
CA
R
Eq
. G
uin
ea
Sw
azi
lan
d
So
uth
Afr
ica
Gabon
UR
Tan
zan
ia
Nu
mb
er
of
ne
ts
UNICEF WHO
Source: Roll Back Malaria, 2003

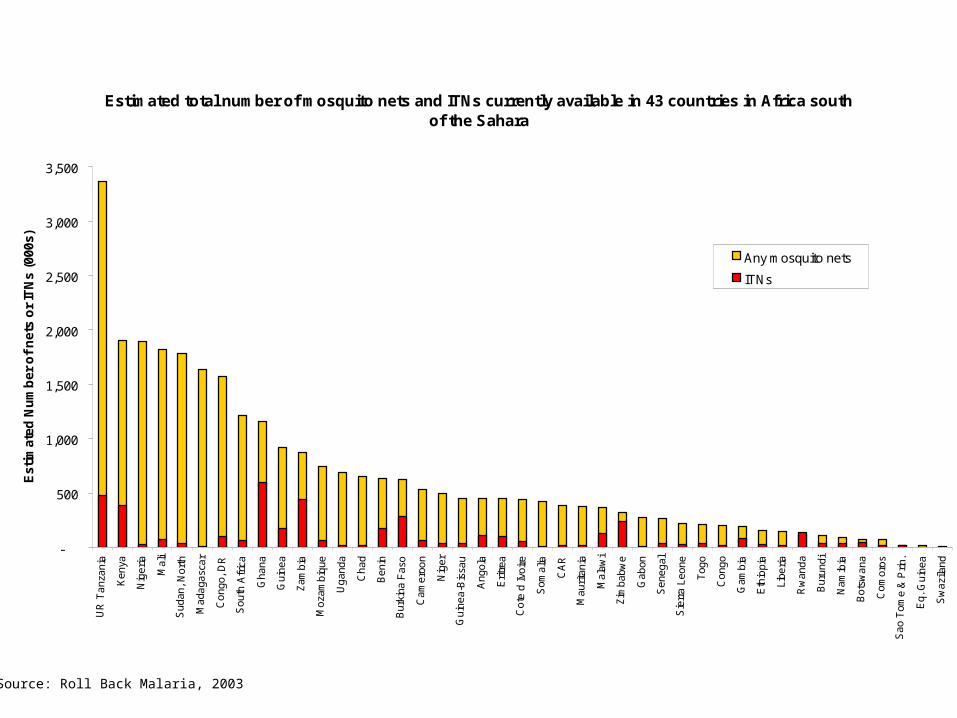
Source: Roll Back Malaria, 2003
Estimated total number of mosquito nets and ITNs currently available in 43 countries in Africa south of the Sahara
-
500
1,000
1,500
2,000
2,500
3,000
3,500
UR
Ta
nza
nia
Ken
ya
Nig
eria
Mal
i
Sud
an, N
ort
h
Mad
aga
scar
Co
ngo,
DR
Sou
th A
fric
a
Gha
na
Gui
nea
Zam
bia
Moz
ambi
que
Ug
anda
Ch
ad
Ben
in
Bur
kina
Fas
o
Ca
me
roo
n
Nig
er
Gui
nea
-Bis
sau
Ang
ola
Erit
rea
Co
te d
Ivo
ire
Som
alia
CA
R
Mau
rita
nia
Mal
awi
Zim
babw
e
Gab
on
Sen
egal
Sie
rra
Leo
ne
Tog
o
Co
ngo
Gam
bia
Eth
iopi
a
Libe
ria
Rw
and
a
Bur
und
i
Na
mib
ia
Bot
swa
na
Co
mo
ros
Sao
Tom
e &
Prin
.
Eq.
Gu
inea
Sw
azila
nd
Est
imat
ed N
um
ber
of
net
s o
r IT
Ns
(000
s)
Any mosquito nets
ITNs
Source: Roll Back Malaria, 2003
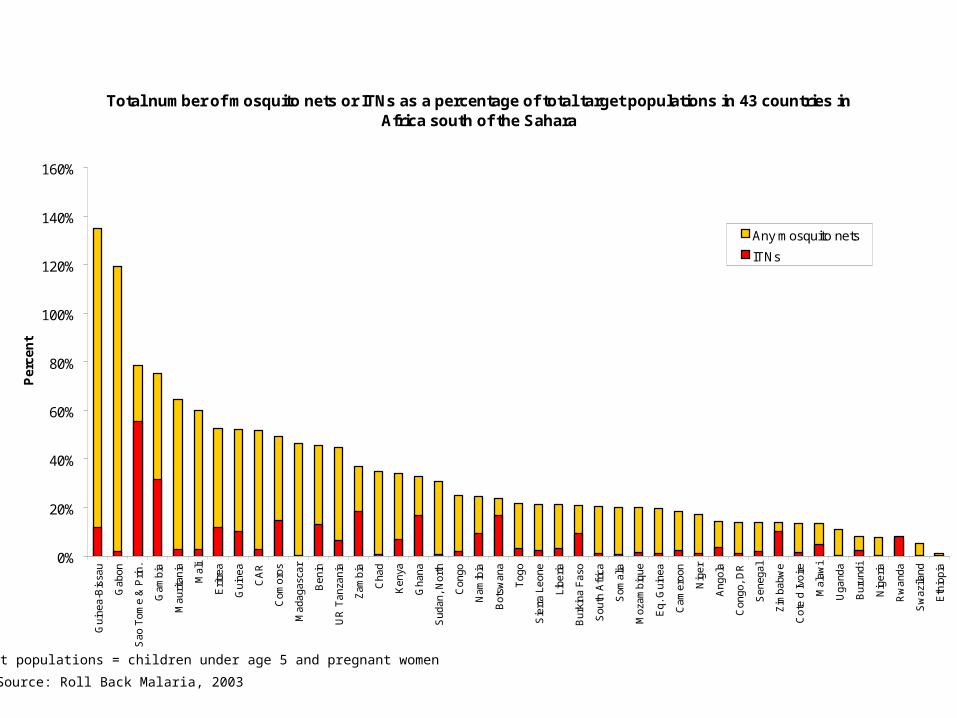
Target populations = children under age 5 and pregnant women
Total number of mosquito nets or ITNs as a percentage of total target populations in 43 countries in Africa south of the Sahara
0%
20%
40%
60%
80%
100%
120%
140%
160%
Gui
nea-
Bis
sau
Gab
on
Sao
Tom
e &
Prin
.
Gam
bia
Mau
ritan
ia
Mal
i
Erit
rea
Gui
nea
CA
R
Com
oros
Mad
agas
car
Ben
in
UR
Tan
zani
a
Zam
bia
Cha
d
Ken
ya
Gha
na
Sud
an,
Nor
th
Con
go
Nam
ibia
Bot
swan
a
Tog
o
Sie
rra
Leon
e
Libe
ria
Bur
kina
Fas
o
Sou
th A
fric
a
Som
alia
Moz
ambi
que
Eq.
Gui
nea
Cam
eroo
n
Nig
er
Ang
ola
Con
go,
DR
Sen
egal
Zim
babw
e
Cot
e d
Ivoi
re
Mal
awi
Uga
nda
Bur
undi
Nig
eria
Rw
anda
Sw
azila
nd
Eth
iopi
a
Per
cen
t
Any mosquito nets
ITNs
Source: Roll Back Malaria, 2003
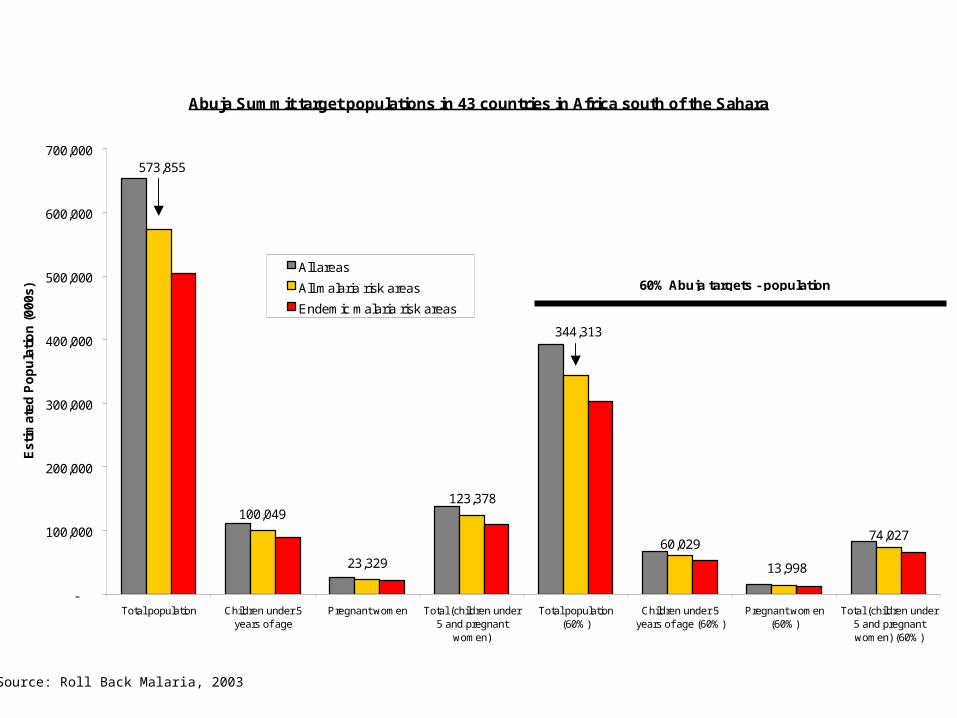
Abuja Summit target populations in 43 countries in Africa south of the Sahara
60,02974,027
100,049
573,855
23,329 13,998
123,378
344,313
-
100,000
200,000
300,000
400,000
500,000
600,000
700,000
Total population Children under 5years of age
Pregnant women Total (children under5 and pregnant
women)
Total population(60%)
Children under 5years of age (60%)
Pregnant women(60%)
Total (children under5 and pregnantwomen) (60%)
Est
imat
ed P
op
ula
tio
n (
000s
)
All areas
All malaria risk areas
Endemic malaria risk areas
60% Abuja targets - population

Source: Roll Back Malaria, 2003
Abuja Summit target populations and currently available nets in households in 43 countries in Africa south of the Sahara
60,02974,027
344,313
13,998
26,341
3,971
-
100,000
200,000
300,000
400,000
500,000
600,000
700,000
Estimated totalmosquito nets
currently available
Estimated total ITNscurrently available
Total population(60%)
Children under 5years of age (60%)
Pregnant women(60%)
Total (children under5 and pregnantwomen) (60%)
Est
imat
ed N
ets
or
Po
pu
lati
on
s (0
00s) All areas
All malaria risk areas
Endemic malaria risk areas
60% Abuja targets - population
0
25
50
75
0 20 40 60 80
% of households possessing net(s)
% o
f chi
ldre
n sl
eepi
ngun
der
net
Benin
GambiaKenya
MalawiMozambique
NigeriaRwanda
Senegal
TanzaniaUganda
ZambiaZimbabwe
Source: Korenromp, Miller et al, 2003
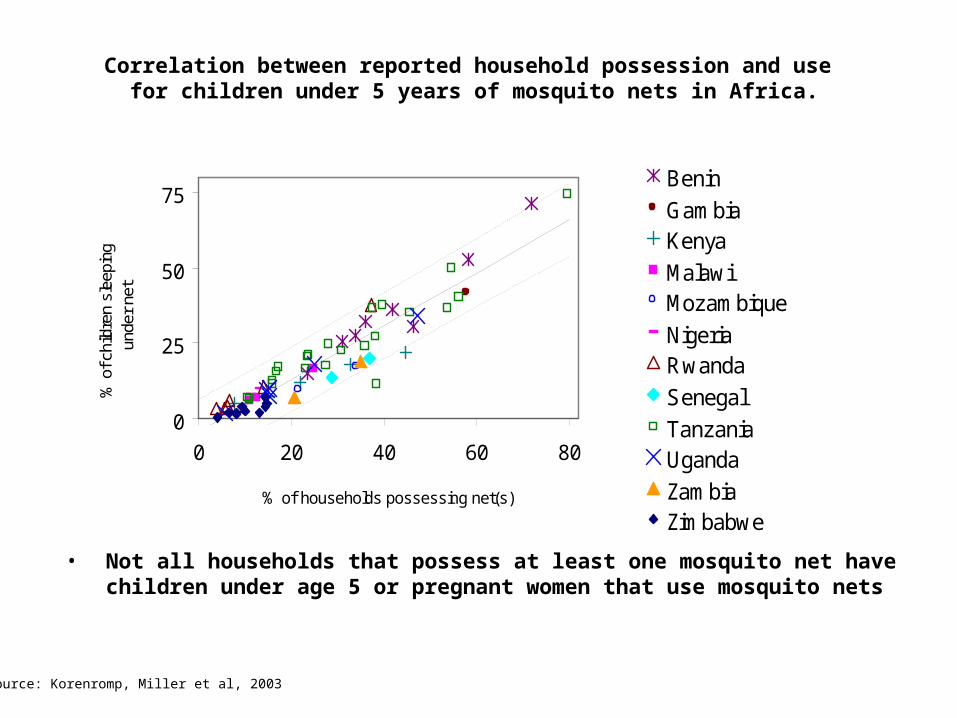
Correlation between reported household possession and use for children under 5 years of mosquito nets in Africa.
• Not all households that possess at least one mosquito net have children under age 5 or pregnant women that use mosquito nets
0
5
10
15
20
25
0 10 20 30
% of households possessing ITN(s)
% o
f chi
ldre
n sl
eepi
ngun
der
ITN
MozambiqueUgandaNigeriaZambia
SenegalKenya
Source: Korenromp, Miller et al, 2003
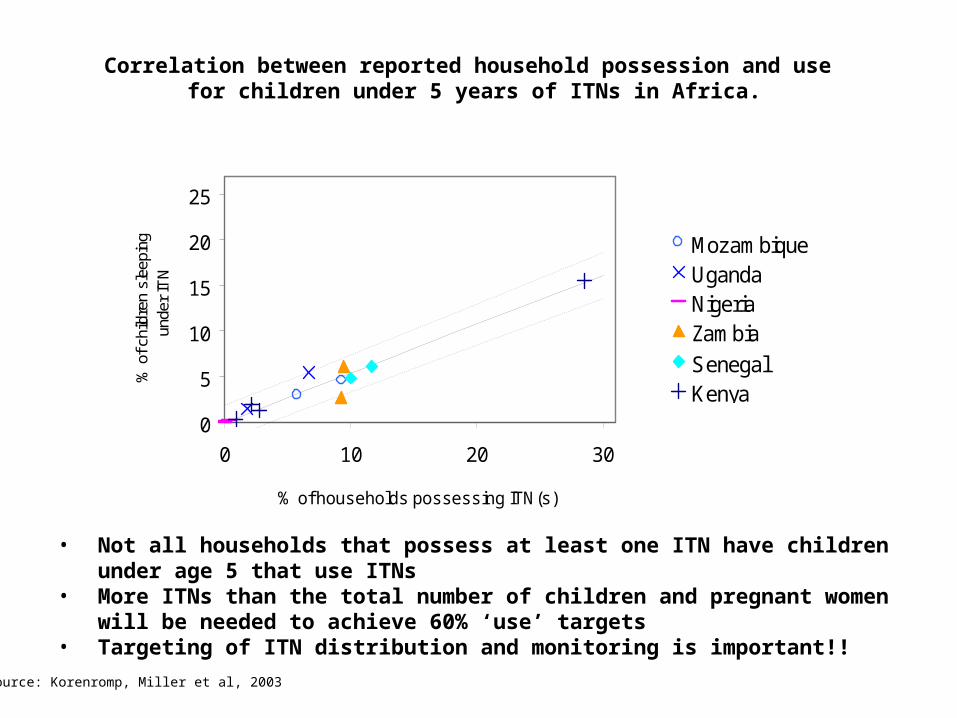
Correlation between reported household possession and use for children under 5 years of ITNs in Africa.
• Not all households that possess at least one ITN have children under age 5 that use ITNs• More ITNs than the total number of children and pregnant women will be needed to
achieve 60% ‘use’ targets • Targeting of ITN distribution and monitoring is important!!
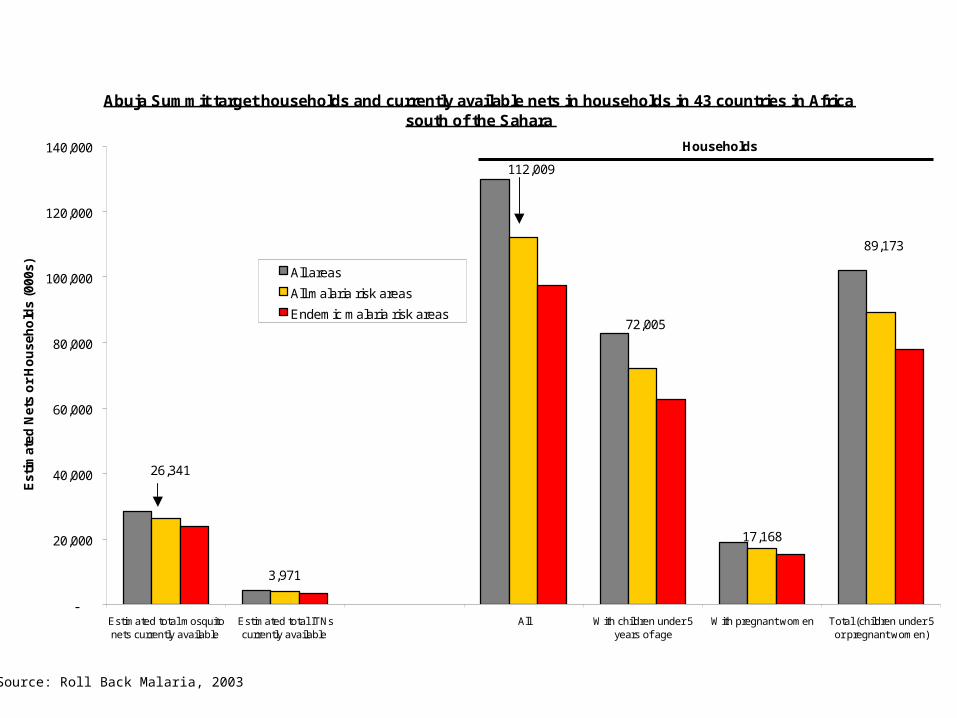
Abuja Summit target households and currently available nets in households in 43 countries in Africa south of the Sahara
17,168
3,971
26,341
89,173
112,009
72,005
-
20,000
40,000
60,000
80,000
100,000
120,000
140,000
Estimated total mosquitonets currently available
Estimated total ITNscurrently available
All With children under 5years of age
With pregnant women Total (children under 5or pregnant women)
Est
imat
ed N
ets
or
Ho
use
ho
lds
(000
s) All areas
All malaria risk areas
Endemic malaria risk areas
Households
Source: Roll Back Malaria, 2003

PSI World Relief Plan International
Canadian Physicians for Aid and Relief
Synod of Livingstonia
ITN Projects in Malawi
Data source: ITN Project database 2002
Map ProductionPublic Health Mapping Group, Communicable Diseases (CDS), World Health Organization© World Health Organization 2003
The boundaries and names shown and the designations used on this map do not imply the expression of an opinion whatsoever on the part of the World Health Organizationconcerning the legal status of any country, territory, city or area or of its authorities, or concerning the delimitation of its frontiers or boundaries.
Top Related