


Languages
Pages
Legal

Modelling of Power Generation from Biomass Resources
by
Nurul Hamizah Binti Rohaizab
Disertation submitted in partial fulfilment of
the requirements for the
Bachelor of Engineering (Hons)
(Chemical Engineering)
SEPTEMBER 2012
Universiti Teknologi PETRONAS
Bandar Seri Iskandar
31750 Tronoh
Perak Darul Ridzuan
brought to you by COREView metadata, citation and similar papers at core.ac.uk
provided by UTPedia
i
CERTIFICATE OF APPROVAL
Modelling of Power Generation from Biomass Resources
by
Nurul Hamizah Binti Rohaizab
A project dissertation submitted to the
Chemical Engineering Programme
Universiti Teknologi PETRONAS
in partial fulfilment of the requirement for the
BACHELOR OF ENGINEERING (Hons)
(CHEMICAL ENGINEERING)
Approved by,
……………………………………………………
(DR MURNI MELATI BINTI AHMAD)
UNIVERSITI TEKNOLOGI PETRONAS
TRONOH, PERAK
SEPTEMBER 2012

ii
CERTIFICATE OF ORIGINALITY
This is to certify that I am responsible for the work submitted in this project, that the
original work is my own except as specified in the references and
acknowledgements, and that the original work contained herein have not been
undertaken or done by unspecified sources or persons.
……………………………………………………
(NURUL HAMIZAH BINTI ROHAIZAB)

iii
ACKNOWLEDGEMENT
First of all, I am grateful to The Almighty God for granting strength and allowing the
completion of this Final Year Project entitles Modelling of Power Generation from
Biomass Resources.
I also wish to express my sincere thanks to Dr. Murni Melati binti Ahmad, Senior
Lecturer under Chemical Engineering Department and also supervisor of my project.
I am extremely grateful and indebted to him for her expect, sincere and valuable
guidance and encouragement extended to me.
Deepest thanks and appreciation to my parents and family for their cooperation and
moral support throughout this project as well as to all my friends for helping and
supporting me.
I also place on record, my sense of gratitude to one and all who, directly and
indirectly, have lent their helping hand to complete this project successfully.
NURUL HAMIZAH ROHAIZAB
iv
ABSTRACT
Electricity demand rises rapidly every year as a result of industrialization and
population growth. Fossil fuel – crude oil, natural gas and coal, and hydro are the
main sources to generate electricity in Malaysia. However, Malaysia’s government in
8th
Malaysia Plan 2001 has encouraged the development of renewable energy as the
fifth fuel in electricity generation. Biomass is seen as one of the potential source of
electricity generation considering that Malaysia has abundant biomass availability
throughout the year. However, until now the utilization of biomass waste to generate
electricity is still very low and not competitive yet with fossil fuel production. These
problems lead to the study of modelling of power generation from biomass resources.
The objective of this study is to determine the optimal feasible route of power
generation from biomass resources. Potential biomass resources and possible
technologies to convert biomass into electricity will be discussed and integrated into
the superstructure model. Then, the linear programming (LP) model for the
superstructure is developed and implemented in MATLAB to obtain the maximum
power generation. The result obtained from the MATLAB shows that the maximum
feasible route of power generation is the route that used pyrolysis process producing
upgraded bio-oil with help of gas turbine to generate electricity. The result also
shows that electricity generated from biomass is able to achieve targeted amount of
energy demand in Malaysia by the year 2015. Therefore, it is concluded that biomass
has the great potential to be source of electricity replacing fossil fuel in the future.
v
TABLE OF CONTENTS
CERTIFICATE OF APPROVAL ............................................................................. i
CERTIFICATE OF ORIGINALITY ....................................................................... ii
ACKNOWLEDGEMENT ........................................................................................ iii
ABSTRACT ............................................................................................................... iv
LIST OF TABLES ................................................................................................... vii
LIST OF FIGURES ................................................................................................. vii
CHAPTER 1: INTRODUCTION ............................................................................. 1
1.1 Background of Study ..................................................................................... 1
1.1.1 Global Energy Outlook .......................................................................... 1
1.1.2 Alternative Source of Energy ................................................................. 2
1.1.3 Scenario in Malaysia .............................................................................. 3
1.1.3.1 Power Generation in Malaysia .................................................................. 3
1.1.3.2 Biomass Potential in Malaysia .................................................................. 5
1.2 Problem Statement ........................................................................................ 9
1.3 Objectives ...................................................................................................... 9
1.4 Scope of Study ............................................................................................. 10
1.5 Relevancy of Project ................................................................................... 10
CHAPTER 2: LITERATURE REVIEW ............................................................... 11
2.1 Technology to Convert Biomass into Electricity ........................................ 11
2.2 Power Generation from Biomass Resources ............................................... 13
2.3 Research Gap ............................................................................................... 13
CHAPTER 3: METHODOLOGY .......................................................................... 14
3.1 Research Work ............................................................................................ 14
3.2 Project Activities ......................................................................................... 16
3.3 Gantt Chart .................................................................................................. 17
vi
CHAPTER 4: RESULT AND DISCUSSION ........................................................ 18
4.1 Superstructure Development ....................................................................... 18
4.2 Process Model Formulation ......................................................................... 20
4.2.1 Mass Balances ...................................................................................... 20
4.4.2 Gasification .......................................................................................... 20
4.2.3 Pyrolysis ............................................................................................... 21
4.2.4 Anaerobic digestion ............................................................................. 22
4.3 Power Production Model Formulation ........................................................ 23
4.3.1 Gas turbine ........................................................................................... 23
4.3.2 Boiler-Steam Turbine ........................................................................... 25
4.4 Maximization of Power Production Formulation ........................................ 27
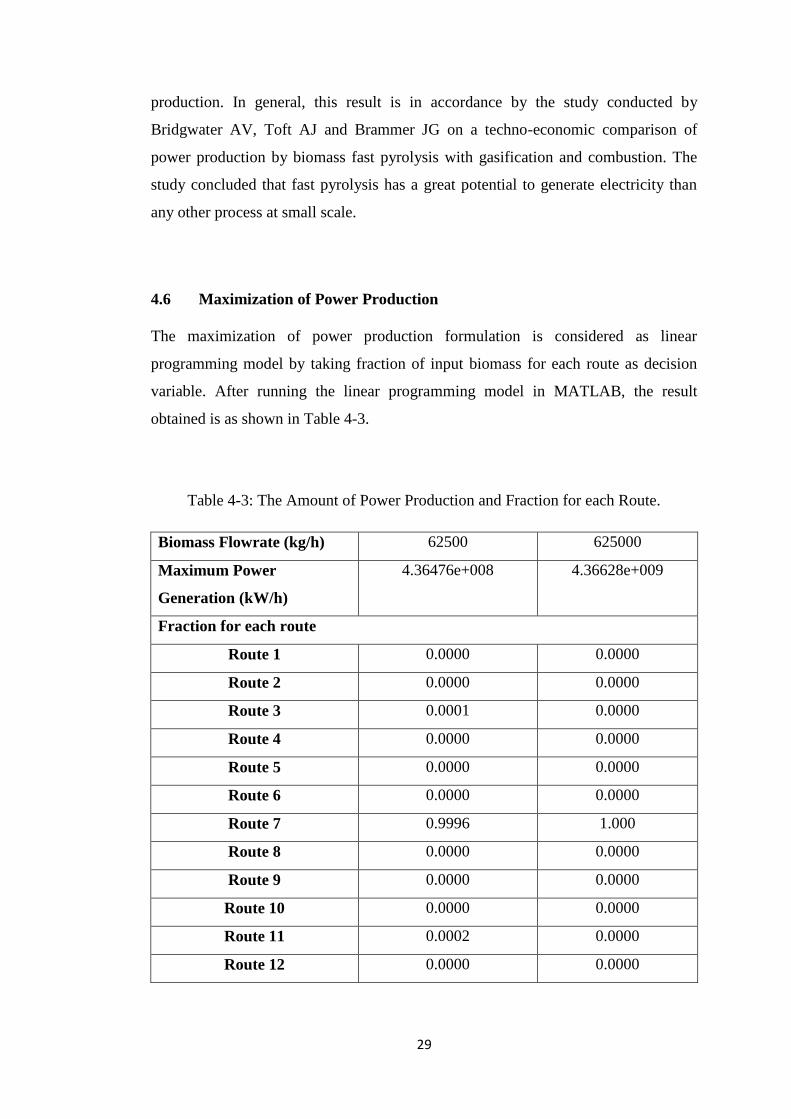
4.5 Power Generation from Biomass Resources ............................................... 28
4.6 Maximization of Power Production ............................................................ 29
CHAPTER 5: CONCLUSION AND RECOMMENDATION ............................ 31
5.1 Conclusion ................................................................................................... 31
5.2 Recommendation ......................................................................................... 32
REFERENCES ......................................................................................................... 33
APPENDICES .......................................................................................................... 39

vii
LIST OF TABLES
Table 1-1: Potential Biomass resources in Malaysia in 1999
Table 1-2: Oil palm biomass collected in Malaysia in 2005 and their energy potential
Table 1-3: Power generation from paddy residue
Table 1-4: Power generation from sugarcane residue
Table 4-1: Overall mass balance calculation
Table 4-2: Main assumption for reference gas turbine and boiler-steam turbine cycle
Calculation
Table 4-3: The Amount of Power Production and Fraction for each Route.
LIST OF FIGURES
Figure 1-1: World energy consumption by fuel from 1990-2035
Figure 1-2: Electricity Generation in Malaysia
Figure 1-3: Biomass Potential in Malaysia
Figure 1-4: Power generation from wood residue
Figure 3-1: Flowchart for Project Activities
Figure 4-1: Superstructure Development on Modelling of Power Generation from
Biomass Resources
Figure 4-2: Mass Balance Flow Sheet on Gasification
Figure 4-3: Mass Balance Flow Sheet on Pyrolysis
Figure 4-4: Mass Balance Flow Sheet on Anaerobic Digestion
Figure 4-5: Graph of Electricity Production versus Biomass Flow Rate
Figure 4-6: Power production Based on Minimum and Maximum Biomass
Availability
1
CHAPTER 1: INTRODUCTION
1.1 Background of Study
1.1.1 Global Energy Outlook
There has been an enormous increase in the demand for energy since the middle of
the last century as a result of industrial development and population growth [1]. By
the year 2035, the global energy demand forecasted to increase by 53% from 505
quadrillion British Thermal Units (Btu) in 2008 to 619 quadrillion Btu in 2020 and
770 quadrillion Btu in 2035, assuming business as usual and no changes in the
current laws and policy governing energy consumption [21]. United State Energy
Information Administration (US EIA) reports that there are four broad sectors that
have high energy demand which are transportation (28%), residential (23%),
commercial (19%) and industrial (31%) [32].
Statistic from British Petroleum (BP) shows that energy consumption today is highly
dependent on fossil fuels [47]. Fossil fuels are hydrocarbon, primarily coal, fuel oil
and natural gas formed from remains of dead plants and animals by exposure to heat
and pressure in the earth’s crust over hundreds of millions of years. Fossil fuels are
of great importance because it can be burned to produce significant amount of energy
per unit weight. World Resource Institute (WRI) [23] also reports that, currently 80%
of global energy consumption comes from fossil fuels and analysis conducted by
International Energy Outlook (IEO) shows that fossil fuels will remain as dominant
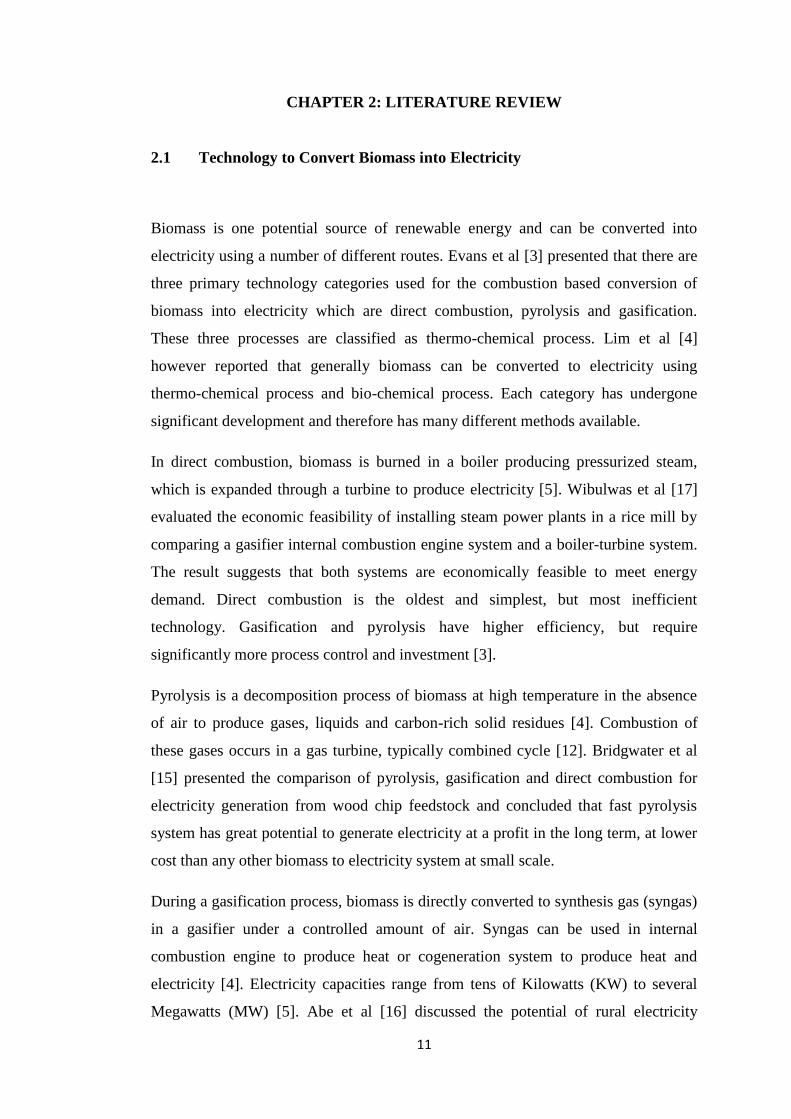
source of energy until the year 2035[21]. Figure 1-1 shows world energy
consumption by fuel from 1990-2035.

2
Figure 1-1: World energy consumption by fuel from 1990-2035 [21]
1.1.2 Alternative Source of Energy
Even though fossil fuel is a good source of energy, heavy reliance on it can cause
negative impacts to the environment as well as industrial. Fossil fuel is a primary
contributor of carbon dioxide emission to the environment reported by US Energy
Administration. Carbon dioxide is a main greenhouse gas (GHG) that is responsible
for climate change and global warming. Besides, fossil fuel is a non-renewable
source of energy which means that it is impossible to recover the supply in a short
period of time. The California Energy Commission estimates that the current known
reserves of fossil fuels like oil will be depleted within 70 years, as of 2002. Apart
from that, the price of fossil fuel is high and in the future there is a possibility of near
future gap between demand and supply of oil. During this time, researchers projected
that the world oil prices will increase rapidly from current values [21].
These concerns have stimulated the development and utilisation of alternative energy
in order to keep the environment clean and to reduce the use of depletable
conventional energy source. Among all renewable energies, biomass has been
considered as a possible source of energy to meet these challenges. Biomass has a
great potential today and in the future, since it is renewable, in contrast to the nature
of the fossil fuels. The energy obtained from biomass does not add “new” carbon
dioxide, major GHG, to the atmosphere due to its near-carbon neutrality [1, 2].
Besides, there is ample availability of biomass in the world makes the sources

3
unlimited and sustainable throughout the years [18]. It is also biodegradable and non-
toxic. It has low emission profiles and thus is environmentally friendly.
1.1.3 Scenario in Malaysia
1.1.3.1 Power Generation in Malaysia
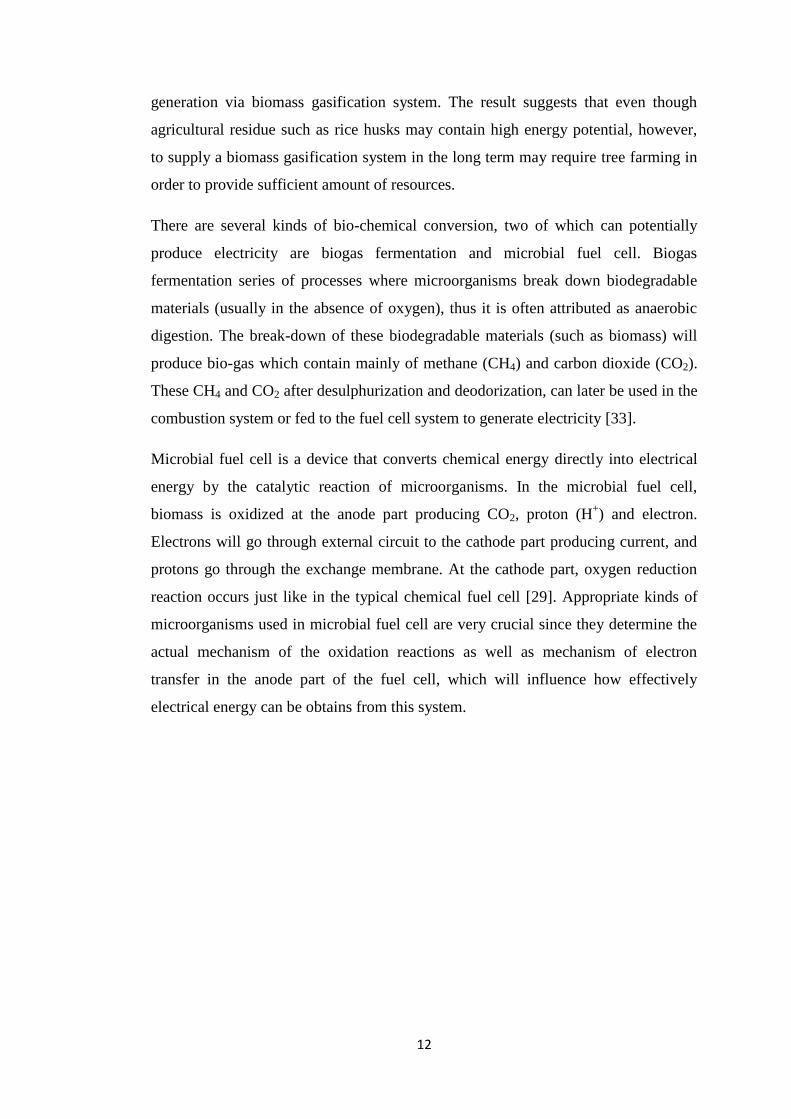
As a developing country, Malaysia’s consumption of energy especially in electricity
rises rapidly every year and projected to grow further at an average annual rate of 4.7
per cent. Figure 1-2 shows the trend of electricity generation in Malaysia. This
consumption growth is mainly driven by industrialisation.
Figure 1-2: Electricity Generation in Malaysia [31]
Recently in 2011, the maximum demand for electricity was 14,000MW in Peninsular
Malaysia, 700MW in Sabah and 900MW in Sarawak [25]. The demand for
electricity in Malaysia has a strong relationship with GDP (Gross Domestic Product)
growth due to the rollout of project under the rolling 5-year Malaysia Plans and the
on-going Economic Transformation Programme (ETP). High GDP means high
economic growth, high production and high energy. Based on year 2000 rate, for
4
every 1 USD increase in GDP, electricity consumption would increase by 13 Wh
[26].
There are a lot of electricity power stations in Malaysia which thermal power plant
based on natural gas, crude oil and coal contributes about 86 percent while
hydropower plants account for 13 percent to the electricity generation capacity [25].
Study by Yusuf [27] reported that, among the biggest gas-fired power stations are the
Sultan Salahuddin Abdul Azis Power Station in Selangor which generates 2420 MW,
Lumut Power station in Perak which generates 1303 MW, Sultan Ismail Power
station in Terengganu which generates 1139 MW and Tuanku Jaafar Power station in
Negeri Sembilan where it generates 1500 MW. One of the oil-fired power stations
that generate electricity is the biggest station, named the Gelugor Power station in
Penang which generates 398 MW. Tenaga Nasional Berhad (TNB) is the largest
electricity utility company in the country with generation capacity of 10,481MW.
Other major utility companies are Sarawak Electricity Supply Company (SESCO)
and Sabah Electricity Limited (SESB).
Based on the awareness of increasing greenhouse gas (GHG) emission to the
environment and some issues on fossil fuel as non-renewable source of energy,
Malaysian’s government under the Third Outline Perspective Plan (OPP3) period
(2001-2010) and 8th
Malaysia Plan (8MP) period (2001-2005) was launched Small
Renewable Energy Power Programme (SREP) in 2001 in order to introduce
renewable energy as the fifth source for electricity generation [51]. Among the
various sources of renewable energy, biomass seems to be the most promising option
for Malaysia [26]. Under SREP Project, a few biomass power plants had been
proposed to be built in Malaysia. Japanese company “Chubu Electric Power”
announced in 2006, plans to build two biomass power plants in Sabah, Bumobipower
Sdn. Bhd proposed to build biomass power plant in Perak and recently in March
2008, TNB signed an agreement with Federal Land Development Authority
(FELDA) and Japan's J-Power to develop a biomass power plant in Jengka, Pahang
[51]. The generation capacity of this plant is 10 MW and would be connected to the
grid [51].
5
By 2015, renewable energy is expected to contribute 1.27 GW to total energy supply
in Malaysia [52]. This is not surprising considering that Malaysia has abundant
biomass availability throughout the year. Research done by Muis [6] shows that
Malaysia has abundant of agriculture residue from rice mills, wood industries, palm
oil mills, bagasse and Palm Oil Mill Effluent (POME) which each of these has the
potential to generate electricity in order to meet energy demand in the future.
Currently, Malaysia produces more than 70 million tonnes of biomass annually and
climatic condition in Malaysia is favourable for the biomass production throughout
the year [48].
1.1.3.2 Biomass Potential in Malaysia
Being a major agricultural commodity producer in the region, Malaysia is well
positioned amongst the ASEAN countries to promote the use of biomass as a
renewable energy source in the national energy mix. The term "biomass" refers to all
organic matter available on a renewable basis, including dedicated energy crops and
trees, agricultural food and feed crops, agricultural crop wastes and residues, wood
wastes and residues, aquatic plants, animal wastes, municipal wastes, and other waste
materials.
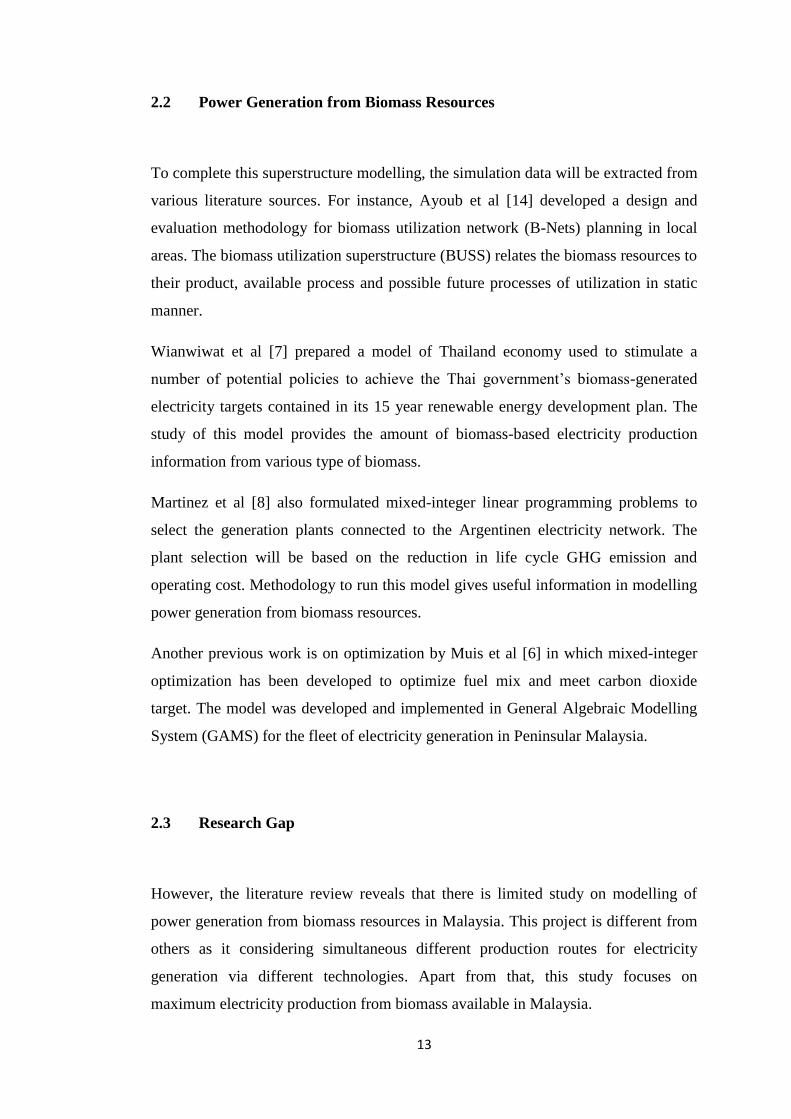
Hassan [48] states that there are five sectors contribute to biomass energy in
Malaysia which is municipal waste (9.5%), sugarcane (0.5%), rice industry (0.7%),
wood industry (3.7%) and oil palm industry (85.5%). Figure 1-3 shows the biomass
potential in Malaysia.

6
Figure 1-3: Biomass Potential in Malaysia [48, 50]
Biomass production from each sectors and its energy potential are summarized in the
Table 1-1 [19].
Table 1-1: Potential Biomass resources in Malaysia in 1999 [19]
Sector
Quantity
(kton/year)
Potential annual
generation
(Gwh)
Potential capacity
(MW)
Rice mills 424 263 30
Wood industries 2177 598 68
Palm oil 17980 3197 365
Bagasse 300 218 25
POME 31500 1587 177
Total 72962 5863 665
Oil palm industry contributes towards the largest biomass production in Malaysia
with 85.5% out of more than 70 million tonnes per year. This is not surprising
considering that 15% of the total land area of Malaysia is covered by this single crop
7
alone. There are 417 palm oil mills in Malaysia, of which 246 are in Peninsular
Malaysia and 117 in Sabah [26]. Sumathi et al (2008) reports that, currently Malaysia
produces about 47% of world’s supply of palm oil which makes Malaysia is the
world’s largest producer and exporter of palm oil. The type of biomass produced
from oil palm industry in Malaysia includes empty fruit bunch (EFB), fiber, shell,
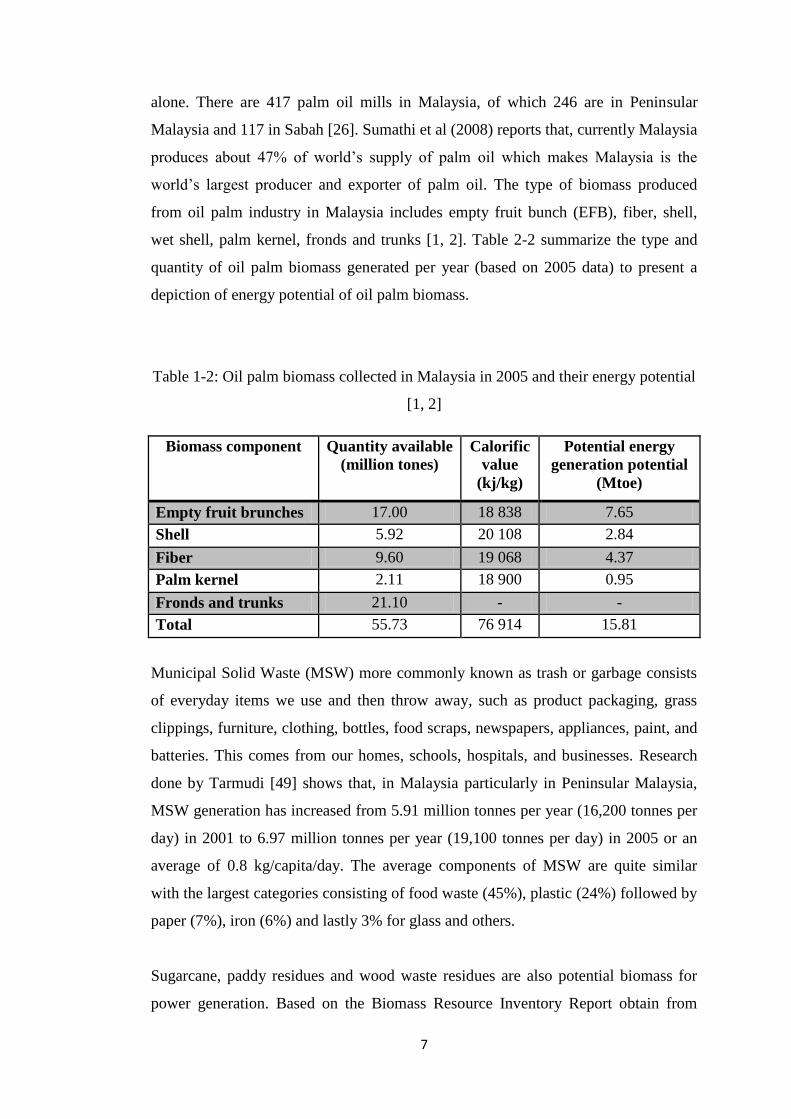
wet shell, palm kernel, fronds and trunks [1, 2]. Table 2-2 summarize the type and
quantity of oil palm biomass generated per year (based on 2005 data) to present a
depiction of energy potential of oil palm biomass.
Table 1-2: Oil palm biomass collected in Malaysia in 2005 and their energy potential
[1, 2]
Biomass component Quantity available
(million tones)
Calorific
value
(kj/kg)
Potential energy
generation potential
(Mtoe)
Empty fruit brunches 17.00 18 838 7.65
Shell 5.92 20 108 2.84
Fiber 9.60 19 068 4.37
Palm kernel 2.11 18 900 0.95
Fronds and trunks 21.10 - -
Total 55.73 76 914 15.81
Municipal Solid Waste (MSW) more commonly known as trash or garbage consists
of everyday items we use and then throw away, such as product packaging, grass
clippings, furniture, clothing, bottles, food scraps, newspapers, appliances, paint, and
batteries. This comes from our homes, schools, hospitals, and businesses. Research
done by Tarmudi [49] shows that, in Malaysia particularly in Peninsular Malaysia,
MSW generation has increased from 5.91 million tonnes per year (16,200 tonnes per
day) in 2001 to 6.97 million tonnes per year (19,100 tonnes per day) in 2005 or an
average of 0.8 kg/capita/day. The average components of MSW are quite similar
with the largest categories consisting of food waste (45%), plastic (24%) followed by
paper (7%), iron (6%) and lastly 3% for glass and others.
Sugarcane, paddy residues and wood waste residues are also potential biomass for
power generation. Based on the Biomass Resource Inventory Report obtain from
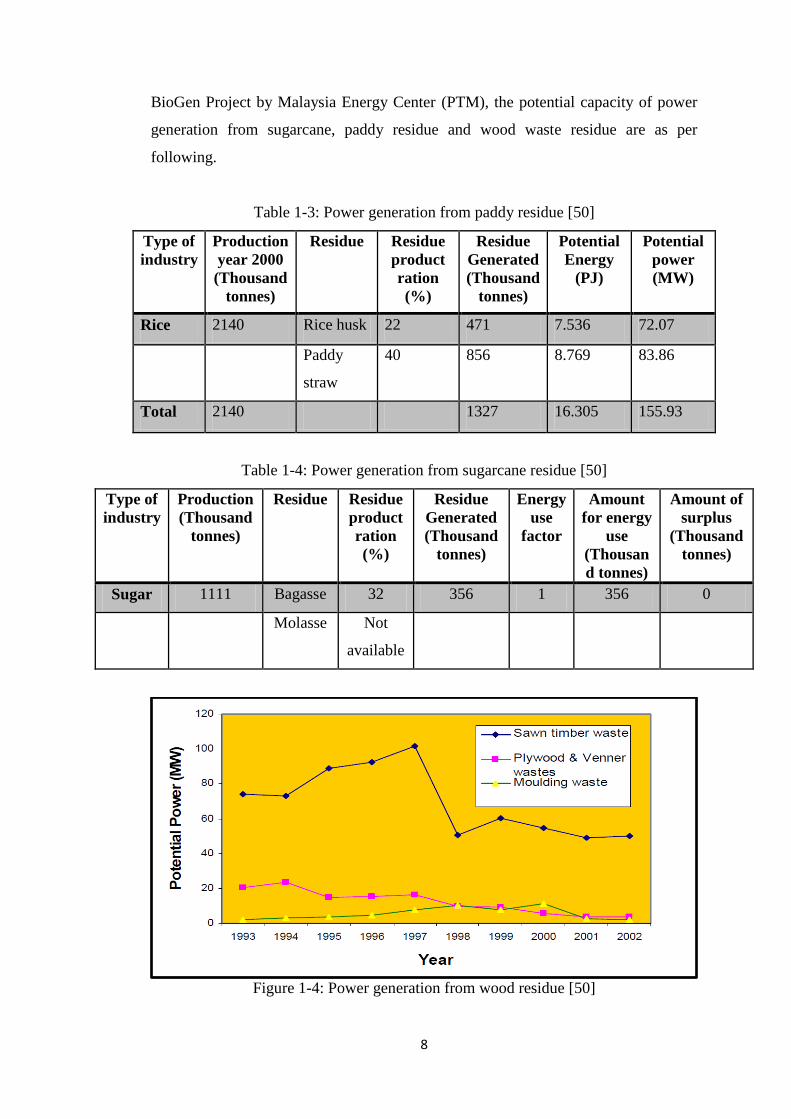
8
BioGen Project by Malaysia Energy Center (PTM), the potential capacity of power
generation from sugarcane, paddy residue and wood waste residue are as per
following.
Table 1-3: Power generation from paddy residue [50]
Type of
industry
Production
year 2000
(Thousand
tonnes)
Residue Residue
product
ration
(%)
Residue
Generated
(Thousand
tonnes)
Potential
Energy
(PJ)
Potential
power
(MW)
Rice 2140 Rice husk 22 471 7.536 72.07
Paddy
straw
40 856 8.769 83.86
Total 2140 1327 16.305 155.93
Table 1-4: Power generation from sugarcane residue [50]
Type of
industry
Production
(Thousand
tonnes)
Residue Residue
product
ration
(%)
Residue
Generated
(Thousand
tonnes)
Energy
use
factor
Amount
for energy
use
(Thousan
d tonnes)
Amount of
surplus
(Thousand
tonnes)
Sugar 1111 Bagasse 32 356 1 356 0
Molasse Not
available
Figure 1-4: Power generation from wood residue [50]
9
1.2 Problem Statement
In recent years due to the increasing of energy demand and to have clean
environment, Malaysia has given much attention to the biomass as a potential source
of renewable energy mainly in power generation. Many studies on the biomass
conversion for energy technology had been conducted by various researchers and
some of the technology had been proven and implemented in Malaysia in small
scale. However, utilisation of biomass wastes as a replacement of fossil fuel to
generate electricity still very low in Malaysia even though Malaysia is well-known
for its agricultural sector and has a significant amount of biomass waste. Only about
4% of primary energy produced in Malaysia is from renewable sources [52].
Biomass also is seen as not competitive yet with the fossil fuel in term of power
generation.
Those problem mentioned has brought to the study on the modelling of power
generation from biomass resources. Possible routes for biomass conversion to
electricity from various biomass resources available in Malaysia are studied and
feasible route for maximum power generation is determined.
1.3 Objectives
The specific objectives of this project are:
a) To identify feasible routes of power generation via biomass resources in
Malaysia
b) To develop a superstructure model that incorporates the feasible routes of
power generation from biomass resources in Malaysia
c) To perform parametric study in order to predict for the route having the
maximum electricity production in Malaysia.
10
1.4 Scope of Study
The scope of study in this project involves developing a superstructure consisting of
linear mathematical models to represent the production routes of power generation
from biomass resources. The data on the feasible production routes are extracted
from literature review of previous works. The linear programming (LP)
superstructure model is then developed in MATLAB. Upon parametric studies, the
simulation for each route is conducted in order to solve for the maximum power
production from biomass resources in Malaysia.
1.5 Relevancy of Project
The most important applicability of a mathematical modelling in real life situation is
its flexibility for use to solve industry-relevant sized problems. This project is
targeted to find out which production route using biomass resources is worth
investing by attaining the most feasible route for process design before applying the
decision into real life situations. Besides, it is also potential to fulfil increasing
demand of electricity in Malaysia using abundant agricultural waste.
11
CHAPTER 2: LITERATURE REVIEW
2.1 Technology to Convert Biomass into Electricity
Biomass is one potential source of renewable energy and can be converted into
electricity using a number of different routes. Evans et al [3] presented that there are
three primary technology categories used for the combustion based conversion of
biomass into electricity which are direct combustion, pyrolysis and gasification.
These three processes are classified as thermo-chemical process. Lim et al [4]
however reported that generally biomass can be converted to electricity using
thermo-chemical process and bio-chemical process. Each category has undergone
significant development and therefore has many different methods available.
In direct combustion, biomass is burned in a boiler producing pressurized steam,
which is expanded through a turbine to produce electricity [5]. Wibulwas et al [17]
evaluated the economic feasibility of installing steam power plants in a rice mill by
comparing a gasifier internal combustion engine system and a boiler-turbine system.
The result suggests that both systems are economically feasible to meet energy
demand. Direct combustion is the oldest and simplest, but most inefficient
technology. Gasification and pyrolysis have higher efficiency, but require
significantly more process control and investment [3].
Pyrolysis is a decomposition process of biomass at high temperature in the absence
of air to produce gases, liquids and carbon-rich solid residues [4]. Combustion of
these gases occurs in a gas turbine, typically combined cycle [12]. Bridgwater et al
[15] presented the comparison of pyrolysis, gasification and direct combustion for
electricity generation from wood chip feedstock and concluded that fast pyrolysis
system has great potential to generate electricity at a profit in the long term, at lower
cost than any other biomass to electricity system at small scale.
During a gasification process, biomass is directly converted to synthesis gas (syngas)
in a gasifier under a controlled amount of air. Syngas can be used in internal
combustion engine to produce heat or cogeneration system to produce heat and
electricity [4]. Electricity capacities range from tens of Kilowatts (KW) to several
Megawatts (MW) [5]. Abe et al [16] discussed the potential of rural electricity
12
generation via biomass gasification system. The result suggests that even though
agricultural residue such as rice husks may contain high energy potential, however,
to supply a biomass gasification system in the long term may require tree farming in
order to provide sufficient amount of resources.
There are several kinds of bio-chemical conversion, two of which can potentially
produce electricity are biogas fermentation and microbial fuel cell. Biogas
fermentation series of processes where microorganisms break down biodegradable
materials (usually in the absence of oxygen), thus it is often attributed as anaerobic
digestion. The break-down of these biodegradable materials (such as biomass) will
produce bio-gas which contain mainly of methane (CH4) and carbon dioxide (CO2).
These CH4 and CO2 after desulphurization and deodorization, can later be used in the
combustion system or fed to the fuel cell system to generate electricity [33].
Microbial fuel cell is a device that converts chemical energy directly into electrical
energy by the catalytic reaction of microorganisms. In the microbial fuel cell,
biomass is oxidized at the anode part producing CO2, proton (H+) and electron.
Electrons will go through external circuit to the cathode part producing current, and
protons go through the exchange membrane. At the cathode part, oxygen reduction
reaction occurs just like in the typical chemical fuel cell [29]. Appropriate kinds of
microorganisms used in microbial fuel cell are very crucial since they determine the
actual mechanism of the oxidation reactions as well as mechanism of electron
transfer in the anode part of the fuel cell, which will influence how effectively
electrical energy can be obtains from this system.
13
2.2 Power Generation from Biomass Resources
To complete this superstructure modelling, the simulation data will be extracted from
various literature sources. For instance, Ayoub et al [14] developed a design and
evaluation methodology for biomass utilization network (B-Nets) planning in local
areas. The biomass utilization superstructure (BUSS) relates the biomass resources to
their product, available process and possible future processes of utilization in static
manner.
Wianwiwat et al [7] prepared a model of Thailand economy used to stimulate a
number of potential policies to achieve the Thai government’s biomass-generated
electricity targets contained in its 15 year renewable energy development plan. The
study of this model provides the amount of biomass-based electricity production
information from various type of biomass.
Martinez et al [8] also formulated mixed-integer linear programming problems to
select the generation plants connected to the Argentinen electricity network. The
plant selection will be based on the reduction in life cycle GHG emission and
operating cost. Methodology to run this model gives useful information in modelling
power generation from biomass resources.
Another previous work is on optimization by Muis et al [6] in which mixed-integer
optimization has been developed to optimize fuel mix and meet carbon dioxide
target. The model was developed and implemented in General Algebraic Modelling
System (GAMS) for the fleet of electricity generation in Peninsular Malaysia.
2.3 Research Gap
However, the literature review reveals that there is limited study on modelling of
power generation from biomass resources in Malaysia. This project is different from
others as it considering simultaneous different production routes for electricity
generation via different technologies. Apart from that, this study focuses on
maximum electricity production from biomass available in Malaysia.
14
CHAPTER 3: METHODOLOGY
3.1 Research Work
The project scope include three key phases namely data gathering, superstructure
development and model development and implementation. Figure 3-1 shows the
flowchart of the project scope involved.
Phase 1: Data Gathering
Phase 1 focused on gathering the necessary information required in this
project. The information needed include:
a) The existing power plant
b) Current electricity demand
c) Biomass availability : types, annual production, potential power
generation
d) Feasible technology to convert biomass into electricity
Phase 2: Superstructure Development
The superstructure model will represent all the possible routes for power
generation which consist of potential biomass resources and feasible
technology to convert biomass into electricity. The project starts with critical
literature review on the potential biomass-based electricity in Malaysia. Upon
thorough research, it is narrowed down to five main biomass contributor to
electricity generation which are palm oil industry, municipal waste, wood
industry, rice industry and bagasse. Then, literature review gives guidance on
the feasible technologies to generate electricity from biomass resources. This
includes thermo-chemical technologies which are direct combustion,
pyrolysis and gasification process and also bio-chemical technologies which
is anaerobic digestion.

15
The superstructure network in this study is a single-input-multi-output
material flow network, where a single input biomass resource flows through
processing stages to generate electricity for each route. The integration of the
information obtain into a superstructure development resulted for easier
understanding of the whole system.
Phase 3: Model Development and Implementation
The model employed in this study is based on the superstructure
development. The objective of this model development is to find the
maximum power generation from potential biomass resources in Malaysia.
During the model development, a few condition need to be implemented.
Then, the maximum electricity generation route will be obtained through
simulation of the model using simulation software which is MATLAB.
MATLAB is a programming environment for algorithm development, data
analysis, visualization, and numerical computation. The most use of
MATLAB involves typing MATLAB code into the Command Window (as an
interactive mathematical shell), or executing text files containing MATLAB
code and functions. During the simulation, the Linear Programming (LP)
superstructure model will be used to find for the maximum solution
(maximum power generation). The correlation between the simulation and the
data obtained through literature review will be observed and discussed.
16
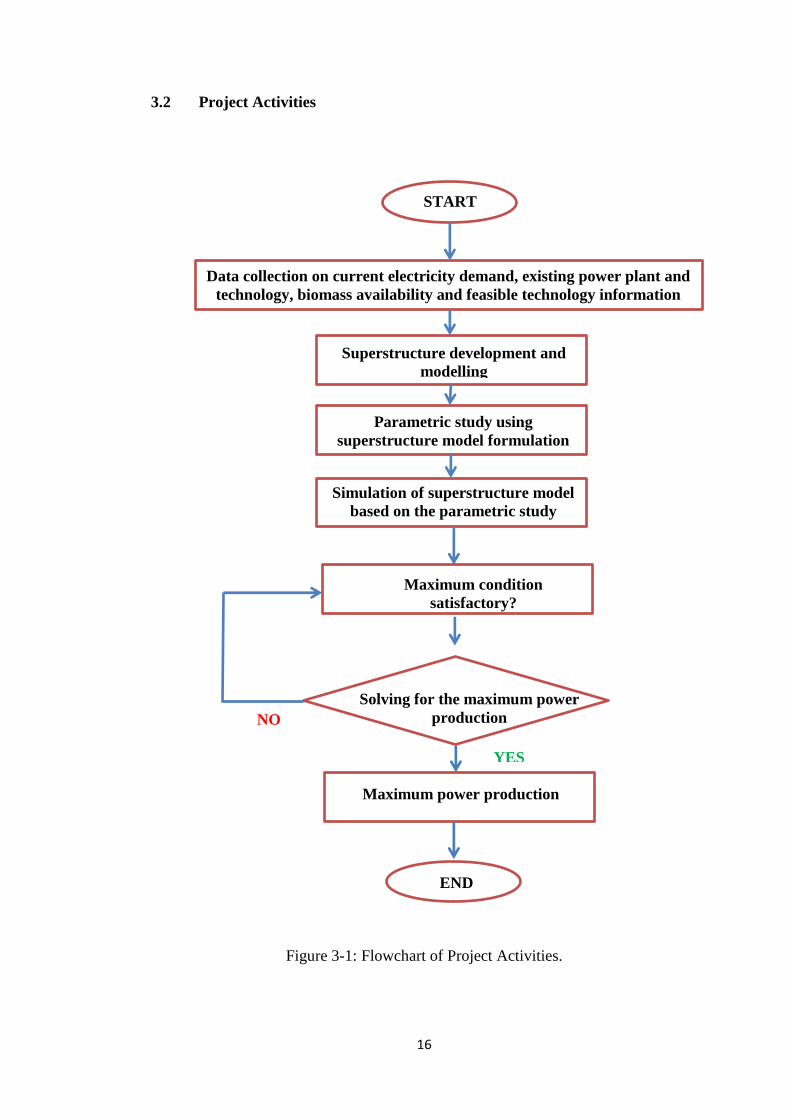
3.2 Project Activities
Figure 3-1: Flowchart of Project Activities.
Solving for the maximum power
production NO
YES
Maximum condition
satisfactory?
Maximum power production
END
Data collection on current electricity demand, existing power plant and
technology, biomass availability and feasible technology information
START
Superstructure development and
modelling
Parametric study using
superstructure model formulation
Simulation of superstructure model
based on the parametric study
17
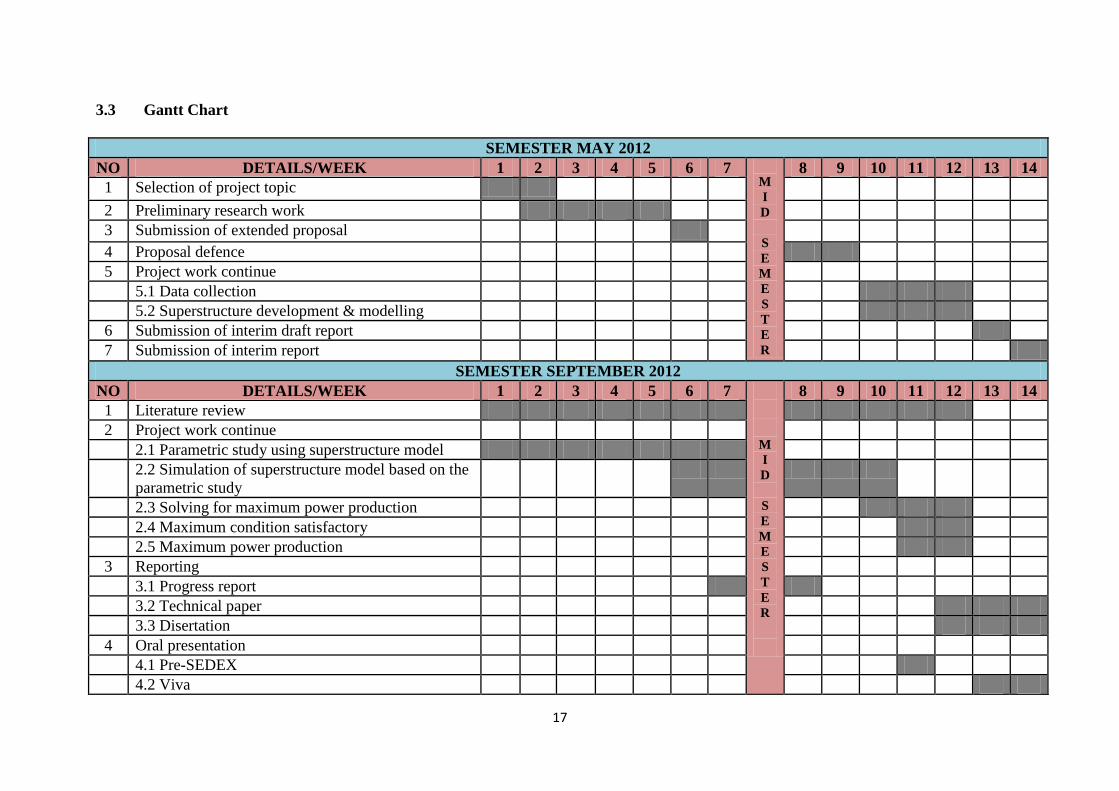
3.3 Gantt Chart
SEMESTER MAY 2012
NO DETAILS/WEEK 1 2 3 4 5 6 7
M
I
D
S
E
M
E
S
T
E
R
8 9 10 11 12 13 14
1 Selection of project topic
2 Preliminary research work
3 Submission of extended proposal
4 Proposal defence
5 Project work continue
5.1 Data collection
5.2 Superstructure development & modelling
6 Submission of interim draft report
7 Submission of interim report
SEMESTER SEPTEMBER 2012
NO DETAILS/WEEK 1 2 3 4 5 6 7
M
I
D
S
E
M
E
S
T
E
R
8 9 10 11 12 13 14
1 Literature review
2 Project work continue
2.1 Parametric study using superstructure model
2.2 Simulation of superstructure model based on the
parametric study
2.3 Solving for maximum power production
2.4 Maximum condition satisfactory
2.5 Maximum power production
3 Reporting
3.1 Progress report
3.2 Technical paper
3.3 Disertation
4 Oral presentation
4.1 Pre-SEDEX
4.2 Viva
18
CHAPTER 4: RESULT AND DISCUSSION
4.1 Superstructure Development
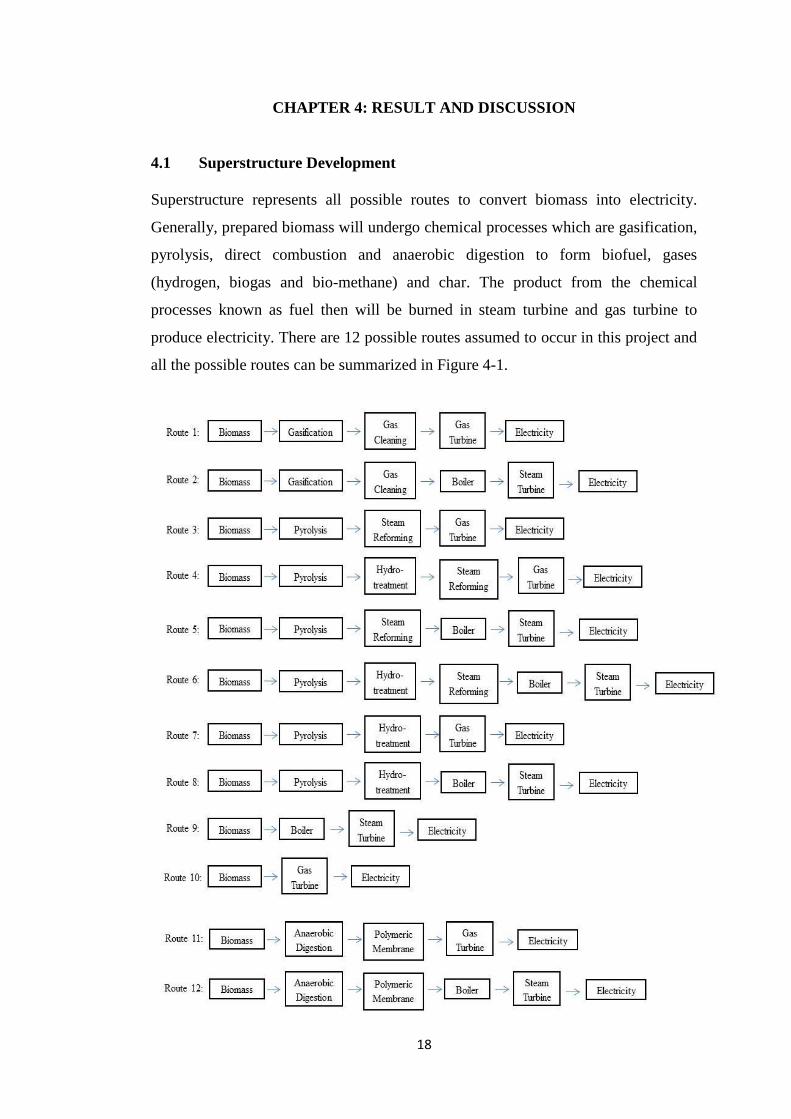
Superstructure represents all possible routes to convert biomass into electricity.
Generally, prepared biomass will undergo chemical processes which are gasification,
pyrolysis, direct combustion and anaerobic digestion to form biofuel, gases
(hydrogen, biogas and bio-methane) and char. The product from the chemical
processes known as fuel then will be burned in steam turbine and gas turbine to
produce electricity. There are 12 possible routes assumed to occur in this project and
all the possible routes can be summarized in Figure 4-1.
19
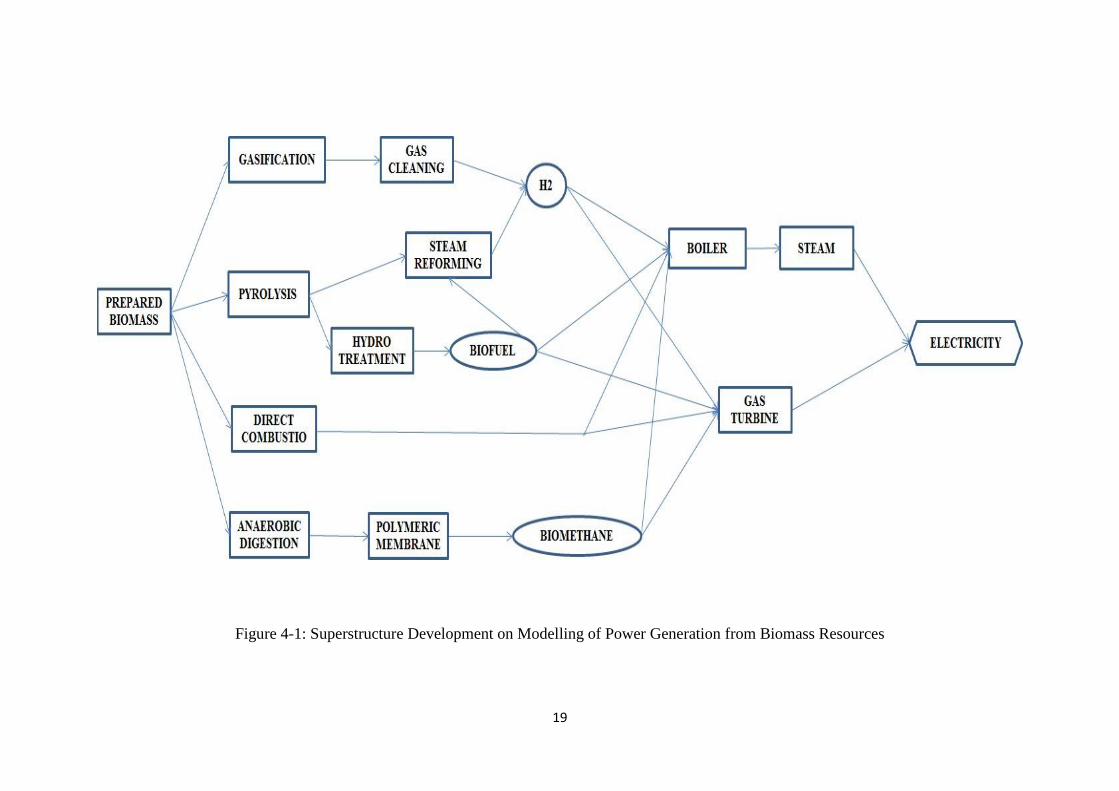
Figure 4-1: Superstructure Development on Modelling of Power Generation from Biomass Resources
20
4.2 Process Model Formulation
4.2.1 Mass Balances
Mass balances or material balances are the application of the law of the conservation
of mass: “Matter is neither created nor destroyed”. Mass balance is calculated by the
equation 1
∑
∑
Where is inlet mass and is outlet mass.
The output mass flow rate for selected product in each processes involved in this
project is calculated as equation 2 and 3,
Or
4.4.2 Gasification
The conversion of biomass to hydrogen takes place in single pass fluidized bed
gasifier through steam gasification process integrated with CO2 capture. There are
few assumptions were considered in flow sheet development modeling for
gasification process are as follows.
The gasifier operates under steady state conditions and atmospheric
pressure.
The reactions proceed adiabatically and at constant volume.
There is no tar formation in this process.
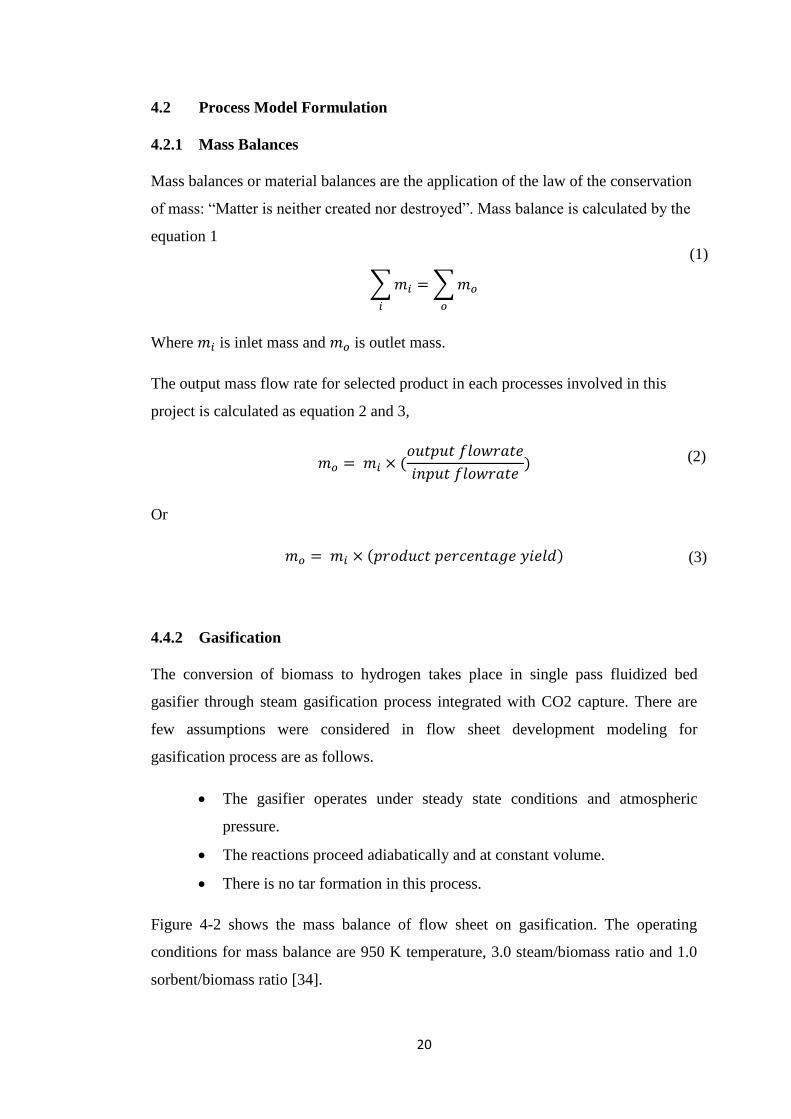
Figure 4-2 shows the mass balance of flow sheet on gasification. The operating
conditions for mass balance are 950 K temperature, 3.0 steam/biomass ratio and 1.0
sorbent/biomass ratio [34].
(1)
(2)
(3)
21
Figure 4-2: Mass Balance of Flow Sheet on Gasification
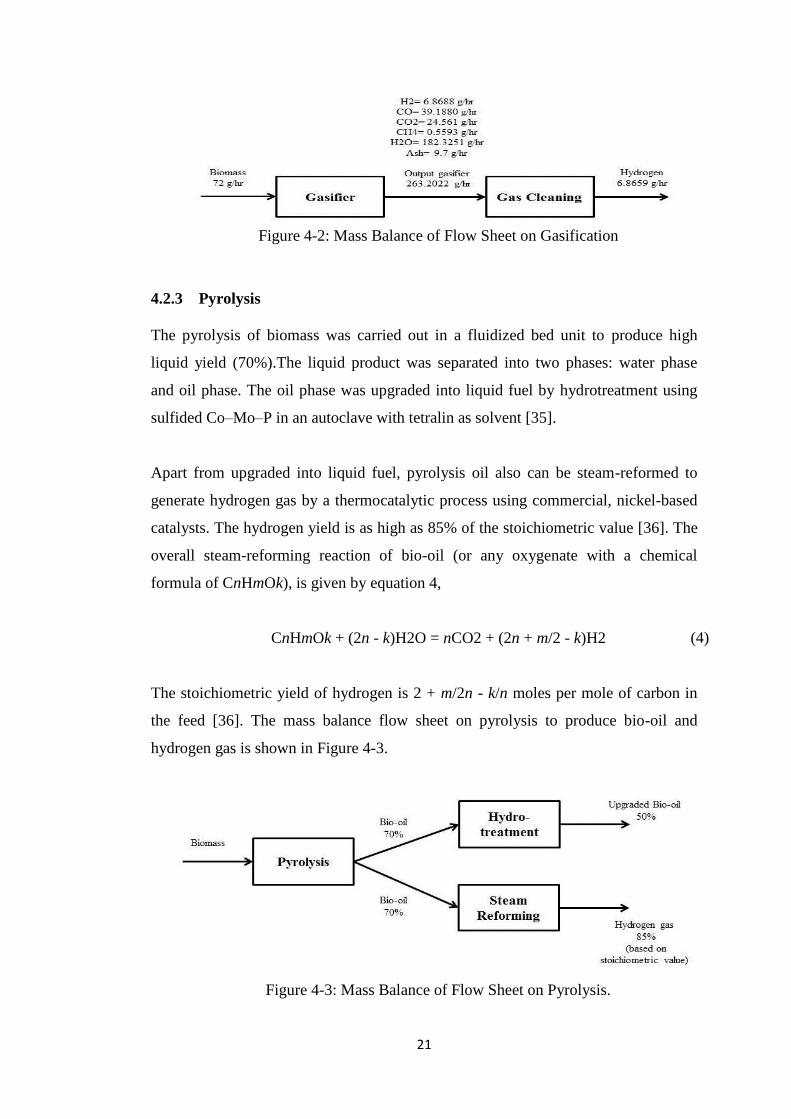
4.2.3 Pyrolysis
The pyrolysis of biomass was carried out in a fluidized bed unit to produce high
liquid yield (70%).The liquid product was separated into two phases: water phase
and oil phase. The oil phase was upgraded into liquid fuel by hydrotreatment using
sulfided Co–Mo–P in an autoclave with tetralin as solvent [35].
Apart from upgraded into liquid fuel, pyrolysis oil also can be steam-reformed to
generate hydrogen gas by a thermocatalytic process using commercial, nickel-based
catalysts. The hydrogen yield is as high as 85% of the stoichiometric value [36]. The
overall steam-reforming reaction of bio-oil (or any oxygenate with a chemical
formula of CnHmOk), is given by equation 4,
CnHmOk + (2n - k)H2O = nCO2 + (2n + m/2 - k)H2
The stoichiometric yield of hydrogen is 2 + m/2n - k/n moles per mole of carbon in
the feed [36]. The mass balance flow sheet on pyrolysis to produce bio-oil and
hydrogen gas is shown in Figure 4-3.
Figure 4-3: Mass Balance of Flow Sheet on Pyrolysis.
(4)
22
4.2.4 Anaerobic digestion
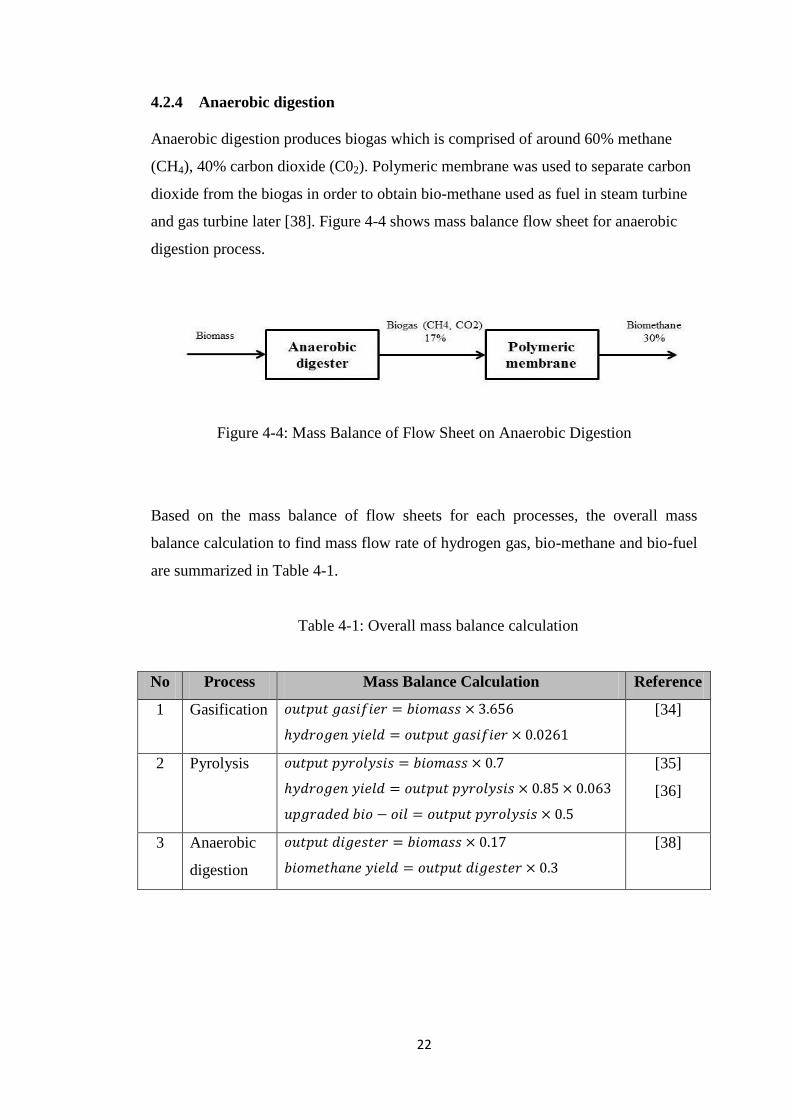
Anaerobic digestion produces biogas which is comprised of around 60% methane
(CH4), 40% carbon dioxide (C02). Polymeric membrane was used to separate carbon
dioxide from the biogas in order to obtain bio-methane used as fuel in steam turbine
and gas turbine later [38]. Figure 4-4 shows mass balance flow sheet for anaerobic
digestion process.
Figure 4-4: Mass Balance of Flow Sheet on Anaerobic Digestion
Based on the mass balance of flow sheets for each processes, the overall mass
balance calculation to find mass flow rate of hydrogen gas, bio-methane and bio-fuel
are summarized in Table 4-1.
Table 4-1: Overall mass balance calculation
No Process Mass Balance Calculation Reference
1 Gasification
[34]
2 Pyrolysis
[35]
[36]
3 Anaerobic
digestion
[38]

23
4.3 Power Production Model Formulation
4.3.1 Gas turbine
The gas turbine cycle consists of a compressor, a combustion chamber and turbine.
Air enters the compressor at TI, PI, which are at atmospheric condition. Using the
relation for ideal gases for air, the ideal outlet temperature T2 is obtained by equation
5,
(
)
Where PI and P2 are pressures of air entering and leaving the compressor
respectively, T1 and T2 are temperature of entering and leaving the compressor
respectively and k is the specific heat ratio of air. The temperature of the air leaving
the compressor, having an isentropic efficiency , can be calculated as equation
6,
In the present analysis, the turbine inlet temperature is a predetermined parameter,
hence, the mass of fuel needed to reach a certain desired turbine inlet temperature is
obtained by applying the first law of thermodynamics to the combustion chamber.
The first law of thermodynamics for an insulated chamber can be written as equation
7,
Heat supplied by fuel = heat gain by burning gases
where is mass flow rate of fuel, LHV is lower heating value, T3 is turbine inlet
temperature, is mass flow rate of gases and is specific heat at constant
pressure for flue gases.
(5)
(6)
(7)
24
The compression work, of the working air can be estimated for an adiabatic
compressor as equation 8,
Where is mass flow rate of air and is the specific heat at constant pressure of
inlet air.
Using the relation for ideal gases for exhaust, the ideal outlet temperature of turbine
is obtained by equation 9,
Where is expansion ratio and is the specific heat ratio of exhaust gases.
The temperature of the exhaust leaving the turbine having an isentropic efficiency
can be calculated as equation 10,
The power produced by the turbine can be estimated using the first law of
thermodynamics for an adiabatic turbine as equation 11,
Hence, the net power obtained from the gas turbine is calculated as equation 12,
(8)
(9)
(10)
(11)
(12)
25
4.3.2 Boiler-Steam Turbine
A boiler is an enclosed vessel that provides a means for combustion heat to be
transferred into water until it becomes heated water or steam. The steam under
pressure is then usable in rotating the blade in steam turbine to produce electricity.
The mass flowrate of steam produce, from combustion in boiler is calculated as
equation 13,
Where is boiler efficiency, is mass flow rate of fuel, LHV is lower heating
value of fuel, hg
is enthalpy of saturated steam in kcal/kg of steam and hf is enthalpy
of feed water in kcal/kg of water.
The steam turbine is then converts the energy of steam into power. Power
production, generated by steam turbine is calculated as equation 14,
Where is enthalpy of the inlet steam and is enthalpy of the outlet steam.
However, the enthalpy of outlet steam, is calculated based on the efficiency of
steam turbine, and isentropic enthalpy of outlet steam, which is obtained from
pressure – enthalpy diagram. The calculation is as equation 15,
The gas turbine cycle calculation and of boiler-steam turbine calculation are
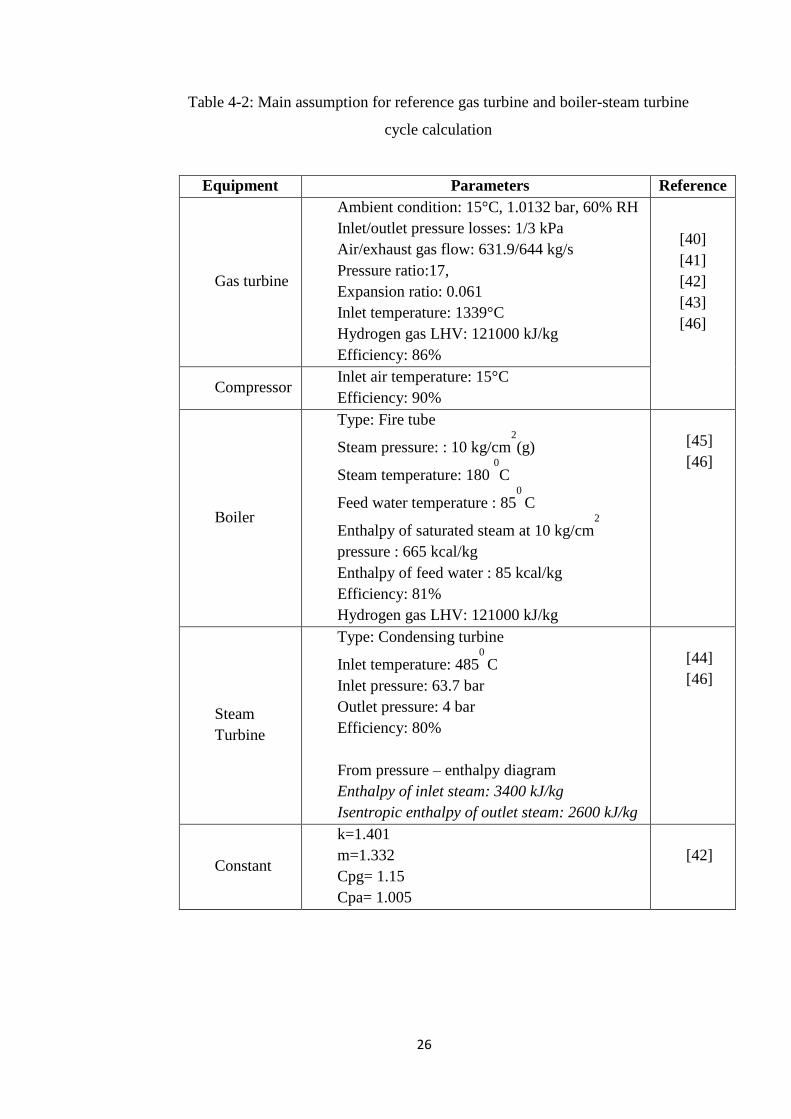
calculated using a set of assumption reported in Table 4-2. The data are used for all
the routes considered, apart from LHV which varied according to the type of fuel
used.
(13)
(14)
(15)
26
Table 4-2: Main assumption for reference gas turbine and boiler-steam turbine
cycle calculation
Equipment Parameters Reference
Gas turbine
Ambient condition: 15°C, 1.0132 bar, 60% RH
Inlet/outlet pressure losses: 1/3 kPa
Air/exhaust gas flow: 631.9/644 kg/s
Pressure ratio:17,
Expansion ratio: 0.061
Inlet temperature: 1339°C
Hydrogen gas LHV: 121000 kJ/kg
Efficiency: 86%
[40]
[41]
[42]
[43]
[46]
Compressor Inlet air temperature: 15°C
Efficiency: 90%
Boiler
Type: Fire tube
Steam pressure: : 10 kg/cm2
(g)
Steam temperature: 180 0
C
Feed water temperature : 850
C
Enthalpy of saturated steam at 10 kg/cm2
pressure : 665 kcal/kg
Enthalpy of feed water : 85 kcal/kg
Efficiency: 81%
Hydrogen gas LHV: 121000 kJ/kg
[45]
[46]
Steam
Turbine
Type: Condensing turbine
Inlet temperature: 4850
C
Inlet pressure: 63.7 bar
Outlet pressure: 4 bar
Efficiency: 80%
From pressure – enthalpy diagram
Enthalpy of inlet steam: 3400 kJ/kg
Isentropic enthalpy of outlet steam: 2600 kJ/kg
[44]
[46]
Constant
k=1.401
m=1.332
Cpg= 1.15
Cpa= 1.005
[42]
27
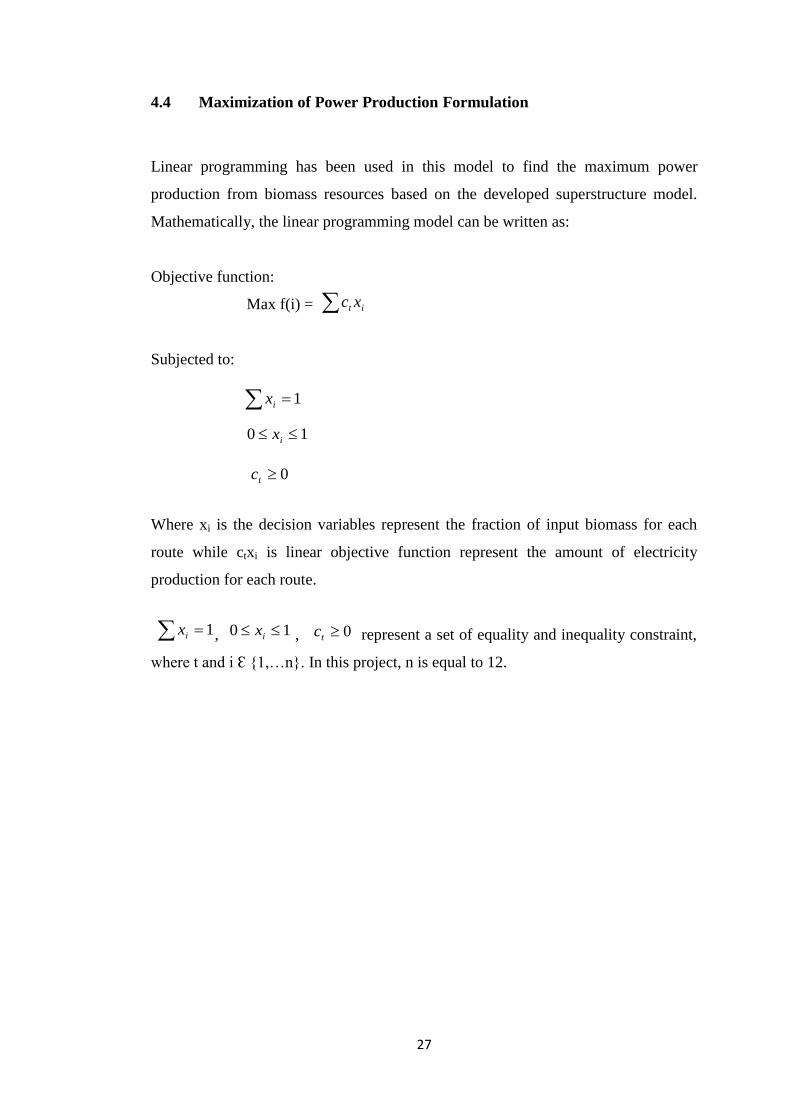
4.4 Maximization of Power Production Formulation
Linear programming has been used in this model to find the maximum power
production from biomass resources based on the developed superstructure model.
Mathematically, the linear programming model can be written as:
Objective function:
Max f(i) =
Subjected to:
Where xi is the decision variables represent the fraction of input biomass for each
route while ctxi is linear objective function represent the amount of electricity
production for each route.
, , represent a set of equality and inequality constraint,
where t and i Ɛ {1,…n}. In this project, n is equal to 12.
it xc
1 ix
10 ix
0tc
1 ix 10 ix 0tc
28
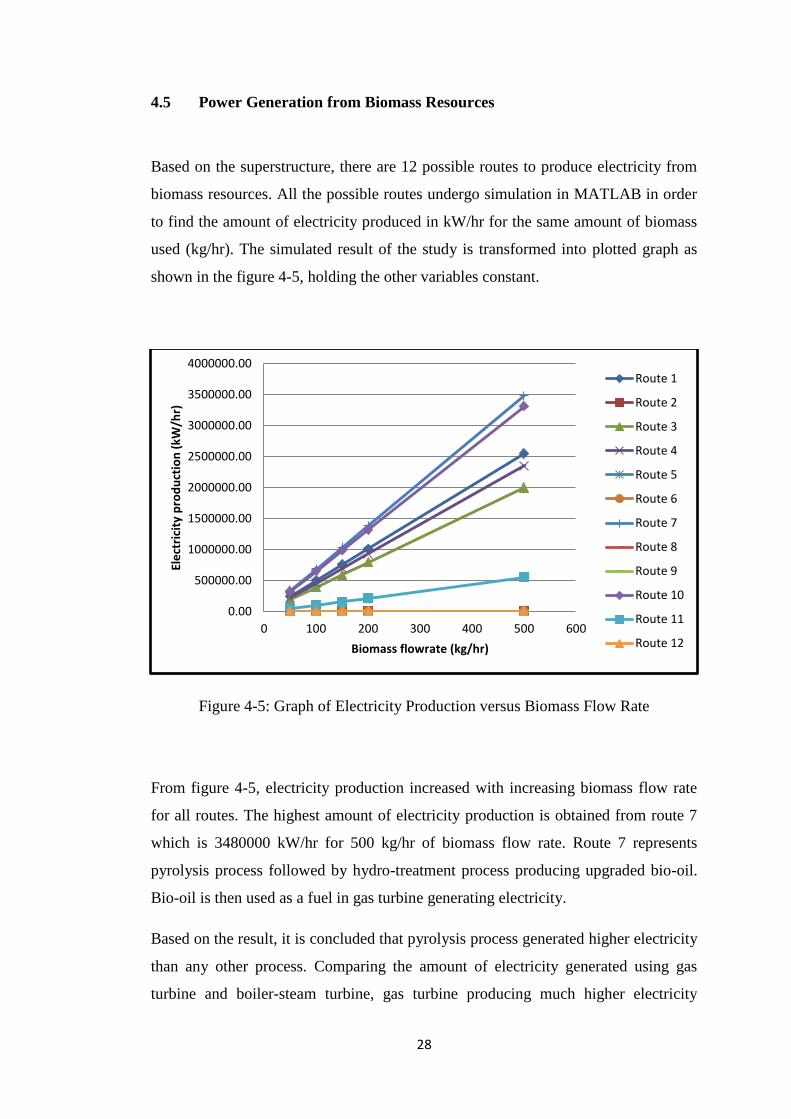
4.5 Power Generation from Biomass Resources
Based on the superstructure, there are 12 possible routes to produce electricity from
biomass resources. All the possible routes undergo simulation in MATLAB in order
to find the amount of electricity produced in kW/hr for the same amount of biomass
used (kg/hr). The simulated result of the study is transformed into plotted graph as
shown in the figure 4-5, holding the other variables constant.
Figure 4-5: Graph of Electricity Production versus Biomass Flow Rate
From figure 4-5, electricity production increased with increasing biomass flow rate
for all routes. The highest amount of electricity production is obtained from route 7
which is 3480000 kW/hr for 500 kg/hr of biomass flow rate. Route 7 represents
pyrolysis process followed by hydro-treatment process producing upgraded bio-oil.
Bio-oil is then used as a fuel in gas turbine generating electricity.
Based on the result, it is concluded that pyrolysis process generated higher electricity
than any other process. Comparing the amount of electricity generated using gas
turbine and boiler-steam turbine, gas turbine producing much higher electricity
0.00
500000.00
1000000.00
1500000.00
2000000.00
2500000.00
3000000.00
3500000.00
4000000.00
0 100 200 300 400 500 600
Ele
ctri
city
pro
du
ctio
n (
kW/h
r)
Biomass flowrate (kg/hr)
Route 1
Route 2
Route 3
Route 4
Route 5
Route 6
Route 7
Route 8
Route 9
Route 10
Route 11
Route 12
29
production. In general, this result is in accordance by the study conducted by
Bridgwater AV, Toft AJ and Brammer JG on a techno-economic comparison of
power production by biomass fast pyrolysis with gasification and combustion. The
study concluded that fast pyrolysis has a great potential to generate electricity than
any other process at small scale.
4.6 Maximization of Power Production
The maximization of power production formulation is considered as linear
programming model by taking fraction of input biomass for each route as decision
variable. After running the linear programming model in MATLAB, the result
obtained is as shown in Table 4-3.
Table 4-3: The Amount of Power Production and Fraction for each Route.
Biomass Flowrate (kg/h) 62500 625000
Maximum Power
Generation (kW/h)
4.36476e+008 4.36628e+009
Fraction for each route
Route 1 0.0000 0.0000
Route 2 0.0000 0.0000
Route 3 0.0001 0.0000
Route 4 0.0000 0.0000
Route 5 0.0000 0.0000
Route 6 0.0000 0.0000
Route 7 0.9996 1.000
Route 8 0.0000 0.0000
Route 9 0.0000 0.0000
Route 10 0.0000 0.0000
Route 11 0.0002 0.0000
Route 12 0.0000 0.0000
30
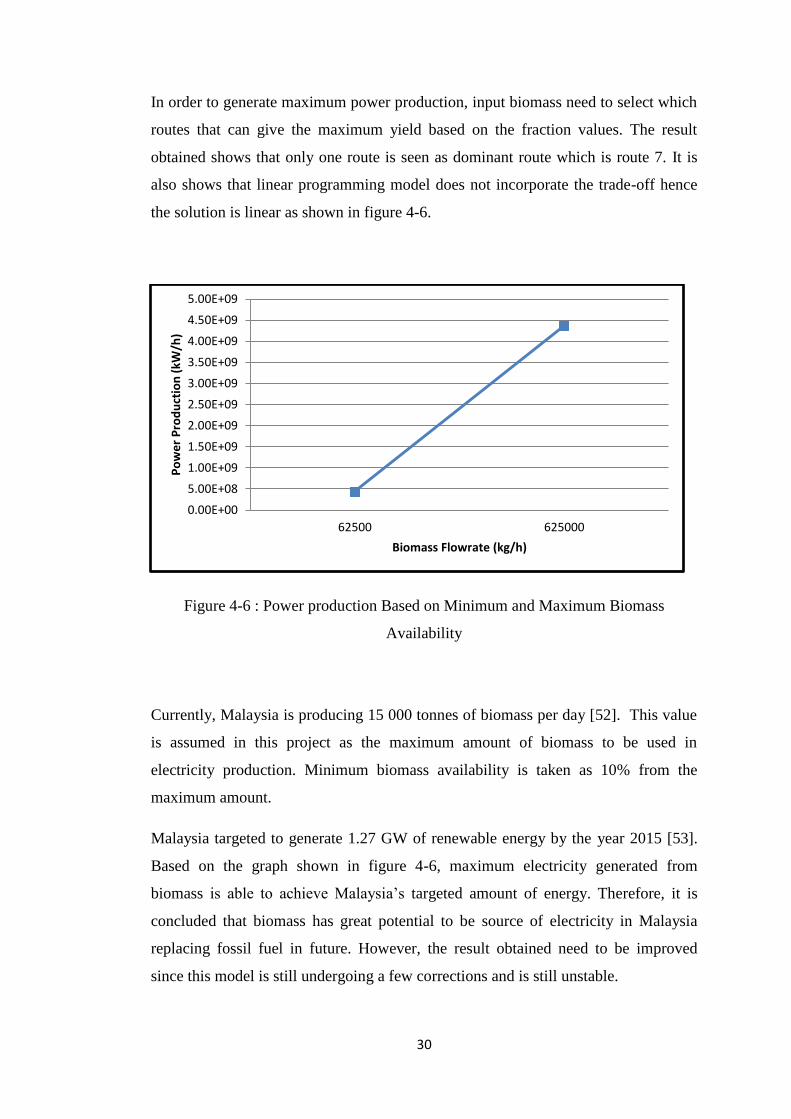
In order to generate maximum power production, input biomass need to select which
routes that can give the maximum yield based on the fraction values. The result
obtained shows that only one route is seen as dominant route which is route 7. It is
also shows that linear programming model does not incorporate the trade-off hence
the solution is linear as shown in figure 4-6.
Figure 4-6 : Power production Based on Minimum and Maximum Biomass
Availability
Currently, Malaysia is producing 15 000 tonnes of biomass per day [52]. This value
is assumed in this project as the maximum amount of biomass to be used in
electricity production. Minimum biomass availability is taken as 10% from the
maximum amount.
Malaysia targeted to generate 1.27 GW of renewable energy by the year 2015 [53].
Based on the graph shown in figure 4-6, maximum electricity generated from
biomass is able to achieve Malaysia’s targeted amount of energy. Therefore, it is
concluded that biomass has great potential to be source of electricity in Malaysia
replacing fossil fuel in future. However, the result obtained need to be improved
since this model is still undergoing a few corrections and is still unstable.
0.00E+00
5.00E+08
1.00E+09
1.50E+09
2.00E+09
2.50E+09
3.00E+09
3.50E+09
4.00E+09
4.50E+09
5.00E+09
62500 625000
Po
we
r P
rod
uct
ion
(kW
/h)
Biomass Flowrate (kg/h)
31
CHAPTER 5: CONCLUSION AND RECOMMENDATION
5.1 Conclusion
Increasing demand of electricity in Malaysia has encouraged the government to
embark on alternatives energy sources. Biomass is identified as one of the potential
source of electricity generation due to it abundant availability throughout the year in
Malaysia. Various chemical conversion technologies can be applied for power
generation from biomass resources such as pyrolysis, gasification, direct combustion
and anaerobic digestion. Gas turbine and boiler-steam turbine are used in this project
as combustion engine producing electricity. There are 12 possible routes identified to
generate electricity from biomass and all the routes are summarized in a
superstructure model. Based on the superstructure, linear programming model
formulation has been developed to solve for the route having maximum electricity
production in Malaysia. Result obtained shows that maximum electricity generation
can be produced from biomass undergo pyrolysis process and gas turbine with
upgraded bio-oil as biofuel. This result is in accordance with the study conducted by
Bridgwater et al [15]. Apart from that, the maximum power generation for minimum
and maximum biomass availability in Malaysia also being studied. It is concluded
that, biomass can achieved the targeted amount of renewable energy needed in
Malaysia by the year 2015 proving that biomass has great potential to replace fossil
fuel in the future.
Therefore, as a conclusion all the three objectives of this study have been achieved
which are to identify feasible routes of power generation from biomass resources, to
develop a superstructure model and to perform parametric study solving the route
producing maximum electricity production in Malaysia. However, future corrections
and improvements need to be done on this model in order to make it more practical
to be used in industrial application.
32
5.2 Recommendation
In achieving higher result accuracy, there are a lot of improvements can be
conducted as this project started from basis. For future work, the model should
considered environmental aspect in term of greenhouse gases (GHG) emission for
each route. Besides, the route producing maximum electricity generation also can be
check and balance by considering cost estimation in the model formulation.
Introduction of nonlinearity in the model formulation taking account the energy
balances and kinetic theory for each route also lead to better accuracy of the results
obtained.
33
REFERENCES
[1] Bazmi A, Zahedi G, Hashim H. Progress and challenges in utilization of palm
oil biomass as fuel for decentralized electricity generation: a review. Renew
Sust Energy Rev 2011; 15: 574-583
[2] Bazmi A, Zahedi G. Sustainable energy systems: Role of optimization
modelling techniques in power generation and supply: a review. Renew Sust
Energy Rev 2011; 15: 3480-3500
[3] Evans A, Strezov V, Evans T. Sustainability considerations for electricity
generation from biomass: a review. Renew Sust Energy Rev 2010; 14: 1419-
1427
[4] Lim J, Manan Z, Alwi S, Hashim H. A review on utilisation of biomass from
rice industry as a source of renewable energy: a review. Renew Sust Energy
Rev 2012; 15: 3084-3094
[5] Balat H, Balat M, Demirbas M. Potential contribution of biomass to the
sustainable energy development: a review. Energy Conversion and
Management 2009; 50:1746–1760
[6] Muis Z.A, Hashim H, Manan Z.A, Taha F.M. Optimization of biomass usage
for electricity generation with carbon dioxide reduction in Malaysia. Journal
of Applied Science 2010; 10: 2613-2617
[7] Wianwiwat S, Asafu-adjaye J. Modelling the promotion of biomass use: A
case study of Thailand. Energy 2011; 36: 1735-1748
[8] Martinez P.E, Pasquevich D.M, Eliceche A.M. Operation of a national
electricity network to minimize life cycle greenhouse gas emissions and cost.
International Journal of Hydrogen energy 2012; xxx: 1-10
34
[9] Bain RL, Overend RP, Craig KR. Biomass-fired power generation. Fuel
Process Technol 1998;54:1–16.
[10] Goyal H, Seal D, Saxena R. Bio-fuels from thermochemical conversion of
renewable resources: a review. Renew Sust Energy Rev 2008;12:504–17.
[11] Saxena R, Adhikari D, Goyal H. Biomass-based energy fuel through
biochemical routes: a review. Renew Sust Energy Rev 2009;13:167–78.
[12] Ganesh A, Banerjee R. Biomass pyrolysis for power generation a potential
technology. Renew Energy 2001;22:9–14.
[13] Department of Trade and Industry. Gasification of solid and liquid fuels for
power generation. Cleaner Coal Technology Programme, Department of Trade
and Industry; 1998.
[14] Ayoub, N., Seki, H., & Naka, Y. (2009). Superstructure-based design and
operation for biomass utilization networks. Computers and Chemical
Engineering , 1770-1780.
[15] Bridgwater AV, Toft AJ, Brammer JG. A techno-economic comparison of
power production by biomass fast pyrolysis with gasification and combustion.
Renewable and Sustainable Energy Reviews 2002;6:181–246.
[16] Abe H, Katayama A, Sah BP, Toriu T, Samy S, Pheach P, et al. Potential for
rural electrification based on biomass gasification in Cambodia. Biomass
Bioenergy 2007;31:656–64.
[17] Wibulswas P, Panyawee S, Terdyothin A. Potential for power generation in a
large white rice mill. Renew Energy 1994; 5:796–8.
[18] Sumathi S, Chai SP, Mohamed AR. Utilization of oil palm as a source of
renewable energy in Malaysia. Renewable and Sustainable Energy Reviews
2008; 12:2404–21.
35
[19] Hashim M.,2005. Present status and problems of biomass energy utilization
in Malaysia. Proceedings of APECATC-Workshop on Biomass Utilization,
Jan 19-21, Tokyo, Tsukuba, pp:1-25.
[20] Nasrin AB,MaAN, Choo YM,Mohamad S, RohayaMH, Azali A. Oil palm
biomass as potential substitution raw materials for commercial biomass
briquettes production. American Journal of Applied Science 2008;5(3):179–
83.
[21] EIA, International Energy Outlook 2011 - World Energy Demand and
Economic Outlook. U.S. Energy Information Administration, Office of
Integrated Analysis and Forecasting; 2010. Washington, DC 20585: U.S.
Department of Energy.
[22] World Watch Institute - Global Fossil Fuel Consumption Surges. World
Watch Institute, Washington, DC 20036.
[23] World Resources Institute – Fossil fuel consumption and its application.
World Resources Institute, 10 G Street NE Suite 800, Washington, DC 20002.
[24] Harmony Oil and Gas Corporation - Energy demand. Available from
http://www.harmonyoilgasco.com/abouthogc/energydemand/
[25] Zafar S. Energy Scenario in Malaysia. Article in Cleantech Solution 2012.
Available from http://www.cleantechloops.com/energy-scenario-in-malaysia/
[26] Sung C. Electricity demand, economic growth and sustainable energy
resources in Malaysia. Article posted on September, 2010 available from
http://christopherteh.com/blog/2010/09/electricity-demand/
[27] Yusuf AM, Nopiah ZM, Raman M, Sopian K. Modelling Electricity
Generation In Malaysia using IMEM: Initial Result. Prosiding Perkem VII,
JILID 1 (2012) 1 - 5 ISSN: 2231-962X
36
[28] Ministry of Technology, Green Technology and Water (KeTTHA) – The
Future of Energy in Malaysia. Article posted on April, 2012 available from
http://www.kettha.gov.my/en/content/future-energy-malaysia
[29] Rabaey K, Verstraete W. Microbial Fuel Cell: novel biotechnology for energy
generation. Bioetechnology Review 2005; Vol 23. No 6
[30] The Star Online - Tapping Biomass to the Max, Feb 2012, Available from
http://biz.thestar.com.my/news/story.asp?file=/2012/2/11/business/10673037
&sec=business
[31] Malaysia Energy Information Hub (MEIH). Available from
http://meih.st.gov.my/
[32] U.S. Energy Information Administration. Annual Energy Review 2009, and
Monthly Energy Review (June 2011), preliminary 2010 data.
[33] Wijaya W. Biogas Fermentation and Microbial Fuel Cell. Article posted on
January 2012 available from
http://willyyanto.wordpress.com/2012/01/31/biogas-fermentation-and-
microbial-fuel-cell/
[34] Inayat A, Ahmad MA, Mutalib MIA, Yusup S. Flowsheet Modelling of
Biomass Steam Gasification System with CO2 Capture for Hydrogen
Production. Proceedings ICARET 2010-035, July 6-7, Putrajaya, Malaysia.
[35] Zhang S, Yan Y, Li T, Ren Z. Upgrading of Liquid fuel from the Pyrolysis of
Biomass. Bioresource Technology 96 (2005) 545–550.
[36] Wang D, Czernik S, Chomet E. Production of Hydrogen from Biomass by
Catalytic Steam Reforming of Fast Pyrolysis Oils. Energy & Fuels 1998, 12,
19-24.
37
[37] Czernik S, Evans R, French R. Hydrogen from biomass-production by steam
reforming of biomass pyrolysis oils. Catalysis Today 129 (2007) 265–268.
[38] Molino A, Nanna F, Ding Y, Bikson B, Braccio G. Biomethane production
by anaerobic digestion of organic waste. Fuel xxx (2012) xxx–xxx.
[39] Joshua LR, Ruihong Z, Bryan MJ, Bruce RH, Thomas PT. Modeling the
performance of the anaerobic phased solids digester system for biogas energy
production. Biomass and bioenergy 35 (2011) 1263 -1272.
[40] Waiel KE, Zainal A.Development of a Simulation Program to Determine the
Performance of Gas Turbine. Unpublished.
[41] Chiesa P, Lozza G. Using Hydrogen as Gas Turbine Fuel. Journal of
Engineering for Gas Turbines and Power JANUARY 2005, Vol. 127 / 79.
[42] Jaber QM, Jaber JO, Khawaldah MA. Assessment of Power Augmentation
from Gas Turbine Power Plants Using Different Inlet Air Cooling Systems.
Jordan Journal of Mechanical and Industrial Engineering (2007). All rights
reserved 8 - Volume 1, Number 1 (ISSN 1995-6665).
[43] Jaber JO, Probert SD, Williams PT. Gaseous fuels (derived from oil shale) for
heavy-duty gas turbines and combined-cycle power generators. Applied
Energy 60 (1998) 1-20.
[44] Vihar N. 4.0 MW Industrial Waste Based Power Generation Project of Vensa
Biotek Limited. CDM – VENSA – PDD (Version 02 – 8 July 2005).
[45] Boiler. Bureau of Energy Efficiency.
[46] Smith R (2005). Chemical Process Design and Heat Integration. England:
John Wiley and Sons Ltd. Pg 465-510.
38
[47] BP Statistical of World Energy (2011). Available from
http://www.bp.com/sectionbodycopy.do?categoryId=2&contentId=7065607
[48] Hasan MA. Biomass Utilization in Malaysia: Current status of conversion of
biomass into bioproduct. Universiti Putra Malaysia. Unpublished.
[49] Zamali Tarmudi et al (2009) An Overview of Municipal Solid Wastes
Generation in Malaysia Journal Teknologi, 51(F), December 2009. Universiti
Teknologi Malaysia.
[50] Mazlina H. Present Status and Problem of Biomass Energy Utilization in
Malaysia. APECATC – Workshop on Biomass Utilization 19 – 21 January
2005 in Tokyo and Tsukuba. Pusat Tenaga Malaysia.
[51] Mohammed MAA, Salmiaton A, Azlina W, Amran M, Fakhru’l-Razi YH,
TaufiqY. Hydrogen rich gas from oil palm biomass as potential source of
renewable energy in Malaysia. Renewable and Sustainable Energy Reviews
15 (2011) 1258–1270
[52] Zakri AH. Bio-fuel – Alternatives fuels for aviation, prospect for Malaysia.
Bio-borneo 2012.
[53] Global Green Synergy Sdn. Bhd. Available from
http://www.ggs.my/index.php/main-services/palm-biomass

39
APPENDICES

40
APPENDIX 1
PROGRAMMING FILES
Linear Programming Optimization
clear all;
close all;
clc;
global input_biomass;
input_biomass=370000;
% define the initial guess independent variables for optimization
X0=[0.01 0.01 0.01 0.01 0.01 0.01 0.01 0.01 0.01 0.01 0.01 (1-
(0.01+0.01+0.01+0.01+0.01+0.01+0.01+0.01+0.01+0.01+0.01))];
%(f(1)+f(2)+f(3)+f(4)+f(5)+f(6)+f(7)+f(8)+f(9)+f(10)+f(11)))];
% define the lower bounds for independent variables
LB=(zeros(1,12));
% define the upper bounds for independent variables
UB=(ones(1,12));
% define the coefficients for the linear inequality constraints
A = [];
b = [];
% define the coefficients for the linear equality constraints
Aeq = [];
beq = [];
% define the options for the optimization solver
%options = optimset('LargeScale','off','Display','iter');
options = optimset('Algorithm','Active-set','Display',
'iter','MaxFunEvals',1e6,'MaxIter',1e6, ...
'TolFun',1e-6,'TolConSQP',1e-6,'TolX',1e-6,'FunValCheck','on');
%options = optimset('Algorithm','interior-point','Display',
'iter','MaxFunEvals',1e6,'MaxIter',1e6, ...
% 'TolFun',1e-6,'TolConSQP',1e-6,'TolX',1e-6,'FunValCheck','on');
% solving the optimization problem
[fraction,neg_power,exitflag,output,lambda,grad,hessian] =
fmincon(@electricity_max1,X0,A,b,Aeq,beq,LB,UB,@electricity_max1_constraint,options);
Objective Function
function [sum_power]=electricity_max1(f)
global input_biomass;
[electricity_production(1)]=electricity_route1(f(1)*input_biomass);
[electricity_production(2)]=electricity_route2(f(2)*input_biomass);
[electricity_production(3)]=electricity_route3(f(3)*input_biomass);
[electricity_production(4)]=electricity_route4(f(4)*input_biomass);
[electricity_production(5)]=electricity_route5(f(5)*input_biomass);
[electricity_production(6)]=electricity_route6(f(6)*input_biomass);
[electricity_production(7)]=electricity_route7(f(7)*input_biomass);
[electricity_production(8)]=electricity_route8(f(8)*input_biomass);
[electricity_production(9)]=electricity_route9(f(9)*input_biomass);
[electricity_production(10)]=electricity_route10(f(10)*input_biomass);
[electricity_production(11)]=electricity_route11(f(11)*input_biomass);
f(12)= 1- sum(f);
[electricity_production(12)]=electricity_route12(f(12)*input_biomass);
sum_power = sum (electricity_production);
sum_power = -1*sum_power;
end
41
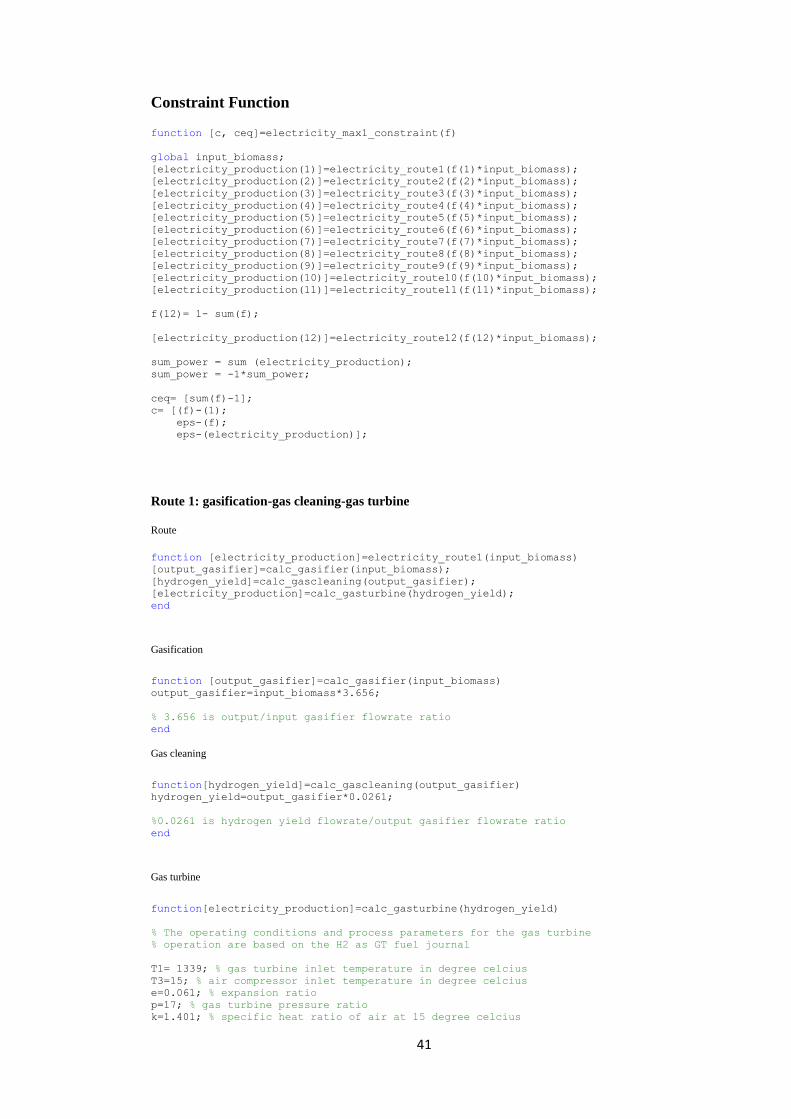
Constraint Function
function [c, ceq]=electricity_max1_constraint(f)
global input_biomass;
[electricity_production(1)]=electricity_route1(f(1)*input_biomass);
[electricity_production(2)]=electricity_route2(f(2)*input_biomass);
[electricity_production(3)]=electricity_route3(f(3)*input_biomass);
[electricity_production(4)]=electricity_route4(f(4)*input_biomass);
[electricity_production(5)]=electricity_route5(f(5)*input_biomass);
[electricity_production(6)]=electricity_route6(f(6)*input_biomass);
[electricity_production(7)]=electricity_route7(f(7)*input_biomass);
[electricity_production(8)]=electricity_route8(f(8)*input_biomass);
[electricity_production(9)]=electricity_route9(f(9)*input_biomass);
[electricity_production(10)]=electricity_route10(f(10)*input_biomass);
[electricity_production(11)]=electricity_route11(f(11)*input_biomass);
f(12)= 1- sum(f);
[electricity_production(12)]=electricity_route12(f(12)*input_biomass);
sum_power = sum (electricity_production);
sum_power = -1*sum_power;
ceq= [sum(f)-1];
c= [(f)-(1);
eps-(f);
eps-(electricity_production)];
Route 1: gasification-gas cleaning-gas turbine
Route
function [electricity_production]=electricity_route1(input_biomass)
[output_gasifier]=calc_gasifier(input_biomass);
[hydrogen_yield]=calc_gascleaning(output_gasifier);
[electricity_production]=calc_gasturbine(hydrogen_yield);
end
Gasification
function [output_gasifier]=calc_gasifier(input_biomass)
output_gasifier=input_biomass*3.656;
% 3.656 is output/input gasifier flowrate ratio
end
Gas cleaning
function[hydrogen_yield]=calc_gascleaning(output_gasifier)
hydrogen_yield=output_gasifier*0.0261;
%0.0261 is hydrogen yield flowrate/output gasifier flowrate ratio
end
Gas turbine
function[electricity_production]=calc_gasturbine(hydrogen_yield)
% The operating conditions and process parameters for the gas turbine
% operation are based on the H2 as GT fuel journal
T1= 1339; % gas turbine inlet temperature in degree celcius
T3=15; % air compressor inlet temperature in degree celcius
e=0.061; % expansion ratio
p=17; % gas turbine pressure ratio
k=1.401; % specific heat ratio of air at 15 degree celcius

42
m=1.332; % specific heat ratio of exhaust gases
nt=0.86; % efficiency of gas turbine (assumption)
nc=0.9; % efficiency of compressor (assumption)
LHV=121000; % lower heating value of hydrogen in kJ/kg from wikipedia
Ma=631.9; % mass flowrate of air in kg/s
Mf=hydrogen_yield; % mass flowrate of fuel gas(H2) in kg/s
Cpg= 1.15; %specific heat at constant pressure for flue gases
Cpa= 1.005; %specific heat at constant pressure for inlet air
t2= T1*(e^((m-1)/m));
T2= T1-(nt*(T1-t2)); % gas turbine outlet temperature in degree celcius
t4=T3*(p^((k-1)/k));
T4=((t4-T3)/nc)+ T3; % air compressor outlet temperature in degree celcius
Mg=Mf*LHV/(Cpg*(T1-T4)); % mass flowrate of gas in kg/s
Wc=Ma*Cpa*(T4-T3); % compression work
Wt=Mg*Cpg*(T1-T2); % electricity produce
Wn=Wt-Wc; % net electricity produce in kW
electricity_production=Wn
end
ROUTE 2: Gasification-gas cleaning-boiler-steam turbine
function [electricity_production]=electricity_route2(input_biomass)
[output_gasifier]=calc_gasifier(input_biomass);
[hydrogen_yield]=calc_gascleaning(output_gasifier);
[steam_production]=calc_boiler1(hydrogen_yield);
[electricity_production]=calc_steamturbine(steam_production);
end
Gasification
function [output_gasifier]=calc_gasifier(input_biomass)
output_gasifier=input_biomass*3.656;
% 3.656 is output/input gasifier flowrate ratio
end
Gas cleaning
function[hydrogen_yield]=calc_gascleaning(output_gasifier)
hydrogen_yield=output_gasifier*0.0261;
%0.0261 is hydrogen yield flowrate/output gasifier flowrate ratio
end
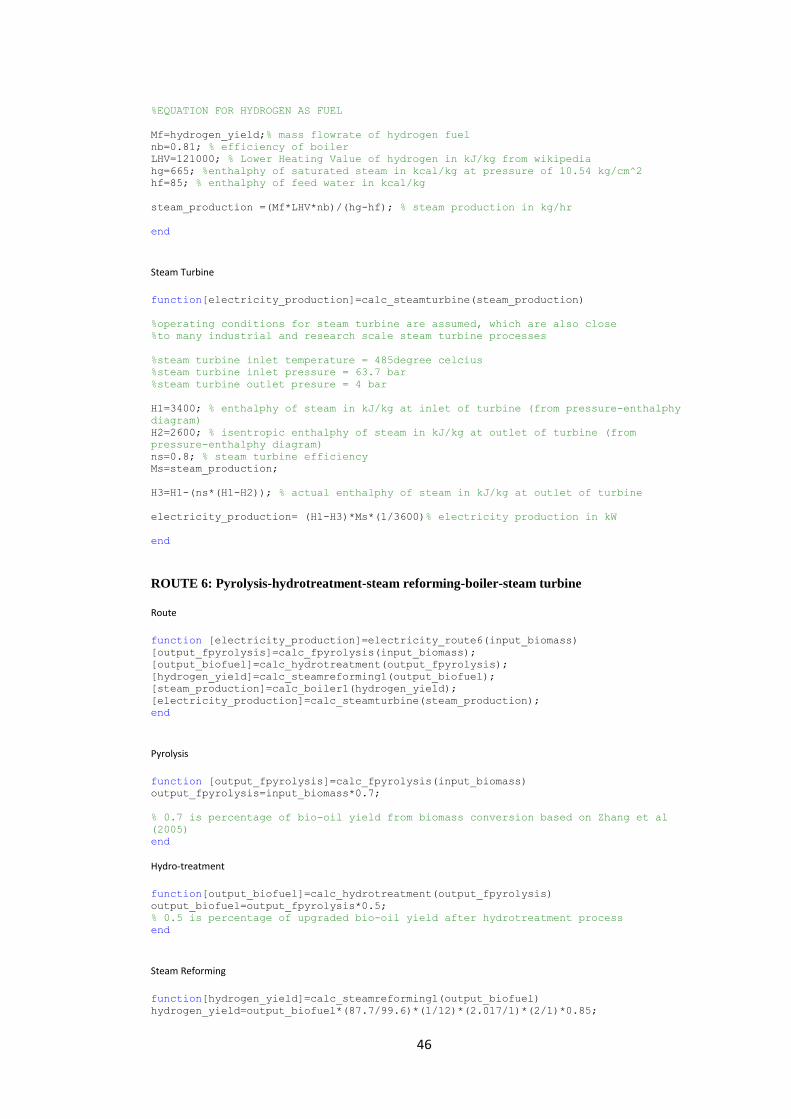
Boiler
function[steam_production]=calc_boiler1(hydrogen_yield)
%EQUATION FOR HYDROGEN AS FUEL
Mf=hydrogen_yield;% mass flowrate of hydrogen fuel
nb=0.81; % efficiency of boiler
LHV=121000; % Lower Heating Value of hydrogen in kJ/kg from wikipedia
hg=665; %enthalphy of saturated steam in kcal/kg at pressure of 10.54 kg/cm^2
hf=85; % enthalphy of feed water in kcal/kg
steam_production =(Mf*LHV*nb)/(hg-hf); % steam production in kg/hr
end
Steam Turbine
function[electricity_production]=calc_steamturbine(steam_production)

43
%operating conditions for steam turbine are assumed, which are also close
%to many industrial and research scale steam turbine processes
%steam turbine inlet temperature = 485degree celcius
%steam turbine inlet pressure = 63.7 bar
%steam turbine outlet presure = 4 bar
H1=3400; % enthalphy of steam in kJ/kg at inlet of turbine (from pressure-enthalphy
diagram)
H2=2600; % isentropic enthalphy of steam in kJ/kg at outlet of turbine (from
pressure-enthalphy diagram)
ns=0.8; % steam turbine efficiency
Ms=steam_production;
H3=H1-(ns*(H1-H2)); % actual enthalphy of steam in kJ/kg at outlet of turbine
electricity_production= (H1-H3)*Ms*(1/3600)% electricity production in kW
end
ROUTE 3: Pyrolysis-steam reforming-gas turbine
Route
function [electricity_production]=electricity_route3(input_biomass)
[output_fpyrolysis]=calc_fpyrolysis(input_biomass);
[hydrogen_yield]=calc_steamreforming(output_fpyrolysis);
[electricity_production]=calc_gasturbine(hydrogen_yield);
end
Pyrolysis
function [output_fpyrolysis]=calc_fpyrolysis(input_biomass)
output_fpyrolysis=input_biomass*0.7;
% 0.7 is percentage of bio-oil yield from biomass conversion based on Zhang et al
(2005)
end
Steam Reforming
function[hydrogen_yield]=calc_steamreforming(output_fpyrolysis)
hydrogen_yield=output_fpyrolysis*(60.4/109.1)*(1/12)*(1.365/1)*(2/1)*0.85;
% hydrogen yield in kg/hr
% weight percentage(wt%) of bio-oil or output fpyrolysis is C=60.4,H=6.9,O=41.8
% 60.4/109.1 is ratio of wt% of C per total wt% of bio-oil
% 1.365 is mole of H2 produced per mole of C in the feed
% 0.85 is percentage yield of H2 of the stoichiometric value based on Wang
% et al (1998)
end
Gas turbine
function[electricity_production]=calc_gasturbine(hydrogen_yield)
% The operating conditions and process parameters for the gas turbine
% operation are based on the H2 as GT fuel journal
T1= 1339; % gas turbine inlet temperature in degree celcius
T3=15; % air compressor inlet temperature in degree celcius
e=0.061; % expansion ratio
p=17; % gas turbine pressure ratio
k=1.401; % specific heat ratio of air at 15 degree celcius
m=1.332; % specific heat ratio of exhaust gases

44
nt=0.86; % efficiency of gas turbine (assumption)
nc=0.9; % efficiency of compressor (assumption)
LHV=121000; % lower heating value of hydrogen in kJ/kg from wikipedia
Ma=631.9; % mass flowrate of air in kg/s
Mf=hydrogen_yield; % mass flowrate of fuel gas(H2) in kg/s
Cpg= 1.15; %specific heat at constant pressure for flue gases
Cpa= 1.005; %specific heat at constant pressure for inlet air
t2= T1*(e^((m-1)/m));
T2= T1-(nt*(T1-t2)); % gas turbine outlet temperature in degree celcius
t4=T3*(p^((k-1)/k));
T4=((t4-T3)/nc)+ T3; % air compressor outlet temperature in degree celcius
Mg=Mf*LHV/(Cpg*(T1-T4)); % mass flowrate of gas in kg/s
Wc=Ma*Cpa*(T4-T3); % compression work
Wt=Mg*Cpg*(T1-T2); % electricity produce
Wn=Wt-Wc; % net electricity produce in kW
electricity_production=Wn
end
ROUTE 4: Pyrolysis-hydrotreatment-steam reforming-gas turbine
Route
function [electricity_production]=electricity_route4(input_biomass)
[output_fpyrolysis]=calc_fpyrolysis(input_biomass);
[output_biofuel]=calc_hydrotreatment(output_fpyrolysis);
[hydrogen_yield]=calc_steamreforming1(output_biofuel);
[electricity_production]=calc_gasturbine(hydrogen_yield);
end
Pyrolysis
function [output_fpyrolysis]=calc_fpyrolysis(input_biomass)
output_fpyrolysis=input_biomass*0.7;
% 0.7 is percentage of bio-oil yield from biomass conversion based on Zhang et al
(2005)
end
Hydro-treatment
function[output_biofuel]=calc_hydrotreatment(output_fpyrolysis)
output_biofuel=output_fpyrolysis*0.5;
% 0.5 is percentage of upgraded bio-oil yield after hydrotreatment process
end
Steam Reforming
function[hydrogen_yield]=calc_steamreforming1(output_biofuel)
hydrogen_yield=output_biofuel*(87.7/99.6)*(1/12)*(2.017/1)*(2/1)*0.85;
% hydrogen yield in kg/hr
% weight percentage(wt%) of upgraded bio-oil is C=87.7,H=8.9,O=3
% 87.7/99.6 is ratio of wt% of C per total wt% of upgraded bio-oil
% 2.017 is mole of H2 produced per mole of C in the feed
% 0.85 is percentage yield of H2 of the stoichiometric value based on Wang
% et al (1998)
end
Gas Turbine
function[electricity_production]=calc_gasturbine(hydrogen_yield)

45
% The operating conditions and process parameters for the gas turbine
% operation are based on the H2 as GT fuel journal
T1= 1339; % gas turbine inlet temperature in degree celcius
T3=15; % air compressor inlet temperature in degree celcius
e=0.061; % expansion ratio
p=17; % gas turbine pressure ratio
k=1.401; % specific heat ratio of air at 15 degree celcius
m=1.332; % specific heat ratio of exhaust gases
nt=0.86; % efficiency of gas turbine (assumption)
nc=0.9; % efficiency of compressor (assumption)
LHV=121000; % lower heating value of hydrogen in kJ/kg from wikipedia
Ma=631.9; % mass flowrate of air in kg/s
Mf=hydrogen_yield; % mass flowrate of fuel gas(H2) in kg/s
Cpg= 1.15; %specific heat at constant pressure for flue gases
Cpa= 1.005; %specific heat at constant pressure for inlet air
t2= T1*(e^((m-1)/m));
T2= T1-(nt*(T1-t2)); % gas turbine outlet temperature in degree celcius
t4=T3*(p^((k-1)/k));
T4=((t4-T3)/nc)+ T3; % air compressor outlet temperature in degree celcius
Mg=Mf*LHV/(Cpg*(T1-T4)); % mass flowrate of gas in kg/s
Wc=Ma*Cpa*(T4-T3); % compression work
Wt=Mg*Cpg*(T1-T2); % electricity produce
Wn=Wt-Wc; % net electricity produce in kW
electricity_production=Wn
end
ROUTE 5: Pyrolysis-steam reforming-boiler-steam turbine
Route
function [electricity_production]=electricity_route5(input_biomass)
[output_fpyrolysis]=calc_fpyrolysis(input_biomass);
[hydrogen_yield]=calc_steamreforming(output_fpyrolysis);
[steam_production]=calc_boiler1(hydrogen_yield);
[electricity_production]=calc_steamturbine(steam_production);
end
Pyrolysis
function [output_fpyrolysis]=calc_fpyrolysis(input_biomass)
output_fpyrolysis=input_biomass*0.7;
% 0.7 is percentage of bio-oil yield from biomass conversion based on Zhang et al
(2005)
end
Steam Reforming
function[hydrogen_yield]=calc_steamreforming(output_fpyrolysis)
hydrogen_yield=output_fpyrolysis*(60.4/109.1)*(1/12)*(1.365/1)*(2/1)*0.85;
% hydrogen yield in kg/hr
% weight percentage(wt%) of bio-oil or output fpyrolysis is C=60.4,H=6.9,O=41.8
% 60.4/109.1 is ratio of wt% of C per total wt% of bio-oil
% 1.365 is mole of H2 produced per mole of C in the feed
% 0.85 is percentage yield of H2 of the stoichiometric value based on Wang
% et al (1998)
end
Boiler
function[steam_production]=calc_boiler1(hydrogen_yield)
46
%EQUATION FOR HYDROGEN AS FUEL
Mf=hydrogen_yield;% mass flowrate of hydrogen fuel
nb=0.81; % efficiency of boiler
LHV=121000; % Lower Heating Value of hydrogen in kJ/kg from wikipedia
hg=665; %enthalphy of saturated steam in kcal/kg at pressure of 10.54 kg/cm^2
hf=85; % enthalphy of feed water in kcal/kg
steam_production =(Mf*LHV*nb)/(hg-hf); % steam production in kg/hr
end
Steam Turbine
function[electricity_production]=calc_steamturbine(steam_production)
%operating conditions for steam turbine are assumed, which are also close
%to many industrial and research scale steam turbine processes
%steam turbine inlet temperature = 485degree celcius
%steam turbine inlet pressure = 63.7 bar
%steam turbine outlet presure = 4 bar
H1=3400; % enthalphy of steam in kJ/kg at inlet of turbine (from pressure-enthalphy
diagram)
H2=2600; % isentropic enthalphy of steam in kJ/kg at outlet of turbine (from
pressure-enthalphy diagram)
ns=0.8; % steam turbine efficiency
Ms=steam_production;
H3=H1-(ns*(H1-H2)); % actual enthalphy of steam in kJ/kg at outlet of turbine
electricity_production= (H1-H3)*Ms*(1/3600)% electricity production in kW
end
ROUTE 6: Pyrolysis-hydrotreatment-steam reforming-boiler-steam turbine
Route
function [electricity_production]=electricity_route6(input_biomass)
[output_fpyrolysis]=calc_fpyrolysis(input_biomass);
[output_biofuel]=calc_hydrotreatment(output_fpyrolysis);
[hydrogen_yield]=calc_steamreforming1(output_biofuel);
[steam_production]=calc_boiler1(hydrogen_yield);
[electricity_production]=calc_steamturbine(steam_production);
end
Pyrolysis
function [output_fpyrolysis]=calc_fpyrolysis(input_biomass)
output_fpyrolysis=input_biomass*0.7;
% 0.7 is percentage of bio-oil yield from biomass conversion based on Zhang et al
(2005)
end
Hydro-treatment
function[output_biofuel]=calc_hydrotreatment(output_fpyrolysis)
output_biofuel=output_fpyrolysis*0.5;
% 0.5 is percentage of upgraded bio-oil yield after hydrotreatment process
end
Steam Reforming
function[hydrogen_yield]=calc_steamreforming1(output_biofuel)
hydrogen_yield=output_biofuel*(87.7/99.6)*(1/12)*(2.017/1)*(2/1)*0.85;

47
% hydrogen yield in kg/hr
% weight percentage(wt%) of upgraded bio-oil is C=87.7,H=8.9,O=3
% 87.7/99.6 is ratio of wt% of C per total wt% of upgraded bio-oil
% 2.017 is mole of H2 produced per mole of C in the feed
% 0.85 is percentage yield of H2 of the stoichiometric value based on Wang
% et al (1998)
end
Boiler
function[steam_production]=calc_boiler1(hydrogen_yield)
%EQUATION FOR HYDROGEN AS FUEL
Mf=hydrogen_yield;% mass flowrate of hydrogen fuel
nb=0.81; % efficiency of boiler
LHV=121000; % Lower Heating Value of hydrogen in kJ/kg from wikipedia
hg=665; %enthalphy of saturated steam in kcal/kg at pressure of 10.54 kg/cm^2
hf=85; % enthalphy of feed water in kcal/kg
steam_production =(Mf*LHV*nb)/(hg-hf); % steam production in kg/hr
end
Steam Turbine
function[electricity_production]=calc_steamturbine(steam_production)
%operating conditions for steam turbine are assumed, which are also close
%to many industrial and research scale steam turbine processes
%steam turbine inlet temperature = 485degree celcius
%steam turbine inlet pressure = 63.7 bar
%steam turbine outlet presure = 4 bar
H1=3400; % enthalphy of steam in kJ/kg at inlet of turbine (from pressure-enthalphy
diagram)
H2=2600; % isentropic enthalphy of steam in kJ/kg at outlet of turbine (from
pressure-enthalphy diagram)
ns=0.8; % steam turbine efficiency
Ms=steam_production;
H3=H1-(ns*(H1-H2)); % actual enthalphy of steam in kJ/kg at outlet of turbine
electricity_production= (H1-H3)*Ms*(1/3600)% electricity production in kW
end
ROUTE 7: Pyrolysis-hydrotreatment-gas turbine
Route
function [electricity_production]=electricity_route7(input_biomass)
[output_fpyrolysis]=calc_fpyrolysis(input_biomass);
[output_biofuel]=calc_hydrotreatment(output_fpyrolysis);
[electricity_production]=calc_gasturbine2(output_biofuel);
end
Pyrolysis
function [output_fpyrolysis]=calc_fpyrolysis(input_biomass)
output_fpyrolysis=input_biomass*0.7;
% 0.7 is percentage of bio-oil yield from biomass conversion based on Zhang et al
(2005)
end

48
Hydro-treatment
function[output_biofuel]=calc_hydrotreatment(output_fpyrolysis)
output_biofuel=output_fpyrolysis*0.5;
% 0.5 is percentage of upgraded bio-oil yield after hydrotreatment process
end
Gas Turbine
function[electricity_production]=calc_gasturbine2(output_biofuel)
T1= 1339; % gas turbine inlet temperature in degree celcius
T3=15; % air compressor inlet temperature in degree celcius
e=0.061; % expansion ratio
p=17; % gas turbine pressure ratio (PI/P2)
k=1.401; % specific heat ratio of air at 15 degree celcius
m=1.332; % specific heat ratio of exhaust gases
nt=0.86; % efficiency of gas turbine (assumption)
nc=0.9; % efficiency of compressor (assumption)
LHV=45000; % lower heating value of biofuel in kJ/kg (assumption)
Ma=631.9; % mass flowrate of air in kg/s
Mf=output_biofuel; % mass flowrate of biofuel gas in kg/s
Cpg= 1.15; %specific heat at constant pressure for flue gases
Cpa= 1.005; %specific heat at constant pressure for inlet air
t2= T1*(e^((m-1)/m));
T2= T1-(nt*(T1-t2)); % gas turbine outlet temperature in degree celcius
t4=T3*(p^((k-1)/k));
T4=((t4-T3)/nc)+ T3; % air compressor outlet temperature in degree celcius
Mg=Mf*LHV/(Cpg*(T1-T4));% mass flowrate of gas in kg/s
Wc=Ma*Cpa*(T4-T3); % compression work
Wt=Mg*Cpg*(T1-T2); % electricity produce
Wn=Wt-Wc; % net electricity produce in kW
electricity_production=Wn
end
ROUTE 8: Pyrolysis-hydrotreatment-boiler-steam turbine
Route
function [electricity_production]=electricity_route8(input_biomass)
[output_fpyrolysis]=calc_fpyrolysis(input_biomass);
[output_biofuel]=calc_hydrotreatment(output_fpyrolysis);
[steam_production]=calc_boiler2(output_biofuel);
[electricity_production]=calc_steamturbine(steam_production);
end
Pyrolysis
function [output_fpyrolysis]=calc_fpyrolysis(input_biomass)
output_fpyrolysis=input_biomass*0.7;
% 0.7 is percentage of bio-oil yield from biomass conversion based on Zhang et al
(2005)
end
Hydro-treatment
function[output_biofuel]=calc_hydrotreatment(output_fpyrolysis)
output_biofuel=output_fpyrolysis*0.5;
% 0.5 is percentage of upgraded bio-oil yield after hydrotreatment process
end
Boiler

49
function[steam_production]=calc_boiler2(output_biofuel)
%EQUATION FOR BIOFUEL AS FUEL
Mf=output_biofuel;% mass flowrate of fuel
nb=0.81; % efficiency of boiler
LHV=45000; % Lower Heating Value of biofuel in kJ/kg
hg=665; %enthalphy of saturated steam in kcal/kg at pressure of 10.54 kg/cm^2
hf=85; % enthalphy of feed water in kcal/kg
steam_production =(Mf*LHV*nb)/(hg-hf);
end
Steam Turbine
function[electricity_production]=calc_steamturbine(steam_production)
%operating conditions for steam turbine are assumed, which are also close
%to many industrial and research scale steam turbine processes
%steam turbine inlet temperature = 485degree celcius
%steam turbine inlet pressure = 63.7 bar
%steam turbine outlet presure = 4 bar
H1=3400; % enthalphy of steam in kJ/kg at inlet of turbine (from pressure-enthalphy
diagram)
H2=2600; % isentropic enthalphy of steam in kJ/kg at outlet of turbine (from
pressure-enthalphy diagram)
ns=0.8; % steam turbine efficiency
Ms=steam_production;
H3=H1-(ns*(H1-H2)); % actual enthalphy of steam in kJ/kg at outlet of turbine
electricity_production= (H1-H3)*Ms*(1/3600)% electricity production in kW
end
ROUTE 9: Biomass-boiler-steam turbine (direct combustion)
Route
function [electricity_production]=electricity_route9(input_biomass)
[steam_production]=calc_boiler(input_biomass);
[electricity_production]=calc_steamturbine(steam_production);
end
Boiler
function[steam_production]=calc_boiler(input_biomass)
%EQUATION FOR DIRECT COMBUSTION
Mf=input_biomass;% mass flowrate of biomass as fuel
nb=0.81; % efficiency of boiler
GCV=15000; % Gross Caloric Value of biomass(wood)in kJ/kg
hg=665; %enthalphy of saturated steam in kcal/kg at pressure of 10.54 kg/cm^2
hf=85; % enthalphy of feed water in kcal/kg
steam_production =(Mf*GCV*nb)/(hg-hf); % steam production in kg/hr
end
Steam Turbine
function[electricity_production]=calc_steamturbine(steam_production)
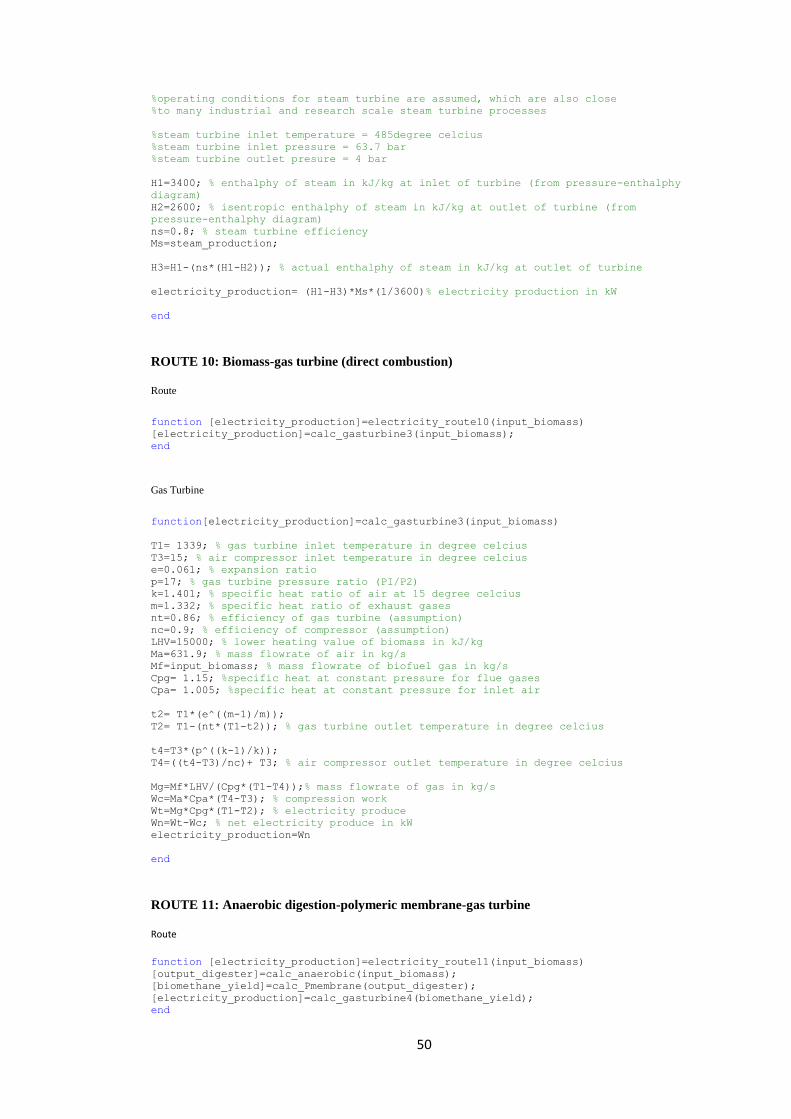
50
%operating conditions for steam turbine are assumed, which are also close
%to many industrial and research scale steam turbine processes
%steam turbine inlet temperature = 485degree celcius
%steam turbine inlet pressure = 63.7 bar
%steam turbine outlet presure = 4 bar
H1=3400; % enthalphy of steam in kJ/kg at inlet of turbine (from pressure-enthalphy
diagram)
H2=2600; % isentropic enthalphy of steam in kJ/kg at outlet of turbine (from
pressure-enthalphy diagram)
ns=0.8; % steam turbine efficiency
Ms=steam_production;
H3=H1-(ns*(H1-H2)); % actual enthalphy of steam in kJ/kg at outlet of turbine
electricity_production= (H1-H3)*Ms*(1/3600)% electricity production in kW
end
ROUTE 10: Biomass-gas turbine (direct combustion)
Route
function [electricity_production]=electricity_route10(input_biomass)
[electricity_production]=calc_gasturbine3(input_biomass);
end
Gas Turbine
function[electricity_production]=calc_gasturbine3(input_biomass)
T1= 1339; % gas turbine inlet temperature in degree celcius
T3=15; % air compressor inlet temperature in degree celcius
e=0.061; % expansion ratio
p=17; % gas turbine pressure ratio (PI/P2)
k=1.401; % specific heat ratio of air at 15 degree celcius
m=1.332; % specific heat ratio of exhaust gases
nt=0.86; % efficiency of gas turbine (assumption)
nc=0.9; % efficiency of compressor (assumption)
LHV=15000; % lower heating value of biomass in kJ/kg
Ma=631.9; % mass flowrate of air in kg/s
Mf=input_biomass; % mass flowrate of biofuel gas in kg/s
Cpg= 1.15; %specific heat at constant pressure for flue gases
Cpa= 1.005; %specific heat at constant pressure for inlet air
t2= T1*(e^((m-1)/m));
T2= T1-(nt*(T1-t2)); % gas turbine outlet temperature in degree celcius
t4=T3*(p^((k-1)/k));
T4=((t4-T3)/nc)+ T3; % air compressor outlet temperature in degree celcius
Mg=Mf*LHV/(Cpg*(T1-T4));% mass flowrate of gas in kg/s
Wc=Ma*Cpa*(T4-T3); % compression work
Wt=Mg*Cpg*(T1-T2); % electricity produce
Wn=Wt-Wc; % net electricity produce in kW
electricity_production=Wn
end
ROUTE 11: Anaerobic digestion-polymeric membrane-gas turbine
Route
function [electricity_production]=electricity_route11(input_biomass)
[output_digester]=calc_anaerobic(input_biomass);
[biomethane_yield]=calc_Pmembrane(output_digester);
[electricity_production]=calc_gasturbine4(biomethane_yield);
end
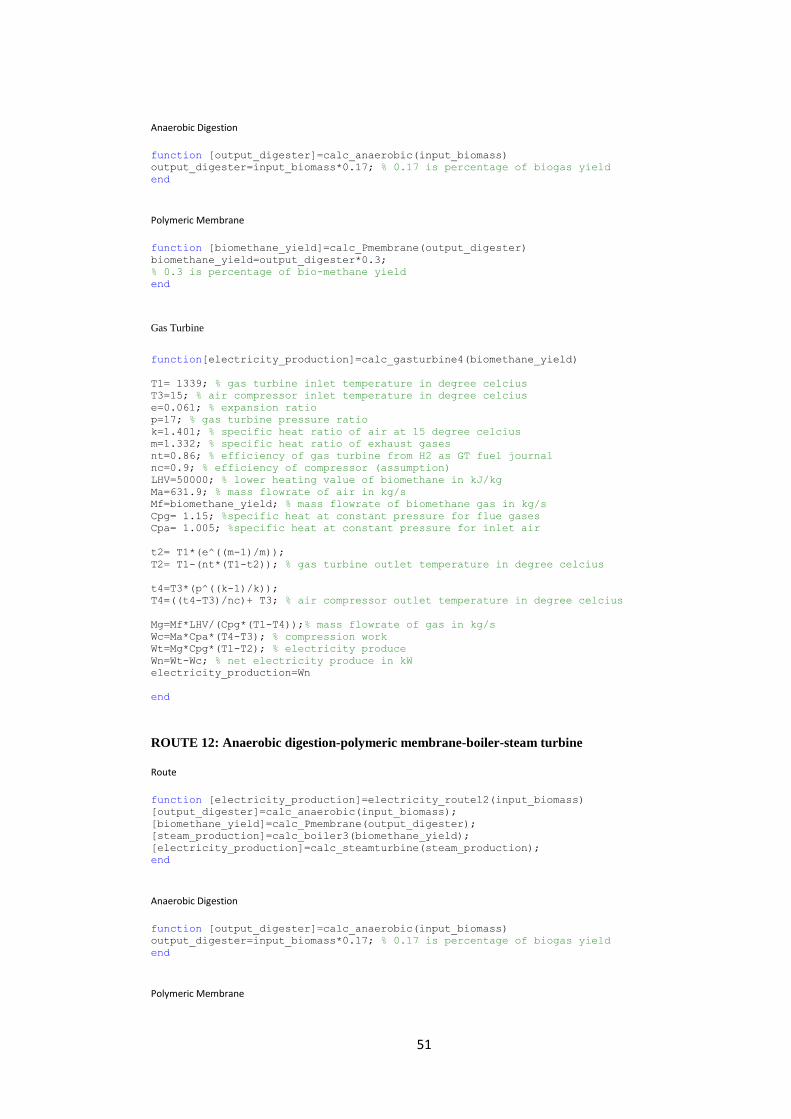
51
Anaerobic Digestion
function [output_digester]=calc_anaerobic(input_biomass)
output_digester=input_biomass*0.17; % 0.17 is percentage of biogas yield
end
Polymeric Membrane
function [biomethane_yield]=calc_Pmembrane(output_digester)
biomethane_yield=output_digester*0.3;
% 0.3 is percentage of bio-methane yield
end
Gas Turbine
function[electricity_production]=calc_gasturbine4(biomethane_yield)
T1= 1339; % gas turbine inlet temperature in degree celcius
T3=15; % air compressor inlet temperature in degree celcius
e=0.061; % expansion ratio
p=17; % gas turbine pressure ratio
k=1.401; % specific heat ratio of air at 15 degree celcius
m=1.332; % specific heat ratio of exhaust gases
nt=0.86; % efficiency of gas turbine from H2 as GT fuel journal
nc=0.9; % efficiency of compressor (assumption)
LHV=50000; % lower heating value of biomethane in kJ/kg
Ma=631.9; % mass flowrate of air in kg/s
Mf=biomethane_yield; % mass flowrate of biomethane gas in kg/s
Cpg= 1.15; %specific heat at constant pressure for flue gases
Cpa= 1.005; %specific heat at constant pressure for inlet air
t2= T1*(e^((m-1)/m));
T2= T1-(nt*(T1-t2)); % gas turbine outlet temperature in degree celcius
t4=T3*(p^((k-1)/k));
T4=((t4-T3)/nc)+ T3; % air compressor outlet temperature in degree celcius
Mg=Mf*LHV/(Cpg*(T1-T4));% mass flowrate of gas in kg/s
Wc=Ma*Cpa*(T4-T3); % compression work
Wt=Mg*Cpg*(T1-T2); % electricity produce
Wn=Wt-Wc; % net electricity produce in kW
electricity_production=Wn
end
ROUTE 12: Anaerobic digestion-polymeric membrane-boiler-steam turbine
Route
function [electricity_production]=electricity_route12(input_biomass)
[output_digester]=calc_anaerobic(input_biomass);
[biomethane_yield]=calc_Pmembrane(output_digester);
[steam_production]=calc_boiler3(biomethane_yield);
[electricity_production]=calc_steamturbine(steam_production);
end
Anaerobic Digestion
function [output_digester]=calc_anaerobic(input_biomass)
output_digester=input_biomass*0.17; % 0.17 is percentage of biogas yield
end
Polymeric Membrane

52
function [biomethane_yield]=calc_Pmembrane(output_digester)
biomethane_yield=output_digester*0.3;
% 0.3 is percentage of bio-methane yield
end
Boiler
function[steam_production]=calc_boiler3(biomethane_yield)
%EQUATION FOR BIOMETHANE AS FUEL
Mf=biomethane_yield; % mass flowrate of hydrogen fuel
nb=0.81; % efficiency of boiler
LHV=50000; % Lower Heating Value of biomethane in kJ/kg from wikipedia
hg=665; %enthalphy of saturated steam in kcal/kg at pressure of 10.54 kg/cm^2
hf=85; % enthalphy of feed water in kcal/kg
steam_production =(Mf*LHV*nb)/(hg-hf);% steam production in kg/hr
end
Steam Turbine
function[electricity_production]=calc_steamturbine(steam_production)
%operating conditions for steam turbine are assumed, which are also close
%to many industrial and research scale steam turbine processes
%steam turbine inlet temperature = 485degree celcius
%steam turbine inlet pressure = 63.7 bar
%steam turbine outlet presure = 4 bar
H1=3400; % enthalphy of steam in kJ/kg at inlet of turbine (from pressure-enthalphy
diagram)
H2=2600; % isentropic enthalphy of steam in kJ/kg at outlet of turbine (from
pressure-enthalphy diagram)
ns=0.8; % steam turbine efficiency
Ms=steam_production;
H3=H1-(ns*(H1-H2)); % actual enthalphy of steam in kJ/kg at outlet of turbine
electricity_production= (H1-H3)*Ms*(1/3600)% electricity production in kW
end
Top Related