


Languages
Pages
Legal

Modelling Motorway Emissions
28 November 2012
Mark ChapmanTechnical Director (Air Quality)
2Bureau Veritas Presentation
Introduction
► Roads → Carriageways → Lanes
► Emission Profiles
Background, Default Assumptions, Lane by Lane Approach
► Model Verification and Adjustment Factors
► Impact Assessment
Managed Motorways, Concentration Profiles, Influence on Results, Considerations and Caveats

3Bureau Veritas Presentation
Roads Carriageways Lanes
► Roads Single Line Emission Source
W1 E1

4Bureau Veritas Presentation
Roads Carriageways Lanes
► 3 Lane Carriageway vs. 3 Lane by Lane
WHS W3 W1 CR E1 E3 EHSW2 E2
CRWHS EHSE2 E3E1W3 W2 W1

5Bureau Veritas Presentation
Emission Profiles: Background
► Local CCTV Observation Explained: Part 1
Asymmetrical distribution of Flow across carriageway:
• 25% of Lane 1 (Inside Lane) total
• 29% of Lane 2 (Middle Lane) total
• 46% of Lane 3 (Outside Lane) total
Asymmetrical distribution of HGVs across carriageway:
• 5% of Lane 1 (Inside Lane) total
• 42% of Lane 2 (Middle Lane) total
• 53% of Lane 3 (Outside Lane) total
6Bureau Veritas Presentation
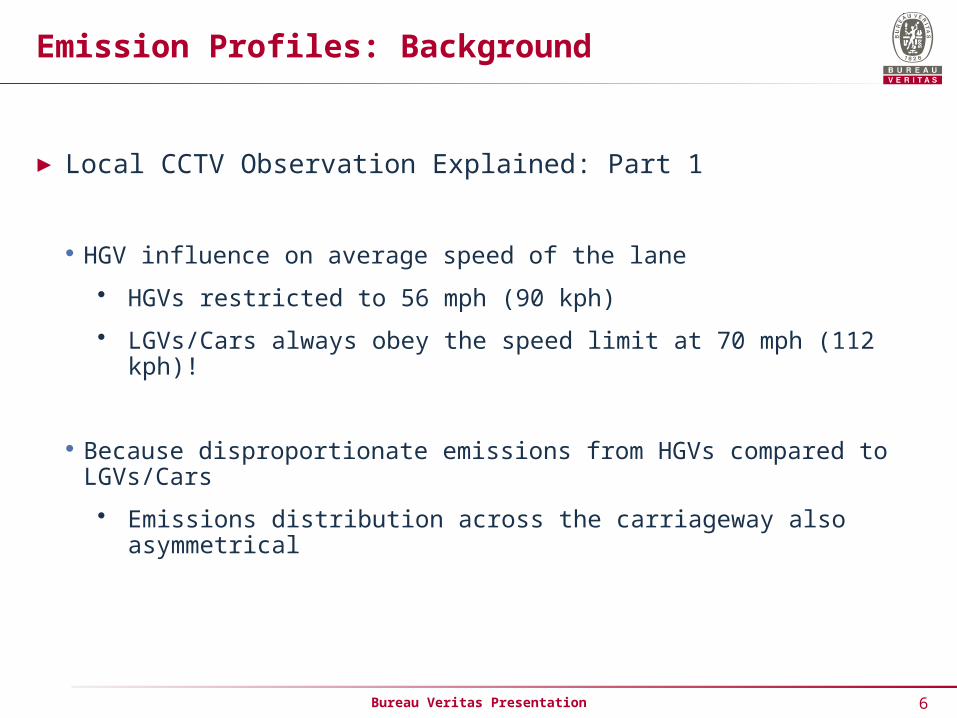
Emission Profiles: Background
► Local CCTV Observation Explained: Part 1
HGV influence on average speed of the lane
• HGVs restricted to 56 mph (90 kph)
• LGVs/Cars always obey the speed limit at 70 mph (112 kph)!
Because disproportionate emissions from HGVs compared to LGVs/Cars
• Emissions distribution across the carriageway also asymmetrical
7Bureau Veritas Presentation
0%
10%
20%
30%
40%
50%
60%
WHS W3 W2 W1 CR E1 E2 E3 EHS
Pe
rce
nta
ge
Lane
3 Lane Carriageway 3 Lane by Lane
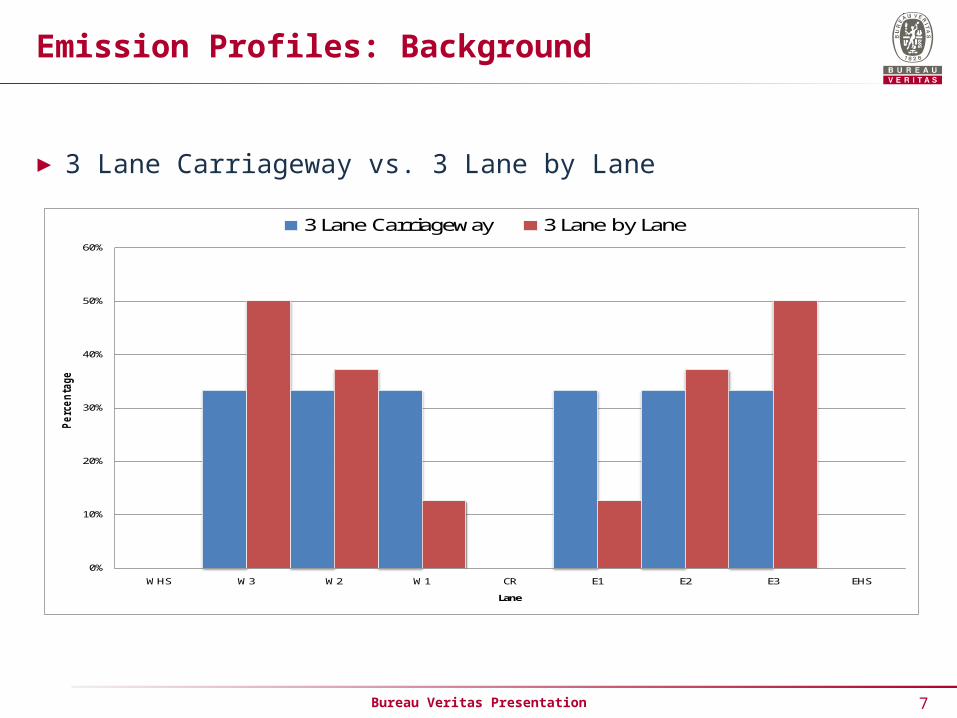
Emission Profiles: Background
► 3 Lane Carriageway vs. 3 Lane by Lane

8Bureau Veritas Presentation
Emission Profiles: Background
► Local CCTV Observation Explained: Part 2
3 Lanes
• Volume and composition of vehicles were unevenly distributed across all lanes
4 Lanes
• Volume and composition of vehicles were also unevenly distributed across all lanes
• Vehicles tended to remain in the same lane when a 4th Lane was available
• Shift in vehicles from Lane 3 to Lane 4 when available
• Assumed to be because vehicles were getting off at the next junction
9Bureau Veritas Presentation
0%
10%
20%
30%
40%
50%
60%
WHS W3 W2 W1 CR E1 E2 E3 EHS
Pe
rce
nta
ge
Lane
3 Lane Carriageway 4 Lane Carriageway
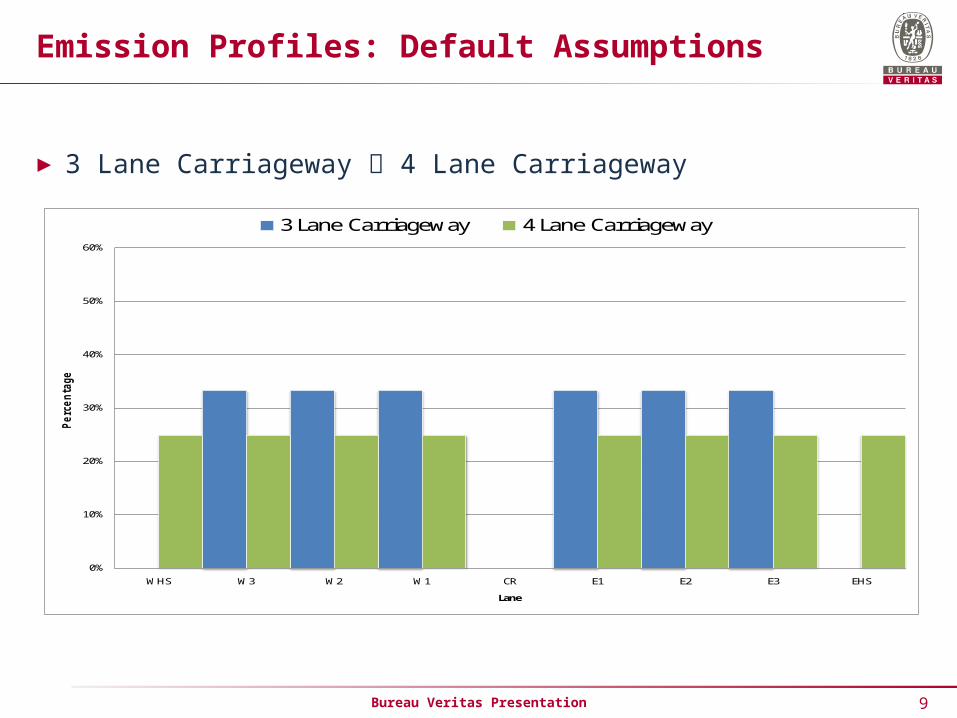
Emission Profiles: Default Assumptions
► 3 Lane Carriageway 4 Lane Carriageway

10Bureau Veritas Presentation
Emission Profiles: Lane by Lane Approach
► 3 Lane by Lane 4 Lane by Lane

11Bureau Veritas Presentation
Emission Profiles: Lane by Lane Approach
► 3 Lane by Lane 4 Lane by Lane
12Bureau Veritas Presentation
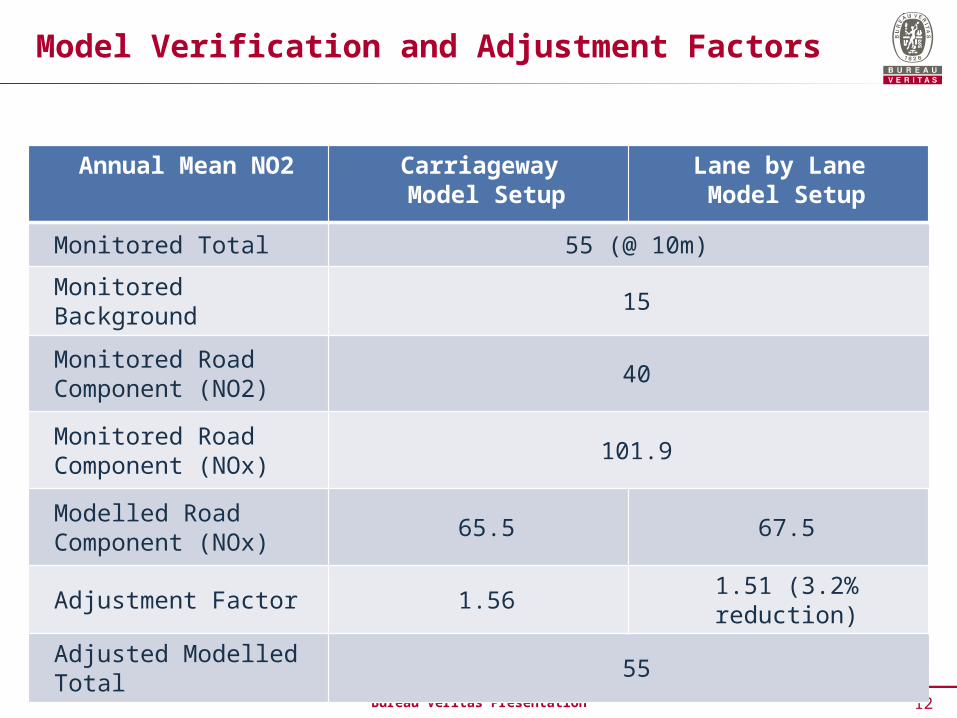
Model Verification and Adjustment Factors
Annual Mean NO2 Carriageway Model Setup
Lane by Lane Model Setup
Monitored Total 55 (@ 10m)
Monitored Background 15
Monitored Road Component (NO2) 40
Monitored Road Component (NOx) 101.9
Modelled Road Component (NOx) 65.5 67.5
Adjustment Factor 1.56 1.51 (3.2% reduction)
Adjusted Modelled Total 55

13Bureau Veritas Presentation
Impact Assessment: Managed Motorways
► Aim: Increase motorway capacity to manage increased demand for use
► CALR4 Continuous All Lane Running
4 Lanes [3 + Hard Shoulder] Open Continuously
► HSR Hard Shoulder Running
Managed use of Hard Shoulder during peak demand periods
Typically AM Peak, Inter-Peak and PM Peak; c.12 hrs of operation
14Bureau Veritas Presentation
37
42
47
52
57
62
67
72
77
82
0 1 2 3 4 5 6 7 8 9 10 11 12 13 14 15 16 17 18 19 20 21 22 23 24 25 26 27 28 29 30 31 32 33
Co
nce
ntr
ati
on
(u
g/m
3)
Distance from Kerb (m)
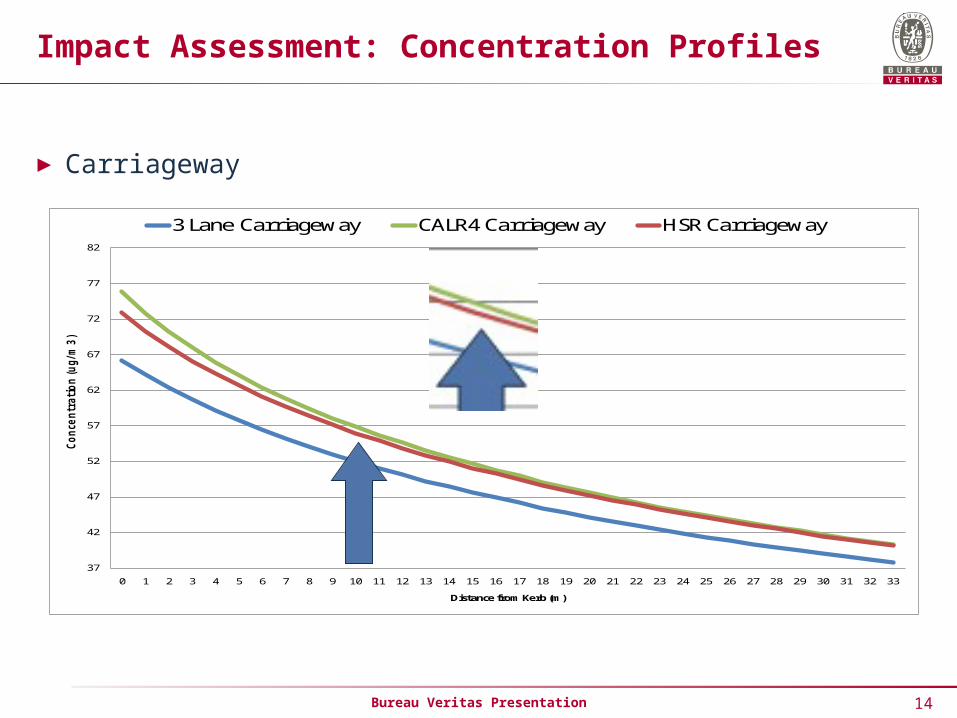
3 Lane Carriageway CALR4 Carriageway HSR Carriageway
Impact Assessment: Concentration Profiles
► Carriageway

15Bureau Veritas Presentation
37
42
47
52
57
62
67
72
77
82
0 1 2 3 4 5 6 7 8 9 10 11 12 13 14 15 16 17 18 19 20 21 22 23 24 25 26 27 28 29 30 31 32 33
Co
nce
ntr
ati
on
(u
g/m
3)
Distance from Kerb (m)
3 Lane by Lane CALR4 Lane by Lane HSR Lane by Lane
Impact Assessment: Concentration Profiles
► Lane by Lane
16Bureau Veritas Presentation
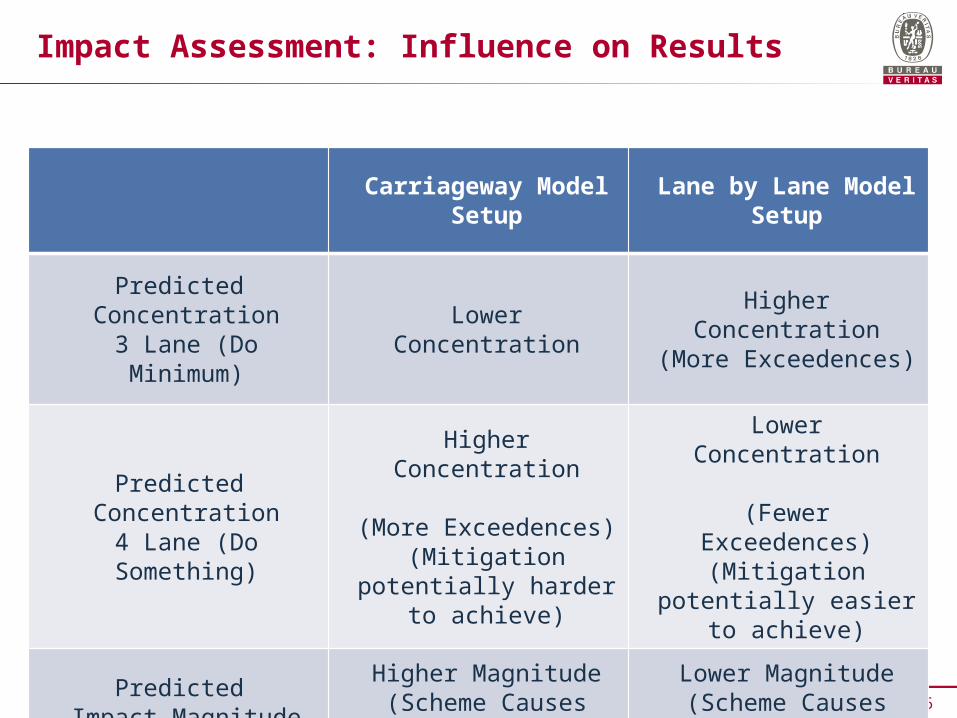
Impact Assessment: Influence on Results
Carriageway Model Setup
Lane by Lane Model Setup
Predicted Concentration
3 Lane (Do Minimum)Lower Concentration Higher Concentration
(More Exceedences)
Predicted Concentration
4 Lane (Do Something)
Higher Concentration
(More Exceedences)(Mitigation potentially
harder to achieve)
Lower Concentration
(Fewer Exceedences)(Mitigation potentially
easier to achieve)
Predicted Impact Magnitude
Higher Magnitude(Scheme Causes More
Exceedences)
Lower Magnitude(Scheme Causes Fewer
Exceedences)
17Bureau Veritas Presentation
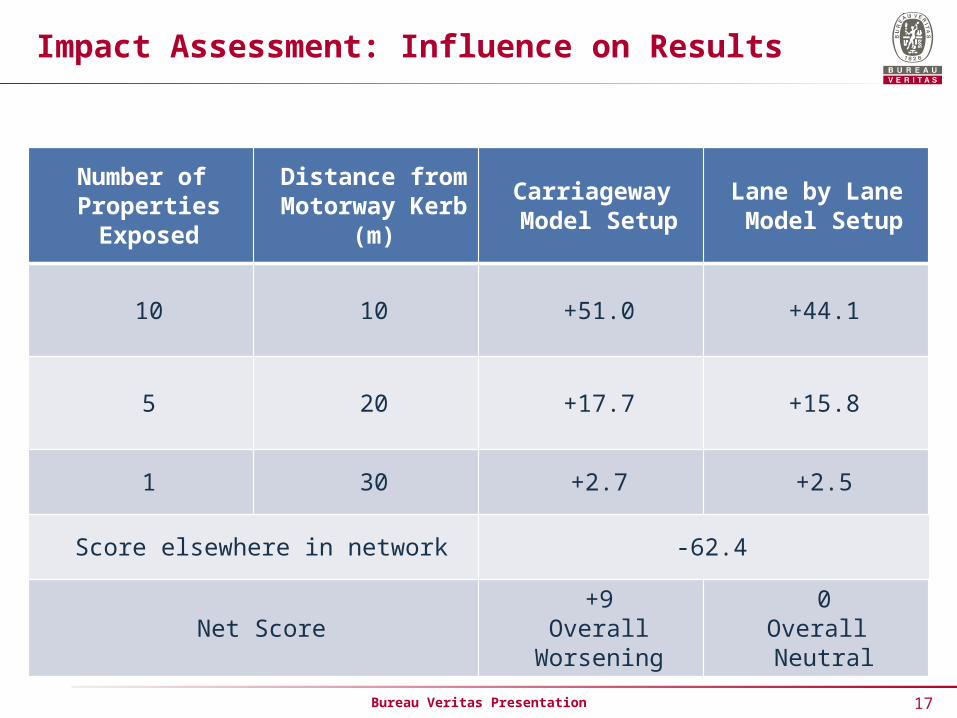
Impact Assessment: Influence on Results
Number of Properties Exposed
Distance from Motorway Kerb
(m)
Carriageway Model Setup
Lane by Lane Model Setup
10 10 +51.0 +44.1
5 20 +17.7 +15.8
1 30 +2.7 +2.5
Score elsewhere in network -62.4
Net Score+9
Overall Worsening
0Overall Neutral

18Bureau Veritas Presentation
Considerations and Caveats
► Influence of exhaust emission height Default vs. Lane by Lane variation - Adjustable within ADMS-Roads?
► Investigate influence coupled with temporal profiling: AM, IP, PM and OP traffic characteristics adjustment
► Dependent on local lane by lane traffic characteristics More survey data required
► Anyone seeking to Model Motorways for the Highways Agency should seek guidance from HA Air Quality Advisor
19Bureau Veritas Presentation
Highways Agency: Significance Criteria Update
► Highways Agency Business Objective Net Score
“The Highways Agency will not progress a major scheme which would worsen the situation overall regarding compliance with the EU Limit Value”
Highways Agency Business Plan 07-08
► Evaluation Criteria: Sum of the change in predicted concentration [impact] at relevant receptors,
where exceedence of the EU Limit Value is predicted in either Do Minimum (Without Scheme) or Do Something (With Scheme) Scenario
20Bureau Veritas Presentation
Highways Agency: Significance Criteria Update
► Review of the Highways Agency's Approach to Evaluating Significant Air Quality Effects Issued 07 September 2012
Version: 1.1 (Final)
Deadline for ‘comments’ closed on 5 October 2012
21Bureau Veritas Presentation
Highways Agency: Significance Criteria Update
► DRAFT In Advance of Publication of Interim Advice Note (IAN) Updated air quality advice
(supplementary guidance) on the application of the test for evaluating significant effects; for users of DMRB Volume 11, Section 3, Part 1 (HA 207/07) ‘Air Quality’
• Includes supporting spreadsheet
• Future IAN to be used forthwith on relevant projects in England, where air quality assessments are undertaken, and where such projects have yet to be submitted for statutory process, including the Determination of the need for a statutory Environmental Impact Assessment (EIA)
22Bureau Veritas Presentation
Highways Agency: Significance Criteria Update
► Need for Updated Advice?
A (technical) review of the HA’s approach to evaluating significant air quality impacts for the purposes of Environmental Impact Assessment (EIA)
• To reflect national planning policy changes (National Planning Policy Framework) whist still meeting requirements of the EIA Directive (2011/92/EU)
In light of this review, the HA is developing a new approach to evaluating significant air quality impacts

Top Related