


Languages
Pages
Legal


ISONIAZID HEPATOTOXICITY ON HEPG2 CELLS│TUBERCULOSIS APRIL 2011
LONDON METROPOLITAN UNIVERSITY BY ERIC GARSON AND DR. KEN WHITE PAGE 1
MODELLING ISONIAZID
HEPATOTOXICITY ON HEPG2 CELLS
BY CYP2E1 METABOLISM
BY
ERIC GARSON1 (STUDENT)
AND
DR. KEN WHITE2 (SUPERVISOR)*
* School of Human Sciences, London Metropolitan University, 166-220 Holloway Road, London, N7 8DB. Correspondence: [email protected] (Student) [email protected] (Supervisor)
Abstract Isoniazid makes up one of the main therapies used to stop, prevent and eradicate Mycobacterium Tuberculosis (TB) from the body. However for these objectives to be met, isoniazid needs to be metabolised by the liver. This metabolic process can cause hepatotoxicity, a condition which requires immediate cessation of isoniazid medicine or fatal consequences may follow. It is thought Cytochrome P450 2E1 (CYP2E1) protein families induce toxicity in liver cells by producing Reactive Oxidative Species (ROS) when isoniazid is metabolised. We wanted to simulate this theory in vitro and to show that
CYP2E1 is responsible for the production of cell cytotoxicity through ROS production and consequently hepatotoxicity. Using HepG2 cell lines and assessing cell proliferation by MTT assays, we obtained results which showed CYP2E1 is responsible for cell death and hence hepatotoxicity. However we were unable to reproduce the initial positive results satisfactorily to conclusively justify CYP2E1’s involvement and whether ROS was the root cause. Nevertheless we have significant observations concerning the Otto Warburg effect and the Crabtree effect, adherence of galactose grown cells to flask walls and the bystander effect, the latter regarding ROS production and its effects on HepG2 cells.
Background
“Unequal development in different countries in the promotion of health and control of disease, especially
communicable disease, is a common danger.”
-World Health Organisation (WHO) Constitution 1946
A mother walks into a clinic for a check-up after giving
birth four weeks earlier. She is Hepatitis B Virus (HBV)
and Human Immunodeficiency Virus (HIV) positive, (risk
factors for hepatotoxicity) (Senousy et al 2010). Moreover
she has recently been diagnosed with a bout of primary
tuberculosis (TB) infection. Through the clinic she is able to
access the relevant treatments for her ailments, ATRIPLA
for HIV and HBV infection and Isoniazid, Rifampicin,
pyrazinamide and ethambutol cocktail therapies for her TB.
She has just received results concerning an increase in liver
function tests, particularly enzymes ALT (alanine
aminotransferase) and AST (aspartate aminotransferase), an
indication of toxicity, hepatitis or hepatotoxicity. She has
felt drowsy, weak, vomited several times and felt lethargic,
particularly in the light of having given birth recently. Her
exhaustion is compounded by her poor social conditions,
large family and improper sanitation provision within her
community.
The clinician explains the symptoms are due to her TB
regimen, in particular isoniazid. She is aware she would
need to take this medication for a further 6-9 months
depending on the effectiveness of the medicine.
She also realises that the drugs if not stopped immediately
will worsen her condition and even lead to death.
What’s more she understands that stopping her treatment
will increase the bacterium’s resistance to scarce isoniazid
medicine if retaken. What can we do to change this?

ISONIAZID HEPATOTOXICITY ON HEPG2 CELLS│TUBERCULOSIS APRIL 2011
LONDON METROPOLITAN UNIVERSITY BY ERIC GARSON AND DR. KEN WHITE PAGE 2
Figure 1- Rene Laennec listening and describing a
patient’s symptoms using a stethoscope. Theobald
Chartran 1849-1907. (Roguin 2006)
“A tightly rolled sheet of paper,”
-Rene Laennec (Roguin 2006)
In the aftermath of the French revolution, the rational,
probing discipline of clinical medicine was taking a grip of
the French Universities. In 1816, one of its leading lights,
René Laennec (figure 1) placed “a tightly rolled sheet of
paper,” onto the chest of a patient treated in hospital. He
noted an unmistakable sound, “rattles.”
In comparison with other patients, Laennec noted down, “I
began to suspect the phenomenon to be due to cavities in
the lungs…I was able to confirm at autopsy that my
suspicion was correct.” Today the “tightly rolled up sheet of
paper,” is called the stethoscope. (Roguin 2006)
The 19th century put many names to the “rattles” sound
Laennec was hearing for the first time using his
stethoscope, (“stethos” meaning chest and “skopein”
meaning to explore”).
Such names included, Phthisis, (Greek for “waste away”),
Consumption, (from the Latin for to waste away”) and
Tubercles noted by Matthew Bailey and Laennec (above).
Laennec would eventually succumb to the disease at the
tragic age of 45 using his own invention to diagnose his
own impending death. (Cunningham 2007, Roguin 2006)
However it wasn’t until the germ theory of disease was set
out by visionaries, such as Joseph Lister, Louis Pasteur and
Robert Koch, that the disease took on its modern name.
Robert Koch identified the microorganism as a bacterium
(figure 2) called Mycobacterium Tuberculosis, from which
we get the disease name, tuberculosis or TB. (Saltini 2006)
TB and its aliases have been the subject of notable
literature, music, opera and art works. The latter for
instance is shown to vivid effect in the painting on page one
by Cristóbal Rojas called La Miseria (1886).
“ “If I should die”, said I to myself, “ I have left no
immortal work behind me –nothing to make my friends proud of my memory- but I have loved the principle of
beauty in all things, and if I had had time, I would have made myself remembered””
-John Keats in a letter to Fanny Brawn 1820 (J.M &M.J.
Cohen 1960)
As with many others of his generation John Keats, the
celebrated young English poet, was infected with the
bacterium and eventually died due to it. Giacomo Puccini’s
opera, La Bohème and Giuseppe Verdi’s opera, La
Traviata, also used TB as a pertinent force for their libretti
and music. (Cunningham 2007)
In fact, TB was once a creative gold mine for authors and
artists during the enlightenment and 19th century. From
Dickens, Byron and Bronte, who would kill off the heroine
right at the end with dramatic scenes exhibiting the patient
in cold sweats, exhaustion, blood in the sputum and trouble
breathing, all valid signs still used today in modern
medicine for its prospective diagnosis. (Cunningham 2007, Daniel 2006)
Figure 2- The original isolates of TB discovered by Robert
Koch, still and currently on proud display at the
Hunterian Museum, Royal College of Surgeons London.
(Royal College of Surgeons of England image library-
Surgicat)
“At all sites, where the tuberculous process was fresh and progressed rapid bacilli where found in abundance.”
-Robert Koch 1882-(Kaufmann and Schaible 2005)
Not until the 20th century did a new generation of scientists
come to battle TB. In 1927, Albert Calmette and Camille
Guérin produced the BCG vaccine (Bacille Calmette-
Guérin vaccine).
BCG is still used today, being the most widely widely
imployed of all vaccines. In fact it was the very first large-
scale task implemented by the newly formed World Health
Organisation (WHO) in 1948, vaccinating 14 million
children.
The BCG vaccine was built on the work of Edward Jenner
and Louis Pasteur’s vaccine developments in centuries gone

ISONIAZID HEPATOTOXICITY ON HEPG2 CELLS│TUBERCULOSIS APRIL 2011
LONDON METROPOLITAN UNIVERSITY BY ERIC GARSON AND DR. KEN WHITE PAGE 3
by. The TB bacillus was attenuated hundreds of times until
no longer virulent.
The vaccine protects against “disseminated childhood TB.”
However, its effects on adult TB are less successful,
particularly secondary TB and latent forms of the disease.
This makes boosters necessary. (Bell 2005, Anderson 2007,
Amoils 2005, Daniel 2006)
Figure 3- Albert Calmette rounding up support for BCG
(Wellcome Trust Image Library Website 2011)
Penicillin was discovered by Ernest Duchesne and then
later Alexander Fleming. It was developed by Howard
Florey, Ernst Chain and Norman Heatley. This began a new
leap forward in fight against infectious diseases.
(Cunningham 2007, Pouillard 2002)
Following in the footsteps of penicillin, streptomycin was
discovered by Albert Schultz and Selman Waksman. This
was the first chemotherapeutic agent to demonstrate an
ability to tackle TB. (Daniel 2006)
Figure 4- The second window up left at St. Mary‘s
Hospital, Paddington, London where Penicillin’s action
was noticed by Alexander Fleming
Isoniazid
Discovered by Hans Meyer and Joseph Mally in 1912,
isoniazid was not used as an antibacterial agent against TB
until 1952. Its effectiveness was capitalised upon by
Hoffman La Roche, Bayer and Squibb pharmaceutical
companies separately. (Corey E, Czakó B and Kürti L)
Mechanism of action
The mechanism of isoniazid’s action has been unclear for
60 years. Some suggest it inhibits the formation of myolic
acids needed for the bacterium’s cell wall (figure 5).
Of particular interest is the active site of the enzyme InhA.
Moreover, for isoniazid to function actively, it is
metabolised by a family of proteins known as Cytochrome
P450 2E1. (Timmins & Deretic 2006, Timbell et al 1977)
Figure 5- Showing the present understanding of isoniazid
action
Cytochrome P450 2E1
Cytochrome P450 2E1 (CYP2E1) is a member of a diverse
“superfamily of haem-thiolate proteins” situated in
endoplasmic reticulum and mitochondria. CYP2E1 is found
in bacteria, eukaryotes and Archeae. These proteins are
responsible for a plethora of reactions including
oxidation/reduction reactions, reshaping compounds for
cleaner excretion, “dehalogenation”, “epoxication”,
metabolism of toxins, steroids, carcinogens and drug
metabolism to list a few. From an overarching viewpoint
they are “terminal oxidases”. (Cederbaum et al 2008, Danielson 2002)
Metabolism of isoniazid produces molecules which
potentially cause toxicity to the hepatocytes (liver cells)
with which these reactions occur. We call these toxins,
Reactive Oxidative Species or ROS.
ROS has been implicated in many other drugs and
conditions such as pyrazinamide and ethambutol,
Parkinson’s, Alzheimer’s and atherosclerosis conditions.
(Danielson 2002, Preziosi 2007, Senousy et al 2010)
ROS
The liver is an organ of labour performing a number of
functions and reactions, such as being the body’s heat
source, storing and releasing iron, vitamins, production of
urea, secretions of bile salts, storage of glycogen and the
production site of albumin. (Kapit et al 2001)
Besides these and many other functions, it is the centre of
drug metabolism. Consequently it suffers the most from
isoniazid therapy. However it does have various defense
mechanism, firstly Glutathione (GSH), an antioxidant
which mops up ROS and renders them harmless against the
cell. However NAPQI (N-acetyl-p-benzoquinone) can bind
to GSH reducing its volume in the hepatocyte. (Cederbaum
et al 2010)
ISONIAZID HEPATOTOXICITY ON HEPG2 CELLS│TUBERCULOSIS APRIL 2011
LONDON METROPOLITAN UNIVERSITY BY ERIC GARSON AND DR. KEN WHITE PAGE 4
If this and other backup mechanisms are overpowered by
the sheer scale and type of ROS, for instance OH radicals,
superoxide anion radicals, acetaminophen, N-
nitrosodimethyamine, carbon tetrachloride and benzene,
then toxicity can affect the cell. We call this hepatitis or
hepatotoxicity. (Cederbaum. et al 2010, Senousy et al 2010)
Hepatotoxicity Hepatotoxicity symptoms include tiredness, weakness,
vomiting, lethargy, ascites and abdominal pain and can
eventually lead to death. (Senousy et al 2010)
Diagnosing of hepatotoxicity revolves around studying liver
function test markers, for instance ALT or AST. Cases of
hepatotoxicity mainly occur in adults, but it would be wise
to understand what happens in children.
If hepatotoxicity is suspected or diagnosed, immediate
cessation of treatment is needed. Once liver function
markers have returned to normal, gradual reintroduction of
isoniazid therapy is possible at 50mg for the first two days,
followed by 100mg the next two, then 150mg for days 5
and 6, 200mg for days 7 and 8, 250mg for days 9 and 10
and 300mg for days 11 and 12. If the patient’s liver function
tests remain normal, then 300mg of isoniazid may continue
with the gradual reintroduction of the other main anti-TB
drugs. (Senousy et al 2010)
Figure 6- Kyphoscoliosis of the thoratic vertebrae of the
spine taken from an individual with tuberculosis. (Royal
College of Surgeons of England image library-Surgicat)
“Captain among these Men of Death”
-TB’s sobriquet (Daniel 2006)
The resurgence of antibiotic resistance, coupled with no
new antibiotics on the horizon in recent decades and the
spread of serious infectious diseases such as HIV/AIDS, has
fuelled the TB pandemic. This meant that in 2009 the
World Health Organisation (WHO) estimated 9.4 million
people had contracted the disease, with 1.3 million dying.
(WHO Global Tuberculosis Control Report 2010)
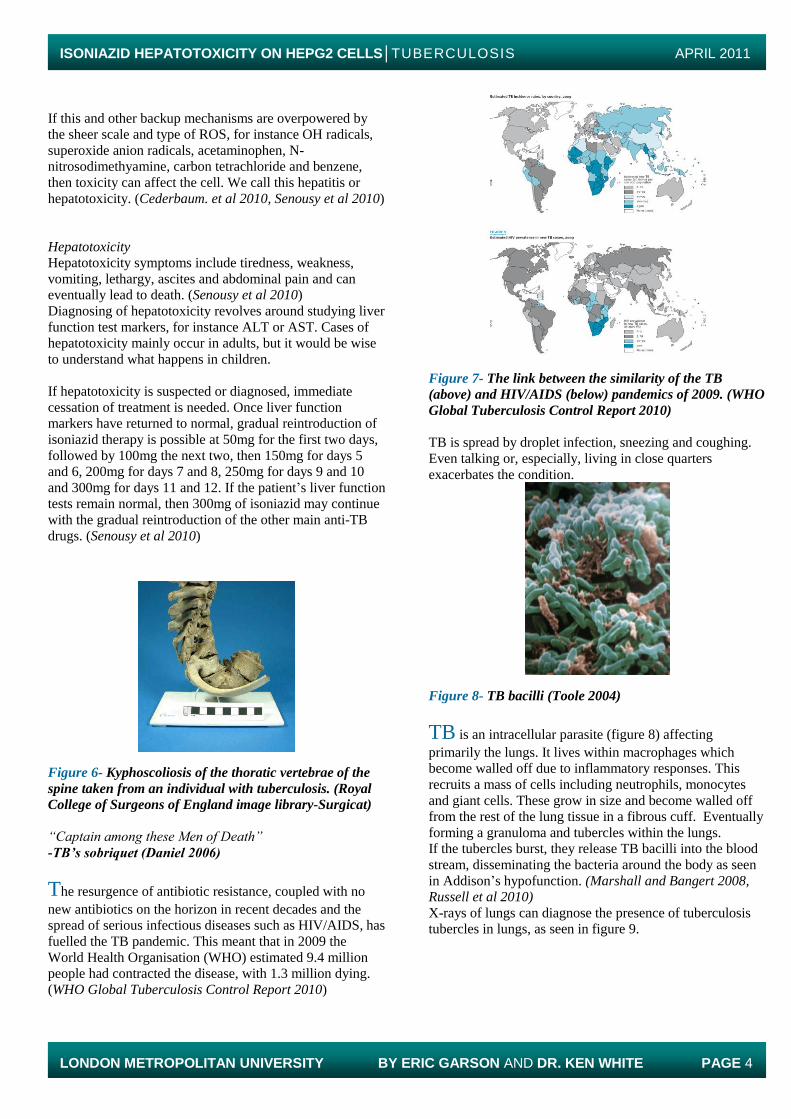
Figure 7- The link between the similarity of the TB
(above) and HIV/AIDS (below) pandemics of 2009. (WHO
Global Tuberculosis Control Report 2010)
TB is spread by droplet infection, sneezing and coughing.
Even talking or, especially, living in close quarters
exacerbates the condition.
Figure 8- TB bacilli (Toole 2004)
TB is an intracellular parasite (figure 8) affecting
primarily the lungs. It lives within macrophages which
become walled off due to inflammatory responses. This
recruits a mass of cells including neutrophils, monocytes
and giant cells. These grow in size and become walled off
from the rest of the lung tissue in a fibrous cuff. Eventually
forming a granuloma and tubercles within the lungs.
If the tubercles burst, they release TB bacilli into the blood
stream, disseminating the bacteria around the body as seen
in Addison’s hypofunction. (Marshall and Bangert 2008, Russell et al 2010)
X-rays of lungs can diagnose the presence of tuberculosis
tubercles in lungs, as seen in figure 9.

ISONIAZID HEPATOTOXICITY ON HEPG2 CELLS│TUBERCULOSIS APRIL 2011
LONDON METROPOLITAN UNIVERSITY BY ERIC GARSON AND DR. KEN WHITE PAGE 5
Figure 9- X-ray showing cavity (right base) of a patient
with TB. (Wellcome Trust Image Library Website 2011)
Symptoms of TB are indistinguishable from other flu-like
symptoms, including shortness of breath, blood tinged
sputum, fast pulse and respiration rate, lethargy and frailty.
Co-infection with HIV (see figure 7) is common. (Madigan
and Martinko 2006, Anderson 200, Russell et al 2010)
Diagnosis of TB is conducted by a concentrated sputum
sample, using Ziehl-Neelsen, Lowerstin-Jenson,
Middlebrook and dorset egg medias, Kinyoun techniques,
Polymerase Chain Reaction (PCR) carbol fuchsin and
auramine O laboratory methods. Some techniques may take
up to “14-21 days”. Plus sputum samples need sodium
hydroxide to reduce microbial growth. (Saltini 2006)
Due to this time delay, treating a clinically suspected patient
immediately with anti-TB drugs is often recommended until
the final results of laboratory investigations becomes
available.
“If societies can’t provide for people’s basic health, if they
can’t feed and educate people, then their populations and problems will grow and the world will be a less stable
place.”
-Bill Gates Annual letter 2011
Drugs against TB
Isoniazid is one of the major drugs which is used in
combination with ethambutol, pyrazinamide and rifampicin
to limit the potential of antibiotic resistance against TB. A
standard course of medication involves all four medicines
mentioned above for two months followed by four months
of just isoniazid and rifampicin.
Different drug regimes are tailored to different patient’s
needs depending on whether their TB is primary,
secondary/latent or reactivated, or whether they are co-
infected with another disease at the time of therapy, for
instance HIV which makes prescribing simultaneous TB
and HIV therapy far more difficult. (Senousy et al 2010)
Other medications which are effective against TB and its
various forms include streptomycin, macrolides, amikacin,
quinolones and ethionamide.
Isoniazid metabolism occurs in hepatocytes by mechanisms
that are incompletely understood. HepG2 cells are an
appropriate in vitro cell culture substitute to investigate
these mechanisms.
HepG2 cells provide particularly similar mitochondria,
organelles and expression of triglycerides and cholesterol.
And thus, HepG2 cells can provide a model for accessing
the possible deleterious and beneficial effects of isoniazid
medicine, through its metabolism in non-transfected and
transfected cells with CYP2E1. (Javitt 1990)
Warburg back on the front page
To couple this presumed effect of hepatotoxicity on HepG2
cells caused by isoniazid metabolism, we wished to further
induce cellular stress through the addition of culturing the
HepG2 cells in Dulbecco’s Modified Eagle Media (DMEM)
but, switching the standard sugar, glucose, to galactose,
therefore changing the growth ability of the cells.
This difference in growth has been suggested to be because
of the Warburg effect and the Crabtree effect. Cells grown
in galactose media are under more stress because they need
to use the oxidative phosphorylation pathway (of
respiration) as opposed to just simply using glycolysis to
provide adequate levels of ATP.
Oxidative phosphorylation provides more ATP yield, but it
also uses the mitochondria and its enzymes, therefore
producing more ROS. (Marroquin et al 2007)
It is Dr. White’s idea that forcing cells to use the oxidative
phosphorylation pathway using galactose will induce more
stress upon the cells than simply growing in glucose (which
uses glycolysis) media and hence will augment the stress
imposed upon HepG2 cells through CYP2E1 isoniazid
metabolism.
Assessing the Damage
The hepatotoxicity caused by glucose and galactose grown
HepG2 cells, both transfected with and without CYP2E1,
plus the addition of isoniazid was assessed using an MTT
assay.
Apparatus and Materials
Apparatus included HEPA biosafety cabinet/fume cabinet
appropriate for class II organisms, 37C CO2 incubator for
cell culture, -10C freezer for keeping CYP2E1 DNA
aliquots, autoclave for sterile pipette tips and PBS, phase
contrast microscope for viewing cells at x10, x40, and x100
magnification with fluorescence and camera, 1.5ml
eppendorf tubes, 15ml and 50ml centrifuge tubes,

ISONIAZID HEPATOTOXICITY ON HEPG2 CELLS│TUBERCULOSIS APRIL 2011
LONDON METROPOLITAN UNIVERSITY BY ERIC GARSON AND DR. KEN WHITE PAGE 6
FLUOstar Omega plate reader, 24 well plates, tin foil,
measuring scales, autoclave tape, 250 and 500ml
autoclavable screw top flasks, cold room ,waste measuring
flasks, P10, 20, 200 and 1000 eppendorf pipettes,
haemocytometer and coverslips, T25 and T75 adherent cell
culture flasks, Eppendorf 5804 centrifuge, electroporation
machine, waste autoclave bags, permanent markers, 10ml
Pasteur pipettes, 5, 10 and 20ml pipettes and pipetter and
test tube rack.
Materials included Trypsin EDTA, HepG2 cells, glucose
and galactose DMEM media (Invitrogen-GIBCO-1196-
025), RPMI media (Thermo Scientific 1640x1-CAT No.
SH3062701), DMSO (CAT-472301), MTT reagent (),
Isoniazid (Product no.133775G), autoclaved water,
autoclaved PBS using PBS tablets (calcium and magnesium
free, Trypan blue dye and RO water.
Figure 10- Clockwise from top left phase contrast
microscope and computer screen displaying live cells,
HEPA class II biosafety cabinet, electroporation machine
and an FLUOstar Omega plate reader.
Methods HepG2 cells
Glucose and galactose grown passage 1 HepG2 cells were
provided by Dr. White, and grown in glucose and galactose
DMEM media (made up by RPMI 1640, non-essential
amino acids (NEAA), 2mM glutamine, 10% fetal calf
serum (FCS), 1mM sodium pyruvate) in T25 or T75 cell
culture flasks.
T25/75 cell culture flasks are used because HepG2 cells are
adherent and stick to the surface of flasks. All cell culturing
was performed in HEPA filter cabinet for class II pathogens
and cells were incubated in a 5% CO2 incubator because to
avoid contamination stopping cell growth and killing cells.
Passaging/splits, trypsinization and harvesting
Cells were assessed under a phase contrast microscope for
health, confluence (closeness together), growth and
contamination.
To perform cell harvest, (passages/splits), DMEM media
was discarded and cells were washed with 2ml of Trypsin
EDTA for T25’s or 4ml’s in the case of the T75 flasks. The
trypsin acted as a detergent breaking the bonds which
allowed the cells to adhere to the surface of the flasks. Cells
were incubated for 5 to 10 minutes to speed up the
trypsinization process.
Glucose grown cells always trypsinized faster than
galactose grown cells. Trypsinized cells appeared round and
swam across the flask as opposed to their normal confluent
string/ rice-like shape (see figure 11).
Cells were resuspended in 2ml of fresh glucose or galactose
DMEM flasks. 1ml of fresh media above was removed and
added to 4mls of fresh cell culture media, (glucose and
galactose respectively) and into fresh T25/75 cell culture (1
in 5 dilution).
Swivelling the flask for several minutes in media meant
fully obtaining as many cells as possible from the
trypsinization process. One could see the normal transparent
DMEM pomegranate colour turn a cloudy grapefruit juice
colour.
Cells were returned to 5% CO2 incubator for 3-4 days and
the process repeated for the next passage. After passaging,
cells were periodically assessed for health, confluence,
growth and contamination under phase contrast microscope.
Figure 11 - HepG2 cells during culturing
growth/incubation phase. Cells appear confluent, healthy
and “rice” like in shape. The effect of trypsin EDTA
detaches HepG2 cells from the flask, causing cells to
become round and to “swim” across the surface of the
flask.

ISONIAZID HEPATOTOXICITY ON HEPG2 CELLS│TUBERCULOSIS APRIL 2011
LONDON METROPOLITAN UNIVERSITY BY ERIC GARSON AND DR. KEN WHITE PAGE 7
With CYP2E1
The addition of CYP2E1 consequently required further
additional stages to the above protocol. On day 1 normal
cell culturing continued in T25 flasks and cells were
incubated for two days as described above.
Into the growth phase
For transfection, cells were required at higher cell counts.
Therefore a stepup split into a T75 flask on day 3, induced
the cells into a growing phase prior to the transfection.
This meant normal harvesting of the cells, but resuspending
the cells after the trypsinization process in 4mls of glucose
or galactose DMEM media, then taking 2mls and adding
this to a new T75 flask containing 10mls of fresh media.
On day 4 cells were trypsinized in 4mls of trypsin EDTA
and resuspended in 10mls of glucose or galactose fresh
DMEM media. This was decanted into two respective 15ml
centrifuge tubes. The 15ml centrifuge tubes were spun at
800 RPM for 5 minutes producing a pellet of cells.
The supernatant was discarded and the pellets were flicked
to dislodge the cells in their clumps. Fresh 10mls of RPMI
media was added to each tube and again the 15ml centrifuge
tubes were spun for 5 minutes at 800 RPM. Pellets were
produced and the supernatant was discarded, cells were
flicked to dislodge clumps.
RPMI was used because standard DMEM contains FCS
which can interfere with electroporation. RPMI does not
contain FCS.
Cell viability Counts
Cells were resuspended in 10mls of fresh RPMI media;
from here a 50µl aliquot was taken and added to 50µl of
Trypan blue in a 1.5ml eppendorf tube (i.e. 1 in 2 dilution).
This was pipetted up and down to fully mix reagents. In the
region of 30-50µl of solution was added to a
haemocytometer to assess cell viability and number.
Respective counts were made and this numerical figure was
used to calculate cells at 5x10⁴ cells per ml for a 24 well
plate assay.
Electroporation For electroporation 400µl of cells was added to a 0.2mm
transfection cuvette and 10µl of CYP2E1 DNA in H20 or
tris buffer aliquots, under ice conditions. Cuvettes were
mixed and electrodes had condensation removed in order to
aid electroporation. A charge of 180 volts and a capacitance
of 500 was passed through the cuvette in the cuvette capsule
(resistance was non applicable). This facilitated the transfer
of DNA into the HepG2 cells and hoped-for integration into
the DNA and expression.
Plating out
From here, the 410µl of electroporated cells was added to
16mls of glucose and galactose respective DMEM media in
50ml centrifuge tubes. This volume was plated out at 500µl
per well or 5x10⁴ cells per ml in 24 well plates. Plates were
incubated overnight in a 5% C02 incubator.
New passages
Residual cells from the original 10mls were used for new
cell culture passages and resuspended at 1 in 5 dilutions
(1ml of cells +4ml of respective media) for T25 labelled
passages.
Isoniazid addition
On day 5, a 200 mM stock preparation of isoniazid was
made, using a syringe and a 0.2µl filter sterilizer.
Pre-made isoniazid concentrations were made from the 200
mM stock solution using table 1 below and all molar
concentrations were used at 5µl per well in 24 well plates.
Since only 5µl per well was pipetted, this changed the
molar concentration of the solutions below from 200, 100,
50, 20, 10 and 0mM to 2, 1, 0.5, 0.2, 0.1 and 0 mM
respectively.
Table 1-The various concentrations of isoniazid made for
addition to 24 well plates.
Figure 12- 5ul per well of isoniazid was added from left to
right at increasing molar concentrations.

ISONIAZID HEPATOTOXICITY ON HEPG2 CELLS│TUBERCULOSIS APRIL 2011
LONDON METROPOLITAN UNIVERSITY BY ERIC GARSON AND DR. KEN WHITE PAGE 8
MTT Assay
Plates were incubated until day 7, when 250µl of media was
discarded per well from the plates. 50µl per well of MTT
reagent was added and together plates were incubated for
3.5 hours.
After incubation the wells turned dark purple/black with
specks of precipitate. All media, cells and reagent was
removed from wells and each well was washed with 250µl
of sterile PBS.
Once the PBS was decanted from the wells, 500µl/well of
DMSO was added. This turned the wells red/purple for low
concentrations of isoniazid, whilst light purple/transparent
colourless solutions were obtained for higher concentrations
of isoniazid (figure 13 below).
Figure 13- Process of an MTT assay (left to right).
Addition of MTT, its effect after 3.5 hours, washing step
with PBS and purple colour produced due to DMSO
addition. Note in the latter three photos the 2mM isoniazid
rows are far lighter and more transparent than the rest of
the wells. This is because increased concentration
coffered by CYP2E1 metabolism caused the production of
ROS and thus toxicity to cells.
FLUOstar Omega plate reading
Hepatotoxicity due to isoniazid addition was analysed
through an FLUOstar Omega plate reader at 590 and
620nm. Results were analysed and conclusions made.
Without CYP2E1
All the sections above are followed, apart from a normal
cell count without Trypan blue and the exclusion of the
electroporation steps. Plating out, isoniazid addition and
MTT assays were the same as before.
Results
“If it disagrees with experiment, it’s wrong. In that simple
statement is the key to science”
-Richard Feynmann
The aim of this project was to access the toxicity caused by
isoniazid on non-transfected HepG2 cells compared with
HepG2 cells transfected CYP2E1, grown under different
conditions.
The first experiment pictures two sets of glucose vs
galactose non-transfected cells (figure 14).
Assessing the Effect of Isoniazid on Glucose and Galactose Grown HepG2
Cells Through MTT Assays
0.000
0.100
0.200
0.300
0.400
0.500
0.600
0.700
0.800
0.900
1.000
0 mM 0.1 mM 0.2 mM 0.5 mM 1 mM 2 mM
Isoniazid Concentration (mM)
Ab
so
rba
nc
e (
55
0-6
20
nm
)
Glucose-2 No CYP2E1
Glucose-1 No CYP2E1
Galactose-2 No CYP2E1
Galactose-1 No CYP2E1
Figure 14-Effect of isoniazid on the growth of HepG2
cells
Cells were cultured in glucose and galactose DMEM and
treated with isoniazid, after 3 days incubation, results were
obtained by MTT assays as described in method section.
Data obtained are the mean and standard deviation of four
replicate measurements.
The lower the absorbance the greater the cytoxicity.
Growth in galactose was far lower than in glucose..
However growth in glucose was inhibited at higher
concentrations of isoniazid. Results from repeats of each
growth media mirrored each other. T-Tests and
normalisation analysis were performed, seen in Table 2
below. Only the glucose-1 1mM figure was significant, at
0.046. Normalisation values fluctuated generally.
0 mM 0.1 mM 0.2 mM 0.5 mM 1 mM 2 mM
T-TESTS 0.438 0.179 0.479 0.073 0.132
Normalisation 100% 95% 79% 98% 61% 72%
T-TESTS 0.298 0.388 0.288 0.046 0.222
Normalisation 100% 89% 97% 118% 77% 92%
T-TESTS 0.175 0.486 0.199 0.395 0.053
Normalisation 100% 122% 99% 185% 111% 147%
T-TESTS 0.188 0.264 0.376 0.141 0.135
Normalisation 100% 120% 111% 108% 80% 92%
Glucose-1 No CYP2E1
Glucose-2 No CYP2E1
Galactose-1 No CYP2E1
Galactose-2 No CYP2E2 Table 2- Normalisation and T-Test values of figure 16
The next phase of the experiment concentrated on
transfecting the cells with CYP2E1 DNA, to see if
metabolism of isoniazid would increase cell stress.
Data from the five transfections performed are below in
figure 15a-e. Data was not pooled together because there
was variation between results. For example a) compared to
b) and c). These differences may have been due to the
efficiency of transfection, increasing age of cells (higher
passage number) and cell number.
Consequences of Isoniazid on Glucose and Galactose
grown HepG2 Cells which have been Transfected with
Cytochrome
P450 2E1
0.000
0.050
0.100
0.150
0.200
0.250
0.300
0.350
0.400
0 mM 0.1 mM 0.2 mM 0.5 mM 1 mM 2 mM
Isoniazid Concentration mM
Ab
sorb
ance
(59
0-62
0nm
)
Galactose CYP2E1 MTT Assay Glucose CYP2E1 MTT Assay Figure 15a-Effect of isoniazid on the growth of
transfected HepG2 cells. CYP2E1 cDNA in tris buffer
*
*
ISONIAZID HEPATOTOXICITY ON HEPG2 CELLS│TUBERCULOSIS APRIL 2011
LONDON METROPOLITAN UNIVERSITY BY ERIC GARSON AND DR. KEN WHITE PAGE 9
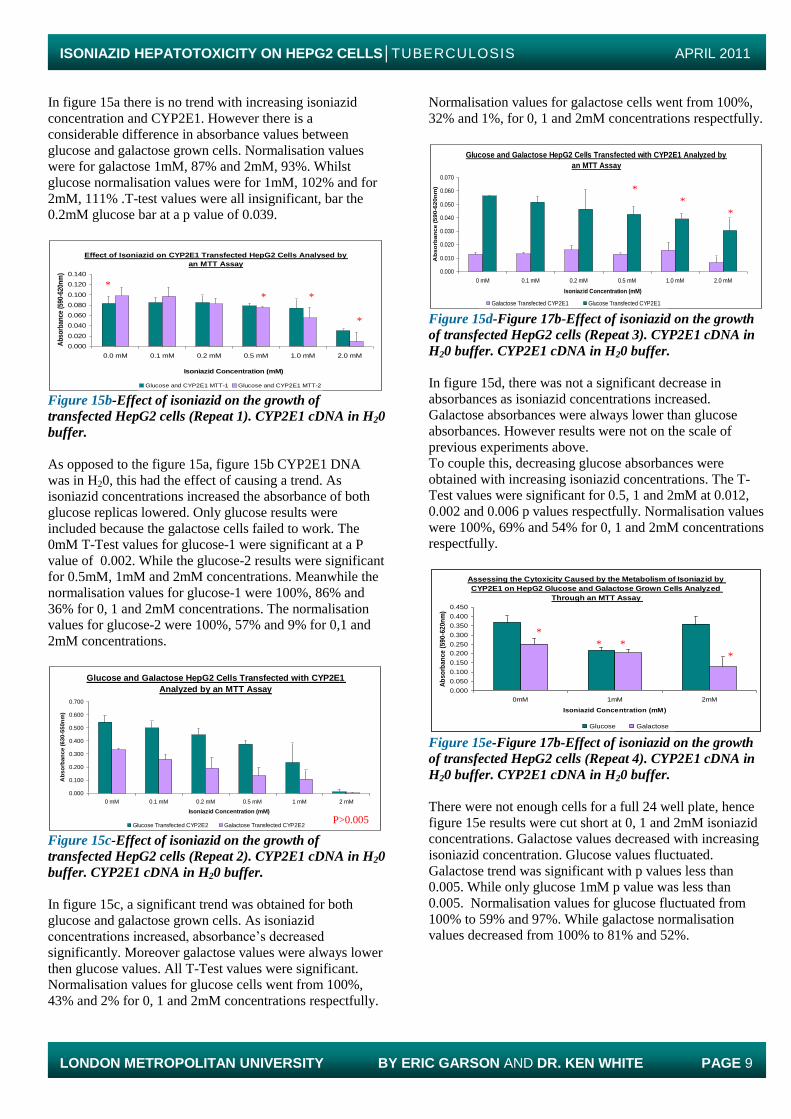
In figure 15a there is no trend with increasing isoniazid
concentration and CYP2E1. However there is a
considerable difference in absorbance values between
glucose and galactose grown cells. Normalisation values
were for galactose 1mM, 87% and 2mM, 93%. Whilst
glucose normalisation values were for 1mM, 102% and for
2mM, 111% .T-test values were all insignificant, bar the
0.2mM glucose bar at a p value of 0.039.
Effect of Isoniazid on CYP2E1 Transfected HepG2 Cells Analysed by
an MTT Assay
0.000
0.020
0.040
0.060
0.080
0.100
0.120
0.140
0.0 mM 0.1 mM 0.2 mM 0.5 mM 1.0 mM 2.0 mM
Isoniazid Concentration (mM)
Ab
sorb
ance
(59
0-62
0nm
)
Glucose and CYP2E1 MTT-1 Glucose and CYP2E1 MTT-2 Figure 15b-Effect of isoniazid on the growth of
transfected HepG2 cells (Repeat 1). CYP2E1 cDNA in H20
buffer.
As opposed to the figure 15a, figure 15b CYP2E1 DNA
was in H20, this had the effect of causing a trend. As
isoniazid concentrations increased the absorbance of both
glucose replicas lowered. Only glucose results were
included because the galactose cells failed to work. The
0mM T-Test values for glucose-1 were significant at a P
value of 0.002. While the glucose-2 results were significant
for 0.5mM, 1mM and 2mM concentrations. Meanwhile the
normalisation values for glucose-1 were 100%, 86% and
36% for 0, 1 and 2mM concentrations. The normalisation
values for glucose-2 were 100%, 57% and 9% for 0,1 and
2mM concentrations.
Glucose and Galactose HepG2 Cells Transfected with CYP2E1
Analyzed by an MTT Assay
0.000
0.100
0.200
0.300
0.400
0.500
0.600
0.700
0 mM 0.1 mM 0.2 mM 0.5 mM 1 mM 2 mM
Isoniazid Concentration (mM)
Ab
so
rba
nc
e (
63
0-5
50
nm
)
Glucose Transfected CYP2E2 Galactose Transfected CYP2E2
Figure 15c-Effect of isoniazid on the growth of
transfected HepG2 cells (Repeat 2). CYP2E1 cDNA in H20
buffer. CYP2E1 cDNA in H20 buffer.
In figure 15c, a significant trend was obtained for both
glucose and galactose grown cells. As isoniazid
concentrations increased, absorbance’s decreased
significantly. Moreover galactose values were always lower
then glucose values. All T-Test values were significant.
Normalisation values for glucose cells went from 100%,
43% and 2% for 0, 1 and 2mM concentrations respectfully.
Normalisation values for galactose cells went from 100%,
32% and 1%, for 0, 1 and 2mM concentrations respectfully.
Glucose and Galactose HepG2 Cells Transfected with CYP2E1 Analyzed by
an MTT Assay
0.000
0.010
0.020
0.030
0.040
0.050
0.060
0.070
0 mM 0.1 mM 0.2 mM 0.5 mM 1.0 mM 2.0 mM
Isoniazid Concentration (mM)
Ab
so
rba
nc
e (
59
0-6
20
nm
)
Galactose Transfected CYP2E1 Glucose Transfected CYP2E1 Figure 15d-Figure 17b-Effect of isoniazid on the growth
of transfected HepG2 cells (Repeat 3). CYP2E1 cDNA in
H20 buffer. CYP2E1 cDNA in H20 buffer.
In figure 15d, there was not a significant decrease in
absorbances as isoniazid concentrations increased.
Galactose absorbances were always lower than glucose
absorbances. However results were not on the scale of
previous experiments above.
To couple this, decreasing glucose absorbances were
obtained with increasing isoniazid concentrations. The T-
Test values were significant for 0.5, 1 and 2mM at 0.012,
0.002 and 0.006 p values respectfully. Normalisation values
were 100%, 69% and 54% for 0, 1 and 2mM concentrations
respectfully.
Assessing the Cytoxicity Caused by the Metabolism of Isoniazid by
CYP2E1 on HepG2 Glucose and Galactose Grown Cells Analyzed
Through an MTT Assay
0.000
0.050
0.100
0.150
0.200
0.250
0.300
0.350
0.400
0.450
0mM 1mM 2mM
Isoniazid Concentration (mM)
Ab
so
rba
nc
e (
59
0-6
20
nm
)
Glucose Galactose Figure 15e-Figure 17b-Effect of isoniazid on the growth
of transfected HepG2 cells (Repeat 4). CYP2E1 cDNA in
H20 buffer. CYP2E1 cDNA in H20 buffer.
There were not enough cells for a full 24 well plate, hence
figure 15e results were cut short at 0, 1 and 2mM isoniazid
concentrations. Galactose values decreased with increasing
isoniazid concentration. Glucose values fluctuated.
Galactose trend was significant with p values less than
0.005. While only glucose 1mM p value was less than
0.005. Normalisation values for glucose fluctuated from
100% to 59% and 97%. While galactose normalisation
values decreased from 100% to 81% and 52%.
P>0.005
* * *
*
* *
*
* *
* *

ISONIAZID HEPATOTOXICITY ON HEPG2 CELLS│TUBERCULOSIS APRIL 2011
LONDON METROPOLITAN UNIVERSITY BY ERIC GARSON AND DR. KEN WHITE PAGE 10
Figure 16-The differences obtained from galactose and
glucose cell culturing with isoniazid and CYP2E1 after 2
days.
Figure 16 shows the Crabtree Effect on galactose cells. The
media stayed the same colour due to no lactate production
and thus a neutral pH 7. This suggests the cells being forced
down the oxidative phosphorylation pathway to produce
ATP.
Meanwhile, the glucose media turned orange because of
lactate production and therefore a lowering in pH (acidic).
This suggests the cells are showing the Warburg effect, in
essence still using glycolysis for ATP production.
Figure 17- Effect of isoniazid on HepG2 cultured
galactose and glucose cells.
Figure 17 shows the effect isoniazid can have when
metabolised by transfected CYP2E1 HepG2 cells. This
suggests ROS have been produced in the 2mM wells but
not the 0mM wells. This observation was not seen in non
transfected cells.
Analysis
Galactose induces more stress upon HepG2 cells than
glucose, possibly through the Otto Warburg/Crabtree
principle. The combination of isoniazid and CYP2E1 causes
a gradual decrease in absorbances as isoniazid
concentrations increase. This may be due to the formation
of ROS from isoniazid’s metabolism by CYP2E1.
This has been supported by figures 14, 15 b) and c).
However experimental reproducibility has been
unsatisfactory. This casts doubt on the validity of the theory
that the formation of ROS by CYP2E1 metabolism of
isoniazid is the root cause of hepatotoxicity.
However there may be various explanations the lack of
reproducablity. For instance, during transfections only 1%
of cells actually takes up and expresses CYP2E1. Therefore
not enough cells are able to metabolise isoniazid and cause
the detrimental effects of hepatotoxicity. (To prove this last
statement effectively a Green Fluorescent Protein (GFP)
marker on the CYP2E1 cDNA would be needed to show
which cells had taken up CYP2E1 and which had not.)
On the other hand, the 1% efficiency of transfection may be
sufficient to cause hepatotoxicity.
And thus, this 1% of cells could be releasing large numbers
of ROS to other cells, tissues and organs, causing a chain
reaction of deleterious consequences. And as a
consequence, causing the detrimental results seen in
heptotoxicity.
This principle is known as the bystander effect. It would
have been investigated in the latter weeks of the project had
it not been for severe contamination as seen in figure 18
below. The source and cause of this are a mystery,
especially in the light of increased vigilance whilst culturing
and extra precautions taken to prevent contamination by
bacteria, fungi and yeast cells.
Figure 18- Contamination of a HepG2 cell culture.
ISONIAZID HEPATOTOXICITY ON HEPG2 CELLS│TUBERCULOSIS APRIL 2011
LONDON METROPOLITAN UNIVERSITY BY ERIC GARSON AND DR. KEN WHITE PAGE 11
Conclusions
“In the fields of observation, chance favours only those who
are prepared”
-Louis Pasteur (Debre 1998)
Efficiency of transfection
Efficiency of transfection may have been a factor in these
projects results. Other options of getting CYP2E1 DNA
into the cell could have included using transfection reagents
such as DOTAP, Lipofectamine, or Fugene. Even more
extravagant would be using an adenovirus particle to inject
CYP2E1 DNA into the HepG2 cells. However all of these
processes are detrimental to the cell itself either through
electricity (electroporation) or punching a hole in the cell
membrane by chemical means (DOTAP). One could even
argue it could be the transfection itself inadvertently
causing stress and therefore hepatotoxicity to the cells seen
in the results.
Other drug regimens
Isoniazid is usually prescribed with two other therapies and
is seldom a monotherapy. Thus, establishing the
hepatotoxic effects caused by these other anti-TB drugs,
plus their metabolism by different cytochrome proteins is
vital to building up a comprehensive picture of clinical and
laboratory hepatotoxicity.
To contemplate the future dimension of a complete cell
model, with the full assortment of different cytochrome
families and their varying combinations of TB drugs for the
potential of establishing their theoretical involvement in
hepatotoxicity, would be a fantastic outlook to pursue.
Galactose grown cells and trypsinization
What accounts for the time difference it took for galactose
grown cells to trypsinze faster then glucose grown cells
from the T25/75 cell culture flasks?
The only differences between the cell cultures were the
sugars.
Glucose cells use the glycolysis pathway, the Warburg
effect. Galactose cells have been forced down oxidative
phosphorylation pathway, the Crabtree effect.
Cancer cells like HepG2 cells are immortal. Cancer cells
use glycolysis, they are hypoxic. As if they were growing in
glucose.
Could there be a link between the ability of the HepG2 cells
to detach from the cell flasks and the ability of cancer cells
to migrate during metastasis. Could cellular receptors and
membranes (for example E/N-cadherins) play a role in this
possible relationship?
If so, slowing or stopping the ability of HepG2 cells to
trypsinze would have the potential of stopping or reducing
the ability of cancer cells to migrate.
The Bigger Picture- Success of an antioxidant
This project’s original goal was to establish CYP2E1 as the
principal suspect causing the source of ROS and
consequently hepatotoxicity.
If a particular ROS was isolated from within HepG2 cells
by High Pressure Liquid Chromatography (HPLC) or mass
spectrometry, then one could tailor a specific antioxidant,
such as Gentipicroside (White et al), to mop up the
production of that ROS and consign the issues of
hepatotoxicity caused by isoniazid to oblivion.
-How much would an antioxidant cost to deliver and to be
prescribed to the majority of TB sufferers who are neither
rich nor affluent?
-What effects would the antioxidant and the anti-TB drugs
together have on the body?
-Would it work in children? Hepatotoxicity is seldom seen
in children, but little data is accumulated on the overall
effects of TB drugs on child health. This must change.
With lacklustre development of antibiotics in recent
decades and antibiotic resistance growing with MRSA, C. Difficile and artemisinin resistant malaria strains, XDR-TB
and MDR-TB, new antibiotic scaffold developments and
discoveries are of greater importance then ever.
If we do not continually develop, keep abreast and educate
people about the threat of infectious diseases like TB,
humanity will face a continual and increasing threat, posing
a risk to not only the poor, but all who inhabit the globe.
Let us hope, in the light of the statement above, that the
WHO constitution quote I began this paper with, stands the
test of time.
References Papers
Amoils, Shannon. Packing the punch into BCG. Nature
Reviews Microbiology, 2005, Vol. 3, S27.
Anderson, P. Tuberculosis vaccines-an update. Nature
Reviews Microbiology, 2007, Vol. 5, 484-487.
Bell, E. A Souped-up version of BCG. Nature reviews
Immunology, 2005, Vol. 5, 1.
Cederbaum A, Lu Y. CYP2E1 and oxidative, liver injury by
alcohol. Free radical biology and medicine, 2008, Vol. 44,
723-738.
Daniel, Thomas. The history of tuberculosis. Respiratory
medicine, 2006, Vol. 100, 1862-1870.

ISONIAZID HEPATOTOXICITY ON HEPG2 CELLS│TUBERCULOSIS APRIL 2011
LONDON METROPOLITAN UNIVERSITY BY ERIC GARSON AND DR. KEN WHITE PAGE 12
Danielson, P.B. The Cytochrome P450 Superfamily:
Biochemistry, evolution and drug metabolism in humans.
Current Drug Metabolism, 2002, Vol. 3, 561-597.
Javitt, Norman. Hep G2 cells as a resource for metabolic
studies: lipoprotein, cholesterol and bile salts. FASEB
Journal. 1990, Vol. 4, 2, 161-168.
Kaufmann, S.H. and Schaible, U.E. 100th anniversary of
Robert Koch's Nobel Prize for the discovery of the tubercle
bacillus. Trends in Microbiology, 2005, Vol. 13, 10, 469-
475.
Koul A. et al. The challenge of new drug discovery for
tuberculosis. Nature, 2011, Vol. 469. 483-490.
Lambert, P. Can successful vaccines teach us how to induce
efficient protective immune responses? Nature Medicine
Supplement, 2005, Vol. 11, No. 4, S54-62.
Marroquin et al. Circumventing the Crabtree effect:
Replacing media glucose with galactose increases
susceptibility of HepG2 cells to mitochondrial toxicants.
Toxicological Sciences, 2007, Vol. 97, 2, 539-547.
Plotkin, S. Vaccines: past, present and future. Nature
Medicine supplement, 2005, Vol. 11, No. 4, S5-11.
Pouillard, J. A Forgotten Discovery: Doctor of Medicine
Ernest Duchesne’s Thesis (1874-1912). Histoire des
Sciences Medicales, 2002, Vol. 36, 11-20.
Preziosi, Paolo. Isoniazid: Metabolic aspects and
toxicological correlates. Current Drug Metabolism. 2007,
Vol. 8, 839-851.
Roguin, A. Rene Theophile Laennec (1781-1826): The man
behind the stethoscope. Clinical Medicine & Research,
2006, Vol. 4, No. 3, 230-235.
Russell, D. et al. Tuberculosis: What we don’t know can,
and does, hurt us. Science, 2010, Vol. 328, 852-855.
Saltini, Cesare. Chemotherapy and diagnosis of
tuberculosis. Respiratory Medicine, 2006, Vol. 100, 2085-
2097.
Senousy, B. et al.Hepatotoxic effects of therapies for
tuberculosis. Nature Reviews Gastroenterology and
Hepatology, 2010, Vol. 7, 543-552.
Taylor, G.M. et al. Koch’s bacillus-a look at the first isolate
of Mycobacterium tuberculosis from a modern perspective.
Microbiology, 2003, Vol. 149, 3213-3220.
The WHO Constitution. WHO, 1946.
Timbrell, J. et al. Determination of hydrazine metabolites of
isoniazid in human urine by gas chromatography. Journal
of Chromatography, 1977, Vol. 138, 165-172.
Timmins, G and Deretic, V. Mechanisms of action of
isoniazid. Molecular Microbiology, 2006, Vol. 62, 5, 1220-
1227.
White KN et al. Pharmacokinetics and Tissue Distribution
of Gentiopicroside Following Oral and Intravenous
Administration in Mice. Eur. J. Drug Metabolism and
Pharmacokinetics, 2004, Vol. 29:199-203
Young, Douglas and Dye, Christopher. The development
and impact of tuberculosis vaccines. Cell, 2006, Vol. 124,
683-687.
Books
Corey E.J., Czakó B and Kürti L. Molecules and medicine.
Hoboken, N.J: John Wiley, 2007.
Debre, Patrice. Louis Pasteur. Johns Hopkins University
Press, 1998.
Corey E, Czakó B and Kürti L. Molecules and medicine.
Hoboken, N.J. John Wiley, 2007, Part IV Antibiotics, pages
140-141.
J.M. & M.J. Cohen. The Penguin Dictionary of Quotations.
Penguin Books Ltd, 1960.
Kapit W, Elson L. The anatomy colouring book. Benjamin
Cummings, 2001, 3rd
edition.
Marshall, W & Bangert, S.K. Clinical Chemistry, Mosby
Elsevier, 2008, 6th Edition.
Madigan, M & Martinko, J. Brock Biology of
Microorganisms. Benjamin Cummings/Pearson, 2006, 11th
Edition.
Toole, G and Toole, S. AS Essential Biology for OCR.
OCR. Nelson Thornes. 2004.

ISONIAZID HEPATOTOXICITY ON HEPG2 CELLS│TUBERCULOSIS APRIL 2011
LONDON METROPOLITAN UNIVERSITY BY ERIC GARSON AND DR. KEN WHITE PAGE 13
CD
Cunningham, Andrew. The Making of Modern Medicine.
BBC, 2007.
World Wide Web
http://youtube.com/watch?v=b240PGCMwV0
http://people.wku.edu/charles.smith/wallace/S043.htm
http://surgicat.rcseng.ac.uk/(hkyi3345xw05pbjczp3mtcmp)/
detail.aspx#
http://surgicat.rcseng.ac.uk/(hkyi3345xw05pbjczp3mtcmp)/
detail.aspx?parentpriref=#
http://images.wellcome.ac.uk/
http://www.who.int/mediacentre/factsheets/fs104/en/
Acknowledgments
I am indebted to Dr. White, Dr. Chatterton, Dr. Searle, Mr
Armour, Dr Mclean, Gaf, Shyni, Mohammed and the
laboratory dispensary team. And finally, to persons know
and unknown, my thanks.

ISONIAZID HEPATOTOXICITY ON HEPG2 CELLS│TUBERCULOSIS APRIL 2011
LONDON METROPOLITAN UNIVERSITY BY ERIC GARSON AND DR. KEN WHITE PAGE 14
MODELLING ISONIAZID HEPATOTOXICITY
ON HEPG2 CELLS BY CYP2E1 METABOLISM
BY ERIC GARSON1 (STUDENT)
AND
DR. KEN WHITE2 (SUPERVISOR)*
Top Related