


Languages
Pages
Legal


KN Amarawardhana_731126-P643_SSW-OUSL-2010/12
Modeling of energy utilization of
tourism industry to predict the
future energy demand to
showcase Sri Lanka
- The ‘Miracle of Asia’
Student
K.N. Amarawardhana
Local Supervisors
Dr. N.S. Senanayake
Mr. Ruchira Abeyweera
KTH Supervisor
Peter Kjaerboe

2
Declaration
The work submitted in this thesis is the result of my own investigation,
except where otherwise stated.
It has not already been accepted for any other degree and is also not
being concurrently submitted for any other degree.
K.N. Amarawardhana
Date
We/I endorse declaration by the candidate.
Dr. N.S. Senanayake Mr. Ruchira Abeyweera

3
Master of Science Thesis EGI 2010:
Modeling of energy utilization of tourism
industry to predict the future energy
demand to showcase Sri Lanka - The ‘Miracle
of Asia’
KN Amarawardhana
Approved
Examiner
Jaime Arias Hurtado
Supervisor
Peter Kjaerboe
Commissioner Contact person
Abstract
Tourism industry in Sri Lanka shares a substantial amount of GDP (Gross Domestic
Product) and predicts an immense expansion within a short time frame. Owing to its
energy intensiveness and competitiveness, a scrutiny in the energy utilization and
the related impact on the environment is crucial. Furthermore, trend towards
ecotourism forces the requirement of foreseeing a green energy supply to meet the
ever rising demand. In this study, utilization of energy in the graded hotels in the
country was modeled through LEAP (Long Range Energy Alternatives Planning
System) software to predict the future energy demand. Monthly energy consumption
data for three consecutive years for a sample of hotels covering classified and
unclassified hotel establishments were used for modeling. Four scenarios were then
analyzed based on the baseline scenario representing the country’s tourism industry
profile of year 2010. It is shown that the energy intensiveness of the tourism
industry will be overwhelming unless the DSM (Demand Side Management) tools are
properly amalgamated for mitigation. Further the results of the study revealed that
the existing electricity generation plan does not accommodate fuel diversification
and energy mix, and needs revisions to induct renewable sources for greening
energy supply of the country. The study provides an insight in identifying socially
acceptable policy scenarios in energy supply and use of the tourism industry.

4
Acknowledgement
At the very outset, I would like to express my sincere gratitude to the
KTH (The Royal Institute of Technology) and OUSL (The Open University
of Sri Lanka) for giving me the opportunity to read for the MSc in
Sustainable Energy Engineering under the DSEE (Distance based
Sustainable Energy Engineering) programme in Sri Lanka.
Many thanks go to my supervisors, Dr. N.S. Senanayake, Mr. Ruchira
Abeyweera and Peter Kjaerboe for their whole hearted support in
completing this study. Further I would express my appreciation for the
assistance rendered in various aspects, by the officials at the CEB (Ceylon
Electricity Board), officials at the SLTDA (Sri Lanka Tourism Development
Authority), Chief Engineers at the hotel sample and also the colleagues in
the DSEE programme. Without their contribution, this study would not
have been successful.
Last but not least, I would pay my deepest gratitude to my husband,
Amila, who always motivates me in my higher studies, my two lovely
daughters whom missed my love and care throughout the various phases
during this programme, my mother and my only sister, Maheshi, for
extending their fullest support in managing my parental obligations in
parallel with my studies. Without their support I would not have been able
to concentrate and devote on my studies.

5
Nomenclature
BAS Baseline scenario
BMS Building Management System
CEB Ceylon Electricity Board
CH4 Methane
CO Carbon monoxide
CO2 Carbon dioxide
COA Coal free generation scenario
DSM Demand Side Management
EIA Environmental Impact Assessment
EPT Energy Policy Target Scenario
EUI Energy Use Intensity
GDP Gross Domestic Product
GHGs Green House Gases
HFO Heavy Fuel Oil
IPCC International Panel on Climate Change
LEAP Long Range Energy Alternatives Planning System
LPG Liquid Petroleum Gas
LTGEP Long Term Generation Expansion Plan
MSW Municipal Solid Waste
MVAC Mechanical Ventilation & Air Conditioning
MW Mega Watt
N2O Nitrous oxide
NCRE Non-Conventional Renewable Energy Resources
NMVOC Non-Methane Volatile Organic Compounds

6
NOx Nitrogen oxides
NPV Net Present Value
REN Renewable Promotion Scenario
SLSEA Sri Lanka Sustainable Energy Authority
SLTDA Sri Lanka Tourism Development Authority
SO2 Sulfur dioxide
U/C Unclassified
UNWTO United Nations World Tourism Organization

7
Table of Contents
Declaration ............................................................................................................ 2
Abstract ................................................................................................................ 3
Acknowledgement .................................................................................................. 4
Nomenclature ........................................................................................................ 5
List of Figures ........................................................................................................ 8
List of Tables ......................................................................................................... 9
1 Introduction .................................................................................................. 10
1.1 Background ............................................................................................ 10
1.2 Problem Formulation ............................................................................... 11
1.3 Objectives .............................................................................................. 14
2 Methodology .................................................................................................. 15
2.1 LEAP Model ............................................................................................ 17
2.2 Study Parameters & Assumptions/constraints ............................................. 18
2.3 Multi-scenario analysis ............................................................................. 21
2.4 Sensitivity analysis .................................................................................. 27
3 Literature Review ........................................................................................... 28
3.1 Global Outlook ........................................................................................ 28
3.2 Overview of Sri Lanka and Tourism Industry .............................................. 29
3.2.1 Future Trends ................................................................................... 33
3.3 Utilization of energy in Tourism Industry .................................................... 34
3.4 Previous studies ...................................................................................... 35
4 Analysis of data & Findings .............................................................................. 37
4.1 General Findings ..................................................................................... 37
4.2 Analysis of Energy Utilization data ............................................................. 38
4.3 Analysis of Environmental Implications ...................................................... 40
5 Results and Discussion .................................................................................... 42
5.1 Demand Forecast .................................................................................... 42
5.2 Transformation Forecast .......................................................................... 44
5.3 Environmental Impacts ............................................................................ 50
5.4 Economic Analysis ................................................................................... 54
5.5 Sensitivity screening results ..................................................................... 55
6 Conclusions and Future work ........................................................................... 60
References .......................................................................................................... 62
Appendices .......................................................................................................... 64
Appendix A: Initial values of the input parameters ............................................... 64
Appendix A-1: Establishment data as at 2010(Base year) .................................. 64
Appendix A-2: Annual fuel consumption/guest room as at 2010 .......................... 65

8
Appendix A-3: Capacity costs and fuel costs ..................................................... 66
Appendix A-4: T & D losses and Emission factors .............................................. 67
Appendix A-5: Capacity additions & Retirements for different scenarios ............... 69
Appendix B: Cost – Benefit Analysis Methodology in LEAP ..................................... 71
Appendix C: Summary of Cumulative Costs and Benefits ...................................... 72
List of Figures
Figure 1.1: Trend of Electricity demand in all consumer categories ............................. 12
Figure 1.2: Electricity demand by consumer category, 2010 ...................................... 13
Figure 2.1: Steps in Methodology ........................................................................... 15
Figure 2.2: Schematic view of the LEAP model ......................................................... 18
Figure 3.1: International tourist arrival trend ........................................................... 28
Figure 3.2: Climate profile of Sri Lanka ................................................................... 30
Figure 3.3: Detailed tourist map of Sri Lanka ........................................................... 30
Figure 3.4: Occupancy rates in 2009 & 2010 by resort region .................................... 31
Figure 3.5: Major sources of foreign exchange earnings-Sri Lanka .............................. 32
Figure 4.1: Energy utilization balance of graded establishments -2010........................ 39
Figure 4.2: Total energy consumption by end use of a hotel ...................................... 40
Figure 5.1: Energy demand forecast based on envisaged target at 2016 ..................... 42
Figure 5.2: Advantage of DSM over existing demand ................................................ 43
Figure 5.3: Electricity Generation profile - Baseline scenario ...................................... 44
Figure 5.4: Electricity Generation based on National Energy Policy ............................. 46
Figure 5.5: Comparison of Electricity Generation mixes (EPT vs BAS) ......................... 47
Figure 5.6: Comparison of Electricity Generation mixes (COA vs BAS) ........................ 47
Figure 5.7: Comparison of Electricity Generation mixes (REN vs EPT) ......................... 48
Figure 5.8 : Increase of global warming potential ..................................................... 50
Figure 5.9: Reduction of one hundred year global warming potential through DSM
measures ............................................................................................................ 51
Figure 5.10: Avoided CO2 emissions through Alternative energy sources ..................... 52
Figure 5.11: Competitive advantage of NCRE additions ............................................. 53
Figure 5.12: Cumulative discounted social costs as at year 2016 ................................ 54
Figure 5.13: Sensitivity at various saving % of DSM measures .................................. 55
Figure 5.14: Comparison of reduced CO2 emissions .................................................. 56
Figure 5.15: Sensitivity of NPV at various discount rates ........................................... 58
Figure 5.16: Sensitivity of LEAP model for fuel price escalations ................................. 59

9
List of Tables
Table 2.1: Description of scenarios ......................................................................... 22
Table 2.2: Energy share planned by the National Energy Policy .................................. 25
Table 2.3: Overview of sensitivity analysis .............................................................. 27
Table 3.1: Tourism performance in Sri Lanka ........................................................... 32
Table 4.1: Comparison of CO2 emissions as at 2010 ................................................. 41
Table 5.1: Sensitivity of NPV at various discount rates .............................................. 57

10
1 Introduction
1.1 Background
After three decades of war, Sri Lanka is now focused on its economic
development. As a direct result of this, most of the technological fields
have now emerged with an innovative developing trend. With this
backdrop, more focus has been drawn towards catering the ever
increasing energy demand in the country. Sri Lanka is a developing
economy carrying a high economic growth rate. Expansion of the
commercial and service sector and its share to GDP are rising steadily.
Tourism industry plays a dominant role as a pillar of the national
economy. The growth in the tourism sector in a greater scale provides
proof to this. This field rebounded strongly in 2010 due to post conflict
peaceful environment. Thus tourism sector has been recognized as the
key driver of the economic activity with its vast income generation
potential.
Sri Lanka is an attractive tourist destination. Sri Lanka tourism has a goal
to establish and position Sri Lanka as Asia’s most treasured and greenest
Island, with its beautiful beaches, warm and friendly people in a strong
nature and culture. The future projections of the country are geared to a
five year plan from 2011, to showcase Sri Lanka; the ‘Miracle of Asia’. The
development policy framework of the Government is committed to
sustainable tourism. In line with this, Sri Lanka needs to expand tourism
related infrastructure and facilities around the country to cater the 2.5
million tourist arrivals envisaged by 2016. Detailed targets show that the
total room capacity needs to hit 45000 by 2016 from 22745 in year 2010
[1]. This highlights the requirement of closely investigating the energy
utilization pattern of the tourism industry and forecasting its future profile
to see the feasibility in meeting the expected goals of the country.

11
Sri Lanka, in the present context meets her energy demand mainly
through the National grid. The total electricity generation in 2010 has
been shared by hydro (46.3%), thermal oil (47%) and Non-Conventional
Renewable Energy Resources (NCRE) (6.7%) [2]. NCRE covers the
sources such as mini and micro hydro, solar, wind and biomass in Sri
Lanka. Furthermore, major hydroelectricity has been exploited to its
maximum capacity by now and generation sources have been changed
with the induction of coal power plant from 2011. Owing to the limitations
in energy generation, Sri Lanka indeed has a challenge in meeting the
rapidly growing demand whilst maintaining the quality of energy services.
This leads to the requirement of exploiting alternative energy sources.
1.2 Problem Formulation
The tourism industry has become fiercely competitive. In attracting more
tourists it has to have a challenging goal of tallying with the customer
perceptions. That will be the only way of moving ahead in such a
competitive market. Evolving interest shown by the tourists on
ecotourism and green hotel concepts has been grabbed by the industry to
its consistency. Concurrently, greening the tourism industry is a direct
path towards enhancing the tourist arrivals since it is the global concern
in the present scenario.
Sri Lanka’s electricity demand by each tariff category from 1970 to 2010
is shown in figure 1.1 while figure 1.2 depicts sectoral electricity demand
share in 2010. These figures reveal that the total electricity demand of
industrial and commercial sectors are greater than that of the domestic
sector. This in turn provides proof to an ambitious GDP growth projection
since electrical consumption has a direct relationship with the economic
growth.

Figure 1.1: Trend of Electricity demand in all consumer categories
Source: ‘Sri Lanka Energy Balance 2010
SLSEA
As at year 2010, in terms of the electricity demand by different end user
categories, industrial sector utilizes about 34% of the total electricity
demand. The domestic, commercial and other sectors (religious and
street lighting) consume 40%, 24% and 2% of the total electricity
demand respectively. According to a national surve
Lanka Sustainable Energy Authority (
industry consumes approximately about 4.72% of the total electricity
consumption of the industrial sector [
12
: Trend of Electricity demand in all consumer categories
Source: ‘Sri Lanka Energy Balance 2010; An analysis of the energy sector performance’,
As at year 2010, in terms of the electricity demand by different end user
categories, industrial sector utilizes about 34% of the total electricity
demand. The domestic, commercial and other sectors (religious and
street lighting) consume 40%, 24% and 2% of the total electricity
demand respectively. According to a national survey carried out by the Sri
Lanka Sustainable Energy Authority (SLSEA) in year 2011, the
industry consumes approximately about 4.72% of the total electricity
consumption of the industrial sector [3].
An analysis of the energy sector performance’,
As at year 2010, in terms of the electricity demand by different end user
categories, industrial sector utilizes about 34% of the total electricity
demand. The domestic, commercial and other sectors (religious and
street lighting) consume 40%, 24% and 2% of the total electricity
y carried out by the Sri
SEA) in year 2011, the tourism
industry consumes approximately about 4.72% of the total electricity

Figure 1.2: Electricity demand by consumer category
The trend of increased consumption in these sectors is expected to
continue. Tourism industry and its associated activities contribute
considerably on this account. Therefore
in hotels is expected to grow much above the growth
consumption in the industrial sector. This also shows the importance of
exploring the energy utilization of the
of energy saving options.
The Government has a plan of expanding the
considerable focus on the tourism
more energy supply avenues and implementation of more energy efficient
practices. Moreover, an analytical method to identify the energy utilization
pattern and trends of any industry will make the country smart to
challenge of future energy supply.
34%
24%
2%
13
: Electricity demand by consumer category, 2010
The trend of increased consumption in these sectors is expected to
continue. Tourism industry and its associated activities contribute
his account. Therefore, the rate of energy consumption
in hotels is expected to grow much above the growth rate
consumption in the industrial sector. This also shows the importance of
exploring the energy utilization of the tourism industry to see the avenues
energy saving options.
The Government has a plan of expanding the industrial
erable focus on the tourism industry. This notifies a requirement of
more energy supply avenues and implementation of more energy efficient
, an analytical method to identify the energy utilization
pattern and trends of any industry will make the country smart to
future energy supply.
40% Domestic
Industrial
Commercial
Religious & Street lighting
The trend of increased consumption in these sectors is expected to
continue. Tourism industry and its associated activities contribute
energy consumption
rate of electricity
consumption in the industrial sector. This also shows the importance of
industry to see the avenues
industrial sector with a
industry. This notifies a requirement of
more energy supply avenues and implementation of more energy efficient
, an analytical method to identify the energy utilization
pattern and trends of any industry will make the country smart to face the

14
1.3 Objectives
In the light of this backdrop, this study intends to;
(a) Identify the electrical and thermal energy consuming activities in
the tourism industry
(b) Model the energy supply and utilization of tourism industry
(c) Forecast impacts on environment at various scenarios
(d) Conduct an economic comparison of the scenarios
(e) Derive avenues of greening the tourism industry in Sri Lanka

2 Methodology
The framework of the study
methodology depicted in Figure
Figure 2.1: Steps in Methodology
Drawing a foundation to the study, an extensive literature review was
carried out on the studies available in similar nature. Simultaneously, the
profile of tourism industry
and magnitude of energy supply requirements and future trend
utilization in line with the strategies imposed by the
Development were scrutinized.
SLTDA has defined graded establishments (all tourist hotels
reckoned to be up to international standards of operation)
supplementary accommodation
which are approved by the SLTDA as being suitable for occupation by
foreign guests) under the broad classification of accom
available in Sri Lanka. The study was focused to cover the expansion of
graded establishments which is further having a star classification (five
star, four star, three star, two star, one star and unclassified).
collected from three lines of approach;
Step 1•Carrying out a literature review
Step 2•Collection of Establishment data, Baseline data and Monthly consumption data from the selected hotel sample
Step 3•Model the energy utilization through LEAP software
Step 4•Calibration of Baseline scenario for year 2010 (Reference model)
Step 5•Input of forecast parameters for other scenarios (energy savings, Increase of NCRE)
Step 6•Conduct a multi-scenario assessment and sensitivity analysis (Based on emission levels and economic comparison) and derive conclusions
15
The framework of the study is broadly described by the 6
methodology depicted in Figure 2.1.
: Steps in Methodology
foundation to the study, an extensive literature review was
carried out on the studies available in similar nature. Simultaneously, the
industry including its’ energy usage patterns
and magnitude of energy supply requirements and future trend
in line with the strategies imposed by the Ministry of Economic
Development were scrutinized.
has defined graded establishments (all tourist hotels
reckoned to be up to international standards of operation)
supplementary accommodation (all guest house, rest house, inns etc
which are approved by the SLTDA as being suitable for occupation by
under the broad classification of accommodation units
available in Sri Lanka. The study was focused to cover the expansion of
graded establishments which is further having a star classification (five
four star, three star, two star, one star and unclassified).
ee lines of approach;
Carrying out a literature review
Collection of Establishment data, Baseline data and Monthly consumption data from the selected hotel sample
Model the energy utilization through LEAP software
Calibration of Baseline scenario for year 2010 (Reference model)
Input of forecast parameters for other scenarios (energy savings, Increase
scenario assessment and sensitivity analysis (Based on and economic comparison) and derive conclusions
broadly described by the 6-step
foundation to the study, an extensive literature review was
carried out on the studies available in similar nature. Simultaneously, the
including its’ energy usage patterns, the nature
and magnitude of energy supply requirements and future trend of energy
Ministry of Economic
has defined graded establishments (all tourist hotels which are
reckoned to be up to international standards of operation) and
(all guest house, rest house, inns etc
which are approved by the SLTDA as being suitable for occupation by
modation units
available in Sri Lanka. The study was focused to cover the expansion of
graded establishments which is further having a star classification (five
four star, three star, two star, one star and unclassified). Data were
Collection of Establishment data, Baseline data and Monthly consumption
Calibration of Baseline scenario for year 2010 (Reference model)
Input of forecast parameters for other scenarios (energy savings, Increase
scenario assessment and sensitivity analysis (Based on and economic comparison) and derive conclusions

16
(a) Establishment data which covers number of rooms and electrical
and thermal energy consuming activities involved in the
establishment.
(b) Baseline data which covers on the occupancy, energy
consumption and energy supply data pertaining to the year
2010, to form a reference year or rather a baseline scenario to
the study.
(c) Monthly energy consumption data which covers the occupancy
and energy consumption data of three consecutive years (2010,
2011 and 2012).
Hotels in a particular type are expected to have a certain standard of
facilities. These includes air-conditioning, facilities in the guest rooms,
restaurants, conference halls, meeting rooms, business centers,
gymnasium, sauna facilities, swimming pool, laundry facilities, etc.
However, a single hotel in each type will not represent a correct energy
picture of that type of hotel cluster owing to the differences among them.
The level of energy use depends on; location of hotel, layout, orientation
and design of hotel, types, sizes and efficiencies of energy consuming
equipment being used, the level of monitoring and controlling energy
consumption, expertise of hotel Engineering and maintenance staff,
occupancy rate and hotel signature which gives its vision towards energy
picture, etc. Therefore, in order to account for these differences, several
hotels in each type were considered to get an average energy
consumption data to project a reasonable energy picture. For this, data
were obtained through 5 out of 13 grade five star hotels, 7 out of 15
grade four star hotels, 7 out of 16 grade three star hotels, 10 out of 39
grade two star hotels, 8 out of 30 grade one star hotels and 10 out of 134
unclassified hotels. Thereby total of 47 hotels were considered for the
study which are dispersed widely over the country.

17
2.1 LEAP Model
LEAP, the Long range Energy Alternatives Planning System software tool
was used to build the model of the energy utilization of the tourism
industry. It not only covers the energy demand of the industry but also
models the electricity generation technologies which eventually forecast
the future of the energy utilization and supply. Thereby LEAP models a
complete energy system of the sector in interest.
The LEAP requires a limited initial data input and allows evaluating
different aspects depending on the availability of initial data. For example,
energy demand and supply data along with the emission factors would be
enough to forecast energy and environmental forecasting. The cost data
is entered later to economically compare the scenarios. Further the LEAP
model needs a reference state in order to make a base to the model.
In this study, a reference state, ‘Baseline scenario’ (BAS), is established
for the year 2010. Different scenarios were used to illustrate how the
complete energy system evolves over the time span based on scenario
specific variables. The schematic view of the LEAP model is shown in
figure 2.2.

Figure 2.2: Schematic view of the LEAP model
2.2 Study Parameters
This study was carried out based on a number of parameters and
assumptions. These mainly cover
described in detail below
values of the inputs were extracted
Appendix A-1 to A-5.
Key study parameters:
of study (2010), covering; demand, historical data on activities,
technologies used for electricity generation
development trends were taken as the key parameters
Electricity Board (CEB) develops and maintains the Long Term Generation
Expansion Plan (LTGEP) in the objective of meeting the demand for
18
: Schematic view of the LEAP model
Study Parameters & Assumptions/constraints
s carried out based on a number of parameters and
. These mainly covered the technical and economical aspects
described in detail below and were used as inputs to LEAP.
of the inputs were extracted from various sources
Key study parameters: In order to structure the model;
covering; demand, historical data on activities,
technologies used for electricity generation, emission factors and
were taken as the key parameters
develops and maintains the Long Term Generation
nsion Plan (LTGEP) in the objective of meeting the demand for
/constraints
s carried out based on a number of parameters and
the technical and economical aspects
used as inputs to LEAP. The initial
various sources and shown in
In order to structure the model; the base year
covering; demand, historical data on activities,
emission factors and
were taken as the key parameters. The Ceylon
develops and maintains the Long Term Generation
nsion Plan (LTGEP) in the objective of meeting the demand for
19
electricity from the grid for the whole of Sri Lanka. The LTGEP has been
developed with due consideration on system demand growth in line with
the economic development, current energy demand, technology of
generation, technical considerations and financial requirements.
The LTGEP of CEB was considered as a reliable source of historical data
input on electricity generation and the data related to expansion of
tourism industry was taken through SLTDA. Other inputs were based on
the available data and projections from various local sources and on
interviews with officials of CEB and SLTDA. Further, a set of variables
were used those are referred in demand and electricity transformation to
build the inter-relationship of them. These variables are GDP, GDP
growth, population, population growth and system losses.
Study period: The Government laid a six year plan in the year 2010 to
meet the target, ‘Miracle of Asia’ by 2016. It gives emphasis on the
National Economic Policy with a greater tilt towards the development of
the tourism industry. 2016 thus became a milestone in the development
process in the tourism industry. Based on this, the predictions of the
results of reference year (2010) and all other scenarios as well as the
sensitivity studies are presented in this report for a period of six years
(2010-2016).
Reserve Margin: The planning reserve margin of 20% has been applied
for the analysis. LEAP uses this to automatically add additional
endogenous capacities to maintain the required generation capacity to
meet the demand.
Discount rate: In order to estimate the economic costs and benefits at
different times, a discount rate is defined in LEAP. It accounts for several
economic factors such as time value of money, earning and purchasing
power, budget constraints, borrowing limitations and utility of the money.
All calculations in this study were carried out at 10% discount rate. Effect
of the discount rate over the model is observed for 5% and 15%.

20
Assumptions/constraints: Basic assumptions were on capacity, load
factor, lifetime of plants and discount rate. Capacity depends on individual
plant and technology. Standard load factors used in Sri Lanka were taken
for each technology type. Generic lifetime for each technology was used.
The commissioning and retirement of the power plants were assumed to
be carried out at the beginning of the considered year for calculation
simplicity, though it will not be the case in real terms.
Scope of economic analysis: The economic analysis is based mainly on
three components; capital cost, fixed and variable operation and
maintenance cost. All costs are taken per unit capacity of generation. For
the economic analysis, capital investments, operation and maintenance
costs, lifetime of plants were obtained through LTGEP of CEB and the staff
of the generation planning department. Further, the unit fuel cost and the
fuel escalations rates were considered for calculation. The details on the
calculation procedure in LEAP are elaborated in Appendix B.
Further, the cost of environmental externalities in the context of
electricity generation was taken into account. Externality cost is involved
when the social and economic activities of electricity generation
technologies have an impact on the community, biodiversity, etc. True
cost thus includes both the cost of generation and the external costs of
damage to the environment caused by power generation. Therefore, it is
a standard practice to internalize the externalities. If these were ignored
at the planning stage, an outside party will have to bear them eventually.
For example, long term environmental pollution will be borne by the
future generations. In order to address these issues, the externalities
attributable to electricity generation were considered, namely; air
pollutants, water use and water quality, land use values, bio diversity
index and employment impacts. Since the reliable sources are not
available in Sri Lanka to obtain the related externality cost values, they
were referred through Massachusetts externality values [4].

21
For an economic comparison on the scenarios, Net Present Value (NPV)
analysis is performed through LEAP. ‘NPV is the sum of all discounted
costs and benefits in one scenario minus another (summing across all
years of the study). Costs relative to the reference scenario are shown as
positive values while benefits are shown as negative values’ [5]. In such a
comparison, the one with the lowest NPV (NPV of the negative highest
value) is considered to be the best socially acceptable scenario.
Environmental Implications: Environmental impacts through electricity
generation are in several folds; gaseous emissions, particulate emissions,
warm water discharges into lakes, rivers etc. and land use. The analysis
of environmental impacts in this study was concentrated on gaseous
emissions since they will be the prominent category in electricity
generation. The major Green House Gases (GHGs) defined by the
International Panel on Climate Change (IPCC) were taken into
consideration [6]. They are; Carbon dioxide (CO2), Carbon monoxide
(CO),Methane (CH4), Nitrous oxide (N2O), Nitrogen oxides (NOx), Sulfur
dioxide (SO2) and Non-Methane Volatile Organic Compounds (NMVOC).
2.3 Multi-scenario analysis
The multi-scenario analysis through LEAP allows evaluating each scenario
against the data input to compare them by their energy demand, costing
and the environmental impact. Four scenarios were developed based on
the Baseline scenario. Description of each of these scenarios is shown in
table 2.1 and a brief on each of these scenarios follows. Environmental
impact assessment and economic comparison was done in relation to
each scenario. Multi-scenario analysis does not however develop a
mechanism to select the least cost electricity generation plan for the
country, but can be used as a tool for policy decisions to incorporate
environmental and social concerns.

22
Table 2.1: Description of scenarios
Scenario Input Parameters
Baseline Scenario(BAS)
Demand
• Room capacity & occupancy rate with predicted
growth rates*
• Annual energy consumption per occupied room*
• Fuel mix for the utilities*
• Unit cost for energy consumption utilities
Generation, transmission & distribution
• Percentage of energy losses in transmission &
distribution
• Current & future committed capacities (Based on
LTGEP of CEB/2010)
• Capacity additions & retirements
• Process efficiency
• Capital cost
• Fixed & variable operation & maintenance cost
• Emission factors
Energy Policy Target
Scenario(EPT)
• Current & future committed capacities (Based on
National Energy policy)
• Emission factors
• Capacity additions & retirements
Coal free generation scenario
(COA)
• Current & future committed capacities
• Capacity additions & retirements
Renewable Promotion
Scenario (REN)
• Capacity additions & retirements (Hypothetical
case)
Demand Side Management
Scenario(DSM)
• Percentage reduction of Energy intensity growth
* Relevant values for each graded establishment are fed into LEAP.

23
Baseline Scenario (BAS): The data of the model was calibrated for the
year 2010 to construct Baseline scenario. This scenario represents as to
how the tourism industry and energy demand/generation evolves over the
time span considered for the study with the existing conditions in the
reference year.
The values representing the demand status of the tourism industry in
2010 are extracted from the annual statistical report of the SLTDA
(2010). These initial figures cover the total room capacity, percent share
and occupancy rate of each star category. Fixed values were used for
room capacity; 22745 in year 2010 and 45000 for year 2016 to represent
the target of the country by year 2016. The percent share and occupancy
rates were studied for four years (2010-2013) from the annual statistical
report of the SLTDA (2013) and thereby the future trend was forecasted
as growth rates. These trends were analyzed for each star rating
separately. The energy intensity of each hotel grade was then fed into the
model under electricity, diesel, Liquid Petroleum Gas (LPG) and fuel oil.
The LEAP calculates the total energy consumption by multiplying the
energy intensity by each activity level. Therefore, the growth of the
energy demand of the tourism industry was interpreted by a function of
percent share of each hotel grade, occupancy rate and interpolation of the
room capacity increase from year 2010 to 2016. This way of modeling is
more reasonable than inputting growth rate percentage directly for the
whole industry, since the growth forecasting of whole industrial sector of
the country is beyond the scope of this study.
Energy supply for the industry was modeled under transformation of
LEAP, which included transmission and distribution along with electricity
generation. Existing percentage of transmission and distribution losses for
Sri Lanka are 14%, 28% and 7% for electricity, diesel and LPG
respectively [7]. These losses are expected to reduce with the
improvements of the network, etc and by the trend of reduction of the

24
losses, the forecasting is done. Thus these losses will be at 12%, 24.5%
and 5% for electricity, diesel and LPG respectively in year 2016.
The electricity generation for the base year was modeled based on the
LTGEP of CEB. Six main sources, expressed as ‘processes’ in LEAP, were
considered for the electricity generation; hydro, oil, coal, wind, biomass
and solar. Basic data inputs to LEAP under this phase are historical
production, exogenous capacity, maximum availability, capacity credit
and costs for each generation source. Historical production specifies
annual energy production while exogenous capacities are used to reflect
existing capacities as well as committed capacity additions and
retirements for each source.
All the other scenarios modeled in LEAP were based on the baseline
scenario, which simplifies the data entry requirements and also allows
comparison among the different scenarios. Therefore the other scenarios
inherit from the baseline scenario.
Energy Policy Target Scenario (EPT): According to the National
Energy Policy of Sri Lanka promulgated by the Ministry of Power and
Energy, the share of NCRE sources in the total grid electricity generation
should reach 10% by 2015. The share of NCRE sources in base year
(2010) is 6.7% and thus needs continuous development within next 5
years. Table 2.2 shows the percentages of energy share planned by the
National Energy Policy from 1995 to 2015. The existing generation plan at
CEB and the National Energy Policy is far different and there exists a
requirement of concentrating on environmental friendly NCRE application.
Hydro is one of the main indigenous sources of energy in Sri Lanka and its
lifetime is higher than that of other sources of energy. However, since
hydro sources have been exploited to its maximum throughout the
country, more focus in developing mini/micro hydro, wind, biomass and
solar is given to achieve this target. Therefore EPT scenario is modeled
with reference to the National Energy Policy and the LTGEP.

25
Table 2.2: Energy share planned by the National Energy Policy
Year Share of total/ (%)
Hydro Oil Coal Minimum from NCRE
1995 94 6 0 -
2000 45 54 0 1
2005 36 61 0 3
2010 42 31 20 7
2015 28 8 54 10
Source: The gazette No 1553/10 issued on 10.06.2010 issued by Ministry Of Power and
Energy “National Energy Policy and Strategies of Sri Lanka”
Coal free generation scenario (COA): Owing to the resistance by civil
society groups, plans formulated by CEB to implement coal was
unsuccessful since 1990. These resistances were mainly focused on social
and environmental grounds. However, 285 Mega Watt (MW) coal power
plant was committed and established in 2011 at Puttalam and the CEB
utilizes coal for generation for the least cost option. In this scenario no
coal plant other than the established coal plant was considered as thermal
additions to the generation mix. Oil fired steam plants were considered as
thermal additions in this scenario.
Renewable Promotion Scenario (REN): A hypothetical case was
modeled in LEAP to observe the greener effect of electricity generation in
Sri Lanka. Thus the capacity additions and plant retirements considered in
this case are not practical to the present context of the country. However,
REN would be far better in terms of environmental aspects against EPT,
which is modeled according to the existing National Energy Policy.

26
Demand Side Management Scenario (DSM): Intention of DSM is to
design activities to reduce and conserve electricity consumption at
consumer end. Thus, DSM involves in planning, implementation and
monitoring the utility activities. Electricity supply utilities, dominated by
the CEB in Sri Lanka, adopt several measures including incentives such as
rebates, time of the day tariff to get the customers involved in DSM
programs. Most common DSM activity is energy efficiency improvements.
DSM activities includes; use of energy efficient equipment covering
lighting system, other electrical appliances including MVAC and water
heating, demand shift and control to control the maximum demand and
building automation and control. MVAC is the highest consumer of
electricity in a hotel and water heating also consumes a considerable
portion of that. The energy consumption of MVAC can be reduced greatly
through several measures; use of efficient MVAC equipment, use of heat
pumps to utilize heat rejected from the conditioned space to heat water,
insulation of the conditioned spaces to avoid leaks or infiltration. This can
be expanded to the whole building envelop to reduce heat gain or heat
loss and to mitigate infiltration. This includes the activities such as
insulation of building with the use of various types of insulating materials
and prevention of air leaks through paths within walls, ceilings, duct work,
windows, door frames etc to reduce infiltration.
In order to optimize energy usage, advanced electronic systems can be
used. Use of occupancy sensors and use of modern computing and control
technologies are various mechanisms used to manage energy usage of
the building envelop. These basically regulate air-conditioning, heating,
lighting and other energy consuming activities.
Some alternative measures can be adopted to control the energy
consumption of hotels. These mainly cover substituting alternative energy
options over grid electricity supply. Use of solar water heating systems is
a typical such application in tourism industry. Since Sri Lanka has a
tropical climate, this option is well suited for hotel applications. Use of

27
Municipal Solid Waste (MSW) for garden lighting is another option. Based
on Grubb et al [8], 30% realistic reduction of demand through all DSM
measures is considered for this scenario.
2.4 Sensitivity analysis
In order to validate the model, three variations on the scenarios were run
to estimate the sensitivity of the results to certain parameters; mitigation
of demand, discount rate and fuel price escalation. Table 2.3 gives an
overview of the sensitivity analysis.
Table 2.3: Overview of sensitivity analysis
Variable Description
Electricity demand A case to model 50% further reduction of electricity demand
through DSM measures
Discount rate Main model uses 10% discount rate. In order to explore the
robustness of the economic performance of various scenarios,
the model calculations were repeated at 5% and 15% discount
rates
Fuel price escalation Future prices of fuel are uncertain. In order to check the
sensitivity of the model, ‘Oil price hike’ scenario was modeled

3 Literature Review
3.1 Global Outlook
Analytical studies during the recent past has shown that,
the multiple challenges that shook the global economies in year 2009 and
2010, global tourism has boosted up by the improved economic conditions
worldwide in year 2010 and 2011. This can be traced by the positive
growth of the tourism indus
figure 3.1. The international tourism grew by 4.6%, reaching 982 million
international tourist arrivals
best performers by regions in year 2011
Figure 3.1: International tourist arrival trend
Source: UNTWO Annual report 2011
28
Literature Review
Analytical studies during the recent past has shown that,
the multiple challenges that shook the global economies in year 2009 and
2010, global tourism has boosted up by the improved economic conditions
in year 2010 and 2011. This can be traced by the positive
growth of the tourism industry in all regions of the world
The international tourism grew by 4.6%, reaching 982 million
international tourist arrivals in which Asia & Pacific and Europe w
by regions in year 2011 [9].
: International tourist arrival trend
Source: UNTWO Annual report 2011
Analytical studies during the recent past has shown that, irrespective of
the multiple challenges that shook the global economies in year 2009 and
2010, global tourism has boosted up by the improved economic conditions
in year 2010 and 2011. This can be traced by the positive
world as depicted in
The international tourism grew by 4.6%, reaching 982 million
Europe were the

29
A descriptive study on world economies shows that the countries like
Antigua and Barbuda, Aruba, British Virgin Islands, Bahamas, Barbados,
Belize, Bermuda, Cayman Islands, Falkland Islands France, Maldives,
Montenegro and Thailand have a considerable amount of share of GDP
from tourism industry [10]. However, the quarterly publication of UNWTO
states that the fastest growth of the international tourist arrivals has been
reported by Saudi Arabia (+60%), Bhutan (+39%), Sri Lanka (+31%),
Palau (+27%), Myanmar (+26%), Cambodia (+20%) and Thailand
(+20%) among all countries and territories based on the data of the full
year of 2011 [11].
3.2 Overview of Sri Lanka and Tourism Industry
Sri Lanka is an island located in the Indian Ocean having a total area of
65,610 km2, populated by almost 21 million people. Average yearly
temperature in Sri Lanka ranges from 28 to 320C and annual average
rainfall is from 2540 mm to over 5080 mm. Sri Lanka lies in the
equatorial and tropical zone and thus influenced by two monsoons; North-
East monsoon brings rain in the northern and eastern regions in
December and January and South-West monsoon brings rain from May to
July to the southern and central regions. Bright sunny warm days are the
rule and are common even in the height of the monsoons. Figure 3.2
depict climate profile of the country.

Figure 3.2: Climate profile of Sri Lanka
Source: http://www.climatechange.lk/Climate_Profile.html
The key strengths of the country in focus with the tourism industry are
authenticity, compactness and diversity. It has over a 2500 year old
culture (authentic) and within
numerous attractions for a tourist (diversity).
detailed tourist map of Sri Lanka.
Figure 3.3: Detailed tourist map of Sri
30
Climate profile of Sri Lanka
http://www.climatechange.lk/Climate_Profile.html
The key strengths of the country in focus with the tourism industry are
authenticity, compactness and diversity. It has over a 2500 year old
(authentic) and within a small area (compactness) it offers
numerous attractions for a tourist (diversity). Figure 3.3 shows the
detailed tourist map of Sri Lanka.
: Detailed tourist map of Sri Lanka
The key strengths of the country in focus with the tourism industry are
authenticity, compactness and diversity. It has over a 2500 year old
area (compactness) it offers
Figure 3.3 shows the

31
Tourism industry of Sri Lanka rebounded strongly in 2010 owing to the
post-conflict peaceful environment. The Ministry of Economic
Development claims that “The year 2010 was a significant one for the
tourism industry of Sri Lanka with tourism arrivals reaching the highest
recorded number in the recent history” [12]. The figure 3.4 shows the
increase of occupancy rates in year 2009 and 2010 by the resort regions
of Sri Lanka.
Figure 3.4: Occupancy rates in 2009 & 2010 by resort region
Source: Annual statistical report 2011, SLTDA
As illustrated in the table below, the tourist arrivals have a growth rate of
46.1% in year 2010 (with 654,476 tourist arrivals) in contrast to 2.1% in
year 2009. This has surpassed the record of 566,202 tourist arrivals in
year 2004.

Table 3.1: Tourism performance in Sri Lanka
Description 2006
Tourist Arrivals 559,603
Room occupancy rate (%) 47.8
Gross tourist receipts
(Rs. Millions)
42,586
Per capita tourist receipts
(Rs.)
76,000
Source: Sri Lanka Tourism Development Authority, Central Bank of Sri Lanka
Report-2010
Earnings from tourism have increased by 64.6% to US $ 576 million in
2010, compared to US $ 350 million in 2009. This is further evident
the comparison of major sources of foreign exchange earnings from year
2006 to 2010 as shown
(2010) of the Central Bank of Sri Lanka “Recognizing that the tourism
sector could be a key driver of econom
income generation potential of the industry, tourism related infrastructure
and facilities around the country would need to be expanded to cater to
the 2.5 million tourist arrivals envisaged in 2016
Figure 3.5: Major sources of foreign exchange earnings
Source: Central Bank of Sri Lanka
32
Tourism performance in Sri Lanka
2006 2007 2008 2009 2010
559,603 494,008 438,475 447,890 654,476
47.8 46.2 43.9 48.4 70.1
42,586 42,571 37,094 40,133 65,018
76,000 86,175 84,598 89,605 99,344
Source: Sri Lanka Tourism Development Authority, Central Bank of Sri Lanka
Earnings from tourism have increased by 64.6% to US $ 576 million in
2010, compared to US $ 350 million in 2009. This is further evident
the comparison of major sources of foreign exchange earnings from year
as shown in the figure 3.5. According to the annual report
(2010) of the Central Bank of Sri Lanka “Recognizing that the tourism
sector could be a key driver of economic activity and considering the vast
income generation potential of the industry, tourism related infrastructure
and facilities around the country would need to be expanded to cater to
the 2.5 million tourist arrivals envisaged in 2016” [13].
: Major sources of foreign exchange earnings-Sri Lanka
Source: Central Bank of Sri Lanka-Annual Report-2010, Chapter 5, pg 100
2010 Growth Rate
(%)
2009 2010
654,476 2.1 46.1
10.3 44.8
65,018 8.2 62.0
99,344 5.9 10.9
Source: Sri Lanka Tourism Development Authority, Central Bank of Sri Lanka-Annual
Earnings from tourism have increased by 64.6% to US $ 576 million in
2010, compared to US $ 350 million in 2009. This is further evident from
the comparison of major sources of foreign exchange earnings from year
According to the annual report
(2010) of the Central Bank of Sri Lanka “Recognizing that the tourism
ic activity and considering the vast
income generation potential of the industry, tourism related infrastructure
and facilities around the country would need to be expanded to cater to
2010, Chapter 5, pg 100

33
3.2.1 Future Trends
Sustainable tourism became a buzzword in Sri Lanka with the post war
turnaround. Sri Lanka is generally considered as an ‘affordable
destination’ among the international tourists. Now the time has come to
position and promote Sri Lanka to attract the rates it deserves through
sustainable market penetration. With this backdrop, the tourism industry
has shown a clear shift to sustainable business model by making itself
greener and more socially responsible. The sustainability in the tourism
industry covers a vast scope including enriching the lives of employees by
creating safe and stimulating working environment, managing carbon
footprint and improving livelihood and social aspects of communities.
The country has a vision for the future which carries the policy framework
for future development. It is committed to a sustainable tourism
development strategy and moreover the industry has urged to grab the
opportunities towards ecotourism. Development of the tourism zones on
the Western and Eastern coastal belts have already been launched. This
includes Arugam Bay, Trincomalee, Kalpitiya, Negambo, Dedduwa, Galle,
Mullaitive and Hambantota.
The SLTDA together with the Ministry of Economic Development has
launched a ‘Tourism Development Strategy’ for a period of five years from
2011 to 2016 with a tag line “Refreshingly Sri Lanka: The Wonder of
Asia”. This fast-track infrastructure development program includes
creating an environment conductive for tourism, attracting the right type
of tourists, ensuring that departing tourists are happy, improving
domestic tourism and contributing towards improving the global image of
Sri Lanka. Furthermore, the strategic plan focuses on a diversified
categories in tourism related activities; beaches, sports and adventure,
heritage sites, mind and body wellness, scenic beauty, wild life and
nature, people and culture and year round festivals.

34
The word ‘ecotourism’ was coined with the evolution of the tourism
industry because the global interest was drawn towards the climate
change due to the industrial activities and rapid depletion of resources
and biodiversity. In light of these, ecotourism is defined as a form of
tourism that entails responsible travel to nature areas and which
conserves the environment and sustains the well-being of local people
[14].
This implies the elimination of the environmental impacts through the
activities related to the industry. In spite of the fact that tourism industry
brings income and more employment opportunities and uplifts the social
and cultural benefits, it pollutes the environment at an unprecedented
rate. Degradation of landscapes, disturbance caused to habitats and rapid
depletion of scarce resources such as land, fresh water and energy are
some of most prominent impacts resulted. Thus the activities of the
industry and environment are to be integrated well enough to keep pace
with ‘ecotourism’.
3.3 Utilization of energy in Tourism Industry
Energy is used in various forms in a hotel. Typical energy utilization
balance includes; LPG for cooking, fuel oil for boilers to produce steam
and hot water and electricity for all other energy consuming activities
such as Mechanical Ventilation & Air Conditioning (MVAC), lighting, lifts
and other electrical equipment. Electricity consumption dominates the
total energy utilization balance of all types of hotels, which is illustrated in
the next chapter. The annual energy bill of a typical hotel contributes
significantly to the total operating cost of a hotel.
Evaluation of energy consumption of hotels is challenging than other
building types. Uniqueness of hotels includes various functional facilities
(such as restaurants, laundry, reception halls, business centers, etc),

35
variations of occupancy levels and also the differences of the personal
comfort levels of the occupants. Therefore the energy consumption
situation in a hotel environment carries a different identity among other
industries.
Operation of a hotel is for 24 hours, all year around though some parts of
it may be not functional at some times. The occupancy level also varies
over the year. The places such as restaurants and retail shops are open
not only for the in-house guests, but also for the general public.
Furthermore, even the unoccupied guest rooms in high graded hotels are
kept air-conditioned to prevent odor and discomfort. This indicates that
the occupancy level of a hotel is not a direct component in its energy
consumption. Thus a precise evaluation of the energy consumption of
hotels is extremely challenging and only an approximation was reached at
in this paper.
3.4 Previous studies
There have been numerous studies carried out across the world on energy
utilization of tourism industry. The impulse for ecotourism concepts with
the backdrop of increased concern on environmentally friendly business
has been the foundation for many studies. Priyadarshani et al [15]
studied on energy performance of hotels in Singapore, where energy
consumption data and other vital information were gathered from 29
quality hotels through a national survey. Ali et al [16] displayed a number
of insights into the situation and trends in energy consumption in the
Jordanian tourism sector while identifying energy consumption, attitudes,
willingness and practices of certain classified hotels.
Deng et al [17] used regression analysis to conclude the strong
correlation between total electricity use and monthly mean outdoor
temperature. This is because cooling energy for air conditioning systems

36
dominates in hotels and it increases with higher outdoor temperature.
Karagiorgas et al [18] carried out a study on energy consumption on hotel
sector in Greece, in which the hotels in mount, city and coastal areas
were studied separately. Wang JC [19] has established two regression
models to predict annual energy consumption and EUI (Energy Use
Intensity) for a study on the energy performance of hotel buildings in
Taiwan.
Udawatta et al [20] conducted an energy usage optimization study on a
typical star-class hotel in Sri Lanka by using a mathematical model. The
study findings were that the implementing wing operation to the hotel
room allocation system with respect to the use of MVAC saves energy
substantially, which could be incorporated into Building Management
System (BMS) in automation.

37
4 Analysis of data & Findings
4.1 General Findings
The level of energy use in hotel differs in the presence of many factors;
location of hotel (differences in climatic conditions), hotel classifications,
layout, orientation and design of the buildings of the hotel, floor area,
number of guest rooms, occupancy rate, facilities provided for the guests
(conference halls, meeting rooms, swimming pool, spa and sauna,
restaurants, laundry etc.), types/ sizes and efficiencies of energy
consumption equipment, fuel mix, year of construction, year of retrofit if
applicable, level of monitoring and controlling energy consumption,
expertise of hotel engineering and maintenance staff and hotel signature
which gives its vision towards energy picture, etc.
An obvious example is that, multi-storied hotels in city areas use central
air-conditioner units to provide thermal comfort and central boiler units to
supply hot water to the guest rooms whereas split type air-conditioners
and electric geysers are used in the hotels in resort type accommodation.
Conference halls available in the hotels in greater Colombo city area are
extensively used when compared with the other areas, thereby making
them larger energy consumers.
Most of the graded hotels adopt monitoring and controlling of their energy
consumption. Some have implemented energy conservation measures
too. A particular group of hoteliers in Sri Lanka have already achieved
green hotel labeling owing to their dedication and interest towards energy
conservation and mitigation of environmental impacts. Thereby they have
attracted more guests to their hotel group and earned considerable net
revenue through the same. The adopted measures are; use of efficient
light fixtures, use of timers for pump and lighting operation, proper
sealing of chillers, freezers, doors, use of combined air-conditioning and
water heater systems.

38
Several hotels, being located away from cities, have taken the advantage
of the spacious green environment to minimize the use of energy. The
lobbies and the restaurants of these hotels are open from several sides
with greenery in and around the area, with a high ceiling. This set up
ensures fresh air circulation amply as well as maximum use of daylighting.
Thereby the air conditioning and lighting (during the day time) are not
demanded and a considerable energy saving has been harnessed.
The guests have also been participated in the energy conservation plans
without hindering their stay by the use of keytag system. This method
involves an insertion of a tag in a slot inside the room to energize the
room. Once the key is removed to lock the door from outside, the electric
supply to the room is disconnected whilst a separate supply for the mini-
refrigerators kept inside the room allow them to function.
In contrast to the aforementioned situation, it was observed that some
establishments do not have a clear understanding even on the concepts of
energy audits and assume them to be energy oriented just by keeping
records of energy utilization.
4.2 Analysis of Energy Utilization data
Through the analysis of monthly energy consumption data of the study
sample, summarized energy consumption profile for each type of hotel
was derived and shown in figure 4.1 for the year 2010. In broad sense,
hotels use two types of energy; electricity and thermal energy. Electricity
is used in a wide range of applications including lighting, MVAC, powering
electrical appliances, etc. It is mostly brought from grid and several hotels
depend partially on self generation through renewable sources such as
solar photovoltaic panels, wind, mini hydropower, biomass plants, etc.
Thermal energy appears as LPG, diesel, oil. These are used in cooking,

hot water and steam generation for laundry applications and for operation
of standby generators.
On average, electricity consumption dominates the total energy utilization
balance of all types of hotels, which is approximately 50% of the total.
However, there was an obvious ranking in the six types of hotels with
respect to utilization of each type of
consume substantially more energy than others owing to the higher
quality services provided by them for the guests such as conference halls,
meeting rooms, restaurants, swimming pool, spa, gymnasium, laundry,
etc.
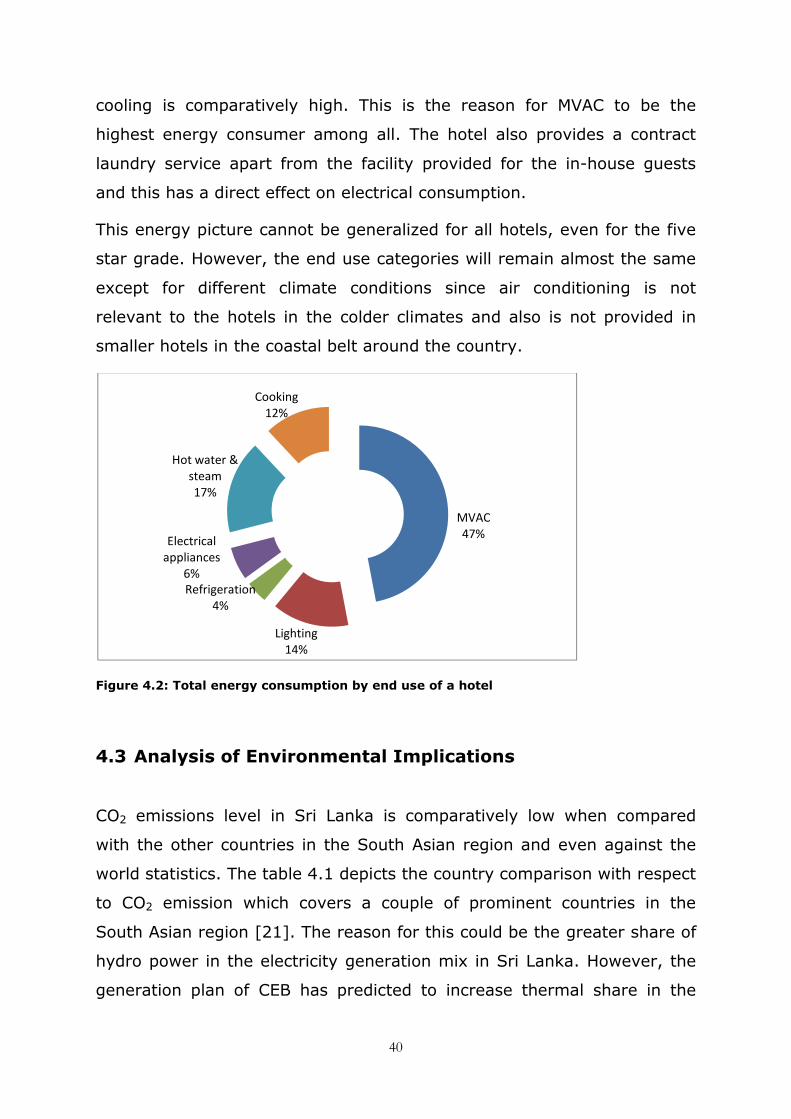
Figure 4.1: Energy utilization
Detailed breakdown of the end consumers of a hotel was derived through
a closer look at the energy utilization balance of a five star hote
represents the application of electricity and thermal energy of the hotel
and depicted in figure
monitoring program through sub
areas of the hotel include MVAC, lighting and hot water and steam supply
whilst MVAC alone accounts for 47%.
diesel for self electricity generation, HFO for steam boiler operation
produce steam and hot water
The hotel is located in a hot, humid
0.00
20.00
40.00
60.00
% s
ha
re
Fuel type
39
hot water and steam generation for laundry applications and for operation
On average, electricity consumption dominates the total energy utilization
balance of all types of hotels, which is approximately 50% of the total.
However, there was an obvious ranking in the six types of hotels with
respect to utilization of each type of energy. Highest rated hotels often
consume substantially more energy than others owing to the higher
quality services provided by them for the guests such as conference halls,
meeting rooms, restaurants, swimming pool, spa, gymnasium, laundry,
: Energy utilization balance of graded establishments -2010
Detailed breakdown of the end consumers of a hotel was derived through
a closer look at the energy utilization balance of a five star hote
represents the application of electricity and thermal energy of the hotel
and depicted in figure 4.2. This particular hotel has a robust energy
monitoring program through sub-metering. Major energy consuming
areas of the hotel include MVAC, lighting and hot water and steam supply
whilst MVAC alone accounts for 47%. This hotel uses LPG for cooking,
diesel for self electricity generation, HFO for steam boiler operation
hot water and electricity for all remaining services.
The hotel is located in a hot, humid climate and thus the demand for
Fuel type
5*
4*
3*
2*
1*
unclassified
hot water and steam generation for laundry applications and for operation
On average, electricity consumption dominates the total energy utilization
balance of all types of hotels, which is approximately 50% of the total.
However, there was an obvious ranking in the six types of hotels with
Highest rated hotels often
consume substantially more energy than others owing to the higher
quality services provided by them for the guests such as conference halls,
meeting rooms, restaurants, swimming pool, spa, gymnasium, laundry,
Detailed breakdown of the end consumers of a hotel was derived through
a closer look at the energy utilization balance of a five star hotel. This
represents the application of electricity and thermal energy of the hotel
This particular hotel has a robust energy
Major energy consuming
areas of the hotel include MVAC, lighting and hot water and steam supply
This hotel uses LPG for cooking,
diesel for self electricity generation, HFO for steam boiler operation to
and electricity for all remaining services.
climate and thus the demand for
40
cooling is comparatively high. This is the reason for MVAC to be the
highest energy consumer among all. The hotel also provides a contract
laundry service apart from the facility provided for the in-house guests
and this has a direct effect on electrical consumption.
This energy picture cannot be generalized for all hotels, even for the five
star grade. However, the end use categories will remain almost the same
except for different climate conditions since air conditioning is not
relevant to the hotels in the colder climates and also is not provided in
smaller hotels in the coastal belt around the country.
Figure 4.2: Total energy consumption by end use of a hotel
4.3 Analysis of Environmental Implications
CO2 emissions level in Sri Lanka is comparatively low when compared
with the other countries in the South Asian region and even against the
world statistics. The table 4.1 depicts the country comparison with respect
to CO2 emission which covers a couple of prominent countries in the
South Asian region [21]. The reason for this could be the greater share of
hydro power in the electricity generation mix in Sri Lanka. However, the
generation plan of CEB has predicted to increase thermal share in the
MVAC
47%
Lighting
14%
Refrigeration
4%
Electrical
appliances
6%
Hot water &
steam
17%
Cooking
12%

41
generation mix considerably in future, resulting increase of the use of
fossil fuels in electricity generation in the power sector. This indicates a
simultaneous increase of the emissions too.
Table 4.1: Comparison of CO2 emissions as at 2010
Country kg CO2/kg of oil
equivalent energy use
Metric tons per
capita
kg CO2/2005 US$ of
GDP adjusted to PPP
Bangladesh 1.8 0.4 0.3
China 3.3 6.2 0.9
India 2.8 1.7 0.5
Indonesia 2.1 1.8 0.5
Pakistan 1.9 0.9 0.4
Sri Lanka 1.3 0.6 0.1
South Asia 2.6 1.4 0.5
World 2.5 4.9 0.5
Source: wdi.worldbank.org
Impact on the environment was looked at in mainly two angles in this
study; emissions through demand side and through electricity generation.
GHG emissions mentioned under the study parameters in chapter 2 were
forecasted through LEAP. CO2 non-biogenic and CO2 biogenic are the
dominant emissions among the considered GHGs. With the induction of
biomass plants into the generation source mix, biogenic CO2 emissions
have emerged. According to United States Environmental Protection
Agency, Biogenic CO2 emissions are defined as “non-fossilized and
biodegradable organic material originating from plants, animals, or
microorganisms (including products, by-products, residues and waste)
from agriculture, forestry and related industries as well as the non-
fossilized and biodegradable organic fractions of industrial and municipal
waste, including gases and liquids recovered from the decomposition of
non-fossilized and biodegradable organic material”. Thus biogenic CO2
emissions do not cause a negative impact on the environment.

5 Results and Discussion
Through a comprehensive data analysis and LEAP model, energy demand
and electricity generation patterns were forecasted. Further
environmental effects and the
scenarios were obtained. The results
demand, transformation, environmental effects and
5.1 Demand Forecast
Energy demand is forecast
graded hotel establishments to cater the envisaged target at the year
2016. Percentage share of electricity, LPG, diesel and
for all hotel grades are assumed to be in the same rates thr
span, even the energy intensity grows as described in chapter 2
figure 5.1 displays a clear ascending trend of the energy demand in the
tourism industry covering each type of graded hotels
This trend declares the requirement of expanded electricity generation,
impact on the environment and increased cost involvement as well.
Figure 5.1: Energy demand forecast based on envisaged target at 2
42
Results and Discussion
Through a comprehensive data analysis and LEAP model, energy demand
and electricity generation patterns were forecasted. Further
environmental effects and the financial component in line with different
scenarios were obtained. The results of the study are discussed under
demand, transformation, environmental effects and economic
Demand Forecast
forecasted based on the existing expansion plan of the
graded hotel establishments to cater the envisaged target at the year
hare of electricity, LPG, diesel and HFO consumption
for all hotel grades are assumed to be in the same rates thr
, even the energy intensity grows as described in chapter 2
.1 displays a clear ascending trend of the energy demand in the
industry covering each type of graded hotels for the study period
This trend declares the requirement of expanded electricity generation,
impact on the environment and increased cost involvement as well.
: Energy demand forecast based on envisaged target at 2016
Through a comprehensive data analysis and LEAP model, energy demand
and electricity generation patterns were forecasted. Further the
in line with different
are discussed under
economic analysis.
based on the existing expansion plan of the
graded hotel establishments to cater the envisaged target at the year
FO consumption
for all hotel grades are assumed to be in the same rates through the time
, even the energy intensity grows as described in chapter 2. The
.1 displays a clear ascending trend of the energy demand in the
for the study period.
This trend declares the requirement of expanded electricity generation,
impact on the environment and increased cost involvement as well.
016

Figure 5.2 shows the advantage of implementing DSM over the existing
demand. The energy savings are demonstrated by a negative energy
demand against the baseline scenario resulted through DSM measures.
Figure 5.2: Advantage of DSM over existing demand
Implementing DSM measures is also important in the present context of
the Sri Lankan tourism industry in several ways;
(a) As shown in the figure
substantial amount of electricity, more than 60% of total energy
utilization for MVAC, lighting etc. Therefore, reducing electricity
usage for the same level of energy services reduces the energy
costs, resulting increased profits.
(b) Saving electricity reduces the g
since transmission and distribution losses are minimized in
parallel to the customer end savings.
(c) Electricity at present context is generated mainly through fossil
fuels; coal and oil. More the generation of electricity throug
these fuels, more the environmental impacts that it gives. It
43
.2 shows the advantage of implementing DSM over the existing
demand. The energy savings are demonstrated by a negative energy
demand against the baseline scenario resulted through DSM measures.
: Advantage of DSM over existing demand
Implementing DSM measures is also important in the present context of
the Sri Lankan tourism industry in several ways;
As shown in the figure 4.2, in general hotels consume a
ial amount of electricity, more than 60% of total energy
utilization for MVAC, lighting etc. Therefore, reducing electricity
usage for the same level of energy services reduces the energy
costs, resulting increased profits.
Saving electricity reduces the generation requirements mainly
since transmission and distribution losses are minimized in
parallel to the customer end savings.
Electricity at present context is generated mainly through fossil
fuels; coal and oil. More the generation of electricity throug
these fuels, more the environmental impacts that it gives. It
.2 shows the advantage of implementing DSM over the existing
demand. The energy savings are demonstrated by a negative energy
demand against the baseline scenario resulted through DSM measures.
Implementing DSM measures is also important in the present context of
.2, in general hotels consume a
ial amount of electricity, more than 60% of total energy
utilization for MVAC, lighting etc. Therefore, reducing electricity
usage for the same level of energy services reduces the energy
eneration requirements mainly
since transmission and distribution losses are minimized in
Electricity at present context is generated mainly through fossil
fuels; coal and oil. More the generation of electricity through
these fuels, more the environmental impacts that it gives. It

creates local as well as global pollution through emissions
associated with such fuels. By introducing DSM concepts, the
electricity demand can be reduced so will it reduce the
environmental p
(d) Energy prices increase gradua
Lanka depends on oil and coal imports for electricity generation.
Oil price shocks in several occasions have given a lesson to adopt
energy conservation and efficient technologies
usage of electricity.
5.2 Transformation Forecast
Based on the LTGEP of CEB, the baseline scenario
and the related electricity generation plan for the study period is shown in
figure 5.3. It implies the non availability of new
generation mix while the induction of coal power plants increases steadily.
The hydro capacities indicate only the major hydro plants be
committed.
Figure 5.3: Electricity Generation profile
44
creates local as well as global pollution through emissions
associated with such fuels. By introducing DSM concepts, the
electricity demand can be reduced so will it reduce the
environmental pollution.
Energy prices increase gradually in the international market.
Lanka depends on oil and coal imports for electricity generation.
Oil price shocks in several occasions have given a lesson to adopt
energy conservation and efficient technologies for production and
usage of electricity.
Transformation Forecast
Based on the LTGEP of CEB, the baseline scenario was modeled in LEAP
and the related electricity generation plan for the study period is shown in
.3. It implies the non availability of new NCRE
generation mix while the induction of coal power plants increases steadily.
The hydro capacities indicate only the major hydro plants be
: Electricity Generation profile - Baseline scenario
creates local as well as global pollution through emissions
associated with such fuels. By introducing DSM concepts, the
electricity demand can be reduced so will it reduce the
lly in the international market. Sri
Lanka depends on oil and coal imports for electricity generation.
Oil price shocks in several occasions have given a lesson to adopt
for production and
s modeled in LEAP
and the related electricity generation plan for the study period is shown in
sources in the
generation mix while the induction of coal power plants increases steadily.
The hydro capacities indicate only the major hydro plants being

45
Since the baseline scenario was modeled in parallel with the LTGEP of
CEB, it inherits the assumptions made by the CEB in the generation
planning process. These assumptions listed below have become a
controversial fact in Sri Lanka since some argues them to be
inappropriate.
(a) The only dispatchable resources available for power generation in
Sri Lanka is hydro, coal and oil.
(b) Prices of coal and oil and the exchange rate are constant for the
next 20 years.
(c) No differentiation is made for indigenous resources and imported
fuels.
(d) Taxes and duties on imports are ignored.
(e) Environmental and social costs involved with fossil fuels are
ignored.
(f) Life time of a hydro plant is taken as 30 years and yet there are
plants generating electricity, even after 50 years such as
Laxhapana which has not been taken into account.
(g) Coal plants can only cater the base load and essentially oil power
plants are to cater peak loads. The combined effect of these two
is ignored.
However, these assumptions are valid for the CEB generation plan in
existence. It is observed that the generation mix in the future of Sri Lanka
is coal dominant which is the least cost option suggested by the CEB.
In line with the LTGEP of CEB and the National Energy Policy, the
generation mix was forecasted through LEAP and still the existence of
new NCRE does not become significant. The electricity generation mix
forecasted based on the National Energy Policy is depicted in figure 5.4.

Figure 5.4: Electricity Generation based on National Energy Policy
Whilst carrying out the renewable plant additions, existing thermal plant
retirements and additions are done in order to sustain the g
requirement with the forecasted demand.
comparison of plant additions and retirements
scenario and Coal free generation scenario
respectively.
46
Electricity Generation based on National Energy Policy
Whilst carrying out the renewable plant additions, existing thermal plant
retirements and additions are done in order to sustain the g
requirement with the forecasted demand. Figure 5.5 and 5.6 show t
plant additions and retirements of Energy Policy target
and Coal free generation scenario against baseline scenario
Whilst carrying out the renewable plant additions, existing thermal plant
retirements and additions are done in order to sustain the generation
Figure 5.5 and 5.6 show the
Energy Policy target
against baseline scenario

Figure 5.5: Comparison of Electricity
Figure 5.6: Comparison of Electricity Generation mixes (
Figure 5.7 shows the comparison of plant additions and retirements
Renewable Promotion scenario
47
Electricity Generation mixes (EPT vs BAS)
Comparison of Electricity Generation mixes (COA vs BAS)
he comparison of plant additions and retirements
Renewable Promotion scenario against Energy Policy target scenario
he comparison of plant additions and retirements of
Energy Policy target scenario. This

hypothetical case was modeled by retiring the thermal plants and adding
NCRE plants, mainly wind and biomass though the practical
implementation in Sri Lanka is not seen in the near future.
brief discussion on the availability of NCRE sources and on the non
existence of them in the generation mix of Sri Lanka
the reasons for this scenario to be ‘hypothetical’.
Figure 5.7: Comparison of Electricity Generation mixes (REN
Country has untouched technical potential of
mini/micro hydro power, 1000 MW biomass thermal power and over
20000 MW wind power.[
LTGEP of CEB owing to technical, economical and social barriers.
Furthermore, though the studies reveal that the country has a
considerable amount of untouched NCRE potential, Sri Lanka is not
geared to measure them properly; for example, wind measuring masts
are not established at the northern and northwestern coastal belts, where
a higher wind potential is reported.
48
s modeled by retiring the thermal plants and adding
NCRE plants, mainly wind and biomass though the practical
mplementation in Sri Lanka is not seen in the near future.
the availability of NCRE sources and on the non
existence of them in the generation mix of Sri Lanka follows. It indicates
the reasons for this scenario to be ‘hypothetical’.
: Comparison of Electricity Generation mixes (REN vs EPT)
Country has untouched technical potential of NCRE, about 250 M
mini/micro hydro power, 1000 MW biomass thermal power and over
20000 MW wind power.[22] However, these are not been captured by the
LTGEP of CEB owing to technical, economical and social barriers.
though the studies reveal that the country has a
considerable amount of untouched NCRE potential, Sri Lanka is not
geared to measure them properly; for example, wind measuring masts
are not established at the northern and northwestern coastal belts, where
a higher wind potential is reported.
s modeled by retiring the thermal plants and adding
NCRE plants, mainly wind and biomass though the practical
mplementation in Sri Lanka is not seen in the near future. However, a
the availability of NCRE sources and on the non-
follows. It indicates
about 250 MW
mini/micro hydro power, 1000 MW biomass thermal power and over
] However, these are not been captured by the
LTGEP of CEB owing to technical, economical and social barriers.
though the studies reveal that the country has a
considerable amount of untouched NCRE potential, Sri Lanka is not
geared to measure them properly; for example, wind measuring masts
are not established at the northern and northwestern coastal belts, where

49
The CEB incurs heavy losses in sustaining the thermal power plants due
to sudden price hikes of fuel in the global fuel market. Sri Lanka still
depends on import of fossil fuels due to non availability of fuel reserves.
Thus the Government of Sri Lanka carries the burden by providing grants,
subsidies and removing taxes and other levies owned by CEB. For the
same reason, fuel costs of conventional thermal power generation do not
represent the exact values and thus subsidized prices are used for
calculations. Competitive advantage of having free fuel in NCRE options
are not highlighted due to this. CEB follows a least cost option in the
selection process of candidate plants in the generation mix and NCRE
options will not be attractive in that sense.
In order to maintain the system stability and integrity, CEB has put up
certain limits of dispatchable capacity for NCRE sources. This is another
restriction for harnessing the NCRE sources available in Sri Lanka. The
electricity transmission and distribution network in the country requires to
be modified to overcome this issue.
Investors are reluctant to take up unproven projects. The techno-
economical feasibilities are to be done by the Government to promote the
stakeholders in investing on NCRE technologies. As per table 2.1 of LTGEP
of CEB in 2010 and even in 2013, not a single NCRE plant has been
considered as candidates. Even though the CEB maintains a 3 MW wind
plant as a pilot project at Hambanthota, the table 2.1 of LTGEP carries
end note ‘Wind is a non-dispatchable source of energy. Therefore, it has
not been accounted for the total’ [23]. Thus, the future power generation
in Sri Lanka is dominated by coal plants together with oil and hydro as the
remaining share. Further the country is lacking the studies on dynamic
grid stability and power system flexibility to incorporate the potential of
NCRE sources.
The selection of a candidate plant for the generation plan is influenced by
the national interests prioritizing the reliability of power supply and the
foreign currency savings. Furthermore the access to technical know-how

and impacts on cultural, heritage and aesthetics are concerned. Currently
NCRE become the least attractive option on the
5.3 Environmental Impacts
Impacts to the environment
generation perspectives. With the increase of energy utilization in the
tourism industry, gradual increase of
warming potential is observed in the baseline scenario as shown in figure
5.8.
Figure 5.8 : Increase of global warming potential
50
and impacts on cultural, heritage and aesthetics are concerned. Currently
NCRE become the least attractive option on these national interests.
nvironmental Impacts
Impacts to the environment were scanned mainly through demand and
generation perspectives. With the increase of energy utilization in the
industry, gradual increase of CO2 emissions and the global
warming potential is observed in the baseline scenario as shown in figure
: Increase of global warming potential
and impacts on cultural, heritage and aesthetics are concerned. Currently
national interests.
re scanned mainly through demand and
generation perspectives. With the increase of energy utilization in the
emissions and the global
warming potential is observed in the baseline scenario as shown in figure

Once the demand is mitigated through DSM measures, a significant
reduction of global warming potential is noticed as depicted in figure
Figure 5.9: Reduction of one hundred year global warming potentia
measures
Based on the LEAP model, it is observed that the energy policy target
does not emit CO2 non biogenic as shown in figure
emit CO2 biogenic due to induction of biomass plants for electricity
generation throughout the years which would not harm the environment.
This is resulted from thermal plant retirements and additions of new NCRE
sources in the electricity generation mix.
51
Once the demand is mitigated through DSM measures, a significant
reduction of global warming potential is noticed as depicted in figure
one hundred year global warming potentia
Based on the LEAP model, it is observed that the energy policy target
non biogenic as shown in figure 5.10. This plan will still
biogenic due to induction of biomass plants for electricity
generation throughout the years which would not harm the environment.
This is resulted from thermal plant retirements and additions of new NCRE
sources in the electricity generation mix.
Once the demand is mitigated through DSM measures, a significant
reduction of global warming potential is noticed as depicted in figure 5.9.
one hundred year global warming potential through DSM
Based on the LEAP model, it is observed that the energy policy target
. This plan will still
biogenic due to induction of biomass plants for electricity
generation throughout the years which would not harm the environment.
This is resulted from thermal plant retirements and additions of new NCRE

Figure 5.10: Avoided CO2 emissions through Alternative energy sources
If the country could afford a crucial change in electricity generation by
adding NCRE in the extend stipulated under renewable promotion
scenario, which is treated as a hypothetical case in
reduction of CO2 is observed as shown in figure 5.
environmental impacts of renewable promotion scenario are compared
against energy policy target scenario. This can be considered as a
competitive advantage of renewable promotion over other scenarios.
However, the constraints in doing so are
concluding notes.
52
emissions through Alternative energy sources
If the country could afford a crucial change in electricity generation by
adding NCRE in the extend stipulated under renewable promotion
io, which is treated as a hypothetical case in this study
is observed as shown in figure 5.11
environmental impacts of renewable promotion scenario are compared
against energy policy target scenario. This can be considered as a
competitive advantage of renewable promotion over other scenarios.
constraints in doing so are descriptively elaborated in the
emissions through Alternative energy sources
If the country could afford a crucial change in electricity generation by
adding NCRE in the extend stipulated under renewable promotion
this study, further
1. In this, the
environmental impacts of renewable promotion scenario are compared
against energy policy target scenario. This can be considered as a
competitive advantage of renewable promotion over other scenarios.
elaborated in the

Figure 5.11: Competitive advantage of NCRE additions
Through the analysis of the hypothetical case, the ‘Renewable Promotion’
scenario, it is observed in
into generation mix it will lead to more benefits
emissions.
As described in table 4.1, CO
lower than the South Asian countries and the wo
Environmental Impact Assessment (EIA) enforces national and regional
standards of pollution control for power plants. However, EIA is only used
as a tool of delaying a construction of a power plant in the present
context of Sri Lanka and it do
lower CO2 emission level. Apart from the major GHG emissions, coal ash
also contains toxic heavy metals and coal burning plants are a leading
source for emission of radioactive materials to the environment (Rhodes
et al, 2000) [24]. Thus it is important to note that the affordable
electricity through coal is delivered at a steeper environmental price.
Irrespective of afore mentioned facts, the CEB has chosen coal being the
cheapest technology at the expense of the environment.
53
: Competitive advantage of NCRE additions
Through the analysis of the hypothetical case, the ‘Renewable Promotion’
scenario, it is observed in figure 5.11 that if more NCRE options are taken
into generation mix it will lead to more benefits such as savings in CO
As described in table 4.1, CO2 emission level in Sri Lanka is comparatively
lower than the South Asian countries and the wo
Environmental Impact Assessment (EIA) enforces national and regional
standards of pollution control for power plants. However, EIA is only used
as a tool of delaying a construction of a power plant in the present
and it does not enforce the limitations due to the
emission level. Apart from the major GHG emissions, coal ash
also contains toxic heavy metals and coal burning plants are a leading
source for emission of radioactive materials to the environment (Rhodes
Thus it is important to note that the affordable
electricity through coal is delivered at a steeper environmental price.
Irrespective of afore mentioned facts, the CEB has chosen coal being the
cheapest technology at the expense of the environment.
Through the analysis of the hypothetical case, the ‘Renewable Promotion’
that if more NCRE options are taken
such as savings in CO2
emission level in Sri Lanka is comparatively
lower than the South Asian countries and the world average.
Environmental Impact Assessment (EIA) enforces national and regional
standards of pollution control for power plants. However, EIA is only used
as a tool of delaying a construction of a power plant in the present
es not enforce the limitations due to the
emission level. Apart from the major GHG emissions, coal ash
also contains toxic heavy metals and coal burning plants are a leading
source for emission of radioactive materials to the environment (Rhodes
Thus it is important to note that the affordable
electricity through coal is delivered at a steeper environmental price.
Irrespective of afore mentioned facts, the CEB has chosen coal being the

5.4 Economic Analysis
Final results of economic
scenarios based on the constraints and assumptions made in chapter 2.
Therefore the results of this study may not interpret the exact cost
figures. However, these resul
scenarios and technologies
costs of the studied scenarios as at year 2016. Renewable promotion
scenario considers addition of NCRE technologies over thermal additions.
Thus capital cost intensiveness of the NCRE plant additions is obviously
seen in this figure. Further the variable operation and maintenance cost
for NCRE sources are zero with the exception for biomass been 0.53 US
cent/ kWh. Therefore the variable O&M cost i
scenario shows a clear reduction.
renewable promotion scenario is also an interesting result observed
through this.
Figure 5.12: Cumulative discounted s
54
Analysis
onomic analysis display the performance of the studied
scenarios based on the constraints and assumptions made in chapter 2.
Therefore the results of this study may not interpret the exact cost
figures. However, these results provide a platform to compare various
and technologies. Figure 5.12 compares the predicted
costs of the studied scenarios as at year 2016. Renewable promotion
scenario considers addition of NCRE technologies over thermal additions.
capital cost intensiveness of the NCRE plant additions is obviously
Further the variable operation and maintenance cost
for NCRE sources are zero with the exception for biomass been 0.53 US
cent/ kWh. Therefore the variable O&M cost in the renewable promotion
scenario shows a clear reduction. Lesser externality costs involved in the
renewable promotion scenario is also an interesting result observed
Cumulative discounted social costs as at year 2016
display the performance of the studied
scenarios based on the constraints and assumptions made in chapter 2.
Therefore the results of this study may not interpret the exact cost
ts provide a platform to compare various
predicted social
costs of the studied scenarios as at year 2016. Renewable promotion
scenario considers addition of NCRE technologies over thermal additions.
capital cost intensiveness of the NCRE plant additions is obviously
Further the variable operation and maintenance cost
for NCRE sources are zero with the exception for biomass been 0.53 US
n the renewable promotion
Lesser externality costs involved in the
renewable promotion scenario is also an interesting result observed

The cost benefit analysis over the scenarios in the study
baseline scenario is summarized
scenarios other than the
establishments because they carry same
intensity of DSM scenario is lesser than that of BAS scenario and
indicated by the negative values.
5.5 Sensitivity screening results
The sensitivity of the preliminary LEAP model
variables. The DSM scenario in the preliminary LEAP model
electricity savings through numerous DSM measures.
further 50% reduction of electricity demand through DSM measures
shows an attractive saving
figure 5.13. This in turn has reduced the emissions too as shown in figure
5.14. However, this would not be practically feasible.
Figure 5.13: Sensitivity at various saving % of DSM measures
55
analysis over the scenarios in the study compared to the
is summarized in Appendix C. Costs for demand in all
scenarios other than the DSM Scenario are zero for all hote
establishments because they carry same level of demand. Energy demand
of DSM scenario is lesser than that of BAS scenario and
indicated by the negative values.
Sensitivity screening results
The sensitivity of the preliminary LEAP model was tested for different
variables. The DSM scenario in the preliminary LEAP model
electricity savings through numerous DSM measures. A case to model
50% reduction of electricity demand through DSM measures
shows an attractive saving option in the demand side which is depicted in
. This in turn has reduced the emissions too as shown in figure
However, this would not be practically feasible.
various saving % of DSM measures
compared to the
Costs for demand in all
are zero for all hotel
level of demand. Energy demand
of DSM scenario is lesser than that of BAS scenario and thus
s tested for different
variables. The DSM scenario in the preliminary LEAP model considers 30%
A case to model
50% reduction of electricity demand through DSM measures
in the demand side which is depicted in
. This in turn has reduced the emissions too as shown in figure

Figure 5.14: Comparison of reduced CO
Cost and benefit calculations
model. In order to analyze the effect
calculations were repeated at 5% and 15% discount rates. Through the
main calculation summaries, the NPVs of the scenarios
and it is depicted in table 5.
the values compared to the NPV of baseline scenario in million US$,
discounted to the relative year
implementation of DSM scenario is the most
until year 2014, having the least NPV
the second option for these years and it becomes the most socially
acceptable scenario in year 2015.
56
: Comparison of reduced CO2 emissions
Cost and benefit calculations were done at 10% discount rate in the LEAP
analyze the effect of discount rate on
re repeated at 5% and 15% discount rates. Through the
main calculation summaries, the NPVs of the scenarios we
and it is depicted in table 5.1. The NPV values presented in the table are
ared to the NPV of baseline scenario in million US$,
discounted to the relative year. According to the results of the study,
mplementation of DSM scenario is the most socially acceptable
, having the least NPV at all discount rates.
the second option for these years and it becomes the most socially
acceptable scenario in year 2015.
re done at 10% discount rate in the LEAP
discount rate on the model,
re repeated at 5% and 15% discount rates. Through the
were compared
. The NPV values presented in the table are
ared to the NPV of baseline scenario in million US$,
According to the results of the study,
socially acceptable scenario
EPT scenario is
the second option for these years and it becomes the most socially

57
Table 5.1: Sensitivity of NPV at various discount rates
Summary of NPV based on Cumulative Costs and Benefits
(Compared to Baseline Scenario) Million 2010 US$
Discounted
year
Discount
rate
NPV
DSM EPT COA REN
2010
5 (692.05) (168.20) 4365.72 974.38
10 (535.56) (114.10) 3364.97 820.91
15 (420.97) (76.92) 2634.28 699.49
2011
5 (589.42) (169.92) 4779.97 840.73
10 (474.15) (123.95) 3837.04 718.81
15 (386.48) (90.58) 3119.92 620.66
2012
5 (464.03) (216.40) 4672.32 804.43
10 (385.80) (174.23) 3903.83 696.3
15 (324.14) (141.65) 3295.67 607.94
2013
5 (350.09) (219.49) 4005.17 598.6
10 (300.96) (184.99) 3451.22 525.09
15 (260.80) (157.08) 2997.46 463.93
2014
5 (225.76) (227.80) 2979.55 464.83
10 (199.71) (202.59) 2640.72 415.48
15 (177.71) (181.20) 2354.18 373.4
2015
5 (183.17) (603.98) 1332.95 200.21
10 (166.90) (550.32) 1214.53 182.43
15 (166.90) (550.32) 1214.53 182.43
Same result derived through table 5.1 is interpreted in figure 5.15 too. It
is clearly represented that DSM and EPT carry negative NPV and thus
become the most socially acceptable scenarios throughout the study
period. The exceptionally high NPVs of COA are incurred by the fuel
import cost. In coal free generation scenario, the capacity replacements
were totally done by thermal oil plant additions and thus incur a
considerable cost for oil imports. In comparison to COA, REN becomes
attractive irrespective of the higher capital costs involved in NCRE plants,
because they have the benefit of zero fuel cost.

58
Figure 5.15: Sensitivity of NPV at various discount rates
Fuel price escalation is an important global economic implication. Future
fuel prices are uncertain, yet carry an increasing trend. Owing to the fact
that the price hikes are depending on numerous factors, it is difficult to
predict the exact cost escalation rates. The fuel prices used in the
baseline scenario were obtained from the CEB officials along with the
predicted escalation rates. These rates were used as inputs to the ‘Fuel
Price Hike’ scenario. Sensitivity of the LEAP model for such fuel price
escalation is shown in figure 5.16. It compares the fuel import costs of
the fuel price hike scenario to that of baseline scenario. The positive
values of the figure show the impact of the increased fuel prices.
(1500.00)(1000.00)(500.00)
0.00 500.00
1000.00 1500.00 2000.00 2500.00 3000.00 3500.00 4000.00 4500.00 5000.00 5500.00 6000.00
5% 10%
15% 5% 10%
15% 5% 10%
15% 5% 10%
15% 5% 10%
15% 5% 10%
15%
2010 2011 2012 2013 2014 2015
Million
s (U
S $
)REN
COA
EPT
DSM
NPV

Figure 5.16: Sensitivity of LEAP model for fuel price escal
59
: Sensitivity of LEAP model for fuel price escalations

60
6 Conclusions and Future work
Post war turnaround witnessed by the tourism industry in Sri Lanka
continues its growth momentum towards a successful future. Sustainable
development of the industry is crucial because it carries a considerable
share of GDP of the country. Further the requirement exists to upgrade
Sri Lanka from the perception of ‘affordable destination’ whilst showcasing
its milestone in year 2016, the ‘Miracle of Asia’. Analytical studies over
the tourism industry of Sri Lanka on energy utilization are rare. In the aim
of sustainable development, the future of the industry needs to be
forecasted in terms of energy supply and utilization, which is approached
by the study. The associated environmental impacts are also weighed
because greening the tourism industry paves the way to its consistency.
The study also gives an opportunity to the stakeholders including the
policy makers to make decisions pertaining to the tourism industry and
electricity generation through a socio-economic comparison based on
cost-benefit analysis.
The results of the study suggest the following conclusions;
(a) Evaluation of energy consumption of hotels is challenging than
other building types and the energy consumption situation in
such environment carries a different identity among other
industries. Thus in order to reach at a precise analysis on the
energy utilization of the tourism industry, detailed data analysis
of the industry around the country is required. Some small and
medium scale hotel chains still do not realize the value of data
monitoring and create barriers for a complete study.
(b) Implementation of DSM measures in the tourism industry is
mandatory to mitigate the energy intensiveness along with the
impulsive growth expected in a shorter time span in the country.
Sri Lankan tourism is in the process of grabbing the DSM
measures and benefited by the same.

61
(c) Electricity in the present context is generated mainly through
fossil fuels. Induction of NCRE sources into the electricity
generation mix in parallel with the National Energy Policy is more
environmental friendly than following the existing generation
plan of CEB. However this process will not come into reality in
the near future due to the restrictions in practical
implementation.
(d) The existing LTGEP of CEB does not accommodate fuel
diversification and energy mix . It is a plan based on the least
cost principle. Thus there is no room for NCRE promotion in the
current generation plan of the country. This in turn demands the
necessity of revisions in current generation planning.
The results of the study can be used by the policy makers and the
stakeholders in the tourism industry and the energy sector for a greener
Sri Lanka in future.
Detailed analysis on electricity utilization in the tourism industry demands
detailed data from hotels, utility and appliance manufacturers.
Comprehensive data on appliances, ratings, usage patterns, actual energy
usage, life etc from hotels is required while the details of efficient
appliances, optimum use of them are required from manufacturers.
Further, the information on tariffs, load profile, etc would be required for
precise analysis of utilization of energy in the industry. The energy
intensity of industry associated activities has not been considered in this
study, which demands a lot of data and time as well as close coordination
with the development authorities. Such detailed exercise is outside the
scope of this study and it is recommended for future study. This study is
mainly based on limited accessible data from the consumer profile and
based on the information available in literature.

62
References
[1] Annual statistical report of Sri Lanka Tourism, 2010
[2] ‘Statistical Digest’, 2010, CEB [3] ‘Sri Lanka Energy Balance 2011, an analysis of the energy sector performance’, Sri Lanka Sustainable Energy Authority [4] Oak Ridge National Laboratory, ‘The effects of considering externalities on electric utilities mix of resources’; case study of Massachusetts, Wisconsin and California (Oak Ridge. TN 2009) [5] Heaps, C.G., 2012. Long-range Energy Alternatives Planning (LEAP) system [Software version 2012.0055] Stockholm Environment Institute. Somerville, MA, USA. www.energycommunity.org
[6] IPCC Assessment report, Fourth (AR4, 2007) [7] http://data.worldbank.org/indicator/EG.ELC.LOSS.ZS [8] Grubb M., Walker J, 1992, ‘Emerging Energy Technologies: Impacts and Policy Implications’, pp 122, Royal Institute of International Affairs, Dartmouth Publishing Co.
[9] UNTWO Annual report 2011
[10] https://www.cia.gov/the-world-factbook
[11] UNWTO World Tourism Barometer, ISSN:1728-9246
[12] ‘Tourism Development Strategy 2011-2016’, Ministry of Economical Development
[13] Central Bank of Sri Lanka Annual Report-2010, Chapter 1, pg 26
[14]http://www.ecotourism.org/oslo-statement-on-ecotourism
(The International Ecotourism Society)

63
[15] Priyadarshini, R., Xuchao, W., and Eang, L. S., ‘A study on energy performance of hotel buildings in Singapore’, Journal of Energy and Buildings, Vol 41, 2009, pp 1319-1324 [16] Ali, Y., Mustafa, M., Al Mashaqbah, S., Mashal, K., & Mohsen, M., ’Potential of energy savings in the hotel sector in Jordan’, Journal of Energy Conversion and Management’, Vol 49, 2008, pp 3391-3397
[17] Deng, S., Burnett, J., ‘A study of energy performance of hotel building in Hong Kong’, Journal of Energy and Buildings, Vol 31, 2007, p. 7-12
[18] Karagiorgas, M., Tsoutsos, T., Moiá-Pol, A., ’ A simulation of the energy consumption monitoring in medeterranean hotels applications in Greece’, Journal of Energy & Buildings, Vol 39, 2007, pp. 416-426
[19] Wang, JC., ‘A study on the energy performance of hotel buildings in Taiwan’, Journal of Energy and Buildings, Vol 49, 2012, pp 268-275
[20] Udawatta, L., Perera, A., Witharana, S., ‘Analysis of Sensory Information for Efficient Operation of Energy Management Systems in Commercial Hotels’, EJSE Special Issue: Wireless Sensor Networks and Practical Applications (2010) [21] http://wdi.worldbank.org/table/3.8
[22] Conference proceedings, ‘Achieving sustainability and equity in energy: policy choices for the future and practical actions’, Sri Lanka Sustainable Energy Authority (2008)
[23] Long-term Generation Expansion Plan CEB, December 2010
[24] Rhodes, Richard & Beller, Denis. 2000, ‘The need for nuclear power, Foreign affairs’, 79(1) pp. 30-44

64
Appendices
Appendix A: Initial values of the input parameters
Appendix A-1: Establishment data as at 2010(Base year)
Scenario Star Grade
Input parameter IV Unit Reference
BAS
Total Room capacity 22745 -
[1]
5
Room capacity 3230 - % Share of total hotels 5.5 %
Occupancy rate 76.8 %
4
Room capacity 1638 - % Share of total hotels 6.6 %
Occupancy rate 74.7 %
3
Room capacity 1324 - % Share of total hotels 5.1 %
Occupancy rate 68.1 %
2
Room capacity 2008 - % Share of total hotels 12.1 %
Occupancy rate 67.4 %
1
Room capacity 1177 - % Share of total hotels 12.8 %
Occupancy rate 66.5 %
U/C
Room capacity 5337 - % Share of total hotels 57.9 %
Occupancy rate 67.7 % IV-Initial Value

65
Appendix A-2: Annual fuel consumption/guest room as at 2010
Scenario Star Grade
Input parameter IV* Unit Reference
BAS
5 Star
Electricity 7435.31
GJ/year **
Diesel 4383.90
HFO 750.00
LPG 1563.00
4 Star
Electricity 7140.79
Diesel 2853.77
HFO 998.00
LPG 1365.41
3 Star
Electricity 7293.01
Diesel 4041.77
HFO 712.00
LPG 1425.95
2 Star
Electricity 4901.00
Diesel 2629.70
HFO 917.01
LPG 2993.84
1 Star
Electricity 1387.33
Diesel 2135.09
HFO 213.00
LPG 370.49
U/C
Electricity 1009.65
Diesel 534.87
HFO 187.00
LPG 254.68
* IV – Initial Value
**These values are calculated through the monthly consumption data of the hotel
sample for year 2010, 2011 and 2012. Average annual consumption of each fuel type
has been calculated.
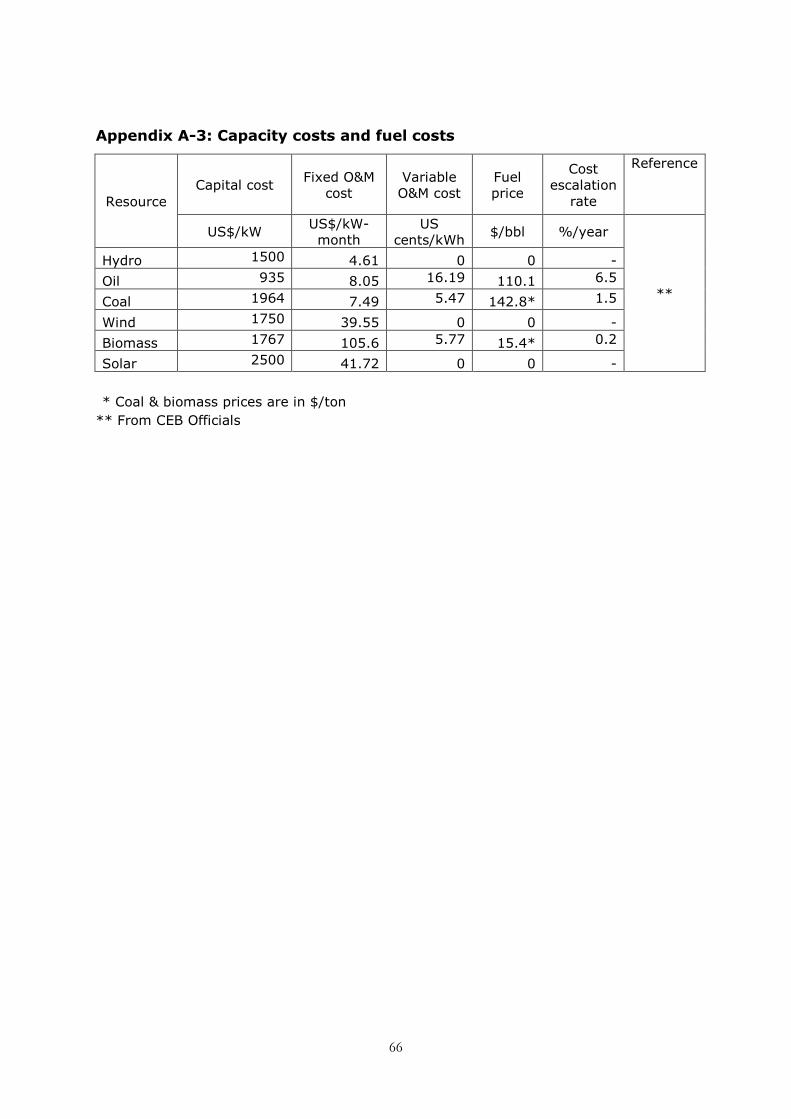
66
Appendix A-3: Capacity costs and fuel costs
Resource Capital cost
Fixed O&M cost
Variable O&M cost
Fuel price
Cost escalation
rate
Reference
US$/kW US$/kW-month
US cents/kWh
$/bbl %/year
**
Hydro 1500 4.61 0 0 -
Oil 935 8.05 16.19 110.1 6.5
Coal 1964 7.49 5.47 142.8* 1.5
Wind 1750 39.55 0 0 -
Biomass 1767 105.6 5.77 15.4* 0.2
Solar 2500 41.72 0 0 -
* Coal & biomass prices are in $/ton
** From CEB Officials

67
Appendix A-4: T & D losses and Emission factors
Input parameter IV* Unit Reference
Transmission & Distribution losses
Electricity 14 %
[7]
Diesel 28 %
LPG 7 %
Emission factors
Thermal Oil
[6]
CO2 non biogenic 76.54 MT/TJ
CO2 biogenic 16.00 kg/TJ
Methane 0.90 kg/TJ
NOx 220.00 kg/TJ
N2O 0.40 kg/TJ
Thermal Coal
CO2 non biogenic 92.64 MT/TJ
[6]
CO2 biogenic 9.00 kg/TJ
Methane 0.70 kg/TJ
NOx 380.00 kg/TJ
N2O 1.60 kg/TJ
S2O 0.04 kg/TJ
Biomass
CH4 30.00 kg/TJ
[6]
NMVOC 50.00 kg/TJ
NOx 100.00 kg/TJ
NO 4.00 kg/TJ
SO2 0.00 kg/TJ
CO2 109.56 kg/MT
CO 1000.00 kg/TJ
* IV – Initial Value

68

KN Amarawardhana_731126-P643_SSW-OUSL-2010/12
Appendix A-5: Capacity additions & Retirements for different scenarios
Case Year Capacity Additions/(MW) Total
/(MW)
Capacity Retirements/(MW) Total
/(MW) Hydro Oil Coal Wind Biomass Solar Hydro Oil Coal Wind Biomass Solar
BAS
2010 - 270 - - - - 270 - 180 - - - - 180
2011 - - 285 - - - 285 - 85 - - - - 85
2012 150 - - - - - 150 - 20 - - - - 20
2013 - - 820 - - - 820 - 114.5 - - - - 114.5
2014 - - 250 - - - 250 - - - - - 0
2015 - - 300 - - - 300 - 260 - - - - 260
2016 - - - - - - 0 - - - - - 0
EPT
2010 - 270 - 50 - - 320 - - - - - - 0
2011 150 - 500 37.5 37.5 12.5 737.5 - 85 - - - - 85
2012 - - - - 50 25 75 - 20 - - - - 20
2013 - - 570 - 25 - 595 - 114.5 - - - - 114.5
2014 - - 250 25 37.5 - 312.5 - 230.5 - - - - 230.5
2015 - - 250 12.5 37.5 12.5 312.5 - 29.5 - - - - 29.5
2016 - - 300 12.5 14.5 12.5 339.5 - - - - - - 0
Reference: [23]

70
Appendix A-5: Capacity additions & Retirements for different scenarios/ Contd
Case Year Capacity Additions/(MW) Total
/(MW)
Capacity Retirements/(MW) Total
/(MW) Hydro Oil Coal Wind Biomass Solar Hydro Oil Coal Wind Biomass Solar
COA
2010 - - - - - - 0 - - - - - - 0
2011 - 240 - - - - 240 - - - - - - 0
2012 150 20 285 - - - 455 - 20 - - - - 20
2013 - 500 - - - - 500 - - - - - - 0
2014 - - - - - - 0 - - - - - - 0
2015 - 600 - - - - 600 - - - - - - 0
2016 - 500 - - - - 500 - - - - - - 0
REN
2010 150 270 285 50 - 50 805 - 180 - - - - 180
2011 - - - 1735 50 50 1835 - 85 - - - - 85
2012 50 - 215 450 50 - 765 - 20 - - - - 20
2013 50 - - 435 50 50 585 - 114.5 - - - - 114.5
2014 50 - - 385 50 50 535 - - - - - 0
2015 - - - 680 50 - 730 - 260 - - - - 260
2016 - - - 370 50 - 420 - - - - - 0
Reference: [23]

KN Amarawardhana_731126-P643_SSW-OUSL-2010/12
Appendix B: Cost – Benefit Analysis Methodology in LEAP
LEAP carry out the cost-benefit calculations from a societal perspective
and not the final prices of energy to the consumer. Social costs and prices
may differ. Electricity prices often differ from the cost of production due to
subsidies, transfer payments and market distortions. Cost-benefit
analysis in LEAP counts up all the costs and benefits of an energy system
and the end result is a comparison of costs and benefits of any number of
scenarios within the system with respect to a reference scenario. The
costs and benefits been counted up by LEAP are;
(a) Demand costs
(b) Capital costs of energy generation
(c) Fixed and variable O&M costs
(d) Costs of indigenous resources
(e) Costs of imported fuels
(f) Benefits of exported fuels
(g) Externality costs from emissions
(h) Any other user defined costs such as direct social and
environmental impacts of the energy system
Therefore, the cost-benefit analysis in LEAP does not provide a merit order
for financial viability of the studied scenarios. Instead it would act as a
base for identifying a range of socially acceptable policy scenarios.
The NPV is the sum of all discounted costs and benefits in one scenario
minus another. Thus NPV is always represented relative to another
scenario. Costs relative to the reference scenario are shown as positive
values while benefits are shown as negative values. In such comparison,
the one with the lowest NPV (NPV of the negative highest value) is
considered to be the best socially acceptable scenario.

72
Appendix C: Summary of Cumulative Costs and Benefits
Cumulative Costs and Benefits: 2010-2016 (Compared to Baseline Scenario)
Thousand 2010 US$ Discounted at 10.0% to year 2010
Costs DSM EPT COA REN
Demand
Five Star -4.92 0 0 0
Four Star -4.42 0 0 0
Three Star -1.75 0 0 0
Two Star -1.71 0 0 0
One Star -1.65 0 0 0
Unclassified -8.24 0 0 0
Transformation
Electricity Generation -61792.75 137848.32 -210179.52 2485995.76
Resources
Production 0 0 0 0
Imports -466925 -243171.07 3574354.19 -1623571.1
Exports 0 0 0 0
Unmet Requirements 0 0 0 0
Environmental Externalities
-6823.19 -8780.49 793.79 -41510.57
Net Present Value(NPV) -535563.6 -114103.24 3364968.47 820914.11
GHG Savings (Million Tonnes CO2 Eq.)
6.04 7.72 -0.76 34.69
Cost of Avoided CO2 (US$/Tonne CO2 Eq.)
-88.67 -14.79 n/a 23.66
Top Related