


Languages
Pages
Legal


Mobility Control Using FoamSnorre/WFB FAWAG Pilot Revisit
Arif Ali Khan (NTNU), Ying Guo (Total E&P Norge), Dag Wessel-Berg (SINTEF), Jon Kleppe (NTNU), Dennis Coombe (CMG)

Content
• Introduction– Project motivation and scope
• Snorre WFB pilot simulation – a revisit– Updated reservoir model– Porting from ECLIPSE to STARS and model validation– Full-field model vs sector model– Simulation benchmarking
• Simulation of FAWAG pilot– Sensitivity study with respect of foam parameters
• Summary, conclusions and recommendations

Introduction
• Project motivation– Start out as a master thesis– New Snorre reservoir model established in 2005 – Evaluate STARS as field simulator for FAWAG
• Project scope and ambition– Transfer the most recent reservoir model for Snorre WBF pilot to
STARS simulator– Re-evaluate the foam effect on the new Snorre WBF model– Establish a feasible workflow for FAWAG simulation– Recommend potential improvement for STARS simulator

A feasible workflow for FAWAG simulation
• Assumptions– Most of the FAWAG project will likely be implemented after a significant
period of water or gas flooding, and the oil saturation in the flooded areas is around Sorw or Sorg
– The reservoir model is well established• Pre FAWAG simulation
– Full-field simulation before FAWAG using Eclipse– Establish a sector model for the pilot region and validate using Eclipse
• FAWAG simulation (field + sector)– Port the models from Eclipse to STARS
• Use Petrel to export the grids, rock property, faults etc to STARS + manual adjustment of the data file for STARS
• Use Eclipse simulated saturation and pressure map before the FAWAG start to initialize the STARS simulation
– History-match the FAWAG data or predict the field behaviour using STARS

Snorre WFB pilot - history• Pilot time: November 1999 –
2001• Wells involved:
– P32 (inj)/P39 (prod), 1550 m – P32 (inj)/P42 (prod), 1450 m
• 2 FAWAG cycles after gas injection and WAG operation for about 3 years
• Total surfactant injected: ~140 tonn
– Slug 1: 15262 SM3 (0.49 wt%) for 9,5 days followed by 100 days gas injection
– Slug 2: 31733 SM3 (0.2 wt%) for 20.3 days followed by more gas injection
• Ref: SPE 75157 by A. Skauge et.al.
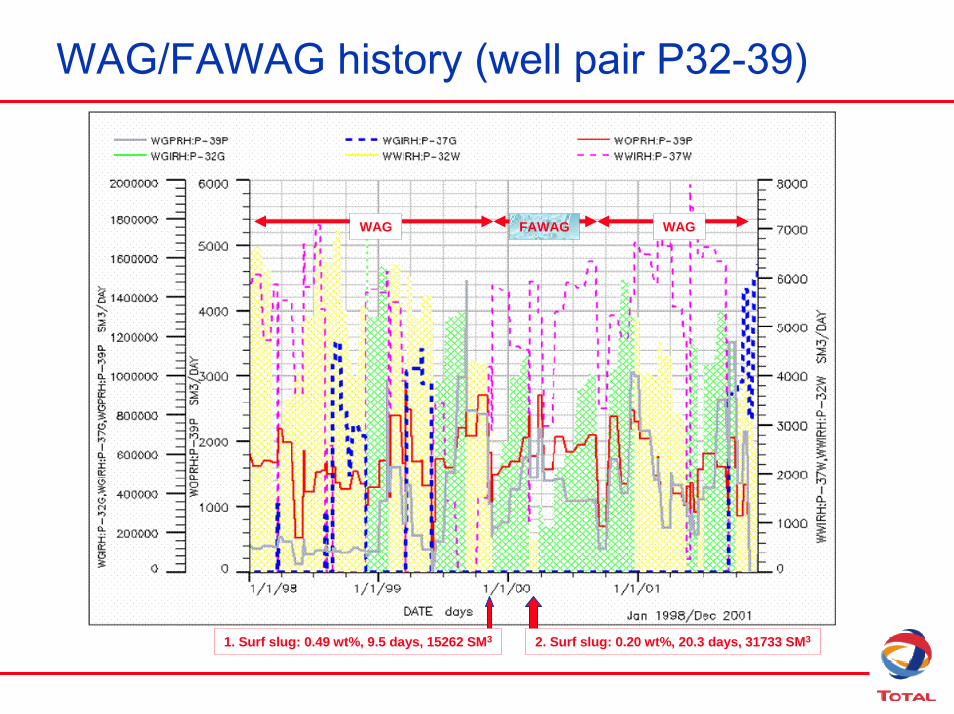
WAG/FAWAG history (well pair P32-39)
1. Surf slug: 0.49 wt%, 9.5 days, 15262 SM3 2. Surf slug: 0.20 wt%, 20.3 days, 31733 SM3
WAG FAWAG WAG

Snorre reservoir

From Eclipse to STARSSTARS
WFB – Full Field (2005 –Statoil)
ECLIPSE
WFB – sector (This work)

Establish the sector model for FAWAG using Frontsim
Water injection
Gas injection
Effect from nearby wells
Selected sector

SPE75157 vs this work
Geological Differences• Stochastic perm / porosity• Faults
PVT• Composional - 4 Component• Black oil - 5 ComponentRock Compressibility
Foam• Part never matches with old
parameters versus new model
New Eclipse Type Well Section
• New well Index• Deviated• Trans and skin included
AbsolutePermeability
Porosity
FAULTS

SPE75157 vs this work
Layer
# division
s
K (md)
Ф Layer height
(m)
Layer height
(mD*M)
4.2 14 700
2 480
1 120610
6.2
14.012.2
S1 5 3500 0.259
S2 7 400 0.236
S3 51
8090
0.2250.191
P- 39
Pdummy
P-32
25x21x20 = 10 500 grid blocks
P-32
P- 42
P- 39
Layer
# division
s
K (md)
Ф Avglayer height
(m)
Layer height
(mD*M)
1.69 -
-
S3 8 - - 4.06 -
S4 6 - - 4.06 -
2.77
S1 4 - -
S2 16 - -Stochastic values
29 x 26 x 34 = 25 636 grid blocks

Model porting from Eclipse to STARS
• Grid data – Use Petrel to export files with STARS format (trivial)– Grid coordinates and faults– Permeability and porosity values for each blocks– Transmissibility multipliers for each blocks– Pressure + Saturation values for each blocks
• Fluid data – Manual entering to STARS input files (trivial)• Well data - Convert Eclipse schedule files using with
CGM/IMEX to STARTS input files + 70% manual input file adjustment (tedious)
• Add foam in STARS (trivial)Arif – please review and change to match what you have done.

FAWAG pilot simulation workflow
EclipseField model
S + P profilein restart files
STARSField model
Field simulation results including
foam effect
STARSField model
EclipseField model
S + P profilein restart files
Field simulation results including
foam effect
WAG period FAWAG period

Eclipse vs STARS – Field model/NO FOAM
Poor match

Eclipse vs STARS – Field model/NO FOAMFULL FIELD SNORRE WFB, STARS
P-39P (PRODUCER)
Water Oil Ratio SC MEASUREDWater Oil Ratio SC ECLIPSEWater Cut SC STARSWater Cut SC STARS
Time (Date)
WaterO
ilR
1997 1998 1999 2000 2001 20020.00
0.20
0.40
0.60
0.80
1.00
WAG FAWAG
SLUG-1SLUG-2
FULL FIELD SNORRE WFB, STARSP-39P (PRODUCER)
Water Oil Ratio SC MEASUREDWater Oil Ratio SC ECLIPSEWater Cut SC STARSWater Cut SC STARS
Time (Date)
WaterO
ilR
1997 1998 1999 2000 2001 20020.00
0.20
0.40
0.60
0.80
1.00
WAG FAWAG
SLUG-1SLUG-2
WAG FAWAG
SLUG-1SLUG-2W
ater
cut
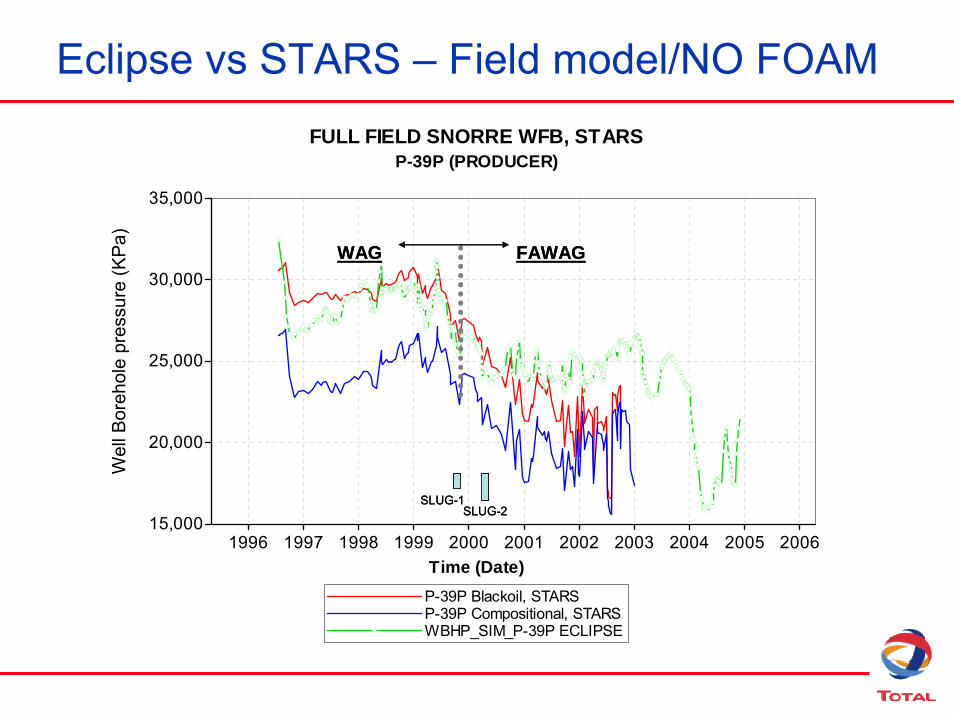
Eclipse vs STARS – Field model/NO FOAMFULL FIELD SNORRE WFB, STARS
P-39P (PRODUCER)
P-39P Blackoil, STARSP-39P Compositional, STARSWBHP_SIM_P-39P ECLIPSE
Time (Date)
Well
1996 1997 1998 1999 2000 2001 2002 2003 2004 2005 200615,000
20,000
25,000
30,000
35,000
WAG FAWAG
SLUG-1SLUG-2
FULL FIELD SNORRE WFB, STARSP-39P (PRODUCER)
P-39P Blackoil, STARSP-39P Compositional, STARSWBHP_SIM_P-39P ECLIPSE
Time (Date)
Well
1996 1997 1998 1999 2000 2001 2002 2003 2004 2005 200615,000
20,000
25,000
30,000
35,000
WAG FAWAG
SLUG-1SLUG-2
WAG FAWAG
SLUG-1SLUG-2
Wel
l Bor
ehol
e pr
essu
re (K
Pa)

Validation sector modelECLIPSE vs STARS (no foam)
WAG FAWAG
SLUG-1SLUG-2
WAG FAWAG
SLUG-1SLUG-2
WAG FAWAG
SLUG-1SLUG-2

Validation sector modelECLIPSE vs STARS (no foam)
WAG FAWAG
SLUG-1SLUG-2
WAG FAWAG
SLUG-1SLUG-2
WAG FAWAG
SLUG-1SLUG-2

Simulation benchmarking
• Full field model – Snorre– No of grid blocks: XYZ= 43 x 146 x 34 => 213 452 grid blocks– No of wells: 8 up to the end of FAWAG pilot– Total simulation run time
• Eclipse* up to FAWAG: ~ 20 hours• STARS** incl FAWAG ~ 18 hours• STARS** for FAWAG only: ~ 6 hours
• Sector model– No of grid blocks: XYZ= 29 x 26 x 34 => 25 636 grid blocks (~ 8 time
smaller than full field model)– No of wells: 3 up to the end of FAWAG pilot– Total simulation run time
• STARS** for FAWAG only: ~ 2 hours
* Unix / Solaris – 32 bits** High-End PC (Pentium4, dual processor, 3GHz/1.5GB RAM), 32 bits

Foam simulation – phenomenological approach
• The physical phenomenon included in the sensitivity studies1. Necessary surfactant concentration in order for foam to grow
(fsurfmin)2. Foam dry out when there is not sufficient water (Swmin)3. Foam killed by surplus of oil (Sof)4. Foam collapse due to viscous forces (Nc) – criticall capillary
number

Foam Model in STARS:
( ) FMskk wo
rgf
rg ×=
)11
654321 ⋅⋅⋅⋅⋅⋅⋅⋅⋅+=
FFFFFFMRFFM
• FM Dimensionless Interpolation Factor
FM = 1 (no foam)
FM = 0 (strong foam)
• MRF Reference mobility reduction factor
• F1 Surfactant concentration term
• F2 Water saturation term
• F3 Oil Saturation (foam killer)
• F4 Gas Velocity term
• F5 Capillary Number term
• F6 Critical Capillary Number term

Surfactant concentation effect
epsurf
s
fmsurfwF ⎥
⎦
⎤⎢⎣
⎡=1
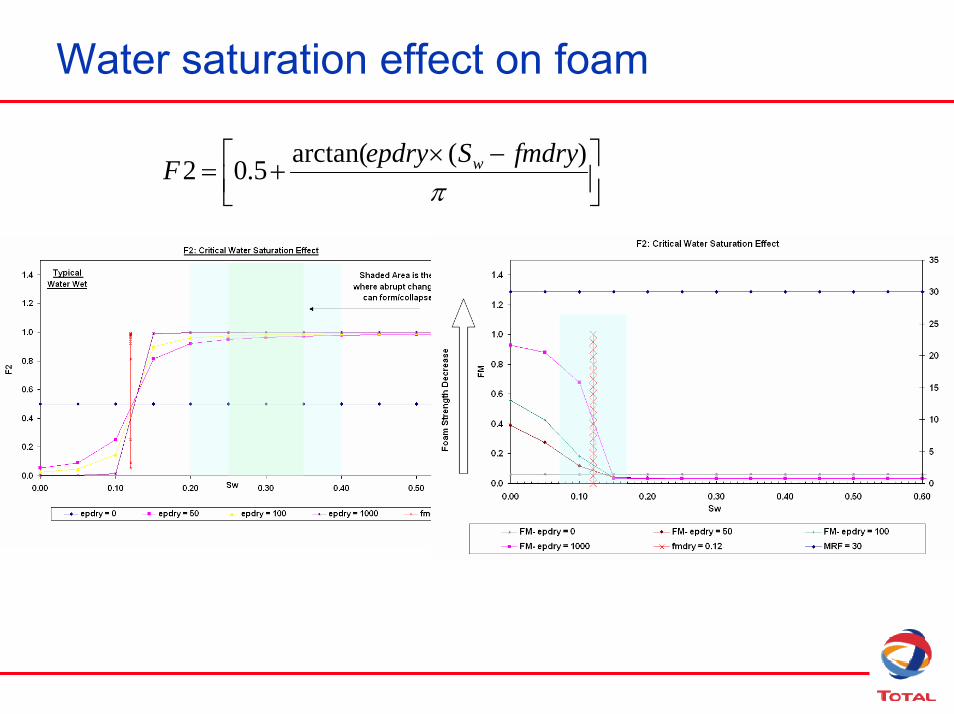
Water saturation effect on foam
⎥⎦⎤
⎢⎣⎡ −×
+=π
)(arctan(5.02 fmdrySepdryF w

Oil saturation effect on foam
epoil
o
fmoilfmoilSF ⎥
⎦
⎤⎢⎣
⎡ −=3
F3: Oil Saturation Effect on FM
0.00
0.20
0.40
0.60
0.80
1.00
1.20
0.00 0.10 0.20 0.30 0.40 0.50
So
[FM
]
0
200
400
600
800
1000
12000.000.050.100.150.200.250.30 Sw
MR
F
FM- epoil = 0 FM- epoil = 0.25 FM- epoil = 1 FM- epoil = 2fmoil = 0.25 Sw MRF = 1000
Foam
Str
engt
h D
ecre
ase
Foam
No Foam
No Foam
Foam

Capillary number term
epcap
cNfmcapF ⎥
⎦
⎤⎢⎣
⎡=5
wgc
PKNσ∆
=
0,00
0,50
1,00
1,50
1,E-10
1,E-09
1,E-08
1,E-07
1,E-06
1,E-05
1,E-04
1,E-03
1,E-02
1,E-01
1,E+00
1,E+01
1,E+02
Nc
FM
0
200
400
600
800
1000
1200
MR
F
FM- epcap = -1 FM- epcap = 0 FM- epcap = 0,5 FM- epcap = 1 FM- epc
F5: Relative Capillary Number
F5: Relative Capillary Number Effect Term
1.E-10
1.E-09
1.E-08
1.E-07
1.E-06
1.E-05
1.E-04
1.E-03
1.E-02
1.E-01
1.E+00
1.E+01
1.E+02
1.E+03
1.E+04
1.E-10 1.E-09 1.E-08 1.E-07 1.E-06 1.E-05 1.E-04 1.E-03 1.E-02 1.E-01 1.E+00 1.E+01 1.E+02 1.E+03Nc
F5
epcap = -1 epcap = 0 epcap = 0.5 epcap = 1 epcap = 5 fmcap = 7.84E-08
epcap = 0(Viscous Effects Neglected on Foam Strength)
Slope = -1 (shear Thinning) Foam Degradation
Slope = +1 (shear Thickening)
Viscous Forces

Relative Permeabilities – After Foam Application
After Foam
Before Foam

MRF sensitivity MRF Sensitivity
SECTOR_WFB_MRF_10.irf SECTOR_WFB_MRF_20.irfSECTOR_WFB_MRF_50.irfSECTOR_WFB_MRF_70.irfSECTOR_WFB_MRF_100.irfSECTOR_WFB_MRF_200.irfSECTOR_WFB_MRF_300.irfSECTOR_WFB_MRF_400.irfSector, No FoamHistoryGas InjectionWater Injection
Time (Date)
Gas
Oil
Rat
io S
C (m
3/m
3)
Gas
Rat
e S
C (m
3/da
y)
Wat
er R
ate
SC
(m3/
day)
1998-12-1 1999-5-30 1999-11-26 2000-5-24 2000-11-200
200
400
600
800
0.00e+0
5.00e+5
1.00e+6
1.50e+6
2.00e+6
0
2,000
4,000
6,000
8,000
FAWAG
MRF = 50 (Ref SPE75157)
MRF =10MRF =20
MRF >100

Oil saturation sensitivity on foam
Weak foam
Strong foam

Foam sensitivity on critical capillary pressure

Foam sensitivity on critical capillary pressure

Foam sensitivity on water saturation
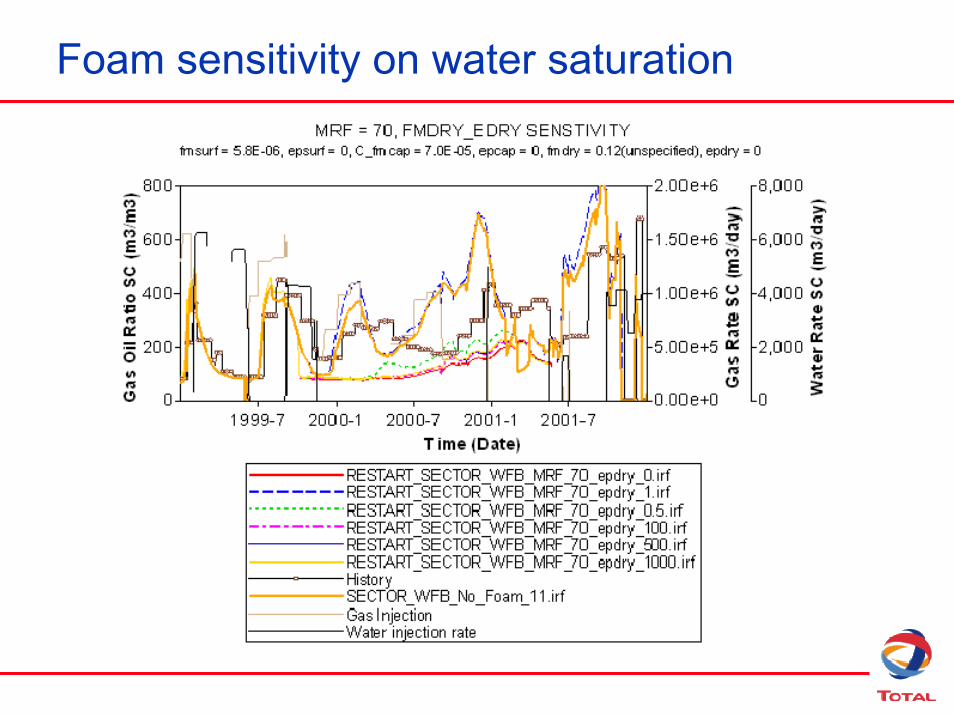
Foam sensitivity on water saturation

Sensitivity study on foam
This work SPE 75157
Base case Scale of influence
Base case
1 MRF ~10 - 50
fmdry = 0.12 – 0.2fpdry = 50000 – 500 000
2
2
No done ins this study. Not sure. (higly
dependent on permeability.
3 for block-block
2 for well-block
Scale of influence
Adsorption fmsurf = 0.0000058(0.01 wt%AOS??)epsurf = 1.0
4
Foam strength (MRF)
MRF = 70 1
Foam dryout fmdry = 0.6epdry = 100
2
Oil tolerance fmoil = 0.2-0.3epoil = 2
3
Shear Thinning
fmcap = 7.0E-05epcap = 1.5
N/A

Surfactant adsorption

Conclusions and recommendations
• The simulation exercises on the foam WFB FAWAG pilot demonstrate the feasibility STARS as a tool for field scale studies for FAWAG.
• More understanding and tuning of the reservoir simulation for FAWAG is needed in order to obtain trust-while results.
• Acquisition of lab data must be designed closely related to the planed field operation
• Refined grid analysis should be done in the close-well areas, but STARS must be made more robust for this.
• Hysteresis for WAG period should be included in the simulations• MRF as dependent on the FAWAG cycles, pressures, etc (input
table?)• Oil saturation plays important role for foam behaviour, specially in
the saturation ranges where foam is likely to be generated or killed and more sophisticated modelling is desired to capture the possible phenomena, e.g. Sw and its distribution, wettability, oil composition.

Thanks for your attention !Questions?
Top Related