


Languages
Pages
Legal


Comprehensive
General
Guidance
for
Minnesota Routine Assessment Method (MnRAM)
Evaluating Wetland Function, Version 3.4 (beta)
9/15/2010

Table of Contents 1.0 Introduction to MnRAM ......................................................................................................... 1
1.1 History .................................................................................................................................... 1 1.2 Functions and Values ............................................................................................................ 1 1.3 User Advisories ...................................................................................................................... 1 1.4 Assessment Sites .................................................................................................................. 2 1.5 MnRAM Database ................................................................................................................. 2 1.6 Wetland Ranking ................................................................................................................... 2 1.7 Wetland Management Classification ..................................................................................... 2 1.8 Reference Standard Wetlands .............................................................................................. 3 1.9 Functional Ratings ................................................................................................................. 3 1.10 Comparison of Two or More Wetlands ................................................................................ 4 1.11 Uses of MnRAM for Regulatory Purposes........................................................................... 5 1.12 Wetland functions/value characteristics evaluated: ............................................................. 5
2.0 Wetland Classification Systems .............................................................................................. 6 2.1 Dominant Vegetation ............................................................................................................. 6 2.2 Topographic Setting ............................................................................................................... 6 2.3 Circular 39 ............................................................................................................................. 7 2.4 Cowardin ................................................................................................................................ 9 2.5 Critical Wetland Resource Designations ............................................................................. 14
3.0 Field Assessment and Data Analysis Procedures (sample) ................................................ 19 3.1 Field Assessment Maps/Data .............................................................................................. 19 3.2 Wetland Base Data: Hennepin Conservation District Wetland Inventory ........................... 19 3.3 Field Assessment Base Data ............................................................................................. 20 3.4 Field Assessment Procedures ............................................................................................. 20 3.5 Field Map Notation .............................................................................................................. 21 3.6 Guidelines for Field Map Notation ...................................................................................... 21 3.7 Photographs ....................................................................................................................... 22 3.8 Identifying Potential Wetland Mitigation Sites..................................................................... 22 3.9 Procedures for Field Work .................................................................................................. 22
4.0 GIS Procedures (sample) ...................................................................................................... 24 4.1 GIS Wetland Shapefile ....................................................................................................... 24 4.2 GIS Data Analyses ............................................................................................................. 24 4.3 Data Management and Data Use in GIS ............................................................................ 28 4.4 Quality Assurance and Quality Control ................................................................................ 29 4.5 Automated ArcView and McRAM Database QA/QC .......................................................... 30 4.6 GIS Information: ................................................................................................................... 31
5.0 Quick Reference—how to install the program, enter data, and get reports..................... 33 5.1 Installing the Program .......................................................................................................... 33 5.2 Opening the Database/Naming Wetland Conventions ........................................................ 33 5.3 Entering Data ....................................................................................................................... 34 5.4 Summary and Reports ......................................................................................................... 36 5.5 Extra Features ..................................................................................................................... 37 5.6 Using the Data—Management Classification ...................................................................... 40
6.0 Functional Rating Formulas ................................................................................................. 41 7.0 References ............................................................................................................................... 56 8.0 Appendices .............................................................................................................................. 59
Appendix 1: Possible Best Management Practices, Detailed Listing ........................................ 60 Appendix 2: Ecological Classification System ........................................................................... 65 Appendix 3: Glossary ................................................................................................................. 66

MnRAM Comprehensive Guidance 11/18/2010 1
1.0 Introduction to MnRAM
1.1 History
The Minnesota Routine Assessment Method (MnRAM) for Evaluating Wetland Functions
originally was devised soon after the passage of the Wetland Conservation Act (WCA) in 1991.
An interagency wetland workgroup sought to fill the need for a practical assessment tool that
would help local authorities make sound wetland management decisions as they assumed
responsibility for regulating wetland impacts.
Although the original version was soon updated to MnRAM Version 2.0 (in 1998), the
fundamental approach of applying descriptive rather than numeric ratings was maintained. In
subsequent years, development of heavily quantitative methods on the national level and demand
for a more refined procedure on the local level led to the formation of another workgroup in
January 2002. Starting with both the MnRAM Version 2.0 and a database version sponsored by
an EPA grant, the workgroup examined every function, question by question, with the goal of
developing a numeric model.
1.2 Functions and Values
Because land use decisions involving wetlands typically consider both functions and values,
MnRAM has always included some value-related questions. Although a primary focus in this
version of MnRAM is on the functional aspect of wetlands, some strictly value-related aspects
are included, such as ―Aesthetics‖ and ―Commercial Uses.‖ Value-related considerations are
incorporated into some of other evaluated functions, as well. WCA Rules Chapter 8420.0103 sets
out the functions and public values that are to be considered; these include public recreation and
education.
1.3 User Advisories
MnRAM provides an organized, consistent procedure to document observations and conclusions
about wetland processes. It is a systematic way of documenting best professional judgment.
MnRAM would be considered a Tier 2 assessment methodology, a rapid assessment method.
MnRAM is intended for routine planning and inventory applications as well as for project-
specific evaluations. Using it requires experience and training in wetland science, since
professional judgment is incorporated in several questions.
Current scientific understanding of wetlands and indicators limits our ability to predict which
wetlands are ecologically sound; other limiting factors include time, expertise, and training of the
people performing the evaluation. For more difficult or controversial sites, it is recommended
that a diverse team of professionals conduct the evaluation together or that other more detailed
assessment methods be considered.
A preliminary review of reference material such as soil data, topography, watersheds, inlets,
outlets, land uses, aerial photographs, and other information is recommended prior to assessing a
wetland. Establishing the history and setting of the wetland under evaluation will speed the field
assessment. Questions that can potentially be answered utilizing other information sources,
maps in the office, or digital data in a Geographic Information System (GIS) are marked with a
―~‖ in the margin (in the printed version) or in red text (in the digital format). With training,
practice, and experience, the fieldwork for an evaluation of a small wetland (< 1 acre), under
MnRAM Comprehensive Guidance 11/18/2010 2
normal circumstances (assuming background information regarding topography, watersheds,
inlets and outlets, land use, etc. has been previously gathered) in an area familiar to the
evaluator(s) can be completed in less than one hour.
Wetland assessments using this methodology cannot be conducted without a site visit. Even
with photos, maps, and written notes, questions will arise that should only be answered at the
site. Bringing the database into the field on a laptop will prove to be the most efficient way to
document wetland conditions. For uncomplicated sites, paper score sheets are available which
correspond to a Microsoft Excel™ spreadsheet containing the formulas for computing the
functional indices. Immediate field data-entry reduces the potential for interpretation and data-
entry errors compared to gathering data in the field and trying to translate that into an assessment
later.
1.4 Assessment Sites
This assessment method is intended to be applied to existing wetlands or potential restoration
sites. If evaluating a wetland to determine the functions based on some projected conditions, it is
necessary to assess the current status of the wetland/basin, as well. See Section 1.11 for more
about using MnRAM for regulatory purposes.
1.5 MnRAM Database
The full MnRAM methodology has been programmed into a Microsoft Access™ database within
which all data can be entered and stored. The database computes each functional indices using a
formula. One of the fundamental benefits of a database program and this methodology in
particular is that information is tabulated and stored for each of the 72 wetland parameters
evaluated as well as the wetland location, other general information, and computed functional
indices. The database can store records for multiple wetlands, grouped into projects or kept
individually available. Wetland data can then easily be compiled into a single, central database.
In addition, the database allows for the ability to analyze individual pieces of data for selected
groups of wetlands or all wetlands within the database or to evaluate groups of parameters on
groups of wetlands. Flexibility for conducting analyses is one of the most powerful aspects of
this methodology.
1.6 Wetland Ranking
MnRAM uses numeric ranking; great care should be taken to use the results in light of local
conditions and based on a landscape-level management plan. People, not the assessment, will
decide what combination of functions are the most important. Each wetland is part of an
integrated ecological system that should not be thought of as a group of distinct packages, but
really an assemblage of interactive elements.
1.7 Wetland Management Classification
Determining the relative value of each function is an activity that must take place after the
assessment is complete, in a management and planning context. A basic framework for applying
wetland functions and values information to management is supplied in an associated document
entitled ―Management Classification.‖ This is one basic method of applying the results of a
complete assessment of wetlands within a defined management area (e.g. watershed, city,
county, etc.) where the wetland functions are the basis for various management strategies.

MnRAM Comprehensive Guidance 11/18/2010 3
Standards are suggested that could be applied to meet the general goals of each classification
level.
The management classification includes an approach for dealing with watersheds that have few
high-quality wetlands remaining. In short, if the best wetlands in an area rate ―Medium‖ using
MnRAM, an adjustment of the scale for ranking wetlands is imperative. These policy-based
decisions are discussed in the management classification document.
For ease of use, both the ―classic‖ and ―increased protection‖ Management Classification results
are shown on the summary page of the database. Other options for using the data, or for
modifying the management classification scheme, are possible. Landscape differences, local
values, and community preferences will guide the final determination for how the data collected
via MnRAM are used.
1.8 Reference Standard Wetlands
Reference standard wetlands were defined in MnRAM 2.0 as those judged to have the highest
level of overall sustainable functional capacity for that type in the Wetland Comparison Domain.
In that method, the wetland under investigation was to have been compared to the reference
wetland before the evaluation took place.
In the later versions of MnRAM, it is not necessary to have pre-established physical reference
standard wetlands. As an assessment tool, MnRAM may be part of an initial effort to inventory
local wetlands and establish such reference sites. A subject wetland will fall into place on a
watershed-based ranking after many wetlands have been evaluated. Only in comparison with
these compiled results will planning watershed priorities be possible.
1.9 Functional Ratings
MnRAM was developed using the concept of ideal theoretical, pre-European-settlement wetland
condition as the baseline. In highly urban or agricultural watersheds, few basins may fall into the
High category. Local authorities will need to take this into account when establishing a scale for
management decisions (see ―Wetland Management Classification,‖ above).
Each wetland function will be rated with a numeric index according to the formulas or decision
trees accompanying this methodology. The scoring system is from 0.001 to 1.0 signifying low to
high1, respectively; in the instances where an exceptional rating applies, a score of 2 accentuates
the rarity. For yes-no questions, yes will receive a score of 1 and no will receive a score of zero*.
Each wetland function then receives an index score with ratings as follows:
Functional Ratings Question Score Functional Index Score
Exceptional: 2.0 1.01 - 2.00
High: 1.0 0.66 - 1.00
Medium: 0.5 0.33 - 0.65
Low: 0.1 0.001 - 0.32
Not Applicable: N/A 0.0
1 Ammann and Stone, 1991
* Some questions worded yes-no are actually yes-not applicable; use caution when scoring by hand.

MnRAM Comprehensive Guidance 11/18/2010 4
MnRAM includes numeric as well as general ratings. The numeric ratings are based on
standardized formulas to achieve consistency among users and are, in effect, placeholders for the
general rating categories of exceptional, high, medium, and low. Great care should be taken
when interpreting the results. In particular, the general and numeric ratings should not be
summed or averaged across different functions (or for different wetlands). Mixing the ratings of
disparate functions (or different wetlands) can be misleading if not meaningless. The primary
intent of MnRAM is to provide a function-by-function rating for individual wetlands (or plant
communities). See discussion below regarding comparison of different wetlands.
1.10 Comparison of Two or More Wetlands
The optimum method of comparison using MnRAM ratings is that between wetland plant
communities of the same type (―apples to apples‖) where a reference standard wetland is used.
―Wetland type‖ refers to the wetland plant communities described in MnRAM.2 A reference
standard wetland includes the highest functioning example(s) of a specific plant community
within a watershed or ecoregion. It serves as the baseline for comparing the MnRAM ratings
among examples of the same plant community. For example, the reference standard hardwood
swamp may have four high, two medium, and two low ratings while the hardwood swamp within
a particular project site may have two medium and six low ratings. Or, if a particular function(s)
is of most concern, the MnRAM rating for that specific function can be compared between
examples of the same plant community within the study area.
Comparisons between examples of the same plant community type can be valid without a
reference standard wetland. Because there is no baseline for the highest functioning example of a
particular wetland plant community type, care must be taken to place the subject wetland in the
proper context. For example, all the sedge meadows within an agricultural site may be lower
functioning due to agricultural impacts, while all the sedge meadows within a northern
Minnesota site may be high functioning because of the lack of disturbances.
Comparisons of function-by-function MnRAM ratings between different wetland plant
community types (―apples to oranges‖) are problematic because different wetland plant
community types function differently. Not all wetlands are flow-through wetlands, or shoreland
wetlands, or provide fish habitat, or support amphibians, or have a woody canopy. While some
functions are provided by nearly all wetlands, the process and intensity of those functions can be
different among different plant community types. Great care is advised when drawing
conclusions from ―apples to oranges‖ comparisons. The greater the disparity between wetland
plant community types, the less valid the comparison becomes. Comparing the functional levels
of, for example, a precipitation-driven bog versus a floodplain forest is of little utility.
For planning purposes, the wetland function(s) of greatest concern in a particular study area
could be identified. MnRAM analyses could then identify those wetlands ranked exceptional or
high for that function(s).
2 Further refinement of this approach is to define ―wetland type‖ as the wetland plant community + HGM
classification (e.g., depressional, slope, lacustrine fringe, organic flat). For example, sedge meadow communities on
slopes may have a different water source and hydroperiod than those in depressions.

MnRAM Comprehensive Guidance 11/18/2010 5
1.11 Uses of MnRAM for Regulatory Purposes
MnRAM is a qualitative approach to identifying wetland functions. Because the input is
qualitative the output is qualitative. Therefore, MnRAM ratings should not be used to quantify
impacts or compensatory mitigation.
Evaluating the pre- and post-project condition of a particular wetland is often part of the
regulatory process. Be advised that MnRAM is typically not sensitive enough to show changes in
the functional ratings that are commensurate with the differences between pre- and post-project
conditions.
Determining general compensatory mitigation needs based on a MnRAM analysis of a wetland
that is proposed to be impacted is appropriate for regulatory purposes. For example, if the
wetland to be impacted has four high ratings and four medium ratings, the focus of the
compensation would be to design and establish compensation that replaces those specific high
and medium functional ratings. This is a qualitative measure, not a quantitative one.
MnRAM has four options for the vegetative diversity/integrity function ranging from individual
ratings for each plant community to averaging the ratings of two or more plant communities. For
regulatory purposes, the individual rating for vegetative diversity/ integrity should be used
(unless all of the plant communities have the same rating for this function). Averaging high and
low ratings, for example, yields a medium rating that obscures the presence of the high-rated
plant community. Averaging is not appropriate because the high-rated plant community may
prompt important regulatory considerations such as avoidance or special consideration for
compensatory mitigation. A second option for the vegetative diversity/integrity function—
highest-rated plant community—is also appropriate for regulatory purposes.
1.12 Wetland functions/value characteristics evaluated:
1. Maintenance of Characteristic Vegetative Diversity/Integrity
2. Maintenance of Hydrologic Regime
3. Flood/Stormwater Attenuation
4. Downstream Water Quality
5. Maintenance of Wetland Water Quality
6. Shoreline Protection
7. Maintenance of Characteristic Wildlife Habitat Structure
8. Maintenance of Characteristic Fish Habitat
9. Maintenance of Characteristic Amphibian Habitat
10. Aesthetics/Recreation/Education/Cultural
11. Commercial Uses
12. Ground Water Interaction
Additional Evaluation Information
1. Restoration Potential
2. Sensitivity to Stormwater & Urban Development
3. Additional Stormwater Treatment Needs
Each characteristic is described in more detail in the Formulas section.

MnRAM Comprehensive Guidance 11/18/2010 6
2.0 Wetland Classification Systems
This section summarizes methods that can be utilized to classify wetland resources. The last part
of this section describes critical wetland resource designations.
2.1 Dominant Vegetation
Identify and record the dominant plant species within each plant community using the 50/20
Rule3, along with rare, endangered, or threatened species. For each plant species, record the
scientific name, common name, typical stratum, and regional indicator status4 for each wetland;
preferably these should be stored in the project Microsoft® Access database. The definitions of
hydrologic indicator status are:
OBL: Obligate Wetland Plants occur almost always (estimated probability >99%) in wetlands
under natural conditions, but may also occur rarely (estimated probability <1%) in nonwetlands.
FACW: Facultative Wetland Plants occur usually (estimated probability 67% to 99%) in
wetlands, but also occur (estimated probability 1% to 33%) in nonwetlands.
FAC: Facultative Plants have a similar likelihood (estimated probability 33% to 67%) of
occurring in both wetlands and nonwetlands.
FACU: Facultative Upland Plants occur sometimes (estimated probability 1% to 33%) in
wetlands, but occur more often (estimated probability >67% to 99%) in nonwetlands.
UPL: Obligate Upland Plants occur rarely (estimated <1%) in wetlands, but occur almost
always (estimated probability >99%) in nonwetlands under natural conditions.
Note: Categories were originally developed and defined by the USFWS National Wetlands
Inventory. Regional panels assigned the indicator status for individual plant species. The three
facultative categories are subdivided by (+) and (-) modifiers.
2.2 Topographic Setting
Classify each inventoried wetland by its topographic setting5 based on a field evaluation and
review of available stormwater infrastructure data:
Floodplain: (8420.0110, subp. 19) A floodplain wetland is a wetland located in the
floodplain of a watercourse, with no well defined inlets or outlets,
including tile systems, ditches, or natural watercourses. This may include
the floodplain itself when it exhibits wetland characteristics.
3 The 50/20 Rule, detailed in the 1987 Corps of Engineers Wetland Delineation Manual, describes a method of
considering dominance within each stratum. All dominants are treated equally in characterizing the plant community
to determine whether hydrophytic vegetation is present. The most abundant plant species (when ranked in
descending order of abundance and cumulatively totaled) that immediately exceed 50 percent of the total dominance
measure for a given stratum, plus any additional species comprising 20 percent or more of the total dominance
measure for that stratum are considered dominant species for the stratum. Dominance measures include percent
areal coverage and basal area, for example. 4 in accordance with The National List of Plant Species that Occur in Wetlands (Reed, 1988).
5 as defined in Minnesota Rules Chapter 8420.0110 (Wetland Conservation Act).

MnRAM Comprehensive Guidance 11/18/2010 7
Flow-through: (8420.0110, subp. 20) A flow-through wetland has a well-defined outlet and
one or more well defined inlets.
Isolated: (8420.0110, subp. 28) An isolated wetland is without a well-defined inlet or outlet.
Riverine: (8420.0110, subp. 43) A riverine wetland is a wetland contained in the banks of a
channel that may contain moving water or that forms a connecting link
between two bodies of standing water.
Shoreland: (8420.0110, subp. 44a) A shoreland wetland is a wetland located along the
shoreline of a lake or edge of a deepwater habitat.
Tributary: (8420.0110, subp. 48) A tributary wetland has a well-defined outlet but is lacking
a defined inlet.
Other: A wetland that does not fit into one of the three previously mentioned groups.
2.3 Circular 39
The Wetlands of the United States was published in 1959 by the U.S. Fish and Wildlife Service
and is commonly referred to as "Circular 39"6. The Circular 39 Classification System was the
first method that the U.S. Fish and Wildlife Service used to classify wetland basins in the U.S. It
is composed of 20 wetland types of which eight are found in Minnesota. Wetland plant
community types and some common vegetation found in each wetland type are provided in
Table 2.1. A general description of each wetland type is provided below.
2.3.1 TYPE 1: SEASONALLY FLOODED BASIN, FLOODPLAIN FOREST
Soil is covered with water or is waterlogged during variable seasonal periods, but usually is
well-drained during much of the growing season. This wetland type is found both in upland
depressions and in overflow bottomlands. In uplands, basins or flats may be filled with water
during periods of heavy rain or melting snow.
Vegetation varies greatly according to season and duration of flooding: from bottomland
hardwoods to herbaceous plants. Where the water has receded early in the growing season,
smartweeds, wild millet, fall panicum, chufa, various amaranths and other plants (i.e. marsh
elder, ragweed, and cockleburs) are likely to occur. Shallow basins that are submerged only very
temporarily usually develop little or no wetland vegetation.
2.3.2 TYPE 2: WET MEADOW, FRESH WET MEADOW, WET TO WET-MESIC PRAIRIE, SEDGE
MEADOW, AND CALCAREOUS FEN
Soil is usually without standing water during most of the growing season, but is waterlogged
within at least a few inches of the surface. Meadows may fill shallow basins, sloughs, or
farmland sags, or these meadows may border shallow marshes on the landward side. Vegetation
includes grasses, sedges, rushes and various broad-leaved plants. Common representative plants
are Carex sp. (sedges), Juncus sp. (rushes), redtop, reed grasses, manna grasses, prairie
cordgrass, and mints. Other wetland plant community types include low prairies, sedge
meadows, and calcareous fens.
6 Shaw and Fredine, 1959

MnRAM Comprehensive Guidance 11/18/2010 8
2.3.3 TYPE 3: SHALLOW MARSH
Soil is usually waterlogged early during the growing season and may often be covered with as
much as 6 inches or more of water. These marshes may nearly fill shallow lake basins or
sloughs, or may border deep marshes on the landward side. These are common as seep areas on
irrigated lands. Vegetation includes grasses, bulrushes, spikerushes, and various other marsh
plants such as cattails, arrowhead, pickerelweed, and smartweeds. Common representatives are
reed, whitetop, rice cutgrass, Carex, and giant burreed.
2.3.4 TYPE 4: DEEP MARSH
Soil is usually covered with 6 inches to 3 feet or more of water during the growing season.
These deep marshes may completely fill shallow lake basins, potholes, limestone sinks and
sloughs, or they may border open water in such depressions. Vegetation includes cattails, reeds,
bulrushes, spikerushes and wild rice. In open areas, pondweeds, naiads, coontail, watermilfoils,
waterweeds, duckweed, water lilies, or spatterdocks may occur.
2.3.5 TYPE 5: SHALLOW OPEN WATER
Shallow ponds and reservoirs are included in this type. Water is usually less than 10 feet deep
and is fringed by a border of emergent vegetation similar to open areas of Type 4. Vegetation
(mainly at water depths less than 6 feet), includes pondweeds, naiads, wild celery, coontail,
watermilfoils, muskgrass, waterlilies, and spatterdocks.
2.3.6 TYPE 6: SHRUB SWAMP; SHRUB CARR, ALDER THICKET
The soil is usually waterlogged during the growing season and is often covered with as much as
6 inches of water. Shrub swamps occur mostly along sluggish streams and occasionally on flood
plains. Vegetation includes alders, willows, buttonbush, and dogwoods.

MnRAM Comprehensive Guidance 11/18/2010 9
Table 2.1 Wetland Communities, Classification Systems, And Common Vegetation
Wetland Plant Community Types
Classification of Wetlands and Deep Water Habitats of the United States (Cowardin et al. 1979)
Fish and Wildlife Service Circular 39 (Shaw and Fredine 1971) Examples of Common Vegetation
Shallow, Open Water Palustrine or lacustrine, littoral; aquatic bed; submergent, floating, and floating-leaved
Type 5: Inland open fresh water White water lily, Yellow water lily, Northern milfoil, Largeleaf pondweed
Deep Marsh Palustrine or lacustrine, littoral; aquatic bed; submergent, floating-leaved; and emergent; persistent and nonpersistent
Type 4: Inland deep fresh marsh Bullrushes, Cattail, Duckweed, Water shield
Shallow Marsh Palustrine; emergent; persistent and nonpersistent
Type 3: Inland shallow fresh marsh Cattails, Reed canary grass, Common reed
Sedge Meadow Palustrine; emergent; narrow leaved persistent Type 2: Inland fresh meadow Sedges, Canada bluejoint, Fowl bluegrass
Fresh (Wet) Meadow Palustrine; emergent; broad and narrow-leaved persistent
Type 1: Seasonally flooded basin of flat; Type 2: Inland fresh meadow
Reed canary grass, Sawtooth sunflower, Joe-pye-weed, Giant goldenrod
Wet to Wet-Mesic Prairie
Palustrine; emergent; broad- and narrow leaved persistent
Type 1: Seasonally flooded basin of flat; Type 2: Inland fresh meadow
Cattail, gayfeather, Prairie cordgrass, Slender rush, Black bentgrass
Calcareous Fen Palustrine; emergent; narrow-leaved persistent; and scrub
Type 2: Inland fresh meadow Dioecious sedge, Beaked spikerush, Needle beakrush, Shrubby cinquefoil
Open Bog Palustrine; moss/lichen; and scrub/shrub; broad-leaved evergreen
Type 8: Bog Bog moss, Leatherleaf, Bog rosemary, Cranberry
Coniferous Bog Palustrine; forested: needle-leaved evergreen and deciduous
Type 8: Bog Tamarack, Black spruce, Cotton grass, Leatherleaf
Shrub-Carr Palustrine; scrub/shrub; broad leaved deciduous
Type 6: Shrub swamp Meadow willow, Pussy willow, Uptight Sedge, Canada blue-joint grass
Alder Thicket Palustrine; scrub/shrub; broad-leaved deciduous
Type 6: Shrub swamp Speckled Alder, American elder, Narrowleaf meadowsweet, Cinnamon fern
Hardwood Swamp Palustrine; forested; broad-leaved deciduous Type 7: Wooded swamp Black ash, Lake sedge, Ostrich fern, Marsh marigold
Coniferous Swamp Palustrine; forested; needle-leaved deciduous and evergreen
Type 7: Wooded swamp Northern white cedar, Cinnamon fern, Yellow birch
Floodplain Forest Palustrine; forested; broad-leaved deciduous Type 1: Seasonally flooded basin or flat Silver maple, Canada wood-nettle, Canada hornwort, Green ash
Seasonally Flooded Basin
Palustrine; flat; emergent; persistent and non-persistent
Type 1: Seasonally flooded basin or flat Willow-weed, Pennsylvania smartweed, Barnyard grass, White goosefoot

MnRAM Comprehensive Guidance 11/18/2010 9
2.3.7 TYPE 7: WOODED SWAMPS; HARDWOOD SWAMP, CONIFEROUS SWAMP
The soil is waterlogged at least to within a few inches of the surface during the growing season
and is often covered with as much as 1 foot of water. Wooded swamps occur mostly along
sluggish streams, on old riverine oxbows, on floodplains, on flat uplands, and in very shallow
lake basins. Forest vegetation includes tamarack, white cedar, black spruce, balsam fir, red
maple, and black ash. Northern evergreen swamps usually have a thick ground covering of
mosses. Deciduous swamps frequently support beds of duckweeds, smartweeds, and other herbs.
2.3.8 TYPE 8: BOGS; CONIFEROUS BOGS, OPEN BOGS
The soil is usually waterlogged and supports a spongy covering of mosses. Bogs occur mostly in
shallow lake basins, on flat uplands and along sluggish streams. Vegetation is woody or
herbaceous or both. Typical plants are heath shrubs, sphagnum moss, and sedges. In the North,
leatherleaf, Labrador-tea, cranberries, Carex, and cottongrass are often present. Scattered, often
stunted, black spruce, and tamarack may occur in northern bogs.
2.4 Cowardin7
This methodology was used to classify wetlands for the National Wetlands Inventory maps
beginning in the late 1970's and early 1980's. The hierarchical structure progresses from Systems
and Subsystems at the most general levels to Classes, Subclasses, and Dominance Types at the
most specific levels. A comparison of Circular 39 and Cowardin wetland classifications along
with the typical Cowardin classification symbols are provided in Table 2.2.
2.4.1 SYSTEM
The term System refers to a complex of wetlands and deepwater habitats that share the influence
of similar hydrologic, geomorphologic, chemical, or biological factors. The primary systems
found in the Minnesota are Palustrine, Lacustrine, and Riverine.
L: Lacustrine (lakes and deep ponds) - Lacustrine Systems include wetlands and deepwater
habitats with all of the following three characteristics:
1. Situated in a topographic depression or a dammed river channel;
2. Lacking trees, shrubs, persistent emergents, emergent mosses or lichens with greater than
30 percent areal coverage;
3. Total area exceeds 8 hectares (20 acres).
Basins or catchments less than 8 hectares in size are included if they have at least one of the
following characteristics:
1. A wave-formed or bedrock feature forms all or part of the shoreline boundary; or
2. The catchment has, at low water, a depth greater than two meters (6.6 feet) in the deepest
part of the basin.
7 Cowardin et al,. 1979.

MnRAM Comprehensive Guidance 11/18/2010 10
P: Palustrine (shallow ponds, marshes, swamps and sloughs) - Palustrine Systems include all
nontidal wetlands dominated by trees, shrubs, persistent emergents, emergent mosses or
lichens.
R: Riverine (rivers, creeks and streams) - Riverine Systems are contained in natural or artificial
channels periodically or continuously containing flowing water. Upland islands or Palustrine
wetlands may occur in the channel, but they are not part of the Riverine System.
2.4.2 SUBSYSTEM
The term Subsystem refers to a further subdivision of Systems into more specific categories.
The Palustrine System has no subsystems associated with it while Lacustrine Systems have two
Subsystems and Riverine Systems have four). Each Subsystem is unique for the System to
which it applies.
L1: Limnetic - Extends outward from Littoral boundary and includes deepwater habitats
within the Lacustrine System.
L2: Littoral - Extends from shoreward boundary to 2 meters (6 feet) below annual low water
or to the maximum extent of non-persistent emergents, if these grow at greater than 2
meters.
R2: Lower Perennial
R3: Upper Perennial
R4: Intermittent
2.4.3 CLASS, SUBCLASS
The wetland Class is the highest taxonomic unit below the Subsystem level. The Class code
describes the general appearance of the habitat in terms of either the dominant life form of the
vegetation or the physiography and composition of the substrate. Life forms (e.g. trees, shrubs,
emergents) are used to define classes because they are easily recognizable, do not change
distribution rapidly, and have traditionally been used to classify wetlands. Finer differences in
life forms are recognized at the Subclass level.
Mixed classes are used as sparingly as possible, under two main conditions: (1) The wetland
contains two or more distinct cover types each encompassing at least 30 percent areal coverage
of the highest life form, but is too small in size to allow separate delineation of each cover type;
and (2) The wetland contains 2 or more classes or subclasses each comprising at least 30 percent
areal coverage so evenly interspersed that separate delineation is not possible at the scale used
for classification. Mixed subclasses are also allowed and follow the same rules for mixed
classes8.
AB: Aquatic Bed - Includes wetlands and deepwater habitats dominated by plants that grow
principally on or below the surface of the water for most of the growing season in most
years.
Subclasses include: AB1 = Algal, AB2 = Aquatic Moss, AB3 = Rooted Vascular, AB4 =
Floating Vascular, AB5 = Unknown Submergent, and AB6 = Unknown Surface.
EM: Emergent - Characterized by erect, rooted, herbaceous hydrophytes, excluding mosses
and lichens. This vegetation is present for most of the growing season in most years.
8 Cowardin et al., 1979

MnRAM Comprehensive Guidance 11/18/2010 11
Subclasses include: EM1 = Persistent (plants that normally remain standing at least until
the beginning of the next growing season), and EM2 = Nonpersistent (plants which fall to
the surface of the substrate or below the surface of the water at the end of the growing
season).
FO: Forested - Woody vegetation greater than 6 meters (20 feet) tall.
Subclass determination is based on which type represents more than 50 percent of the
areal canopy coverage during the leaf-on period and Subclasses include: FO1 =
Broad-leaved Deciduous, FO2 = Needle-leaved Deciduous, FO3 = Broad-leaved
Evergreen, FO4 = Needle-leaved Evergreen, FO5 = Dead, FO6 = Deciduous, and FO7 =
Evergreen.
SS: Scrub/Shrub - Woody vegetation less than 6 meters (20 feet) tall. The species include true
shrubs, young trees (saplings) or trees that are small or stunted because of environmental
conditions.
Subclass determination is based on which type represents more than 50 percent of the
areal canopy coverage during the leaf-on period and include: SS1 = Broad-leaved
Deciduous, SS2 = Needle-leaved Deciduous, SS3 = Broad-leaved Evergreen, SS4 =
Needle-leaved Evergreen, SS5 = Dead, SS6 = Deciduous (used if deciduous woody
vegetation cannot be identified on aerial photography as either Broad-leaved or
Needle-leaved), and SS7 = Evergreen (used if evergreen woody vegetation cannot be
identified on aerial photography as either Broad-leaved or Needle-leaved).
UB: Unconsolidated Bottom - Includes all wetlands and deepwater habitats with at least 25
percent cover of particles smaller than stones (less than 6-7 cm.), and a vegetative cover
less than 30 percent.
2.4.4 WATER REGIME
Precise description of hydrologic characteristics requires detailed knowledge of the duration and
timing of surface inundation, both yearly and long-term, as well as an understanding of
groundwater fluctuations. Because such information is seldom available, the water regimes that,
in part, determine characteristic wetland and deepwater plant and animal communities are
described here in only general terms9. Water regimes are grouped under two major categories,
Tidal and Nontidal. The Tidal Water Regime does not occur in Minnesota so is not described
here.
A: Temporarily Flooded - Surface water present for brief periods during the growing season,
but the water table usually lies well below the soil surface. Plants that grow both in
uplands and wetlands are characteristic of this water regime. The temporarily flooded
regime also includes wetlands where water is present for variable periods without
detectable seasonal periodicity. Weeks, months, or even years may intervene between
periods of inundation. The dominant plant communities under this regime may change as
soil moisture conditions change.
B: Saturated - The substrate is saturated to the surface for extended periods during the
growing season, but surface water is seldom present.
C: Seasonally Flooded - Surface water is present for extended periods especially early in the
growing season, but is absent by the end of the growing season in most years. When
surface water is absent, the water table is often near the land surface. The water table after
9 Cowardin, et al., 1979

MnRAM Comprehensive Guidance 11/18/2010 12
flooding ceases is highly variable, extending from saturated to a water table well below the
ground surface.
F: Semipermanently Flooded - Surface water persists throughout the growing season in most
years. When surface water is absent, the water table is usually at or very near the land
surface.
G: Intermittently Exposed - Surface water is present throughout the year except in years of
extreme drought.
H: Permanently Flooded - Water covers the land surface throughout the year in all years.
Vegetation is composed of obligate hydrophytes.
2.4.5 SPECIAL MODIFIERS
Many wetlands and deepwater habitats are human-made and natural ones have been modified to
some degree by the activities of humans or beavers. Since the nature of these modifications
often greatly influences the character of such habitats, special modifying terms have been
included here to emphasize their importance10.
b: Beaver – Created or modified by a beaver dam.
d: Partly Drained – The water level has been artificially lowered, but he area is still classified
as wetland because soil moisture is sufficient to support hydrophytes. Drained areas are
not considered wetland if they can no longer support hydrophytes.
f: Farmed – The soil surface has been mechanically or physically altered for production of
crops, but hydrophytes will become reestablished if farming is discontinued.
h: Diked/Impounded – Created or modified by a barrier or dam which purposefully or
unintentionally obstructs the outflow of water. Both humans-made and beaver dams are
included.
r: Artificial – Refers to substrates classified as Rock Bottom, Unconsolidated Bottom, Rocky
Shore, and Unconsolidated Shore that were emplaced by humans, using either natural
materials such as dredge spoil or synthetic materials such as discarded automobiles, tires,
or concrete.
s: Spoil – Refers to the placement of spoil materials which have resulted in the establishment
of wetland.
x: Excavated – Lies within a basin or channel excavated by humans.
10
Cowardin, et al., 1979

MnRAM Comprehensive Guidance 11/18/2010 13
Table 2.2 Circular 39 and Cowardin Wetland Classification Systems
Minnesota Routine Assessment Method for Evaluating Wetland Functions, Version 3.1
Circular 39 Type
SYSTEM SUBSYSTEM CLASS
SUBCLASS Common Water Regimes Typical NWI Symbols (Cowardin System)
Type 1 PALUSTRINE (P) Emergent (EM) Persistent (1) Forested (FO) Broad-Leaf Deciduous (1)
Temporarily Flooded (A) Intermittently Flooded (J)
PEM1A PEM1J PFO1A PFO1J
Type 2 PALUSTRINE (P) Emergent (EM) Persistent (1)
Saturated (B) PEM1B
Type 3 PALUSTRINE (P) Emergent (EM) Persistent (1)
Seasonally Flooded (C) Semipermanently Flooded (F)
PEM1C PEM1F
Type 4 PALUSTRINE (P) OR LACUSTRINE (L) Littoral (2) Emergent (EM) Aquatic Bed (AB) Unconsolidated Bottom (UB)
Semipermanently Flooded (F) Intermittently Exposed (G) Permanently Flooded (H)
PEMF L2EM2F PEMG L2EM2G PABF L2EM2H PABG L2ABF PUBF L2ABG PUBG L2ABH
Type 5 PALUSTRINE (P) OR LACUSTRINE (L) Limnetic (1) Littoral (2) Aquatic Bed (AB) Unconsolidated Bottom (UB)
Intermittently Exposed (G) Permanently Flooded (H)
PABG L2ABG PABH L2ABH PUBG L2UBG PUBH L2UBH L1UBH
Type 6 PALUSTRINE (P) Scrub-Shrub (SS) Broad/Needleleaf Deciduous (1,2) Broad/Needleleaf Evergreen (3,4) Dead (5)
All nontidal regimes except Permanently Flooded (A,B,C,F,J,G)
PSS1,2,3,4, or 5A PSS1,2,3,4, or 5B PSS1,2,3,4, or 5C PSS1,2,3,4, or 5F PSS1,2,3,4, or 5J PSS1,2,3,4, or 5G
Type 7 PALUSTRINE (P) Forested (FO)
All nontidal regimes except Intermittently Flooded and Permanently Flooded (A,B,C,F,J)
PFO1,2,4, or 5A PFO1,2,4, or 5B PFO1,2,4, or 5C PFO1,2,4, or 5F PFO1,2,4, or 5J
Type 8 PALUSTRINE (P) Scrub-Shrub (SS) Broad + Needleleaf Deciduous (1,2) Broad + Needleleaf Evergreen (3,4) Dead (5) Forested (FO) Broad + Needleleaf Deciduous (1,2) Broad + Needleleaf Evergreen (3,4) Dead (5) Moss-Lichen (ML) Emergent (EM)
Saturated (B) PSS1,2,3,4, or 5B PFO1,2,3,4, or 5B PMLB PEMB
RIVERINE (R) Lower Perennial (LP) Upper Perennial (UP) Intermittent (IN) Unconsolidated Bottom (UB)
Intermittently Exposed (G) Permanently Flooded (H)
RUBG RUGH

MnRAM Comprehensive Guidance 11/18/2010 14
2.5 Critical Wetland Resource Designations
Wetlands in the assessment area should be evaluated for designation as critical resources based
on several features defined in Minnesota Statutes. These critical wetland resources should be
classified into the Preserve management class due to their special functions. Criteria for
designating wetlands as critical resources are as follows:
Outstanding Resource Value Waters (Minn. Rules 7050.0180)
Designated Scientific and Natural Areas (Minn. Rules 86A.05)
Wetlands with known occurrences of Threatened or Endangered Species (Minn. Stat.
84.0895)
State Wildlife Management Areas (Minn. Stat. 86A.05, subpart 8)
State Aquatic Management Areas (Minn. Stat. 86A.05, subpart 14).
Wellhead Protection Areas (Minn. Stat. 103I.101, MN Rules Chapter 4720).
Sensitive Ground Water Areas (MN Rules 8420.0548, Subp. 6).
Designated trout streams or trout lakes (MN Rules 6264.0050).
Calcareous fens (MN Rules 8420.1010 through 8420.1060).
High priority areas for wetland preservation, enhancement, restoration and
establishment (MN Rules 8420.0350, subpart 2).
Designated Historic or Archaeological Sites
State or federal designated wild and scenic rivers (MN Rule Chapter 7050)
Mn Pollution Control Agency ―special waters search‖ mapping utility: www.pca.state.mn.us/water/stormwater/specialwaters
2.6.1 OUTSTANDING RESOURCE VALUE WATERS
"Outstanding resource value waters" are defined in MN Rules 7050.0180 as waters within the
Boundary Waters Canoe Area Wilderness; Voyageur's National Park; and Department of Natural
Resources designated scientific and natural areas; wild, scenic, and recreational river segments;
Lake Superior; those portions of the Mississippi River from Lake Itasca to the southerly
boundary of Morrison County that are included in the Mississippi Headwaters Board
comprehensive plan dated February 12, 1981; and other waters of the state with high water
quality, wilderness characteristics, unique scientific or ecological significance, exceptional
recreational value, or other special qualities which warrant stringent protection from pollution.
2.6.2 CALCAREOUS FENS
Calcareous fens are defined in MN Rules 8420.1020 as peat-accumulating wetlands dominated
by distinct groundwater inflows having specific chemical characteristics. The water is
characterized as circumneutral to alkaline, with high concentrations of calcium and low
dissolved oxygen content. The chemistry provides an environment for specific and often rare
hydrophytic plants11. Minnesota Rules 8420.1010-1070 sets out minimum standards and criteria
for the identification, protection, and management of calcareous fens as authorized by Minnesota
Statutes, section 103G.223. The MnDNR is charged with identifying and maintaining a list of
calcareous fens in the state and maintains a database of them. Calcareous fens are also listed in
the Classifications for Waters in Major Surface Water Drainage Basins12. Finally, the rules for
11
MN Rules 8420.1020
12 MN Rules 7050.0470
MnRAM Comprehensive Guidance 11/18/2010 15
Nondegradation of Outstanding Resource Value Waters13 also lists identified calcareous fens in
the state.
2.6.3 SCIENTIFIC AND NATURAL AREAS
State scientific and natural areas (SNA) are established to protect and perpetuate, in an
undisturbed natural state, those natural features which possess exceptional scientific or
educational value (MN Statutes 86A.05). This may include but is not limited to any of the
following features: geological processes; significant fossil evidence, an undisturbed plant
community, an ecological community significantly illustrating the process of succession and
restoration to natural condition following disruptive change; a habitat supporting a vanishing,
rare, endangered, or restricted species of plant or animal; a relict flora or fauna persisting from an
earlier period; or a seasonal haven for concentrations of birds and animals, or a vantage point for
observing concentrated populations, such as a constricted migration route. The area should
embrace an area large enough to permit effective research or educational functions and to
preserve the inherent natural values of the area.
2.6.4 HABITAT FOR DESIGNATED ENDANGERED, THREATENED, OR SPECIAL CONCERN SPECIES
Endangered and threatened plant and animal species are protected in Minnesota as specified in
MN Statutes 84.0895. In MN Statutes, Subp. 3, species of wild animal or plant are designated
as:
1. Endangered, if the species is threatened with extinction throughout all or a significant
portion of its range; or
2. Threatened, if the species is likely to become endangered within the foreseeable future
throughout all or a significant portion of its range; or
3. Species of special concern, if although the species is not endangered or threatened, it is
extremely uncommon in this state, or has unique or highly specific habitat requirements and
deserves careful monitoring of its status.
In 1987, the Minnesota County Biological Survey (MCBS) began a systematic survey of rare
biological features. The goal of the MCBS is to identify significant natural areas and to collect
and interpret data on the distribution and ecology of rare plants, rare animals, and native plant
communities. The MCBS data for the assessment area (if available) should be examined for sites
with moderate, high and outstanding biologic diversity significance.
The MnDNR Natural Heritage and Nongame Research Program (Natural Heritage
Program) collects, manages, and interprets information about nongame animals, native plants,
and plant communities to promote the wise stewardship of these resources. The Natural Heritage
Program has developed a ranking system that is intended to reflect the extent and condition of
natural communities and species in Minnesota.14 These ‗state ranks‘ have no legal ramifications,
they are used by the Natural Heritage Program to set priorities for research and for conservation
planning. They are grouped as follows:
13
MN Rules 7050.0180, Subp. 6
14 Aaseng et al., 1993.
MnRAM Comprehensive Guidance 11/18/2010 16
State Element Rank:
S1: Critically imperiled in the state because of extreme rarity (5 or fewer occurrences or very
few remaining individuals or acres) or because of some factor(s) making it especially vulnerable
to extirpation from the state.
S2: Imperiled in state because of rarity (6 to 20 occurrences or few remaining individuals or
acres) or because of some factor(s) making it very vulnerable to extirpation from the state.
S3: Rare or uncommon in state (on the order of 21 to 100 occurrences).
S4: Apparently secure in state with many occurrences.
S5: Demonstrably secure in state and essentially ineradicable under present conditions.
SH: Of historical occurrence in the state, perhaps having not been verified in the past 20 years,
and suspected to be still extant.
SN: Regularly occurring, usually migratory and typically nonbreeding species for which no
significant or effective habitat conservation measures can be taken in the state.
SR: Reported from the state, but without persuasive documentation which would provide a basis
for either accepting or rejecting the report.
SRF: Reported falsely.
SU: Undetermined. Possibly in peril in the state but status uncertain; need more information.
SX: Extirpated within the state.
The Natural Heritage Program information database should be searched to determine if any
endangered, threatened, or special concern species have been sighted within 500 feet of the
assessment area. The list of species, the subwatershed location, legal protection status, state
element rank and county should be compiled.
2.6.5 STATE WILDLIFE MANAGEMENT AREAS
State wildlife management areas are established to protect those lands and waters which have a
high potential for wildlife production and to develop and manage these lands and waters for the
production of wildlife, for public hunting, fishing, and trapping, and for other compatible
outdoor recreational uses15. State wildlife management areas satisfy the following criteria:
1. Includes appropriate wildlife lands and habitat, including but not limited to marsh or
wetlands and the margins thereof, ponds, lakes, stream bottomlands, and uplands, which
permit the propagation and management of a substantial population of the desired wildlife
species; and
2. Includes an area large enough to ensure adequate wildlife management and regulation of the
permitted recreational uses.
A map of all MnDNR Wildlife Management Areas can be found at:
www.dnr.state.mn.us/maps/compass.html.
2.6.6 DESIGNATED TROUT STREAMS AND LAKES
Designated trout streams and lakes in the state of Minnesota are inhabited by trout other than
lake trout. Fishing and other restrictions have been placed on these waterbodies to protect and
15
MN Statute 86A.05, subpart 8

MnRAM Comprehensive Guidance 11/18/2010 17
foster the propagation of trout. Wetlands associated with these lakes are an integral part of the
whole ecosystem that functions to maintain the characteristics necessary to support the fishery.16
2.6.7 AQUATIC MANAGEMENT AREAS
Minnesota Statutes 86A.05, Subpart 14, allows for the establishment of aquatic management
areas to protect, develop, and manage lakes, rivers, streams, and adjacent wetlands and lands that
are critical for fish and other aquatic life, for water quality, and for their intrinsic biological
value, public fishing, or other compatible outdoor recreational uses. Aquatic management areas
may be established to protect wetland areas under ten acres that are donated to the department of
natural resources. Aquatic management areas must meet one or more of the following criteria:
1. Provides angler or management access;
2. Protects fish spawning, rearing, or other unique habitat;
3. Protects aquatic wildlife feeding and nesting areas;
4. Protects critical shoreline habitat; or
5. Provides a site for research on natural history.
2.6.8 WELLHEAD PROTECTION AREAS
Wellhead protection is defined as a method of preventing well contamination by effectively
managing potential contaminant sources in all or a portion of the well‘s recharge area. The
statutory authority for wellhead protection comes from Minnesota Statutes 103I.101. The rules
for establishment of Wellhead Protection Plans are found in Minnesota Rules Chapter 4720,
which are administered by the Minnesota Department of Health. Wetlands present within
wellhead protection areas are likely to be predominantly recharge wetlands. Since wetlands
typically collect surface water runoff from a larger upland area, recharge wetlands within
wellhead protection areas have a greater probability of transmitting pollutants to a public
groundwater supply than other wetlands. Wellhead protection plans are developed and
implemented by the public water supplier, which is typically a city or the Minnesota Department
of Health. The state rules governing wellhead protection can be accessed on the web at:
www.revisor.leg.state.mn.us/arule/4720/.
2.6.9 SENSITIVE GROUNDWATER AREAS
The Wetland Conservation Act requires that projects proposing to impact wetlands must evaluate
whether the impacts would have an adverse impact on groundwater quality17. If it is determined
that a proposed replacement plan would have a significant adverse impact on groundwater
quality, the replacement plan must be denied. Wetlands determined to be primarily recharge
wetlands as a result of a functional assessment using MNRAM Version 3.1 should be evaluated
for the potential to affect groundwater resources18.
16
A list of all state trout streams and lakes can be found at: www.revisor.leg.state.mn.us/arule/6264/ 17
Minnesota Rules 8420.0548, Subpart 6
18 Evaluate according to the guidelines in: Criteria and Guidelines for Assessing Geologic Sensitivity of Ground
Water Resources in Minnesota, Minnesota Department of Natural Resources, 1991.

MnRAM Comprehensive Guidance 11/18/2010 18
2.6.10 HIGH-PRIORITY AREAS FOR WETLAND PRESERVATION, ENHANCEMENT, & RESTORATION
Water management plans prepared by water management organizations in the metropolitan areas
under Minnesota Statutes, section 103B.231 must identify those areas that qualify as high
priority areas for wetland preservation, enhancement, restoration, and establishment19. These
priority areas shall be included in the next scheduled water management plan update. Plans
should give strong consideration to identifying as high priority areas, minor watersheds having
less than 50 percent of their original wetland acreages, and intact wetlands, diminished wetlands,
and the areas once occupied by wetlands that have been diminished or eliminated and could
feasibly be restored taking into account the present hydrology and use of the area. Plans should
give strong consideration to identifying as high priority areas all type 1 or 2 wetlands, and other
wetlands at risk of being lost by permanent conversion to other uses. When individual wetlands
are identified as high priority for preservation and restoration, the high priority area shall include
the wetland and an adjacent buffer strip not less than 16.5 feet wide around the perimeter of the
wetland and may include up to four acres of upland for each wetland acre.
Plans may identify additional high priority areas where preservation, enhancement, restoration,
and establishment of wetlands would have high public value by providing benefits for water
quality, flood water retention, public recreation, commercial use, and other public uses. High
priority areas should be delineated by minor or major watershed.
2.6.11 STATE AND FEDERAL DESIGNATED SCENIC AND WILD RIVERS
The rules for the protection of state designated scenic and wild rivers is set forth in Minnesota
Rules Chapter 610520 as administered by the MnDNR. Wild rivers are defined as those that exist
in a free-flowing state with excellent water quality and with adjacent lands that are essentially
primitive and scenic rivers are defined as those that exist in a free-flowing state with adjacent
lands that are essentially primitive. Management plans must be developed before a river can be
included in the wild and scenic river system. The plans must give emphasis to the preservation
and protection of the area‘s scenic, recreational, natural, historic, and similar values while
placing no unreasonable restrictions upon compatible, preexisting, economic uses of particular
tracts of land.
19
Minnesota Rules 8420.0350, Subp. 2
20 The state rules can be accessed at: www.revisor.leg.state.mn.us/arule/6105/.

MnRAM Comprehensive Guidance 11/18/2010 19
3.0 Field Assessment and Data Analysis Procedures (sample)
In any inventory project, the data collected should include: wetland location and extent, digital
photographs of each wetland, wetland classification, dominant vegetation, wetland functions,
hydrologic regime, and identification of potential restoration sites within larger assessment areas.
In general, begin by specifically defining the assessment area. Create baseline wetland inventory
and assessment maps utilizing available information including: Minnesota Department of
Natural Resources Public Waters Inventory maps, National Wetlands Inventory maps, soil
survey data, parcel data, topography, and digital orthoquad aerial photographs to help identify
wetland areas. The presence of each wetland should be verified in the field. Dominant wetland
types may be classified using any one of the classification systems described in Section 2.021, in
addition to, at the very least, the U.S. Fish and Wildlife Service Cowardin System22.
The following sample procedure is excerpted from documentation of a Minnehaha Creek
wetland inventory project.
3.1 Field Assessment Maps/Data
The total watershed area within which the Functional Assessment of Wetlands (FAW) was
conducted covers about 181 square miles. Maps were created for field use to locate sites, to
assist in completing the wetland assessments, and to act as a field notebook for recording
necessary data. Each field map covered one full section of land (one square mile).
3.2 Wetland Base Data: Hennepin Conservation District Wetland Inventory
The Hennepin Conservation District (HCD) had conducted a remote sensing wetland inventory
(HCWI) within the District prior to the beginning of this project. The wetlands that had been
identified in the inventory were used as a base layer for the FAW field maps to show where
existing and potential wetlands are located. In conducting the wetland inventory, HCD followed
a stepped procedure, described below.
First, potentially drained wetlands were identified based on depressional areas with
hydric soils or transitional soils, or poorly drained depressions identified on the soil survey
without clear evidence of wetland hydrology. Areas identified on the NWI were included.
Areas appearing on the Metropolitan Mosquito Control maps were also highlighted, as these are
known to pond water periodically.
Next, areas that appeared to have wetland hydrology on infrared (IR) stereo photos, as
identified by tone, texture, and presence of a depression, were identified. Then, aerial
photography from the past 15 years was evaluated in combination with data of yearly
precipitation (wet, normal, dry) to evaluate wetlands that were identified during the IR and
soil/topography review. During the aerial photography review each high lighted site was defined
as either: (1) dry cropped, (2) dry and no crop, (3) wet and crop stress, (4) wet and no crop, (5)
wet and drowned out, or (6) ponded.
21
Classify wetlands using the U.S. Fish and Wildlife Service Circular 39 System, Shaw and Fredine, 1959. 22
Cowardin et al., 1979.

MnRAM Comprehensive Guidance 11/18/2010 20
Areas that appear to have wetland hydrology every year and do not appear to be drained
were classified as wetlands with unaltered hydrology (EWET and shown as green polygons on
the base maps) in the GIS. The areas showing evidence of wetland hydrology in one-third or
more ‗normal‘ precipitation years were classified as wetlands with altered hydrology (AWET
and shown as blue polygons on the base maps). Estimated restorable areas that did not appear to
have wetland hydrology during at least one-third of the normal precipitation years, or could not
be observed due to tree cover, were identified as potential wetlands (RWET yellow polygons on
the base maps) in the GIS. The extent of these potential wetlands was determined using either:
1) the size during the wettest year, 2) the boundary of the depressional soil unit on the soil
survey, and/or 3) the boundary of the NWI or Mosquito Control District mapping.
3.3 Field Assessment Base Data
Each wetland polygon or wetland complex identified in the inventory was given a unique
Wetland ID number. The ID number consists of the township number, followed by the range
number, followed by the section number and finally a unique three-digit number for each
wetland within the section. A letter designation (D or E) is placed at the beginning of the
wetland ID. A ―D‖ indicates that the wetland is completely or partially drained and an ―E‖
indicates that there was not clear evidence that the wetland has been hydrologically altered.
Other data on the base maps included soil type and inclusions and the approximate acreage of
each wetland. Color aerial photographs from 2000 were used as a base layer on the field maps
for the FAW under the wetland polygons and soil data. In addition, section numbers, parcel
lines, road names, and subwatershed boundaries were added to the field maps that were plotted at
a scale or 1 inch equals 200 feet.
Separate topography maps were created for use in the field. The topography maps were
created in ArcView 8 using 5-ft contours with a subtle hill shading and the ~160 subwatershed
boundaries at a scale of approximately 1 inch equals 800 feet. The topography maps were made
at a larger scale, to include complete subwatershed areas for assessing wetland location within a
subwatershed and proximity to recreational water bodies.
3.4 Field Assessment Procedures
The section maps, topographic maps, digital camera and a letter explaining the project to
property owners were used each day during fieldwork. All existing wetlands and all potential
wetlands greater than 0.25 acre were evaluated in the field for wetland function and for
restoration potential. If potential wetlands under 0.25 acres in size were found to contain rare
and/or unique features, they were assessed.
Property owners were informed of the project by publishing public notices in each local
newspaper and/or newsletter. To begin an assessment, the property owner was identified using
the parcel lines on the maps and an attempt was made to contact the owner. If the property
owner was available, the field evaluator briefly described the project and asked the owner for
permission to access the wetland(s) on their property. If the property owner refused access, a
note was made on the section map.
The objective of the field assessment was to answer all questions in the Access database,
excluding those highlighted in red that were evaluated using existing digital data analyzed using
GIS. This included an evaluation of the presence and abundance of hydrophytic and invasive
vegetation to identify and appraise the plant community, seeking out surface drain tile inlets,
ditches or any other drainage feature to identify hydrogeomorphology, litter and buffer of the
wetland, land-use within the subwatershed, and apparent public use of the wetland. The soil and

MnRAM Comprehensive Guidance 11/18/2010 21
topography maps were used in the field to determine the presence of hydric soils, and the
topographic position of each wetland within the subwatershed. Both the Cowardin and Circular
39 classifications were assigned to each wetland during the field assessments.
3.5 Field Map Notation
Field notes were written on the maps using a permanent marker, preferably in red. Each
evaluated wetland or potential wetland was marked on the map using the following mapping
symbols:
NW = Not Wetland: Identified as a wetland or potential wetland on the inventory but
observed to be dominated by upland vegetation in the field; these would typically
be accompanied by an X through the wetland polygon.
A = Assessed Wetland: wetlands that were assessed in the field.
NA = Not assessed: typically wetlands below the threshold size of 0.25 acres and
identified as potential wetlands in the inventory or wetlands present on
inaccessible private property
NAW = Not Assessed Wetland: wetlands that were not assessed, but were verified as a
wetland, typically classified as potential wetlands and less than 0.25 acres in size
with no unique or notable characteristics.
SW = Stormwater Pond: clearly excavated out of upland and created to manage
stormwater.
R = Restorable Wetland: drained wetlands that were only assessed for restoration
potential.
Wetland boundaries were revised on field maps when field evaluations indicated a significant
difference in the edge of dominant hydrophytic vegetation from the inventory mapping. If a
wetland boundary was changed, an ―X‖ was written through the old boundary to indicate the
creation of a new boundary.
3.6 Guidelines for Field Map Notation
New wetland IDs were assigned to new wetlands found in the field but not identified on the
inventory or portions of large wetland complexes that needed to be split. The database was
reviewed to find the next sequential ―D‖ or ―E‖ designation ID number for the section in which
the majority of the wetland resides. The new Wetland ID was entered into the database and the
new ID was written within or next to the wetland polygon on the map.
Wetlands separated by roads or railroads (i.e. those with only a restricted hydrologic
connection and no ecological connection) were evaluated as unique wetlands. Partially drained
wetlands that were determined to be restorable were evaluated as wetlands and for restoration
potential. In this case, the existing wetland areas were labeled with an A and the drained portions
were labeled separately with an R, but all parts of the wetland basin were identified with the
same Wetland ID.
At completion of each day, or the completion of a section, the dates and persons
conducting field evaluations were indicated in the upper right corner of each map, and
‗COMPLETE‘ was written in the upper left corner when the entire section was completed. If
there were wetlands crossing the section line that have not been fully assessed or mapped they
were indicated in the upper left corner of the map.

MnRAM Comprehensive Guidance 11/18/2010 22
3.7 Photographs
A digital photograph was taken of each evaluated wetland and drained wetland that was assessed
for restoration potential. An arrow was drawn on the map with the point of the arrow at the point
where the photograph was taken from, indicating the approximate direction of the photo.
Photographs were tracked by writing the photo number next to the location arrow. The photo
point locations were digitized in GIS within the corresponding wetland polygon, and UTM
coordinates for each point were generated. A list could also be made in a field book indicating
the Wetland ID and the photograph number. Each photograph was subsequently renamed using
the unique Wetland ID (i.e. D1172401001).
3.8 Identifying Potential Wetland Mitigation Sites
All drained wetlands identified in the inventory and other drained wetlands identified in the field
were evaluated for the potential to restore those wetlands. Wetlands with restoration potential
typically met one or more of the following conditions:
Mapped hydric soils or hydric soil inclusions
Wetland hydrology signatures on past aerial photos
The area was a depression in the landscape
Wetland hydrology was currently absent within part or all of the depression
Evidence of ditching, tiling, or other feature that has removed the hydrology should be
present
Drained wetlands within permanently altered land uses (i.e. golf courses) were determined to
not be restorable in most cases.
The approximate restorable area was delineated on the map, even if it was adjacent to an existing
wetland. The currently non-wetland area which has potential to be restored was marked with an
R to indicate which Wetland ID the restored area was associated with. A photograph was taken
and the photo point was indicated on the map.
3.9 Procedures for Field Work
The functions of each wetland were evaluated by completing the Microsoft Access® database
using laptop computers that were carried in the field. The wetland records from all field crews
were combined by exporting completed records and importing them into a master database.
The photo ID number generated by the digital camera for each wetland photo was entered
into the database which also corresponded to the photo number indicated on the field maps to
allow easier tracking. For each assessed wetland, the field evaluator recorded their initials and
the date of the assessment within the database for future reference. The database contains The
National List of Plant Species that Occur in Wetlands23, which includes common and scientific
names and the indicator status for each species. This list was used for entering the dominant
plant species (typically those dominants according to the 50/20 rule) within each wetland along
with the cover class for each species.
When there were numerous species of one type (i.e. willow, sandbar); the appropriate
species was used when known, otherwise the general name was used. When wetlands with
uncommon vegetation (e.g. sedges, tamarack, sphagnum moss, bog species) were evaluated,
those species were recorded, even if they weren't dominant for the entire wetland. Species were
23
Resource Management Group, 1999.

MnRAM Comprehensive Guidance 11/18/2010 23
usually selected from the drop-down list to avoid misspellings and improper names. If a species
was not present in the plant list, it was added to the species list.
Upon return to the office, each assessed wetland was checked to verify that there was one
complete Access database record, one digital photograph, and one wetland polygon marked with
an A or an R on the field maps. Also, maps were checked for initials of the field evaluator, and
the dates of the fieldwork.

MnRAM Comprehensive Guidance 11/18/2010 24
4.0 GIS Procedures (sample) The following sample procedure is excerpted from documentation of a Minnehaha Creek
wetland inventory project.
4.1 GIS Wetland Shapefile
The field evaluation notation for each wetland was entered into the ArcView wetland shapefile
table and the wetland boundaries were revised to note any significant changes to the inventory.
This included: adding new wetland boundaries, deleting incorrect boundaries, merging wetland
polygons, and splitting wetland polygons. Field assessment notations were added in GIS
according to those listed in the Field Evaluation Notation section above. Following are some of
the general guidelines followed in updating the inventory wetland shapefile:
Upon completion of the FAW, each Wetland ID should only have ONE wetland polygon
with an A in the Assessment field.
Wetland polygons from the HCWI were generally not deleted; if an area was determined
to not be wetland, an NW was entered in the Assessment field.
Multiple polygons identified with the same Wetland ID in the inventory were either
combined, split up and given different Wetland ID numbers, or given different
designations in the Assessment field when indicated as necessary by the field assessment
notes.
The area of each assessed wetland was computed in ArcView after all boundary revisions
were made and prior to completing the GIS data analyses.
Where only minor alterations in the boundary of a wetland were indicated on the field
maps, the boundaries were not revised in GIS. If only a portion of the wetland polygon is
indicated as changing significantly, just that portion of the wetland was revised. The
minor wetland boundary changes indicated on the field maps could be used to refine the
digital wetland boundaries in the future.
A photo location point was digitized in ArcView within each assessed wetland polygon.
4.2 GIS Data Analyses
Seven wetland functional parameter questions were evaluated using analyses of existing digital
data in GIS. The resulting evaluation data were then imported into the database where all of the
functional evaluation data are managed. The following values are given for classifications that
were assigned for each of the questions answered using GIS (which are the same values used
throughout MnRAM):
Exceptional = 2.0 Discharge = 0.1
High = 1.0 Recharge = 0.0
Medium = 0.5 Yes = 1.0
Low = 0.1 No = 0.1
Following is a brief description of the wetland functional parameter questions analyzed using
GIS and a brief description of the criteria and analyses performed in GIS.

MnRAM Comprehensive Guidance 11/18/2010 25
Question #2: Are rare plant species or state or federally listed species known to be in/near
wetland?
A 200-foot buffer was established around each wetland in ArcView. The wetland and buffer
area were then checked for the presence of any state or federally listed species within that
area. The wetland polygon with buffer area was used to intersect rare species GIS data
provided by the MnDNR Natural Heritage Inventory Database. Values for responses of yes
or no were returned based on the outcome of the analysis.
Question #12: Describe the predominant upland soils within the subwatershed that affect the
overland flow characteristics.
A 500-foot buffer was established around each wetland polygon. The Soil Conservation
Service hydrologic soil group data (i.e. A = sand, B = sandy loam, C = clays loams, and D =
plastic and swelling soils) within the 500-foot buffer was evaluated to determine which soil
group represents the majority of the area. These resulting values were based on the following
rules:
High: Majority of soils C, D, or combinations with C or D
Medium: Majority of soils hydrologic soil group B
Low: Majority of soils hydrologic soil group A
Question #14: Describe the density of wetlands within the subwatershed.
First, an analysis was conducted to determine the proportion of each subwatershed area
comprised of wetlands, lakes, or ponds. Then it was determined within which subwatershed
each wetland was located. Based on the subwatershed wetland/waterbody density, a value of
high, medium, or low was attributed to each wetland based on the following rules:
Classification Rules:
High: Wetlands/water making up < 10% of subwatershed area
Medium: Wetlands/water making up 10-20% of subwatershed area
Low: Wetlands/water making up > 20% of subwatershed area
Question #28: Describe the soils within the wetland.
The digital soil survey data for Hennepin and Carver Counties was evaluated to identify all
"organic" wetland soils. The soil mapping underlying each assessed wetland was evaluated
for the presence or absence of organic soils. A value for each wetland was determined based
on whether the majority of soils were organic or mineral according to the following criteria:
Classification Rules:
Recharge: Majority of soils in the wetland are mineral.
Discharge: Majority of soils in the wetland are organic
Question #30. Indicate conditions that best fit the wetland based on wetland size and the
hydrologic properties of the soils within 500 feet of the wetland.
Again, the 500-foot buffer around each wetland was used for this analysis along with the area
of each wetland (previously computed in GIS). If the total wetland area is greater than or
equal to 200 acres, the wetland is discharge. If the wetland is less than 200 acres in size and

MnRAM Comprehensive Guidance 11/18/2010 26
the surrounding upland soils within 500-feet are in the A or B hydrologic soil group, then the
wetland is discharge. Otherwise the wetland was determined to be recharge for this question.
Question #34. Is the wetland known to be used recently by rare wildlife species (or state or
federally listed wildlife)?
Similar to Question 12, a 500-foot buffer around each assessed wetland was checked for
known rare wildlife species using GIS data provided by the MnDNR Natural Heritage
Inventory database. Based on the analysis results, the field for Question 34 was populated
with the numeric values:
Yes = 1.0
No = 0.1
Question #35. Is the wetland or a portion of the wetland a rare natural habitat or community as
identified by the MnDNR Natural Heritage Inventory database or the County Biological Survey.
Is the wetland plant community scarce or rare within the watershed, imperiled, or critically
imperiled (state rankings S1 and S2)? If this applies, then Special Features question b is
answered yes and the wetland wildlife habitat function level rating is exceptional.
Each wetland was compared to the rare habitat features from the County Biological Survey
(CBS). An attribute was added to the CBS table data indicating the state rank so that those
communities rated S1 and S2 that intersected the wetland were answered yes and the others
were answered no. Based on the analysis results, Question 35 was populated with the
numeric following values:
Yes = 1.0
No = 0.1
Question #48. Is any part of the wetland in public or conservation ownership?
The property ownership of each evaluated wetland was analyzed using the Hennepin and
Carver County Parcel data. The ―Find Majority Area‖ was used with the ExemptCode field
being the field and Watershed ID being the value summarized. If the area of ―E‖ = 0, then
there is no public ownership (Value = ―LOW‖). If the area of ―N‖ = 0, then there the entire
wetland is under public ownership (Value = ―High‖), if not, then some of wetland is under
public ownership, (Value = ―Medium‖). If there is no summary for wetland, the wetland
must fall outside of parcels in shapefile, usually this would be road ROW. If so, assume the
value = ―high.‖
4.2.1 CREATING GIS ANALYSES SUMMARY TABLE AND IMPORTING INTO DATABASE
A summary table was then created for importing the results of the GIS analyses into the
database. The summary table must be formatted as shown below for proper import to the
database. Each Wetland ID presented in the summary table must have a valid answer for each of
the questions analyzed using GIS (i.e. Questions 2, 12, 14, 28, 30, 34, 35, and 48). Running the
database import routine operates such that the data for the questions described above will be
overwritten for each Wetland ID presented in the summary table. Each time this data was
imported the existing data in Access will be overwritten. Missing data for any question will
result in that particular question being populated with a value of 0 (zero) for that Wetland ID. In

MnRAM Comprehensive Guidance 11/18/2010 27
most cases, a 0 (zero) is not valid. The table must be in comma-delimited format in the EXACT
question order shown below: "Wetland_ID","Q12_val","Q14_val","Q28_val","Q30_val","Q48_val","Q02_val","Q34_val","Q35_val" E-117-24-14-008,0.5,0.1,0.1,0.0,0.1,0.1,0.1,0.1
This summary table was then imported into the database using the "Import GIS Data" button on
the General Information tab of the data entry form. Within the Import Dialog box within the
"Import GIS Data" button, the Update GIS Fields option is chosen and the file name and
extension was entered in the Select a File to Import box.
4.2.2 CREATING SUMMARY TABLE AND IMPORTING GENERAL INFORMATION EVALUATED UTILIZING
GIS
Several other pieces of information were generated using GIS to the improve accuracy and
eliminate the possibility of data entry errors. The data generated included:
1. Municipality/Township (both primary and secondary) within which the wetland lies.
A GIS polygon dataset developed by the Metropolitan Council (i.e. County_CTU.shp)
containing boundaries of cities, township and unorganized territory (CTU) in the Twin
Cities 7-county metropolitan area was used to determine the municipal location of each
assessed wetland. The linework for this dataset comes from individual counties and is
assembled by the Metropolitan Council for the MetroGIS community. The data was current
as of April, 2000. Up to two pieces of data were generated from this analysis indicating the
city(ies) or township(s) within which the wetland is located (i.e. ―InfoCityName‖ and
―InfoCityName2‖ fields). The first parameter, InfoCityName is the city within which the
majority of the wetland lies, and the second, InfoCityName2 is for wetlands that cross
municipal boundaries and indicates the city within which the smaller portion of the wetland
lies. Each assessed wetland polygon was evaluated in GIS to determine within which city
the majority of the wetland lies.
2. Subwatershed within which the majority of the wetland lies.
The GIS polygon dataset provided by the Minnehaha Creek Watershed District containing
the boundaries of the 16 subwatersheds in the District (Figure 1.1) was used to determine
within which subwatershed the majority of each wetland lies (i.e. ―InfoSubwatershed‖ field).
3. Wetland Area in acres of each assessed wetland and potential wetland restoration areas.
The area of each wetland and potential wetland restoration area was computed in GIS using
the approximate, field-verified wetland boundaries that had been digitized in GIS.
4.2.2.1 City/Subwatershed Data Import
The city and subwatershed location information was then tabulated into a summary table for
importing into the database. Again, a comma delimited file format was used as shown below:
"Wetland_id","InfoCityName","InfoCityName2","InfoSubwatershed" D-028-24-26-001,Richfield,,Richfield/South Minneapolis D-117-22-12-035,Hopkins,Minnetonka,Upper Minnehaha Creek
This summary table was then imported into the database using the "Import GIS Data" button on
the General Information tab on the data entry form. Within the Import Dialog box within the
"Import GIS Data" button, the Update Gen'l Information option is chosen and the file name and
extension was entered in the Select a File to Import box.

MnRAM Comprehensive Guidance 11/18/2010 28
4.2.2.2 Wetland Area Data Import
The wetland area information was then tabulated into a summary table for importing into the
McRAM database. Again, a comma delimited file format was used as shown below:
"WETLAND_ID","INFOCURRENTSIZE" D-118-23-16-007,0.47 D-118-23-13-026,2.28 This summary table was then imported into the database using the "Import GIS Data" button on
the General Information tab of the data entry form. Within the Import Dialog box within the
"Import GIS Data" button, the Update Wetland Areas option is chosen and the file name and
extension was entered in the Select a File to Import box.
4.3 Data Management and Data Use in GIS
All wetland functional data and general information is maintained in the MnRAM Access®
database. Only the wetland polygons and Assessment status for each Wetland ID are maintained
in GIS. The wetland functional data and general information stored in the database can be
temporarily referenced in GIS for preparing maps and conducting spatial analyses.
4.3.1 ACCESSING AND UTILIZING DATA FROM THE DATABASE
1. Create ODBC connection to Database as follows (these directions are for Windows2000):
a. Go to the control panel and select administrative tools.
b. Select the ―Data Sources (ODBC)‖ icon
c. Select the System DSN tab
d. Push the ―Add‖ button
e. It will ask for a ―driver‖, select the Microsoft Access driver (*.mdb).
f. Type in ―Master Database‖ for Data Source Name. Type in a description (not
required).
g. Specify the MnRAM database location by pushing the ―select‖ button.
h. When done, say OK and leave the setup program.
2. If the Access table has not been loaded into the ArcView project, do the following:
a. From the projects menu in ArcView, select ―SQL Connect‖, a dialog box will
appear.
b. Select ―Master Database‖ from the dropdown list, then press ―Connect‖.
c. A list of ―Tables‖ appears. Select tblSummaryGISDataFinalNums (contains the
computed numeric scores for all functions except groundwater and storm water
sensitivity) from the list.
d. Double click on <all columns> in the columns list
e. Name the output table tblSummaryGISDataFinalNums
f. Push the query button. This should load the Access table into ArcView as an
ArcView table.
Repeat steps a through f for the following tables:
tblSummaryGISDataFinal (contains the Assessment status [fldStatus]along with the text
ratings for each function)
tblSummaryGISDataTwoFinal (contains the Assessment Status, Circular 39 types,
Hydrologic Setting, Geomorphic setting, City1, City 2, Subwatershed, Wetland Size,
Cowardin type, and Community description)

MnRAM Comprehensive Guidance 11/18/2010 29
Each of these tables can be joined to the Wetland shapefile in GIS using the Wetland_ID as the
common field. To map wetland types in GIS based on the dominant Circular 39 wetland type, a
wetland classification lookup table must also be joined to the Wetland shapefile. From the
ArcView project window, add Table wet_lkup_sens_121602b.txt, join to the Wetland shapefile
using the Circular 39 field as the common field and the Dom_Type field contains the dominant
wetland type for each assessed wetland. The Circular 39 wetland types shown on the Wetland
Classification figures for each municipality (i.e. Figures 6.27-6.56) are either the dominant
wetland type within the assessed wetland or a known subdominant Exceptionally sensitive
wetland type, if present (i.e. Types 7 and 8 wetlands). This data is contained in the field Design
in the Table wet_lkup_sens_121602b.txt. Virtually any of the data tables contained in the
database can be joined to the GIS Wetland shapefile as described above, however, just those
tables containing the most commonly utilized data are described above.
4.4 Quality Assurance and Quality Control
Several procedures were implemented to ensure the accuracy and completeness of the data
generated during the course of the project. Five primary data products were generated as a result
of the project:
1. Field Assessment Maps
2. Wetland GIS Shapefile
3. Database Records
4. Wetland Photographs
5. Wetland Photo Points
Each data product contains valuable information that is either explicitly presented in this report
or is part of the project record that will be integral for future use. It was important to ensure that
each of these five products contained data corresponding to each unique Wetland ID.
Field Assessment Maps are part of the project record and contain all of the direct field notations
including approximate wetland boundary mapping, wetland assessment status, Wetland IDs,
field evaluator identification, field evaluation dates, wetland photo numbers, and wetland photo
location. Many of the wetland boundaries that were revised from the inventory were not
incorporated into the final GIS Wetland shapefile, so the field assessment maps provide valuable
wetland boundary information not included in this report. The wetland assessment status data
was incorporated into the GIS Wetland shapefile and should correspond precisely. The Wetland
ID represents the unique identifier for each wetland and is the most important piece of
information that must be connected to all data collected for each wetland. The identification of
field evaluators, dates of each wetland assessment, and photo numbers are valuable for tracking
down any data entry errors that may be present.
Wetland GIS Shapefiles contains the unique spatial wetland location and extent data, which
was used as the baseline data on field assessment maps from the inventory. The original
inventory shapefile was updated and revised based on the field assessments conducted
throughout the project. Each assessed wetland must have a unique Wetland ID to which all other
data generated during the project is tied.
Database Records contain all of the wetland functional data collected in the field and analyzed
using GIS which must correspond directly to the Wetland ID noted on the field maps and
contained in the Wetland GIS shapefile. The database is the primary data storage program for all

MnRAM Comprehensive Guidance 11/18/2010 30
data generated during the project except the spatial wetland location and extent data. It is
imperative that each Wetland ID in the database corresponds to the proper wetland in the
Wetland shapefile.
Wetland Photographs were taken at the time each wetland was assessed in the field and
provides a visual record of each wetland from that point in time. Each digital photograph was
automatically assigned a number by the camera when the photo was taken. That wetland photo
number then was manually tracked and renamed using the unique Wetland ID number.
Wetland Photo Points represent the approximate location from which the photograph was
taken. This location data was designated on the field maps and digitized into a photo point
shapefile in GIS at the approximate location from which the photo was taken and within the
wetland polygon.
4.5 Automated ArcView and McRAM Database QA/QC
The first quality assurance/quality control analysis was conducted in GIS to ensure that each
unique Wetland ID contained only one wetland polygon indicated with an A (assessed) in the
Assessment Status field. The second QA/QC analysis was developed to initially check for a one-
to-one correspondence between wetland assessment records in the database and "assessed"
wetland polygons in ArcView following the completion of the field wetland assessments. From
that analysis, a table is produced containing four data columns with the possible values as
follows:
1. GIS Status: The shapefile indicates whether or not the wetland was indicated as assessed in
the wetland shapefile.
Assessed – Assessment field contains an "A", shown as assessed on map
Not Assessed – Assessment field contains "NA", shown as not assessed
N/A – indicated as no record in ArcView
2. GIS Message: If the Wetland ID exists in the shapefile, but not the Access database
OK – there is a polygon in the shapefile and the database
No Shapefile Record – There is no Wetland ID in the shapefile.
More than One Shapefile – more than one polygon with the same Wetland ID and both
shown as "Assessed"
3. Access Status: Indication in Access database table whether or not the wetland has a
completed assessment record or restoration potential evaluation.
Assessed – Wetland has a completed wetland database record.
Not Assessed – The "Complete Box" in the database has not been checked
N/A – indicated as no record/ID in Access database
4. Access Message: If the Wetland ID exists in the Access database but not in the shapefile.
Assessed – Database record for this Wetland ID has the Complete Box checked.
No Table Record – No data in the database for this ID.
A new table summarizing the results will be created. Those with "Assessed" in column 1 and 3,
have corresponding records in GIS and Access. Those with different values in columns 1 and 3

MnRAM Comprehensive Guidance 11/18/2010 31
must be analyzed in further detail as do those without an "OK" in column 1 or 3 some aspect of
the database or shape file is missing. Based on these results inconsistencies were amended.
The final, automated QA/QC procedure conducted involved an analysis of wetland photo points
to ensure that each "assessed" wetland polygon contain one, and only one, wetland photo point
digitized within the wetland polygon.
4.5.1 MANUAL ARCVIEW AND DATABASE QA/QC
All spatial wetland assessment data was mapped in ArcView for each municipality within the
District. The wetland functional data was presented in three sets of tables for each municipality.
A manual QA/QC procedure was conducted to ensure that the spatial wetland assessment data
and database wetland functional data were consistent. The municipal Wetland Classification
maps and municipal Wetland Data Tables were manually checked to ensure that each unique,
assessed Wetland ID contained one wetland polygon and one database record. The QA/QC
procedure for ensuring that one digital photograph was present for each assessed wetland was
conducted on approximately a weekly basis throughout the duration of the project. Each field
evaluator created a log of wetlands assessed and original photo numbers that was then double-
checked after the wetland photos were renamed.
4.6 GIS Information:
Data Standards and Practices in Metro/Minnesota
County and Minor Civil Division Coding Exchange Standards (Statewide)
The three-digit FIPS and state standard county code as adopted as a standard for state
agencies has been adopted as a MetroGIS standard for data exchange.
http://www.metrogis.org/data/standards/index.shtml
Minnesota Land Cover Classification System
Developed minimum mapping units and can let you know how to cost out a project of this
magnitude. They used the MetroGIS community to aid in their development of a standard
product, gain statewide buy-in and then approve/adopt the standard and use for a regional
dataset.
Contact Information:
Bart Richardson, DNR Metro Region, Phone: 651-772-6150
MetroGIS Contact Information:
Randy Johnson, Metropolitan Council, MetroGIS Project: 651-602-1638
More information about GIS data is available at the following websites:
National Wetlands Inventory (NWI) Polygons:
http://deli.dnr.state.mn.us/metadata/index_th.html
County Soil Surveys:
(metro Counties) www.datafinder.org/metadata/orthos2000.htm
(statewide): http://lucy.lmic.state.mn.us/metadata/doq.html

MnRAM Comprehensive Guidance 11/18/2010 32
check area LGU for updated photography or other resources
Watershed Basins (minor watershed):
(statewide) http://deli.knr.state.mn.us/metadata/full/bas95ne3.html
Parcel (land ownership):
(metro only) http://www.datafinder.org/catalog.asp
statewisde contact information only): http://www.lmic.state.mn.us/cty_contacts.html
MCBS Native Plant Communities:
http://deli.dnr.state.mn.us/metadata/full/mnnpcpy2.html
Mn Scientific and Natural Areas:
http://deli.dnr.state.mn.us/metadata/full/snaxxpy3.html
MCBS Sites of Biodiversity Significance:
http://deli.dnr.state.mn.us/metadata/full/mnsbspy2.html
Color Infrared (CIR):
http://www.dnr.state.mn.us/airphotos/ordering.html

MnRAM Comprehensive Guidance 11/18/2010 33
5.0 Quick Reference—how to install the program, enter data, and get reports
Using the MnRAM database
This section is meant to supplement, not replace, user training on the wetland assessment
method. Training will explain the method and rational behind the questions; this section will
explain how to use the program itself. It assumes a level of familiarity with data entry and
computers in general and will not attempt to explain common terms or actions.
A Visual User Manual is available over the Internet as a PowerPoint™ presentation. It gives a
virtual tour of the database as well as descriptions and explanations of the questions.
ALL MNRAM MATERIALS ARE AVAILABLE AT THIS WEBSITE:
www.bwsr.state.mn.us/wetlands/mnram/index.html
5.1 Installing the Program
Download the program to your hard drive. At the website, the text version (Microsoft Word™),
field sheets (Excel™), and other materials are also available.
5.2 Opening the Database/Naming Wetland Conventions
When you open the database, Access will give several warning screens. Do not be alarmed; these
are standard and cannot, at this time, be avoided. Answer <Okay> or <Run Program> as
necessary and you will get to the main screen.
The first time you open a blank database, the main screen will appear blank with some button
options to the right. Use your mouse to click the top button: ―Add New Wetland.‖ This brings
up a pop-up window as shown below. The cursor should be at an open field where you first
enter the site
name (any mix
of numbers or
letters is
possible).
Click on the
arrow near the
County
column to
choose the
County (a
two-digit
County Code will fill in automatically). Enter the three-digit Township number, the two-digit
Range number, and the two-digit Section number. The three-digit ID is for differentiating basins
among clusters of wetlands that exist in the same section. Starting with the northern-most site,
number them counterclockwise (NE to NW to SW to SE) in order (001, 002, etc.).

MnRAM Comprehensive Guidance 11/18/2010 34
The next field is indicates whether this is the first (A), second (B), third (C) or subsequent
assessment of the wetland. Up to three ¼ section locations can be added as in the following
example: SW ¼ of the SW ¼ of the SW ¼. Together, these numbers make up a unique Wetland
ID.
You can add several sites at once, or do one at a time. After you have entered your sites, close
the Add window.
The list of wetland names you have entered will appear in the drop-down list at the ―Search for
Wetland‖ field in the upper left. Highlight one to begin entering data. The cursor can be
advanced from
field to field by
using the ―Tab‖
or ―Enter‖ key.
Use your mouse
to switch tabs to
a new set of
questions.
5.3 Entering Data
To activate a Wetland record for inclusion into reports or for export to another database, the
―Complete Box‖ must be checked. There are several data quality checks built into the database to
capture potential errors. Please take care to answer all of the questions (except for Questions 30-
35 when Shoreline Protection does not apply and Questions 65-70 when Wetland Restoration
potential does not apply), as all questions must be answered for the functional index calculations
to perform.
Fields that have a
drop-down list
available look like
this: If the
choice you want is
not listed, you may
be able to add it to
the list by pressing
the + button and
entering the data. In
some cases (such as
the list of watersheds
or vegetative
communities), you
will not be able to
modify the list.

MnRAM Comprehensive Guidance 11/18/2010 35
The next tab, ―Introduction,‖ gives the history and overall purpose of the wetland assessment
method, as well as the ranking structure. Because of space limitations, it is a summary of the
information contained in the Comprehensive Guidance.
The ―Special Features‖ tab gives a list of checkboxes, ―A‖ through ―U‖, which should be
checked if they apply to the wetland. To check a box, either click on the box with the mouse, or,
if the box is highlighted (with a dotted line around it by tabbing or entering through), then type
―Shift +‖ to check the box.
As on all screens, use the mouse to move the scroll bar in order to see the lower portion of the
page without having to tab all the way through it.
Before answering any question, click on the to show the guidance, which points out the
purpose of the question and assists in choosing the correct response.
The main questions begin on the next tab: ―Vegetation (1-6).‖ Up to five communities may be
listed under Question #1.
Question #2 Dominant Species refers to vegetative species making up 10 percent or more within
the entire wetland and all non-native or invasive species. This list is for your reference only;
there are no formula connections based on the Dominant Species list.
The drop-down list is set to search by group common name but
you can change to search by common or scientific name using
the Display Name Toggle. As you start typing in the first open
field, choices will be offered. Open the drop-down list to see full
list and pick the appropriate choice. If you want to enter a
species that is not on the list, contact BWSR MnRAM support to
request it.
An indicator for whether a species is native/non-native or invasive/noxious will fill in
automatically from the list.
Question #3 Veg Index is answered in the table shown under Question #1. It is the Vegetative
Index rating that you give to each distinct Wetland Plant Community.
Because of programming restrictions, the database version does not allow you to split out
dominant species by Community Type, as in the Excel and paper versions. Because the species
list is for reference only, this will not affect the ratings. In later versions, this discrepancy will be
eliminated.
The rest of the questions on this tab are self-explanatory.
Hydrology and Soils (7-22) is the next tab. Guidance for many questions is available by clicking
the question mark next to a field: . Questions shown in red need additional resources to
answer and may be answered in the office ahead of time. Answers to all other questions should
be recorded in the field.

MnRAM Comprehensive Guidance 11/18/2010 36
Buffer and Shore (23-34) is the next tab. Questions #24-26: remember that these refer to all the
land surrounding the wetland out to 50 feet, whether or not it would be considered ―buffer.‖ See
the definition provided in the guidance to Question 23. The total of the three boxes for each
question must add up to 100 or you will not be able to move off of that tab.
The next set of tabs, starting with Habitat (35-47) is ―in back‖ of the first row. When you click
on any of these rear tabs, the entire second row of tabs moves forward.
Questions #37 and #38: click on the box labeled ―image‖ to see the choices.
5.4 Summary and Reports
The last tab summarizes the functional ratings using preset formulas to calculate final scores for
each function. Because there are four ways to calculate and report vegetative diversity and
integrity, these results are listed separately.
Check the Complete
box and press
<Refresh> to see the
summary values on
screen. <Print
Summary> will show
a one-page report of
the functional ratings.
That report may be
printed for inclusion
in reports.
To get a listing of the responses to all the questions, use the Individual Site Report. This report
does not show the functional ratings, just the values you entered for each question. A description
of the reports is given in Sections 5.5.5 – 5.5.7.

MnRAM Comprehensive Guidance 11/18/2010 37
5.5 Extra Features
5.5.1 WETLAND PHOTO
First, load digital wetland photos into a specified drive and folder. Pressing <Photos> at the
General Information tab will bring up a window for handling photo files. The ―open folder‖ icon
allows you to browse to the location where you stored the photos and link them to the site.
Although not required, a standard naming convention to tracking photos is advised. One method
is to name with the full Wetland ID, with the numbers given by County, Township, Range,
Section, ID, and Letter. The camera icon, when clicked, will open the photograph. Double-click
the photo to return to the database record. Although more than one photo may be linked to a site,
be aware that photo records take up a great deal of disk space and plan accordingly.
5.5.2 IMPORT-EXPORT DATA
―Import/Export Data‖ is used to export assessment data from one database and import that data
into another copy of the database. This feature is useful when it is desirable to compile data from
multiple users into a single location or to import existing data into a newer version of the
database. Only records that have had the ―Complete‖ box checked (on the ―General Information‖
tab) will be included in the export. Click on the import data box, type in the specific file path
(including a ―\‖ at the end of the first line and type in the folder name in the user box) where the
data the data is located, select import or export and click <Import Record>.

MnRAM Comprehensive Guidance 11/18/2010 38
5.5.3 IMPORT GIS DATA
Three types of GIS data can be imported using this feature. Import data must be set up in a
comma-delimited file format in the exact order shown below. The dialog box describes three
options: which are described below along with the data that is included in each import routine:
Option #
Description Data included
1 Update Wetland Areas: "WETLAND_ID","INFOCURRENTSIZE”
Wetland ID, wetland size (in acres)
2 date Gen‘l Information: "Wetland_id","InfoCityName","InfoCityName2","InfoSubwatershed"
Wetland ID, first city, second city
(leave blank if only in one city),
subwatershed
3 Update GIS Fields: "Wetland_ID","Q19_val","Q21_val","Q58_val","Q60_val","Q51_val","Q04_val","Q35_val","6_val”
Wetland ID, Questions # 19, 21, 58,
60, 51, 4, 35, 36
For each Wetland ID included in an import file, the data included in each import routine will be
overwritten over any existing data in the database. If a blank is provided for any of the data, a
null value will be entered for that question within that Wetland ID record.
5.5.4 COPY WETLAND TO NEW WETLAND / COPY WETLAND RECORD
This time-saver feature allows all the ratings of one wetland assessment record to be copied into
the record of another. This feature is most useful during inventory situations for wetlands with
similar morphological characteristics, location, land uses, and hydrologic features. The receiving
record must be reviewed with care to ensure that important, but subtle differences are not
overlooked. It is recommended that you use this only with wetlands that are in close proximity to
each other on the landscape.
If you already have Wetland Names entered for both the ―to be copied‖ site and the duplicate
wetland, use the simple <Copy Wetland> button. Otherwise, <Copy Wetland to New Wetland>
allows you to create a new wetland record ―on the fly‖.
5.5.5 UPDATE FUNCTIONAL SUMMARY
This feature is used to update added data to the report tables during a working session. Wetland
subsets can be chosen here similar to the reporting feature. Update Functional Summary must be

MnRAM Comprehensive Guidance 11/18/2010 39
run during a working session prior to running reports, otherwise, data entered during the
working session will not appear in the reports.
5.5.6 RUN SUMMARY REPORT
Two reports can be generated:
1) Functional Assessment Summary (this is a two-page report).
2) Wetland Community Summary.
Because wetland vegetative community information can be extensive and is often used for
different purposes, this report is separate from the functional rating report.
You can choose to view the ratings as either Numeric (i.e. 0.64, 1.0) or Text (i.e. high, medium,
low). Choosing the numeric view allows you to see how close a rating may have been to the
next category (a rating of 0.65, for example, will result in a Medium rating, whereas a 0.66 is
High).
Each report can be run with either all data (every site will appear) or filtered by subset
categories: Complete/Incomplete, Project, City, and Subwatershed.
If you want to be able to see the results from a group of sites, name all the sites with the same
Project Name (i.e. ―Timber Woods Development‖). If you want the results of one site, choose a
unique Project Name for that site (i.e. ―Haldeman Driveway Project‖).
For a comprehensive report showing both vegetative and functional rating information together
from a single site, with both numeric and text ratings, press the <Print Summary> button on the
Summary tab. You can print the report that appears onscreen.
5.5.7 INDIVIDUAL SITE REPORT
The last report button on the General Information tab will produce a report that shows the
responses to most questions. If you need to show this in a report or want to compare input
between two or more sites, this report provides a concise record of the entries. It does not
provide a summary of the results, however: to get a record of the functional ratings, go the
Summary tab and choose <Print Summary>.

MnRAM Comprehensive Guidance 11/18/2010 40
5.6 Using the Data—Management Classification
Once wetlands have been assessed, the data stored in the MnRAM database may be used for
local planning, regulatory determinations, or other general use. Wetland Management
Classification is intended to give local resource managers a framework for using the wetland data
to make land use and wetland management decisions. The Wetland Management Classification
system provides a scientifically based approach to ranking wetland functions. A document
explaining the Management Classification system is available at the BWSR website. The last
two pages show the flow charts that have been programmed into the MnRAM database.
There are two prepared options for sorting wetlands, Basic and Increased Protection. The results
of both sort options are given at the end of the Summary page.
Also shown are the functions and ratings that caused the wetland to fall into the management
category shown. Understanding how management classification works is easiest using the visual
aide of the flowcharts.

MnRAM Comprehensive Guidance 11/18/2010 41
6.0 Functional Rating Formulas
GENERAL NOTE: Some questions are not applicable to particular wetlands and will be scored
N/A. In these cases, rather than count N/A as zero, an alternate equation is provided that
eliminates the question from the formula altogether. Because not every question has N/A as an
option, formulas that do not include N/A-option questions have only one configuration.
Formulas with a ―reverse rating‖ (marked as ―R‖) take the actual response and ―flip‖ its value for
the calculation, so that a question response of ―A‖ high (value of 1.0) will be calculated as low
(value of 0.1). In such a formula, medium ratings stay medium.
6.1 VEGETATIVE DIVERSITY/INTEGRITY
Table 3: Vegetative Diversity/Integrity Summary
The functional rating is based primarily on the diversity of vegetation within the wetland in
comparison to an undisturbed condition for that wetland type. An exceptional rating results from
one of the following conditions: 1) highly diverse wetlands with virtually no non-native species,
2) rare or critically impaired wetland communities in the watershed, or 3) the presence or
previous sighting of rare, threatened, or endangered plant species. A high rating indicates the
presence of diverse, native wetland species and a lack of non-native or invasive species.
Wetlands that rate low are primarily dominated by non-native and/or invasive species.
This table may be used when calculating Vegetative Diversity/Integrity Functional Index
manually. It shows four options for calculating and presenting floristic data. If you are entering
data directly into the MnRAM database, this table does not apply.
3A
Proportion
of Wetland
3B
Individual
Community
Scores
3C
Highest
Quality
3D
Non-Weighted
Average
3E
Weighted
Average
Community #1 T A A A
Community #2 U B B B
Community #3 V C C C
Community #4 W D D D
Community #5 X E E E
Community #6 Y F F F
Community #7 Z G G G
Wetland
Rating Value
1.0 Highest
Value
(A+B+C+D+E
+F+G)/7 =
Ave.
(A*T)+(B*U
)+(C*V)+(D
*W)+(E*X)+
(F*Y)+(G*Z
) = Wt. Ave.
If any questions #4-6 are answered yes and/or if any of the Special Features b, d, or i have been selected,
enter Exceptional for the functional index. If not, compute the contribution to vegetative diversity and
integrity by each plant community by doing the following: multiply the ranking for each community

MnRAM Comprehensive Guidance 11/18/2010 42
(Question #3b) by its total proportion in Question 3a (percent of total). Then, the functional index for the
entire wetland can be calculated four ways (as follows) and should be utilized according to the scope of
the project:
3b) Individual Community Scores: maintain raw data as recorded.
3c) Highest Quality Community: report the highest-functioning community.
3d) Non-Weighted Average Quality of all Communities: straight average
3e) Weighted Average Quality Based on Percentage of Each Community: multiply each
community rating by its percentage, then add all together.
Vegetative Diversity/ Integrity
3a.
Proportion
of Wetland
3b.
Individual
Community
Scores
3c. Highest
Rated
Community
Quality
3d. Non-
Weighted
Average
3e. Weighted
Average
Community #1 T A
If Spec. Features b, d or i are checked then rate
Exceptional (2);
if either question 4, 5, or 6 are Yes, then rate
Exceptional (2); else:
Community #2 U B
Community #3 V C
Community #4 W D
Community #5 X E
Community #6 Y F
Community #7 Z G
Overall
Wetland Value
Rating
1.0 : Highest
Value of A-G
: (A+B+C+
D+E+F+G)/7
= Ave.
:(A*T)+(B*
U)+(C*V)+
(D*W)+(E*
X)+(F*Y)+(
G*Z) = Wt.
Ave.

MnRAM Comprehensive Guidance 11/18/2010 43
6.2 MAINTENANCE OF CHARACTERISTIC HYDROLOGIC REGIME
A wetland‘s hydrologic regime or hydroperiod is the seasonal pattern of the wetland water level
that is like a hydrologic signature of each wetland type. It defines the rise and fall of a wetland‘s
surface and subsurface water. The constancy of the seasonal patterns from year to year ensures a
reasonable stability for the wetland24. The ability of the wetland to maintain a hydrologic regime
characteristic of the wetland type is evaluated based upon wetland soil and vegetation
characteristics, land use within the wetland, land use within the upland watershed contributing to
the wetland, and wetland outlet configuration. Maintenance of the hydrologic regime is important
for maintaining a characteristic vegetative community, and is closely associated with other
functions including flood attenuation, water quality and groundwater interaction.
Measures the degree of human alteration of the wetland hydrology, either by outlet control or by
altering immediate watershed conditions. Each parameter is weighted equally.
MnRAM # Excel # Variable Description Type of Interaction 13 E17 Outlet—natural hydrologic regime Controlling
14 E18 Dominant upland land use Compensatory
15 E19 Soil condition/wetland Compensatory
20 R F24 Stormwater runoff/pretreatment-Reversed Compensatory
Hydrologic Regime Index = (13+14+15+20reverse)/4
6.3 FLOOD AND STORMWATER STORAGE/ATTENUATION
A wetland‘s ability to provide flood storage and/or flood wave attenuation is dependent on many
characteristics of the wetland and contributing watershed. Characteristics of the subwatershed
that affect the wetlands ability to provide flood storage and attenuation include: soil types, land
use and resulting stormwater runoff volume, sediment delivery from the subwatershed, and the
abundance of wetlands and waterbodies in the subwatershed. Wetland characteristics which
affect the wetland‘s ability to store and or attenuate stormwater include: condition of wetland
soils; presence, extent, and type of wetland vegetation; presence and connectivity of channels;
and most importantly outlet configuration. Higher rated wetlands will have an unaltered or
restricted outlet, undisturbed wetland soils, dense emergent vegetation without channels, a high
proportion of impervious surfaces in the subwatershed, large runoff volumes, clayey upland
soils, and few wetlands present within the subwatershed.
This formula is based on the Surface Water Storage Functional Capacity Index scoring concept and
equation25
. The formula was altered with the addition of three surface flow characteristics and two
stormwater runoff parameters (Stormwater Runoff Quality/Quantity and Subwatershed Wetland Density)
along with the removal of two parameters (Soil Porosity and Subsurface Outlet, which is already
characterized in another parameter). This index is comprised of 5 primary processes, which are weighted
equally; included in each major process are one to three characteristics that equally contribute to that
process.
24
Mitsch and Gosselink, 2000 25
Lee et al., 1997

MnRAM Comprehensive Guidance 11/18/2010 44
1. Outlet Characteristics: Outlet characteristics
2. Upland Watershed: Upland land use, Upland soils,
3. Wetland Condition/Land Use: Wetland land use, sediment delivery
4. Runoff Characteristics: Stormwater runoff quality/quantity, subwatershed wetland
density
5. Surface Flow Characteristics: Flow-through emergent vegetation density, surface flow
characteristics
Flood and Stormwater Storage Index Computation:
Entire Formula: Outlet for flood retention{12} + (Dominant upland use{14reversed}+ Upland soils{19})/2
+ (Soil condition{15} + Sediment delivery{18})/2 + Stormwater runoff pretreat&det{20} +
Subwatershed wetland density{21})/2 + (Percent emergent vegetative cover{16} + Flow-through
emergent vegetative roughness{17} + Channels/sheet flow{22})/3)/5.
1. If 12=0, then: ((14 reversed +19)/2+(15+18)/2+(20+21)/2+(16+17+22)/3)/4
2. If 12>0, then: (12+(14 reversed +19)/2+(15+18)/2+(20+21)/2+(16+17+22)/3)/5
Flood and Stormwater Storage/Attenuation Variables
MnRAM # Excel # Variable Description Type of Interaction 12 E16 Outlet—flood attenuation Controlling—optional
14-R F18 Dominant upland land use—reversed Compensatory
19 E23 Upland soils Compensatory
15 E19 Soil condition Compensatory
18 E22 Sediment delivery Compensatory
20 E24 Stormwater pretreatment &detention Compensatory 21 E25 Subwatershed wetland density Compensatory 16 F20 Emergent vegetation % cover Comp.—optional
17 E21 Emergent vegetation flood resistance Comp.—optional
22 E26 Channels/sheet flow Compensatory
No changes to the
formula are
necessary if 16=0.

MnRAM Comprehensive Guidance 11/18/2010 45
6.4 DOWNSTREAM WATER QUALITY PROTECTION
This rates the wetland‘s ability and opportunity to protect valuable downstream resources.
Valuable downstream resources include recreational waters (i.e. lakes, streams, rivers, creeks,
etc) and potable water supplies. The level of functioning is determined based on runoff
characteristics, sedimentation processes, nutrient cycling, and the presence and location of
significant downstream water resources. Runoff characteristics that are evaluated include: land
use and soils in the upstream watershed, the stormwater delivery system to the wetland, and
sediment delivery characteristics. The ability of the wetland to remove sediment from
stormwater is determined by emergent vegetation and overland flow characteristics. A high
nutrient removal rating indicates dense vegetation and sheet flow to maximize nutrient uptake
and residence time within the wetland. The opportunity for a wetland to protect a valuable water
resource diminishes with distance from the wetland so wetlands with valuable waters within 0.5
miles downstream have the greatest opportunity to provide protection, as do those that receive
more (and less-treated) runoff.
Compute Functional Index for Downstream Water Quality Protection This functional index computation was derived from a combination of Nutrient Cycling and Retention of
Particulates functions in the HGM Prairie Pothole draft guidebook54
with the downstream sensitivity
concept from The Minnesota Wetland Evaluation Methodology. Three major processes make up equal
portions of the Downstream Water Quality Protection function26
with a measure of opportunity to protect
downstream resources; each process is comprised of two to four observable parameters.
1. Rate, Quantity, and Quality of Runoff to the Wetland: this is characterized by the conditions
in the upstream watershed; both land use and soils, that affect the sediment and nutrient loads to
the wetland, and by the existing storm water delivery system to the wetland (Upland watershed
conditions, storm water runoff, evidence of sediment delivery, and upland buffer each comprise
1/16 of the entire downstream water quality functional index based on their contribution to
sediment removal).
2. Sedimentation: this is characterized by the presence of flow-through emergent vegetation density
and by the overland flow characteristics within the wetland. A wetland with primarily sheet flow
through the wetland and dense emergent vegetation density will allow sediment to drop out more
effectively than a wetland with channel flow and no vegetation (When all parameters are
applicable; emergent vegetative density and overland flow characteristics each make up 1/8 of the
total downstream water quality functional index based on their contribution to sediment removal).
3. Nutrient Uptake: this is characterized by the outlet configuration and vegetative characteristics.
A wetland with long water retention times has more capacity to remove nutrients from the water
column via physical and biological processes. Vegetation slows floodwaters by creating frictional
drag in proportion to stem density which allows sediment particles to settle out, thereby
improving the water quality for downstream uses (Outlet characteristics and vegetative density
each make up 1/8 of the total downstream water quality functional index based on their
contribution to nutrient uptake).
4. Downstream Sensitivity: if the wetland contributes to the maintenance of water quality within
one-half mile of a recreational water body or potable water supply source downstream, it operates
at a higher functioning level than a similar wetland farther from or without significant
26
Derived from a combination of Nutrient Cycling and Retention of Particulates functions in the HGM Prairie
Pothole draft guidebook (Lee et al., 1997) with the downstream sensitivity concept from The Minnesota Wetland
Evaluation Methodology.

MnRAM Comprehensive Guidance 11/18/2010 46
downstream water resources (This factor accounts for ¼ of the total downstream water quality
functional index).
Downstream Water Quality Functional Index Computations:
1. If 12=0, then: (14+20+18+(23+24+26)/3+(16+17)/2+27)/6
2. If 12>0, then: (14+20+18+(23+24+26)/3+(16+17)/2+27+12)/7
Entire Formula:
(Dominant upland land use{14} + Stormwater runoff pretreatment & detention{20} + Sediment delivery
{18} + (Upland buffer width{23WQ} + Upland buffer vegetative cover{24} + Upland buffer slope {26})/3
+ (Flow-through %emergent vegetative cover{16} + Flow-through emergent vegetative roughness{17})/2
+ Downstream sensitivity{27}+ Outlet for flood{12})/7
Downstream Water Quality Variables
MnRAM # Excel # Variable Description Type of
Interaction 14 E18 Dominant upland land use Controlling
20 E24 Stormwater runoff pretreatment & detention Controlling
18 E22 Sediment delivery Controlling
23 G27 Upland buffer width—water quality valuation Comp.
24 G28 Upland area management Comp.
26 G34 Upland area slope Comp.
16 F20 Emergent vegetation (% cover) Comp.—optional
17 E21 Emergent vegetation (roughness coefficient) Comp.—optional
27 E39 Downstream sensitivity Comp.
12 E16 Outlet for flood Controlling--optional
6.5 MAINTENANCE OF WETLAND WATER QUALITY
The sustainability of a wetland is partially driven by the quality and quantity of stormwater
runoff entering the wetland. The ability of the wetland to sustain its characteristics is evaluated
based on characteristics of the contributing subwatershed and indicators within the wetland.
Subwatershed conditions which affect the wetland‘s sustainability in relation to water quality
impacts include: upland land use; sediment delivery characteristics to the wetland; stormwater
runoff volumes and rates; and the extent, condition, and width of upland buffer. Indicators of
nutrient loading to the wetland indicate that a diverse wetland may not be sustainable. Indicators
that a wetland has been affected by nutrient loading include the presence of monotypic
vegetation and/or algal blooms.
This functional index was derived from a combination of sources including MNRAM, HGM,
WEM, WET, and experiences of the project team. The sustainability of a wetland is partially
driven by the quality and quantity of stormwater runoff entering the wetland. The ability of the
wetland to sustain its characteristics is evaluated based on characteristics of the contributing
subwatershed and indicators within the wetland. Subwatershed conditions which affect the
wetland‘s sustainability in relation to water quality impacts include: upland land use; sediment
delivery characteristics to the wetland; stormwater runoff volumes and rates; and the extent,
No changes to the
formula are
necessary if 16=0.

MnRAM Comprehensive Guidance 11/18/2010 47
condition, and width of upland buffer. Indicators of nutrient loading to the wetland indicate that a
diverse wetland may not be sustainable. Indicators that a wetland has been affected by nutrient
loading include the presence of monotypic vegetation and/or algal blooms.
Wetland Water Quality Functional Index Computation:
(3e*2+14+20reversed +(23+24+26)/3+18+28)/7
Entire Formula:
(Vegetative Diversity/Integrity{3e*2} + Dominant upland land use{14} + Stormwater runoff
pretreatment & detention{20reversed} + (Upland buffer width{23WQ} + Upland buffer vegetative cover {24}
+ Upland buffer slope {26})/3 + Sediment delivery {18})/2 + Nutrient loading {28})/7
Wetland Water Quality Variables
MnRAM # Excel # Variable Description Type of
Interaction 3e D6*2 Vegetative Diversity/Integrity Contributing
14 E18 Dominant upland land use Contributing
20 R F24 Stormwater runoff pretreatment and detention—RR Contributing
23 G27 Upland buffer width—water quality valuation Contributing
24 G28 Upland area management Contributing
26 G34 Upland area slope Contributing
18 E22 Sediment delivery Contributing
28 E40 Nutrient loading Contributing
This functional index was derived from a combination of sources including MNRAM, HGM, WEM,
WET, and experiences of the project team. The sustainability of a wetland is partially driven by the
quality and quantity of stormwater runoff entering the wetland. The ability of the wetland to sustain its
characteristics is evaluated based on characteristics of the contributing subwatershed and indicators within
the wetland. Subwatershed conditions which affect the wetland‘s sustainability in relation to water quality
impacts include: upland land use; sediment delivery characteristics to the wetland; stormwater runoff
volumes and rates; and the extent, condition, and width of upland buffer. Indicators of nutrient loading to
the wetland indicate that a diverse wetland may not be sustainable. Indicators that a wetland has been
affected by nutrient loading include the presence of monotypic vegetation and/or algal blooms.
6.6 SHORELINE PROTECTION
Shoreline protection is evaluated only for those wetlands adjacent to lakes, streams, or deepwater
habitats. The function is rated based on the wetlands opportunity to protect the shoreline; i.e.
wetlands located in areas frequently experiencing large waves and high currents have the best
opportunity to protect the shore. In addition, shore areas composed of sands and loams with little
vegetation or shallow-rooted vegetation will benefit the most from shoreline wetlands. The
wetland width, vegetative cover, and resistance of the vegetation to erosive forces determine the
wetland‘s ability to protect the shoreline.

MnRAM Comprehensive Guidance 11/18/2010 48
Each of the five parameters contributes equally27: based primarily on the characteristics
presented in WEM with a simple, straightforward computation of the index assuming all
characteristics contribute equally.
MnRAM # Excel # Variable Description Type of Interaction 29 E41 Shoreline? Controlling
30 E42 Rooted shoreline vegetation (% cover) Contributing
31 E43 Wetland width (average) Contributing
32 E44 Emergent vegetation erosion resistance Contributing
33 E45 Shoreline erosion potential Contributing
34 E46 Bank protection ability Contributing
Shoreline Protection Functional Index Computation:
If 29=1, then:
Shoreline Protection Index = (30+31+32+33+34)/5
Entire Formula:
(Rooted shoreline vegetation {30} + Average shoreline wetland width {31} + Emergent vegetation
erosion resistance {32} + (Shoreline erosion potential {33} + Bank protection ability {34})/5
6.7 MAINTENANCE OF CHARACTERISTIC WILDLIFE HABITAT STRUCTURE
The ability of a wetland to support various wildlife species is difficult to determine due to the
specific requirements of the many wildlife species that utilize wetlands. This function
determines the value of a wetland for wildlife in a more general sense, and not based on any
specific species. The characteristics evaluated to determine the wildlife habitat function include:
vegetative quality, outlet characteristics (which control hydrologic regime), upland land use,
wetland soil type and conditions, water quality of storm water runoff entering the wetland,
upland buffer extent, condition, and diversity; the interspersion of wetlands in the area; barriers
to wildlife movement; wetland size; vegetative and community interspersion within the wetland;
and amphibian breeding potential and overwintering habitat.
Thirteen parameters are weighed equally as described below; vegetative quality is weighted
double the other factors. The questions are borrowed or modified from MNRAM, WET, WEM,
and HGM methodologies, combined to provide a measure of wildlife habitat in general, not
focusing on any particular species.
If Rare Wildlife (35) or Rare Natural Community (36) are true, then this Index is Exceptional.
If Special Features d, g, or j are checked, then this Index is Exceptional, otherwise, follow
conditions below:
If 37=0 and 38=0 and 39=0 [Vegetation (37) and Community interspersion (38) and Wetland Detritus
(39) are all n/a], then:
(3e*2+40+41+(23+24+25)/3+13+ 20)/7
If 38=0 and 39=0 [Community interspersion (38) and Wetland Detritus (39) are n/a], then:
(3e*2+37+40+41+(23+24+25)/3+ 13+20)/8
27
Based primarily on the characteristics presented in WEM.

MnRAM Comprehensive Guidance 11/18/2010 49
If 37=0 and 39=0 [Vegetation (37) and Wetland Detritus (39) are n/a], then:
(3e*2+38+40+41+(23+24+25)/3+ 13+20)/8
If 37=0 and 38=0 [Vegetation (37) and Community interspersion (38) are n/a], then:
(3e*2+39+40+41+(23+24+25)/3+ 13+20)/8
If 39=0 [Wetland Detritus (39) is n/a], then:
(3e*2+37+38+40+41+(23+24+25)/3+13+20)/9
If 38=0 [Community interspersion (38) is n/a], then:
(3e*2+39+37+40+41+(23+24+25)/3+13+20)/9
If 37=0 [Vegetation interspersion (37) is n/a], then:
(3e*2+39+38+40+41+(23+24+25)/3+13+20)/9
If 37>0 and 38>0 and 39>0, then:
(3e*2+39+37+38+40+41+(23+24+25)/3+13+20)/10
Entire Equation: (Vegetative Diversity/Integrity{3e*2} + Wetland Detritus {39} + Vegetation Interspersion {37} +
Community Interspersion {38} + Wetland Interspersion {40} + Wildlife Barriers {41} + (Upland buffer
width {23wildlife value} + Upland Area Management{24} + Upland area diversity {25})/3 + Outlet natural
hydrologic regime {13}+ Stormwater runoff pretreatment and detention 20reversed)/10
MnRAM # Excel # Variable Description Type of Interaction 41 E53 Wildlife barriers Controlling
3e D6 Vegetative Ranking (communities‘ weighted average) Compensatory
39 E51 Wetland detritus (n/a) Contributing
23 I27 Upland buffer average width—wildlife valuation Contributing
24 G28 Upland area management Contributing
25 G31 Upland area diversity Contributing
13 E17 Outlet natural hydrologic regime Contributing
20 R F24 Stormwater runoff pretreatment & detention—reversed Contributing
37 F49 Vegetation interspersion (n/a) Contributing
38 F50 Community interspersion (n/a) Contributing
40 E52 Wetland interspersion Contributing
6.8 MAINTENANCE OF CHARACTERISTIC FISH HABITAT
The ability of the wetland to support native fish populations is determined by structural factors
within the wetland as well as water quality contributions from upland factors. Wetlands rated
High are lacustrine or riverine and provide spawning/nursery habitat, or refuge for native species
(included but not limited to game fish). Wetlands rated Low for fish habitat do not have a direct
hydrologic connection to a waterbody with a native fishery or have poor water quality.
MnRAM # Excel # Variable Description Type of Interaction 46 E58*2 Fish habitat quality Controlling
29 D41 Fringe wetland? Contributing
24 G28 Adjacent area management Compensatory

MnRAM Comprehensive Guidance 11/18/2010 50
18 E22 Sediment delivery Compensatory
20 R F24 Storm water runoff—reversed Compensatory
28 E40 Nutrient load Compensatory
30 E42 Percent cover Compensatory
31 E43 Wetland shoreline width Compensatory
33 (R) F45 Shoreline erosion potential Compensatory
Fish Habitat Functional Index Computation:
If Special Features a or g are checked, then Fishery Habitat Index = Exceptional.
If 46=0, then Fishery Habitat = N/A
If 29=0, Fishery Habitat Index = [(46*2)+24+18+20reversed +28]/6
If 29>0, Fishery Habitat Index = [(46*2)+24+18+20 reversed +28+30+31+33(R)]/9
6.9 MAINTENANCE OF CHARACT. AMPHIBIAN HABITAT FOR BREEDING/OVERWINTERING
The characteristic ability of a wetland to support various amphibian species is difficult to
determine due to the specific requirements of the many amphibian species that depend on
wetlands. This function determines the value of a wetland for amphibians in general, not based
on specific species. An adequate wetland hydroperiod and the presence or absence of predatory
fish are considered to be limiting variables for this function. In general, wetlands must remain
inundated until early to mid-June to allow the larval stages to metamorphose into adults.
Because many amphibians are partly terrestrial, the characteristics evaluated to determine the
amphibian habitat function include numerous hydrology and terrestrial measures. The
characteristics evaluated include: upland land use, upland buffer width, water quality of storm
water runoff entering the wetland, barriers to wildlife movement, and amphibian breeding
potential and overwintering habitat.
An adequate wetland hydroperiod (Question 42) is considered to be the primary limiting variable
for this functional index. If the hydroperiod is insufficient for breeding, the wetland rating for
amphibian use will be Not Sufficient. The status of predatory fish in the wetland (Q.43) is a
secondary limiting factor to the final rating; the lowest rating for this variable, however, is 0.1
(Low), rather than zero (Not Sufficient).
Amphibians‘ ability to use a particular wetland for over wintering is a contributing factor in
rating the wetland‘s functional index (Q.44). Because most amphibians are partly terrestrial, the
extent of upland buffer habitat surrounding the wetland (Q.23) is an important habitat
component28
and is weighted by a factor of two. Question 14 (Upland Land Use) is also
included as an indicator of the quality of the surrounding upland habitat56
. Unnatural
fluctuations in water depth in wetlands from conducted storm water runoff can impair
reproductive success in amphibians, which often attach their eggs to stems of wetland vegetation,
e.g., salamanders, tree frogs, green frogs, and wood frogs29
. Extreme water level fluctuations
during winter may also cause mortality in overwintering reptiles and amphibians30
. Thus,
28
Knutson et al., 2000 29
Richter and Azous, 1995 30
Hall and Cuthbert, 2000

MnRAM Comprehensive Guidance 11/18/2010 51
Question 20 is included in the formula, with a reverse rating. Question 41 (Barriers) is included
because access to and from the wetland by amphibians is an important factor in habitat quality31
.
Amphibian Habitat Functional Index Computation:
If 42=0, then N/A
Otherwise: Amphibian Habitat Index = (43) * [( 44 + 2*23wildlife + 14 + 41 + 20 reversed)/6]
Entire Formula:
If Amphibian Breeding Potential-Hydroperiod {42} is applicable, then: (Amphibian Breeding Potential-
Predator Fish {43}) * {[(Amphibian Overwintering Habitat {44}+ 2*Upland Buffer Width (23)Wildlife +
Dominant Upland Land Use {14} + Barriers {41} + Stormwater Input {20reverse}]/6}
Amphibian Habitat Variables
MnRAM
#
Excel
# Variable Description Type of
Interaction 42 D54 Amphibian breeding potential—hydroperiod Controlling
43 D55 Amphibian breeding potential—fish presence Controlling
44 E56 Amphibian overwintering habitat Compensatory
23 I27 Upland buffer width Compensatory
41 E53 Wildlife barriers Compensatory
14 E18 Dominant upland land use Compensatory
20 F24 Stormwater runoff pretreatment & detention—RR Compensatory
6.10 AESTHETICS/RECREATION/EDUCATION/CULTURAL/SCIENCE
The aesthetics/recreation/education/cultural and science function and value of each wetland is
evaluated based on the wetland‘s visibility, accessibility, evidence of recreational uses, evidence
of human influences (e.g. noise and air pollution) and any known educational or cultural
purposes. Accessibility of the wetland is key to its aesthetic or educational appreciation. While
dependent on accessibility, a wetland's functional level could be evaluated by the view it
provides observers. Distinct contrast between the wetland and surrounding upland may increase
its perceived importance. Also, diversity of wetland types or vegetation communities may
increase its functional level as compared to monotypic open water or vegetation. Excess negative
human influence on the wetland is counted double in the formula.
All questions contribute equally to the overall index.
MnRAM # Excel # Variable Description Type of Interaction 48 E60 Rare educational opportunity Controlling
49 E61 Wetland visibility Compensatory
50 E62 Proximity to population Compensatory
51 E63 Public ownership Compensatory
52 E64 Public access Compensatory
53 E65 Human influence—wetland Compensatory
31
Knutson, et al., 1999; Findlay and Bourdages, 2000; Semlitsch, 2000.

MnRAM Comprehensive Guidance 11/18/2010 52
54 E66 Human influence—viewshed Compensatory
55 E67 Spatial buffer Compensatory
56 E68 Recreational activities in wetland Compensatory
Aesthetics/Recreation/Education/Cultural/Science Functional Index Computations:
If Special Features c, h, or u is checked32
, or
If 48=1, then Index = Exceptional;
If 53=0.1 (Low), then = (50+51+52+2*53+54+55+56)/8
If 53>0.1, then = (49+50+51+52+53+54+55+56)/8
Entire Formula
(Wetland Visibility {49} + Proximity to Population {50} + Public Ownership {51} + Public Access {52}
+ Human Influence - Wetland {53} + Human Influence - Viewshed {54} + Spatial Buffer {55} +
Recreational Activities in Wetland {56})/8
6.11 COMMERCIAL USES
This question considers the nature of any commercially-valuable use of the wetland and
requires the assessor to consider how such use may be a detriment to the sustainability of the
wetland. Some row crops can be planted in Type 1 wetlands after spring flooding has ceased
and still have adequate time to grow to maturity. This non-wetland-dependent agricultural
use of wetlands may include hay, pasture/grazing, or row crops such as soybeans or corn.
Wetland-dependent crops include wild rice and cranberries, which rely on the wetland
hydrology for part of their life cycle.
Sustainable uses of the wetland would not require modifying a natural wetland. Products in
this category would include collection of botanical products, wet native grass seed, floral
decorations, wild rice, black spruce, white cedar, and tamarack. Sustainable uses may require
modification of the natural hydrology, such as for wetland-dependent crops (rice,
cranberries). Haying and grazing can be less intrusive agricultural activities utilized more or
less casually when hydrologic conditions permit; light pasture and occasional haying would
be considered more or less sustainable. Like peat-mining, cropping is an unsustainable use of
the wetland as it is results in severe alterations of wetland characteristics (soil, vegetation,
hydrology).
MnRAM
# Excel # Variable Description
Type of
Interaction
57 E69 Commercial crop—hydrologic impact Controlling
32 c = Designated scientific and natural area; h = Archeologic or historic site designated by the State Historic Preservation Office; u = State or
Federal designated wilderness area.

MnRAM Comprehensive Guidance 11/18/2010 53
Commercial Uses Functional Index = 57
6.12 GROUND-WATER INTERACTION
The ground water interaction function is the most difficult to assess. Here the most likely type of
ground water interaction is determined, i.e. recharge or discharge, or a combination. In many
cases, a wetland will exhibit both recharge and discharge characteristics, however one is usually
more dominant. Several wetland and watershed characteristics are evaluated to determine the
likely interaction including: wetland soil type, upland land use, upland soil types and wetland
size, wetland hydroperiod, wetland outlet characteristics, and topographic relief.
The purpose of this function is strictly to determine the likelihood of the appropriate ground-
water interaction based on observable characteristics of the wetland and watershed. The
significance of ground water as a component of the wetland water budget is the most difficult
functional characteristic to determine without large quantities of detailed hydrologic and
geologic information. The following methodology takes the most easily observable and distinct
measures of recharge/discharge relationships from the Wetland Evaluation Technique33 and the
Hydrogeomorphic Assessment Methodology34. In many wetlands, surface water and ground water
both make significant contributions to the water budget, but occasionally recharge or discharge is
dominant. The goal here is to identify the dominant ground-water interaction (if there is one) to
help guide future management and provide an indication when additional information may be
warranted.
If 5 or 6 of questions 58-63 are answered the same, this indicates a strong likelihood that
the most frequently stated interaction exerts the primary influence on the wetland.
If 3-4 questions are answered the same, then the wetland is likely influenced by a
combination of both recharge and discharge interactions (i.e. both types of ground water
interaction are likely to be present at some point during most years).
58. Wetland Soils – from HGM system functional assessments and Novitzki
59. Subwatershed Land Use/Imperviousness – taken from WET Volume I
60. Wetland Size and Upland Soils – taken from WET Volume I and HGM
61. Wetland Hydrologic Regime– taken from WET Volume I and HGM
62. Inlet/Outlet Configuration – taken from WET Volume I and HGM
63. Upland Topographic Relief – taken from WET Volume I
Special Concerns for Recharge Wetlands
Wherever ground water recharge is indicated as the primary interaction and the wetland lies
within a sensitive ground water area (Special Feature Question q), a contribution area to a
public water supply, or a wellhead protection area (Special Feature Question r), it should be
recorded as Exceptional for the ground water/wetland function.
33
Adamus, et al., 1987 34
Magee and Hollands, 1998

MnRAM Comprehensive Guidance 11/18/2010 54
6.13 WETLAND RESTORATION POTENTIAL
The potential for wetland restoration is determined based on the ease with which the wetland
could be restored, the number of landowners within the historic wetland basin, the size of the
potential restoration area, the potential for establishing buffer areas or water quality ponding, and
the extent and type of hydrologic alteration. Each variable uses the High, Medium, Low rating
rather than raw numbers—see MnRAM for individual ranges.
MnRAM
#
Excel
# Variable Description
Type of
Interaction 64 D79 Wetland Restoration Potential Controlling
65 F80 Number of Landowners Affected Contributing
21 E25 Subwatershed Wetland Density Contributing
66b F82 Total Wetland Restored Size (Potential) Contributing
66c F83 Calculated potential new wetland area Contributing
67 F84 Potential Buffer Width Contributing
68 F85 Likelihood of Restoration Success Contributing
If 64="Yes", then Wetland Restoration Potential = (65+21+66b+66c+67+68)/6,
Otherwise, if 64="No" then "N/A"
Entire Formula
(Landowners Affected by Restoration (65)+Subwatershed Wetland Density (21)+ Wetland
Restoration Size (66b)+Proportion of Wetland Drained (66c)+Potential Buffer Width
(67)+Likelihood of Restoration Success (68))/6
6.14 WETLAND SENSITIVITY TO STORMWATER INPUT AND URBAN DEVELOPMENT
The sensitivity of the wetland to stormwater and urban development is determined based on
guidance within the Storm-Water and Wetlands: Planning and Evaluation Guidelines for
Addressing Potential Impacts of Urban Storm-Water and Snow-Melt Runoff on Wetlands, State
of Minnesota Storm-Water Advisory Group, June 1997. The database pulls this rating directly
from the Plant Community entry. If any of the following plant communities are present, this
value will always be Exceptional: 3B, 4A, 4B, 7A,7B, 10A,13A,14A, 16B.
Use habitat proportions from Vegetative Integrity section and enter into a formula to
compute answer according to the following criteria35.
Exceptional = Sedge meadows, open and coniferous bogs, calcareous fens, low prairies, wet to
wet-mesic prairies, coniferous swamps, lowland hardwood swamps, or seasonally
flooded basins.
A = Shrub-carrs, alder thickets, diverse fresh wet meadows dominated by native species,
diverse shallow and deep marshes, and diverse shallow, open water communities.
B = Floodplain forests, fresh wet meadows dominated by reed canary grass, shallow and deep
marshes dominated by cattail, reed canary grass, giant reed or purple loosestrife, and
shallow, open water communities with low to moderate vegetative diversity.
C = Gravel pits, cultivated hydric soils, or dredge/fill disposal sites.
35
Taken directly from State of Minnesota Storm-Water Advisory Group, 1997.

MnRAM Comprehensive Guidance 11/18/2010 55
6.15 ADDITIONAL STORMWATER TREATMENT NEEDS
This rates the sustainability of the wetland with regard to stormwater discharges to the wetland.
The need for additional stormwater treatment prior to discharge to the wetland is rated based on
the overall rating for Maintenance of Wetland Water Quality. If a wetland is severely degraded
by stormwater inputs, the rating will be low, since a diverse, high quality wetland will not be
sustainable.
Use functional rating for Maintenance of Wetland Water Quality (MWWQ) as follows (this
index is rated strictly from the measure of the water quality in the wetland and the sustainability,
i.e. if the water quality in the wetland is low, additional stormwater treatment is needed to protect
the wetland and the rating is low):
Use Value for Maintenance of Wetland Water Quality Index (D76, Excel spreadsheet) and apply
to criteria below.
A = Maintenance of Wetland Water Quality Index >0.66 (no additional treatment needed)
B = 0.33 < Maintenance of Wetland Water Quality Index < 0.66 (sediment removal needed)
C = Maintenance of Wetland Water Quality Index < 0.33 (sediment and nutrient removal
needed)

MnRAM Comprehensive Guidance 11/18/2010 56
7.0 References
Most reference material will be available at the Board of Water & Soil Resources library.
Please report errors or omissions to the BWSR MnRAM contact person.
Adamus, P.R., L.T. Stockwell, E.J. Clairain, Jr., M. E. Morrow, L.P. Rozas, R.D. Smith, 1991. Wetland Evaluation
Technique: Volume I , Literature Review and Evaluation Rationale. US Army Corps of Engineers
Waterways Experiment Station.
Adamus, P.R., ARA, Inc, E.J. Clairain, Jr., R.D. Smith, and R.E. Young, 1987. Wetland Evaluation Technique
(WET) Volume II , Methodology, Operational Draft. Department of the Army, Vicksburg, MS.
Ammann, A. P. and A. Lindley Stone, 1991. Method for the Comparative Evaluation of Nontidal Wetlands in New
Hampshire. Published by the New Hampshire Department of Environmental Services. NHDES-WRD-
1991-3.
Aaseng, N.E., J.C. Almendinger, R.P. Dana, B.C. Delaney, H.L. Dunevitz, K.A. Rusterholz, N.P. Sather, and D.S.
Wovcha. 1993. Minnesota's Native Vegetation: A Key to Natural Communities, Version 1.5. Minnesota
Department of Natural Resources Biological Report No. 20. Natural Heritage Program.
Chow, V.T., D.R. Maidment, and L.W. Mays, 1988. Applied Hydrology. McGraw-Hill, Inc. New York. 572 pp.
Cowardin, L.M., V. Carter, F.C. Golet, R.T. LaRoe. 1979. Classification of Wetlands and Deepwater Habitats of the
United States. U.S. Fish and Wildlife Service, FWS/OBS079/31, 103 pp.
Eggers, S.D. & D.M. Reed. 1997. Wetland Plants and Plant Communities of Minnesota & Wisconsin. 2nd
edition.
US Army Corps of Engineers, St. Paul.
Fetter, C.W. 1980. Applied Hydrogeology. MacMillan Publishing Company, New York, NY. 592 pp.
Findlay, C.S. and J. Bourdages. 2000. Response time of wetland biodiversity to road construction on adjacent
lands. Conservation Biology 14:86-94.
Federal Interagency Committee for Wetland Delineation. 1989. "Federal Manual for Identifying and Delineating
Jurisdictional Wetlands." USEPA, USFWS, US Army Corps of Engineers and US Soil Conservation
Service, Washington, D.C. 76 pp. plus appendices.
Flores, A.C., P.B. Bedient and L.W. Mays, 1981. Method for Optimizing Size and Location of Urban Detention
Storage. Proc. Of the Internatl. Symp. On Urban Hydrology, Hydraulics and Sediment Control, ASCE,
New York, pp 357-365.
Golet, F.C. 1976. Wildlife wetland evaluation model. Pages 13-34 in J.S. Larson, ed., Models for assessment of
freshwater wetlands. University of Massachusetts Water Resources Research Cent. Publ. No., 32, Amherst.
91 pp.
Hall, C.D. and F.J. Cuthbert. 2000. Impact of a controlled wetland drawdown on Blanding’s turtles in Minnesota.
Chelonian Conservation & Biology 4:643-657.
Hennepin County Well Index, 2001. Surficial Aquifer Data.
Knutson, M.G., J.R. Sauer, D.A. Olsen, M.J. Mossman, L.M. Hemesath and M.J. Lannoo. 1999. Effects of
landscape composition and wetland fragmentation on frog and toad abundance and species richness in
Iowa and Wisconsin, U.S.A. Conservation Biology 13:1437-1446.
MnRAM Comprehensive Guidance 11/18/2010 57
Knutson, M.G., J.R. Sauer, D.A. Olsen, M.J. Mossman, L.M. Hemesath and M.J. Lannoo. 2000. Landscape
associations of frog and toad species in Iowa and Wisconsin, U.S.A. Jour. Iowa Acad. Sci. 107(3):134-145.
Knutson, P. L., J. C. Ford, and M. R. Inskeep. 1981. National Survey of Planted Salt Marshes (vegetative
stabilization and wave stress). Wetlands 3:129-153.
Kuchler, A.W. 1967. Vegetation Mapping. The Ronald Press, New York, New York.
Lannoo, M.J. 1998. Amphibian conservation and wetland management in the upper midwest: a catch 22 for the
cricket frog. In Status and Conservation of Midwestern amphibians. M.J. Lanoo, ed. University of Iowa
Press, Iowa City, Iowa. Pages 331-339.
Lee, L.C. and Mark M. Brinson, William J. Kleindl, P. Michael Whited, Michael Gilbert, Wade L. Nutter, Dennis F.
Whigham, Dave DeWald. 1997. Revised Operational Draft Guidebook for the Hydrogeomorphic
Assessment of Temporary and Seasonal Prairie Pothole Wetlands. Seattle, WA. pp. 116+app.
Lehtinen, R.M., S.M. Galatowitsch and J.R. Tester. 1999. Consequences of habitat loss and fragmentation for
wetland amphibian assemblages. Wetlands 19:1-12.
Magee, D.W. and Garrett G. Hollands. 1998. A Rapid Procedure for Assessing Wetland Functional Capacity.
Association of State Wetland Managers. 190 pp.
Michigan DNR. 1981. Manual for Wetland Evaluation Techniques. Michigan Department of Natural Resources,
Lansing, MI.
Mitch & Gosselink 2000. Wetlands 3rd
Edition.
Ogawa, H. and J. W. Male. 1983. The Flood Mitigation Potential of Inland Wetlands. Water Resources Research
Center. University of Massachusetts.
Oldfield, B. and J.J. Moriarty. 1994. Amphibians and reptiles native to Minnesota. University of Minnesota Press,
Minneapolis, Minnesota.
Reed, P.B. 1988 (and 1993 supplement). National List of Plant Species that Occur in Wetlands, U. S. Fish and
Wildlife Service National Wetland Inventory, St. Petersburg, FL.
Rheinhardt, R., Mark M. Brinson, N. Eric Fleming, J. Glenn Sandifer, Jr., 1997. Deciduous Wetland Flats Interim
HGM Model. 50 pp.
Richter, Klaus O. and Amanda L. Azous. 1995. Amphibian occurrence and wetland characteristics in the Puget
Sound Basin. Wetlands 15:305-312.
Seaberg, J.K. and Douglas D. Hansen. 2000. Metropolitan Area Groundwater Model Project Summary: Northwest
Province, Layers 1, 2, and 3 Model, Version 1.00. Minnesota Pollution Control Agency.
Semlitsch, R.D. 2000. Principles for management of aquatic-breeding amphibians. J. Wildlife Mgmt. 64:615-631.
Shaw, S. and C.G. Fredine. 1956. Wetlands of the United States Circular 39. U.S. Fish and Wildlife Service. U.S.
Government Printing Office, Washington, D.C.
Smith, S.G. 1986. The cattails (Typha): Interspecific ecological differences and problems of identification.
Proceedings of the 5th
Annual Conference of the NALMS. Geneva, Illinois, 357-362.
Snodgrass, J.W., M.J. Komoroski, A.L.Bryan, Jr., and J. Burger, Jr. 2000. Relationships among isolated wetland
size, hydroperiod, and amphibian species richness: implications for wetland regulations. Conservation Biology
14:414-419.

MnRAM Comprehensive Guidance 11/18/2010 58
State of Minnesota Storm-Water Advisory Group. 1997. Storm-Water and Wetlands: Planning and Evaluation
Guidelines for Addressing Potential Impacts of Urban Storm-Water and Snow-Melt Runoff on Wetlands.
Thill, D., and M. Jacobson. 2000. The Minnehaha Creek Routine Assessment Method, in conjunction with the
Minnehaha Creek Watershed District.
Environmental Laboratory. 1987. Corps of Engineers Wetlands Delineation Manual. Technical Report Y-87-1, Final
Report.
Verry, E.S. 1988. The Hydrology of Wetlands and Man’s Influence on it. International Symposium on the Hydrology
of Wetlands in Temperate and Cold Regions. Joensuu, Finland.
Wells, J. Mike Mueller, John Parker, Bruce Gerbig, S. Jatnieks-Straumanis, Bruce Wilson, John Kittelson, Paul
Richert, Teri Sardinas, Scott LaChance, and Larry Smith, 1988. The Minnesota Wetland Evaluation
Methodology for the North Central United States. Corps of Engineers in conjunction with the Minnesota
Environmental Quality Board Wetland Evaluation Methodology Task Force, John R. Wells, Chairman.
Whited, D., Galatowitsch, S., Tester, J.R., Schik, K., Lehtinen, R., Husveth, J. 2000. Landscape and Urban Planning,
49 (1-2): 49-65.
Williams, R.E. 1968. Flow of groundwater adjacent to a small, closed basin in glacial till. Water Resources
Research 4:777-783.
BMP References:
Board of Water and Soil Resources, Association of Metropolitan Soil and Water Conservation Districts. 1989.
Minnesota Construction Site Erosion and Sediment Control Planning Handbook. St. Paul.
Minnesota Pollution Control Agency. 2000. Protecting Water Quality in Urban Areas: Best Management Practices
for Dealing with Storm Water Runoff from Urban, Suburban and Developing Areas of Minnesota.
Minneapolis, March, 2000.
Barr Engineering Company. 2001. Minnesota Urban Small Sites BMP Manual: Stormwater Best Management
Practices for Cold Climates. Metropolitan Council Environmental Services, St. Paul, MN.

MnRAM Comprehensive Guidance 11/18/2010 59
8.0 Appendices

MnRAM Comprehensive Guidance 11/18/2010 60
Appendix 1: Possible Best Management Practices, Detailed Listing
Type of Practice Area of Benefit Storm Protection Benefit Pollutants Controlled Construction Requirements
Institutional Source Controls
Public Education (Billing inserts,
news releases, radio public
service announcements, school
programs, and pamphlets)
Not applicable. Reduced pollutant load to storm
drain system.
Can reduce improper disposal of
paints, varnishes, thinners,
pesticides, fertilizers, and
household cleansers, and
chemicals, etc.
None.
Litter Control Site dependent. Reduced potential for clogging
and discharge.
Household and restaurant paper,
plastics, and glass.
Increase number of trash
receptacles and regulary service.
Recycling Programs Site dependent. Reduction in potential for
clogging and harmful discharge.
Household paper, glass,
aluminum, and plastics. Oil and
grease from auto maintenance.
Collection and sorting stations.
“No Littering” Ordinance Storm drain system and receiving
water.
Prohibits littering and prevents
litter from entering storm drains.
Paper, plastics, glass, food
wrappers, and containers.
None.
“Pooper Scooper” Ordinance Storm drain system and receiving
water.
Requires animal owners to clean
up and properly dispose of
animal wastes.
Coliform bacteria and
nitrogen/urea.
None.
Develop and Enact Spill
Response Plan
Site dependent. Prevent pollutants from entering
storm drain.
Hazardous chemical, harmful
chemicals, oil, and grease.
None.
Clean Up Vacant Lots Site dependent. Prevent debris from accumulating
on lot. Prevent site from
appearing as a “dump” for others
to use for disposal. Eliminate
sources of hazardous waste.
Hazardous and/or harmful
chemicals, wind blown for water
borne debris.
None.
Prohibit Illegal and Illicit
Connections and Dumping into
Storm Drain System
Storm drain system and receiving
water.
Reduces pollutant load entering
storm drains.
Coliform bacteria, nitrogen,
contaminants, and toxic or
harmful chemicals.
None.

MnRAM Comprehensive Guidance 11/18/2010 61
Type of Practice Area of Benefit Storm Protection Benefit Pollutants Controlled Construction Requirements
Identify, Locate, and Prohibit
Illegal or Illicit Discharge to Storm
Drain System
Area-wide. Halt hazardous and harmful
discharges, whether intentional
or negligent.
Sewage from cross connections,
oil, grease, direct disposal of
pesticides and fertilizers,
contaminated water, paint,
varnish, solvents, water from site
dewatering, swimming pool and
spa water, flushing water from
radiators and cooling systems,
and hazardous or harmful
chemicals.
Monitor storm drain system for
flows and water quality.
Require Proper Storage, use,
and Disposal of Fertilizers,
Pesticides, Solvents, Paints and
Varnishes, and Other Household
Chemicals (oil, grease, and
antifreeze, etc.)
Site dependent (City, State, or
County-wide).
Reduce pollutant load to storm
system.
Household hazardous materials. None.
Restrict Paving and Use of
Nonporous Cover Materials in
Recharge Areas
Recharge area site. Promotes infiltration to
groundwater and reduces runoff
volume and velocity. Filters
pollutants.
Establishment of vegetation or
use of recharge/infiltration
materials.
Nonstructural Source Controls
Street Sweeping Street right-of-way.
Reduction in potential for
clogging storm drains with debris.
Some oil and grease control
possible.
Paper and plastics, leaves and
twigs, dust, and oil and grease.
Acquire street sweeping
equipment.
Sidewalk Cleaning Sidewalk right-of-way in areas of
heavy foot traffic.
Reduction in pollutants entering
storm drain.
Oil and dirt. None.
Clean and Maintain Storm Drain
Channels Annually
Channel capacity and receiving
water. Upstream flood control
benefits. Includes benefits to
channel wildlife habitat and
vegetation.
Prevent erosion in channel.
Improve capacity by removing silt
and sedimentation. Remove
debris that is habitat destroying
or toxic to wildlife.
Silt and sediment and the
contaminants contained therein.
Plastic, glass, paper, and metal
thrown or washed in channel.
None.
Clean and Inspect Storm Inlets
and Catch Basins Annually
Site dependent flood control
benefits.
Allows proper drainage to
prevent flooding and continued
proper operation of facilities.
Silt and sediment and the
contaminants contained therein.
Plastic, glass, paper, and metal
thrown or washed into facilities.
None.
Clean and Inspect Debris Basins
Annually
Site dependent flood control
benefits.
Allows proper drainage to
prevent flooding and continued
proper operation of facilities.
Silt and sediment and the
contaminants contained therein.
Plastic, glass, paper, and metal
thrown or washed into facilities.
None.

MnRAM Comprehensive Guidance 11/18/2010 62
Type of Practice Area of Benefit Storm Protection Benefit Pollutants Controlled Construction Requirements
Storm Drains Cleaned and
Maintained Every 3 to 6 Years
Flood control and water quality
benefits.
Allows proper drainage to
prevent flooding and continued
proper operation of facilities.
Silt and sediment and the
contaminants contained therein.
Plastic, glass, paper, and metal
thrown or washed into facilities.
None.
Storm System Pump Stations
Cleaned and Maintained
Annually
Site dependent flood control and
water quality benefits.
Prevents flooding and allows
continued proper operation of
facilities.
Silt and sediment and the
contaminants contained therein.
Plastic, glass, paper, and metal
thrown or washed into facilities.
None.
Inspect and Maintain Sewer
System
Storm drain system and receiving
water.
Prevents and eliminates sewer
system surcharges.
Contaminants, toxics, and
coliform bacteria.
None.
Minor Structural Source Controls
Storm Drain Inlet Protection Storm drain drainage area. Prevent debris from entering
storm drain.
Dirt, leaves, twigs, paper, plastic,
and other incidentals.
Not available.
Outlet Protection Storm drain receiving water. Prevent erosion at the outlet of
pipes or paved channels and
protect downstream water quality.
Turbidity and sediment. Structural apron lining at the
outlet location. Made of riprap,
grouted riprap, concrete, or other
structural materials.
Slope Stabilization and Erosion
Control Measures
Site and topography dependent. Reduce silt and sediment load to
storm drains.
Silt and sediment and the
contaminants therein.
None.
Interceptor Swale Dependent on flow velocity.
Max. velocity for earth channel is
6 fps. Max. velocity for vegetated
or riprap channel is 8 fps.
Shorten length of exposed slopes
and intercept and divert storm
runoff from erodible areas.
Sediment and silt and the
contaminants contained therein.
Excavation drainageway across
disturbed areas or rights-of-way.
Improve and Maintain Natural
Channels
Channel capacity and receiving
water. Upstream flood control
benefits. Includes benefits to
channel wildlife habitat and
vegetation.
Prevent erosion in channel.
Improve capacity by removing silt
and sedimentation. Remove
debris that is habitat destroying
or toxic to wildlife.
Silt and sediment and the
contaminants contained therein.
Plastic, glass, paper, and metal
thrown or washed in channel.
None.
Diversion Channel Dependent of flow velocity.
Maximum velocities: 5 fps for
vegetated channel and 8 fps for
riprap channel. Not for use on
slopes greater than 15%.
Drainage area should be 5 acres
or less.
Intercept and convey runoff to
outlets at nonerosive velocity.
Sediment and erosion controls. Lined drainageway of trapezoidal
cross section.
Grass-Lined Channel Site dependent but of larger
capacity than interceptor or
perimeter swales.
Intercept runoff and convey
runoff from site.
Sediment and silt and the
contaminants contained therein.
Excavation of channel or
improvements to natural channel.
Stabilization with vegetation.
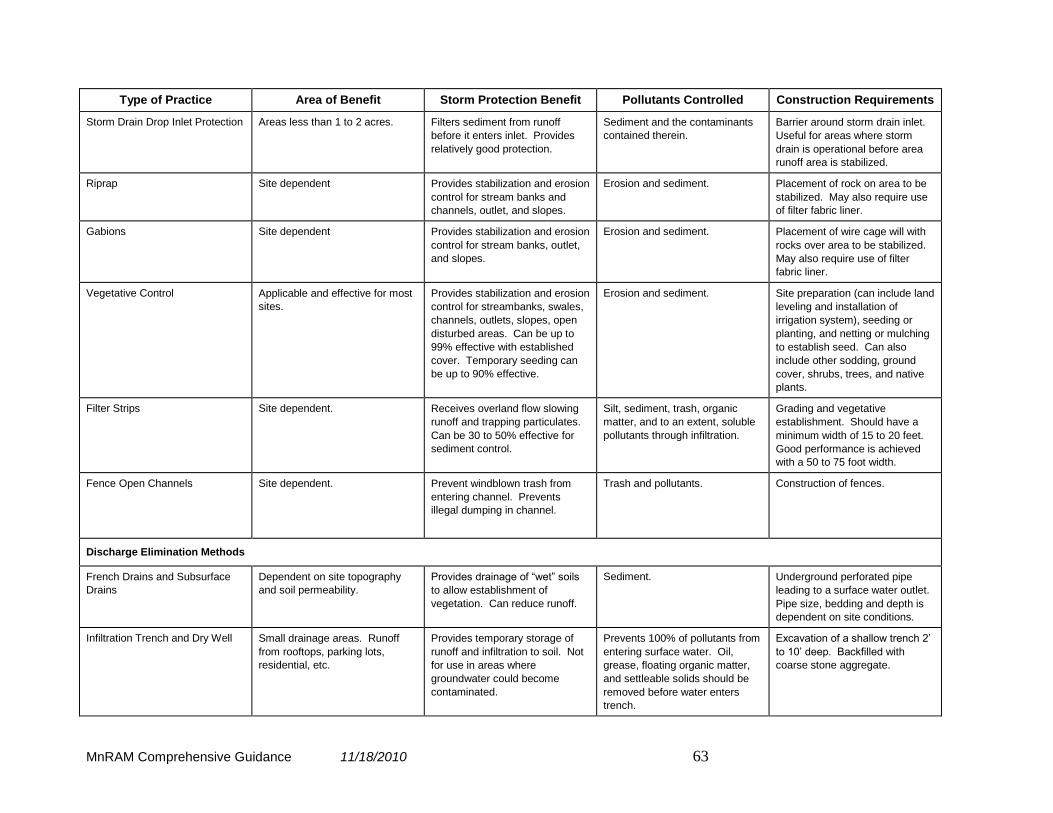
MnRAM Comprehensive Guidance 11/18/2010 63
Type of Practice Area of Benefit Storm Protection Benefit Pollutants Controlled Construction Requirements
Storm Drain Drop Inlet Protection Areas less than 1 to 2 acres. Filters sediment from runoff
before it enters inlet. Provides
relatively good protection.
Sediment and the contaminants
contained therein.
Barrier around storm drain inlet.
Useful for areas where storm
drain is operational before area
runoff area is stabilized.
Riprap Site dependent Provides stabilization and erosion
control for stream banks and
channels, outlet, and slopes.
Erosion and sediment. Placement of rock on area to be
stabilized. May also require use
of filter fabric liner.
Gabions Site dependent Provides stabilization and erosion
control for stream banks, outlet,
and slopes.
Erosion and sediment. Placement of wire cage will with
rocks over area to be stabilized.
May also require use of filter
fabric liner.
Vegetative Control Applicable and effective for most
sites.
Provides stabilization and erosion
control for streambanks, swales,
channels, outlets, slopes, open
disturbed areas. Can be up to
99% effective with established
cover. Temporary seeding can
be up to 90% effective.
Erosion and sediment. Site preparation (can include land
leveling and installation of
irrigation system), seeding or
planting, and netting or mulching
to establish seed. Can also
include other sodding, ground
cover, shrubs, trees, and native
plants.
Filter Strips Site dependent. Receives overland flow slowing
runoff and trapping particulates.
Can be 30 to 50% effective for
sediment control.
Silt, sediment, trash, organic
matter, and to an extent, soluble
pollutants through infiltration.
Grading and vegetative
establishment. Should have a
minimum width of 15 to 20 feet.
Good performance is achieved
with a 50 to 75 foot width.
Fence Open Channels Site dependent. Prevent windblown trash from
entering channel. Prevents
illegal dumping in channel.
Trash and pollutants. Construction of fences.
Discharge Elimination Methods
French Drains and Subsurface
Drains
Dependent on site topography
and soil permeability.
Provides drainage of “wet” soils
to allow establishment of
vegetation. Can reduce runoff.
Sediment. Underground perforated pipe
leading to a surface water outlet.
Pipe size, bedding and depth is
dependent on site conditions.
Infiltration Trench and Dry Well Small drainage areas. Runoff
from rooftops, parking lots,
residential, etc.
Provides temporary storage of
runoff and infiltration to soil. Not
for use in areas where
groundwater could become
contaminated.
Prevents 100% of pollutants from
entering surface water. Oil,
grease, floating organic matter,
and settleable solids should be
removed before water enters
trench.
Excavation of a shallow trench 2’
to 10’ deep. Backfilled with
coarse stone aggregate.

MnRAM Comprehensive Guidance 11/18/2010 64
Type of Practice Area of Benefit Storm Protection Benefit Pollutants Controlled Construction Requirements
Exfiltration Trench Site dependent. Prevent silting on underlying filter
gravel or rock bed. Retain first
flush, reduce runoff volume and
peak discharge rate and promote
water quality improvement.
Prevents pollutants from entering
surface water. Oil, grease,
floating organic matter, and
settleable solids should be
removed before water enters
trench.
Uses perforated pipe with
suitable membrane filter material.
Installed before receiving water
outlet or in groundwater recharge
area.
Porous Pavement Site dependent. Requires
relatively flat surface.
Allow infiltration of surface runoff.
Reduce runoff volume and
pollutant loadings from low
volume traffic areas.
Oil and grease. Install porous pavement. May
require twice as much paving
material as standard asphalt to
achieve same strength.
Retention Basin Best for sites of 5 to 50 acres. Promotes infiltration to
groundwater and reduces runoff
volume and velocity. Filters
pollutants.
Sediment, trace metals, nutrients,
and oxygen-demanding
substances.
Excavation of a basin over
permeable soils. Size is site
dependent. Depth is 3 to 12 feet.
Floatables and Oil Removal
Clarifiers and Oil and Water
Separators on Parking Structures
Parking lot structure and
receiving water.
Collect debris before it can enter
storm drain.
Oil, grease, and antifreeze from
vehicles and foods and food
wrappers.
Install grit and separators.
Oil and Grit Separators Site dependent. For heavy traffic
areas or areas with high potential
for oil spills.
Remove pollutants. Sediments and hydrocarbons. Install oil and grit separators on
storm drains.
Sediment/Grease Trap Installed on storm drain inlets. Intercept and trap sediment and
grease from runoff.
Sediment, oil, and grease. Install sediment and grease
traps.
Solids Removal
Detention Basin Four acres of drainage area for
each acre/foot of storage
provided to retain a permanent
pool of water.
Temporary storage of storm
runoff until release. Can also
improve water quality.
Sediment, trace metals,
hydrocarbons, nutrients, and
pesticides.
Excavation of a basin over soils
which will cause excessive
seepage. May require a liner.
Can be used aesthetically as a
small pond in landscaping.
Extended Detention Basin Size for a minimum detention
time of 24 hours.
Temporary storage of runoff for
an extended period of time. Can
improve water quality.
Sediment, trace metals,
hydrocarbons, nutrients, and
pesticides.
Excavation of a basin over soils
which will cause excessive
seepage. May require a liner.
Can be used aesthetically as a
small pond in landscaping.
Bar Screens Site dependent. Restrict passage of objects which
may obstruct pump station
suction bays.
Large debris. Install bar screens before pump
station suction bays.

MnRAM Comprehensive Guidance 11/18/2010 65
Appendix 2: Ecological Classification System
The Ecological Classification System (ECS) is part of a nationwide mapping initiative developed to improve our ability to manage all
natural resources on a sustainable basis. This is done by integrating climatic, geologic, hydrologic and topographic, soil and vegetation
data.
Three of North America's ecological regions, or biomes, representing the major climate zones converge in Minnesota: prairie parkland,
deciduous (Eastern broadleaf) forest and coniferous (Laurentian mixed) forest. The presence of three biomes in one non-mountainous
state is unusual, and accounts for the diversity of ecological communities in Minnesota.

MnRAM Comprehensive Guidance 11/18/2010 66
Appendix 3: Glossary
Aquatic Bed (AB) – A class within the Cowardin Wetland Classification system. Includes wetlands and deepwater habitats dominated
by plants that grow principally on or below the surface of the water for most of the growing season in most years.
Best Management Practices: Land management actions that can be implemented to protect wetlands from various nonpoint source
pollutants. In general, they must be designed and often implemented to meet site-specific needs. Typically, BMPs are chosen and
implemented for their ability to treat or reduce sediment, nutrient removal and to reduce excess surface water from entering the wetland.
Buffer: A buffer is an unmanicured upland area dominated by permanent native and noninvasive vegetation immediately adjacent to the
wetland boundary.
Discharge: Wetland systems in which water preferentially discharges from groundwater into the wetland.
Emergent shoreline vegetation: These plants grow along edges of lakes and ponds, or on wet ground away from open water. Examples
of such vegetation include: cattail, bulrush, loosestrife, and reed canary grass.
Exotic Plant: A plant not originally from this area or location.
Facultative Plants: Plants with a similar likelihood of occurring in both wetlands and nonwetlands (estimated probability 33% to 67%).
Facultative Upland Plants: Plants that sometimes occur in wetlands (estimated probability 1% to 33%), but occur more often in
nonwetlands (estimated probability >67% to 99%).
Facultative Wetland Plants: Plants that usually occur in wetlands (estimated probability 67% to 99%), but also occur in nonwetlands
(estimated probability 1% to 33%).
Flood Attenuation: The slowing of a flood wave by spreading water flow laterally over the ground surface or by the increased resistance
of water flow through emergent vegetation.

MnRAM Comprehensive Guidance 11/18/2010 67
Genera: Genera or genus is a level of taxonomy and is typically the first part of a scientific name that is utilized to identify a plant or
animal. The scientific name for purple loosestrife is Lythrum salicaria (Lythrum is the genus name, while salicaria is the specices
name).
Geographic Information System (GIS): A system designed to work with data referenced by spatial or geographic coordinates.
Hydric Soils: Soils that are saturated, flooded, or ponded long enough during the growing season to develop anaerobic conditions in the u pper
part.
Hydrologic Regime (Hydroperiod): The seasonal pattern of wetland water level that is like a hydrologic signature of each wetland type. It
defines the rise and fall of a wetland‘s surface and subsurface water. Constancy of seasonal patterns from year to year ensur es a reasonable
stability for the wetland.
Hydrophytic Vegetation: Macrophytic plant life growing in water, soil, or on a substrate that is at least periodically deficient in oxygen
as a result of excessive water content.
Inundation: Covering or flooding of the land surface with water.
Invasive Plant: A non-native plant that escapes from where it was planted and invades native plant communities.
Macrophyte: A plant that is physiologically adapted to live in sediment, which is saturated or inundated for an extended duration or
permanently.
Monotypic Vegetation: Vegetative communities dominated by a single plant species.
National Wetland Inventory (NWI): An inventory of the Nation's wetland resources and deepwater habitats conducted by the U.S. Fish
and Wildlife Service containing information on the extent and characteristics of wetlands identified primarily from aerial photographs.
Native Vegetation: Plant species that are indigenous to Minnesota or that expand their range into Minnesota without being intentionally
or unintentionally introduced by human activity and are classified as native in the Minnesota Plant Database.
Non-invasive Vegetation: Plant species that do not typically invade or rapidly colonize existing, stable plant communities.
Non-native Plant: A plant introduced by human activities to areas where they do not naturally occur.

MnRAM Comprehensive Guidance 11/18/2010 68
Nutrient Loading: The import of nutrients (phosphorus and nitrogen) carried in runoff water.
Obligate Upland Plants: Plants that rarely occur in wetlands (estimated <1%), but almost always occur in nonwetlands (estimated
probability >99%) under natural conditions.
Obligate Wetland Plants: Plants that occur almost always (estimated probability >99%) in wetlands under natural conditions, but which
may also occur rarely (estimated probability <1%) in nonwetlands.
Pretreatment: Removal of nutrients or sediment from stormwater runoff prior to discharging into a wetland.
Recharge: Wetland systems in which water preferentially seeps into groundwater.
Reference Standard Wetland: Reference Standard Wetlands are the least disturbed/altered wetlands within the Wetland Comparison
Domain.
Submergent Aquatic Vegetation: The entire plant is usually underwater, but the flowers and fruits may rise above the water surface.
Submergent species are rooted in the sediment and have underwater leaves. They can grow from shallow water to depths greater than 20
feet.
Subwatershed: Major watersheds are split up into subwatersheds, each of which defines the land area in which all water drains to a
defined point.
Terrestrial Exotic Plant: A plant not originally from this area that is best adapted to life on ground that is not saturated or inundated for
extended periods of time.
Watershed: The land area in which all water drains to a defined point.
Wetland: Lands transitional between terrestrial and aquatic systems where the water table is usually at or near the surface or the land is
covered by shallow water. Wetlands must:
(1) have a predominance of hydric soils;
(2) be inundated or saturated by surface water or groundwater at a frequency and duration sufficient to support a prevalence of
hydrophytic vegetation typically adapted for life in saturated soil conditions; and
(3) under normal circumstances, support a prevalence of hydrophytic vegetation.

MnRAM Comprehensive Guidance 11/18/2010 69
Wetland Community: A characteristic assemblage of various vegetation species typically found in specific wetland conditions.
Wetland Comparison Domain: A Wetland Comparison Domain is defined in the MnRAM 2.0as the geographic area, generally of a size
so as to include some relatively undisturbed Reference Standard Wetlands (e.g., the political boundary, major or local watershed
boundary or ecoregion subsection), used for functional comparison.
Wetland Conservation Act (WCA): The Wetland Conservation Act became effective on January 1, 1992. WCA rules are administered
by Local Government Units (LGU) with oversight provided by the Board of Water and Soil Resources and technical assistance from the
Soil and Water Conservation Districts. The Department of Natural Resources conservation officers and other peace officers provide
enforcement of the WCA. The primary goals of the WCA are to:
1. Achieve no net loss in the quantity, quality, and biological diversity of Minnesota's existing wetlands.
2. Increase the quantity, quality, and biological diversity of Minnesota's wetlands by restoring or enhancing diminished or drained
wetlands.
3. Avoid direct and indirect impacts to wetlands from activities that destroy or diminish the quantity, quality, and biological diversity of
wetlands.
4. Replace wetland values where avoidance of activity is not feasible or prudent.
Wetland Functions: Physical, chemical, or biological processes or attributes of a wetland -- simply something a wetland does. For
example, the process of retaining surface water is a commonly cited wetland function.
Wetland Creation: The conversion of a persistent upland into a wetland by human activity.
Wetland Restoration: Reestablishment of a historical wetland in an area in which wetland hydrology has been removed.
Wetland Value: A wetland value is the extent to which a wetland function is perceived as beneficial to an individual or society.
Reduced flood damage to downstream properties is a value generally associated with the function of surface water retention.
Top Related