


Languages
Pages
Legal


– Issues for a MNC in doing business in Pharmaceuticals in India
Homi R Khusrokhan (Sr. Adviser Private Equity, Tata Capital Ltd.)14th
September 2011
1.
India’s changing business scenario:
a)
A quick retrospective & dramatic changes seen in the last 2 decades
b)
What’s attractive about India?
c)
Understanding Indian Markets & Indian Mind‐sets
2.
India’s Pharmaceuticals Scenario:
a)
A quick retrospective
b)
The Indian Pharma Market & some important differences
c)
Approaches possible
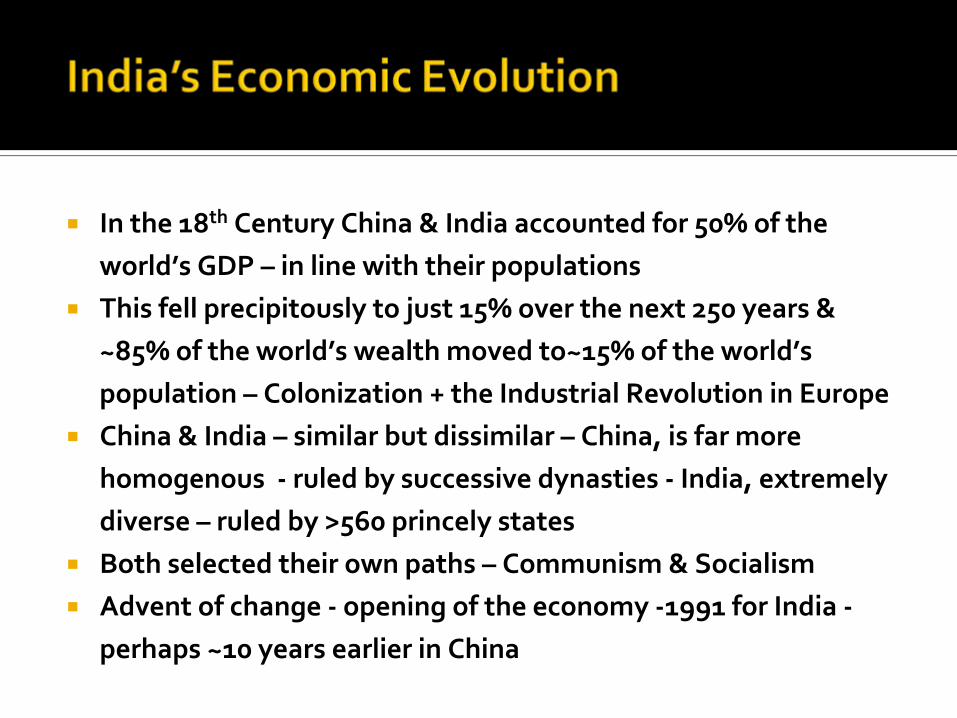
In the 18th Century China & India accounted for 50% of the world’s GDP – in line with their populationsThis fell precipitously to just 15% over the next 250 years & ~85% of the world’s wealth moved to~15% of the world’s population – Colonization + the Industrial Revolution in Europe China & India – similar but dissimilar – China, is far more homogenous ‐ ruled by successive dynasties ‐ India, extremely diverse – ruled by >560 princely statesBoth selected their own paths – Communism & SocialismAdvent of change ‐ opening of the economy ‐1991 for India ‐perhaps ~10 years earlier in China
1.
(Finally) shaken off “the Hindu rate of growth”
and
hopefully no more “Snakes & Ladders”
hereafter
2.
The significant change in the composition of GDP

Growth in 2010‐11 is expected to be ~ 7.5%+
Growth after 2011‐12 is expected to be ~ 8‐ 8.5%
-6
-4
-2
0
2
4
6
8
10
12
1970
-71
1971
-72
1972
-73
1973
-74
1974
-75
1975
-76
1976
-77
1977
-78
1978
-79
1979
-80
1980
-81
1981
-82
1982
-83
1983
-84
1984
-85
1985
-86
1986
-87
1987
-88
1988
-89
1989
-90
1990
-91
1991
-92
1992
-93
1993
-94
1994
-95
1995
-96
1996
-97
1997
-98
1998
-99
1999
-00
2000
-01
2001
-02
2002
-03
2003
-04
2004
-05
2005
-06
2006
-07
2007
-08
2008
-09
2009
-10
Average
growth rate:
3.0
Average
growth rate:
5.2
Average
growth rate:
5.8
Average
growth rate:
8.5
8.0
Source: Central Statistical Organization
0
2
4
6
8
10
12
India China Brazil Russia
(%)
2006-10 2011-15
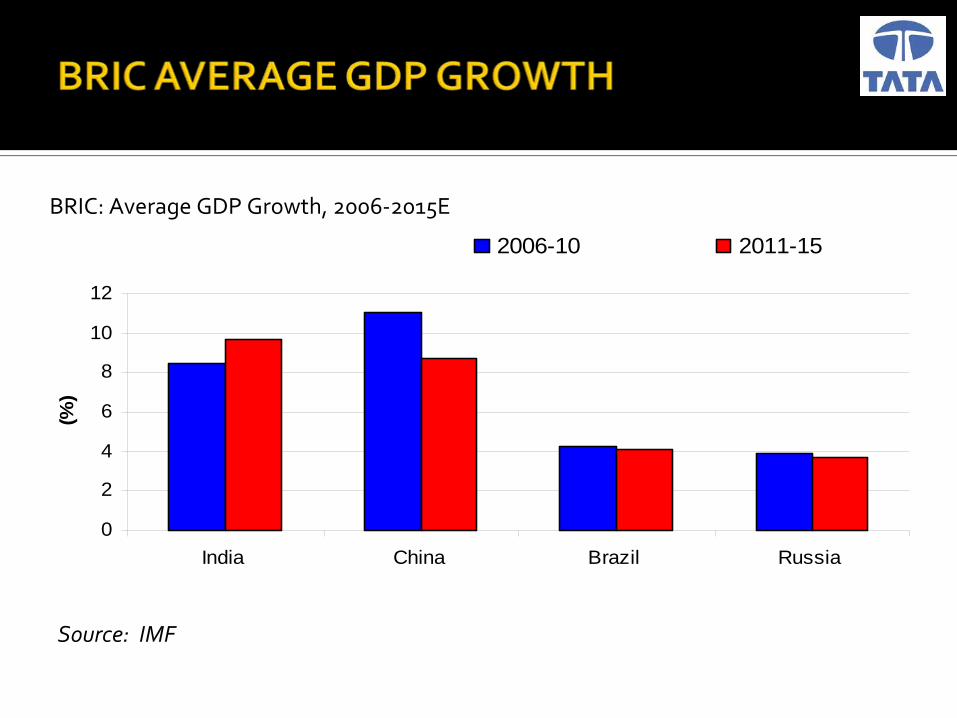
BRIC: Average GDP Growth, 2006‐2015E
Source: IMF
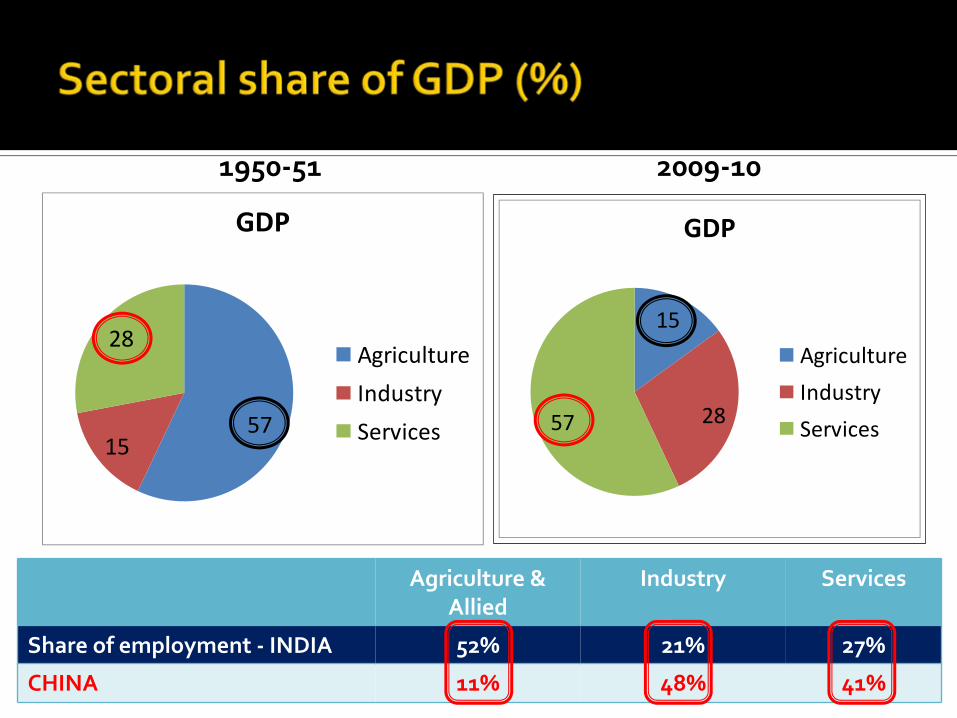
1950‐51
5715
28
GDP
Agriculture
Industry
Services
2009‐10
15
2857
GDP
Agriculture
Industry
Services
Agriculture &Allied
Industry Services
Share of employment ‐
INDIA 52% 21% 27%
CHINA 11% 48% 41%

1.
(Finally) shaken off “the Hindu rate of growth”
and hopefully no more “Snakes & Ladders”
2.
The significant change in the composition of our
GDP
3.
Domestic Consumption – a significant component
of GDP + High Rate of Investment (& savings)
4.
Significant planned investments in Infrastructure
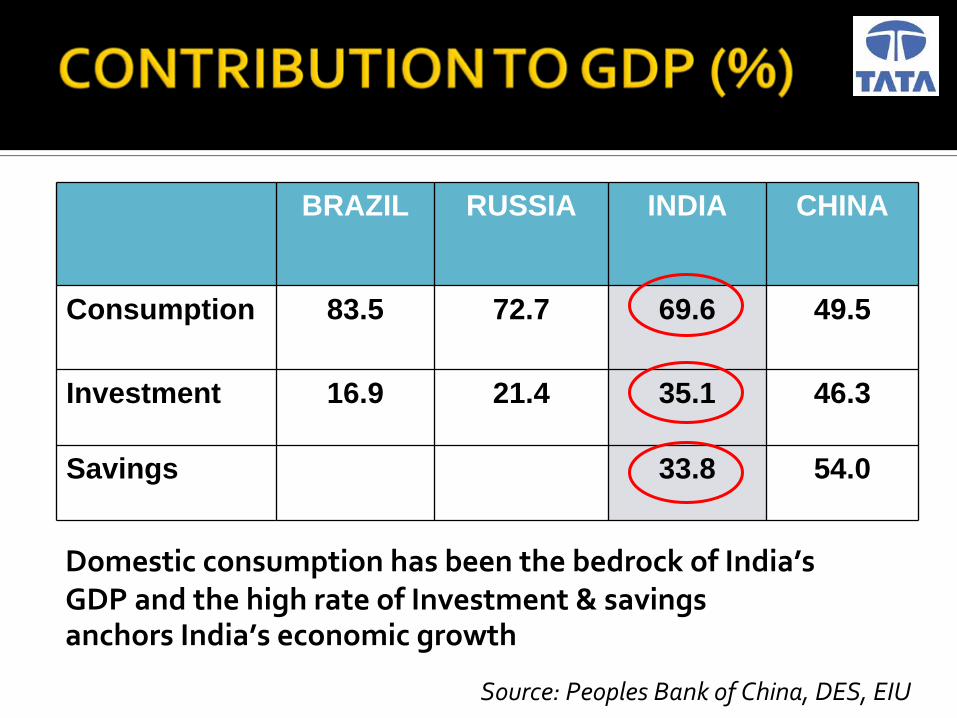
BRAZIL RUSSIA INDIA CHINA
Consumption 83.5 72.7 69.6 49.5
Investment 16.9 21.4 35.1 46.3
Savings 33.8 54.0
Domestic consumption has been the bedrock of India’s
GDP and the high rate of Investment & savings
anchors India’s economic growth
Source: Peoples Bank of China, DES, EIU

The 11th 5‐Year Plan (2007‐12) envisages large investments in infrastructure
China: US$ 400 Billion (2009)
*at Rs 40/$ (at 2006‐07 prices)Source: Planning Commission of India
02040
6080
100120
140160
2007-08 2008-09 2009-10 2010-11 2011-12
$Bn
012345678910
%of
GD
P
Investment in Infrastructure in India as % of GDP
Eleventh Plan (Projected Investment)
Sectors Rs Bn.US $ Bn*
Share (%)
Electricity 6665.25 166.63 32.42
Roads and Bridges 3141.52 78.54 15.28
Telecommunication 2584.39 64.61 12.57
Railways (incl MRTS) 2618.08 65.45 12.73
Irrigation (incl Watershed) 2533.01 63.33 12.32
Water Supply and sanitation 1437.30 35.93 6.99
Ports 879.95 22.00 4.28
Airports 309.68 7.74 1.51
Storage 223.78 5.59 1.09
Gas 168.55 4.21 0.82
Total 20561.51 514.04 100
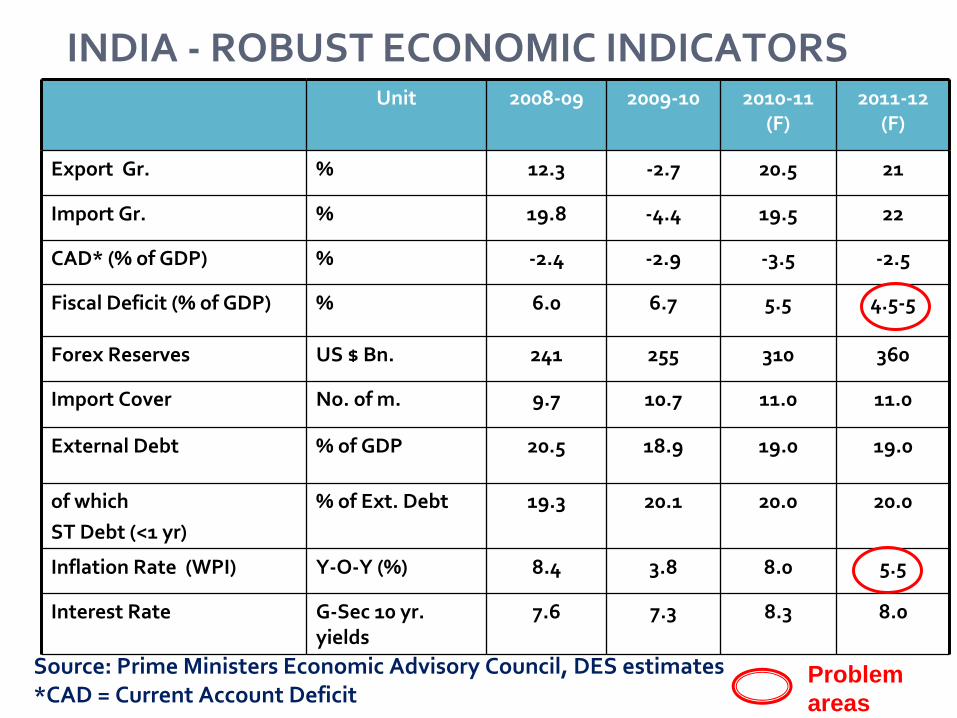
INDIA ‐
ROBUST ECONOMIC INDICATORS Unit 2008‐09 2009‐10 2010‐11
(F)
2011‐12
(F)
Export Gr. % 12.3 ‐2.7 20.5 21
Import Gr. % 19.8 ‐4.4 19.5 22
CAD* (% of GDP) % ‐2.4 ‐2.9 ‐3.5 ‐2.5
Fiscal Deficit (% of GDP) % 6.0 6.7 5.5 4.5‐5
Forex Reserves US $ Bn. 241 255 310 360
Import Cover No. of m. 9.7 10.7 11.0 11.0
External Debt % of GDP 20.5 18.9 19.0 19.0
of which ST Debt (<1 yr)
% of Ext. Debt 19.3 20.1 20.0 20.0
Inflation Rate (WPI) Y‐O‐Y (%) 8.4 3.8 8.0 5.5
Interest Rate G‐Sec 10 yr.
yields
7.6 7.3 8.3 8.0
Source: Prime Ministers Economic Advisory Council, DES estimates
*CAD = Current Account Deficit
Problem areas

Reforms in Progress
Labour Laws
GST
FDI in Retail
Subsidies Cut
PSU Divestments
Problem Areas
Infrastructure Poor HDI
Land acquisition Social Unrest
Agric. P/y Terrorism
Fiscal Deficit Poor Governance
Skill Shortages The BIG “C”

1.
India is a nation of Shop‐keepers and Traders – 8 million
grocery / mom‐and‐pop shops ‐
[+ve] Highly
Entrepreneurial, [‐ves] Cut‐throat competition , Regional
Brands, Passing –off, Counterfeiting, etc. RETAIL Business
entry for any organised sector player will always be difficult
2.
Low Price Points & Tiny Unit Margins
–
medicines available
at a fraction of world price
3.
A “Cost‐plus”
Mindset: “Value”
is not a decision driver
1.
India’s changing business scenario:
a)
A quick retrospective & dramatic changes seen in the last 2 decades
b)
What’s attractive about India?
c)
Understanding Indian Markets & Mind‐sets
2.
India’s Pharmaceuticals Scenario:
a)
A quick retrospective
b)
The Indian Pharma Market & some important differences to recognise
c)
Approaches possible
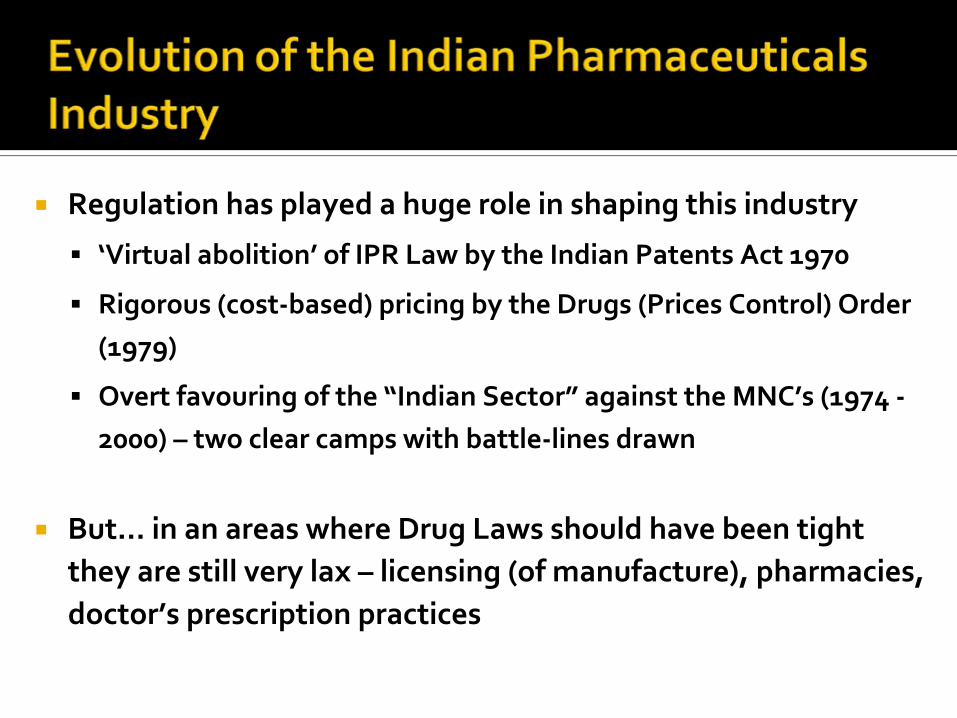
Regulation has played a huge role in shaping this industry
‘Virtual abolition’ of IPR Law by the Indian Patents Act 1970
Rigorous (cost‐based) pricing by the Drugs (Prices Control) Order (1979)
Overt favouring of the “Indian Sector” against the MNC’s (1974 ‐2000) – two clear camps with battle‐lines drawn
But… in an areas where Drug Laws should have been tight they are still very lax – licensing (of manufacture), pharmacies, doctor’s prescription practices

1.
Large number of players and very fragmented – over 10,000
players in the ‘Organised Sector’2.
A large Branded Generic Market –
[>60,000 Brands & >84% of
total sales ‘Branded Generics’]3.
Retail Sales 91%
‐
Institutional Sales 9%
4.
Large number of Pharmacies [5.5 m.]5.
Acute Therapies 74% Chronic Therapies 26%6.
Combinations dominate [62% of new products introduced in
2010 were combination products]7.
Tiny Govt. spends on Healthcare –
1%
of GDP
8.
Indian Doctors generally tend to over‐prescribe and love
combinations – GCP trials are difficult ‐
Physician‐Pathlab‐
Surgeon ‘syndicates’
are very common

1.
Company Rankings
Top 10 Companies Market Share
1. Abbotts 6.2
2. Cipla 5.4
3. GSK 4.7
4. Ranbaxy 4.6
5. Sun Pharma 4.2
6. Zydus Cadilla 3.9
7. Alkem 3.3
8. Lupin 3.2
9. Mankind 3.0
10. Pfizer + Wyeth 3.0
MNC INDIAN
Post –
Piramal Deal 13.9 (33%) 27.6 (67%)
Pre –
Piramal Deal 10.0 (25%) 31.6 (75%)
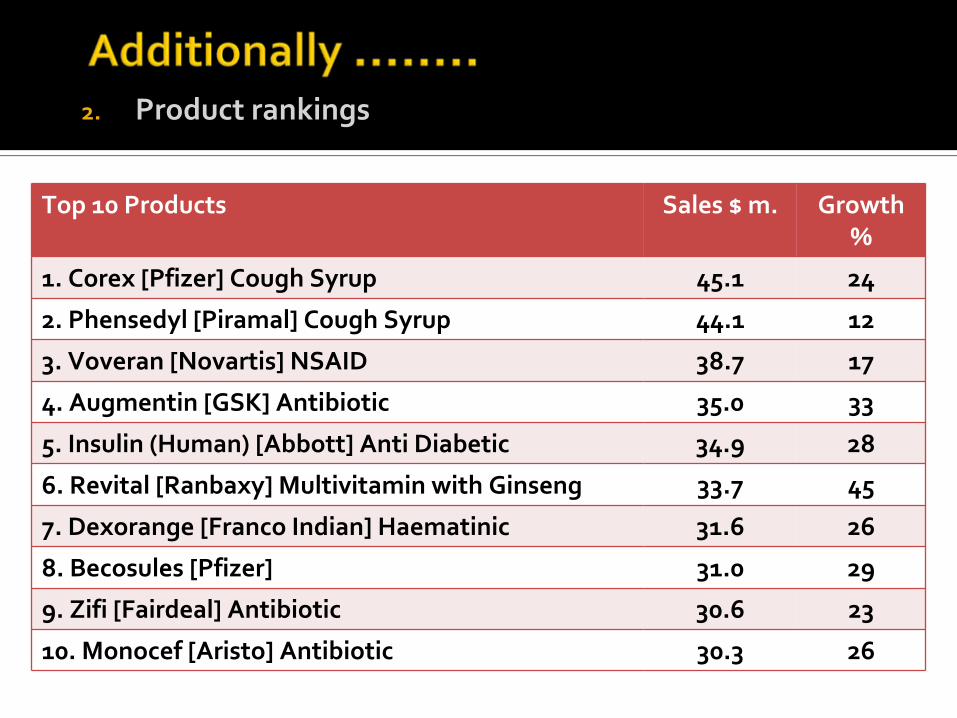
2.
Product rankings
Top 10 Products Sales $ m. Growth
%
1. Corex [Pfizer] Cough Syrup 45.1 24
2. Phensedyl [Piramal] Cough Syrup 44.1 12
3. Voveran [Novartis] NSAID 38.7 17
4. Augmentin [GSK] Antibiotic 35.0 33
5. Insulin (Human) [Abbott] Anti Diabetic 34.9 28
6. Revital [Ranbaxy] Multivitamin with Ginseng 33.7 45
7. Dexorange [Franco Indian] Haematinic 31.6 26
8. Becosules [Pfizer] 31.0 29
9. Zifi [Fairdeal] Antibiotic 30.6 23
10. Monocef [Aristo] Antibiotic 30.3 26

Only 35% of the population has access to allopathic medicines – as prosperity increases this industry will see significant growth [@ 12‐15% y‐o‐y growth it is already one of the fastest growing Pharma markets in the world]
There is a significant cost advantage to operations in India
Manufacturing [119 USFDA & 84 UKMHRA approved plants]R&D [particularly, Discovery & Development CRO’s]Clinical Research [Living Laboratory]Back‐office and data management
Increase in Chronic and life‐style diseases
Rapid growth in Hospital Sector [>70% in last 3 years]
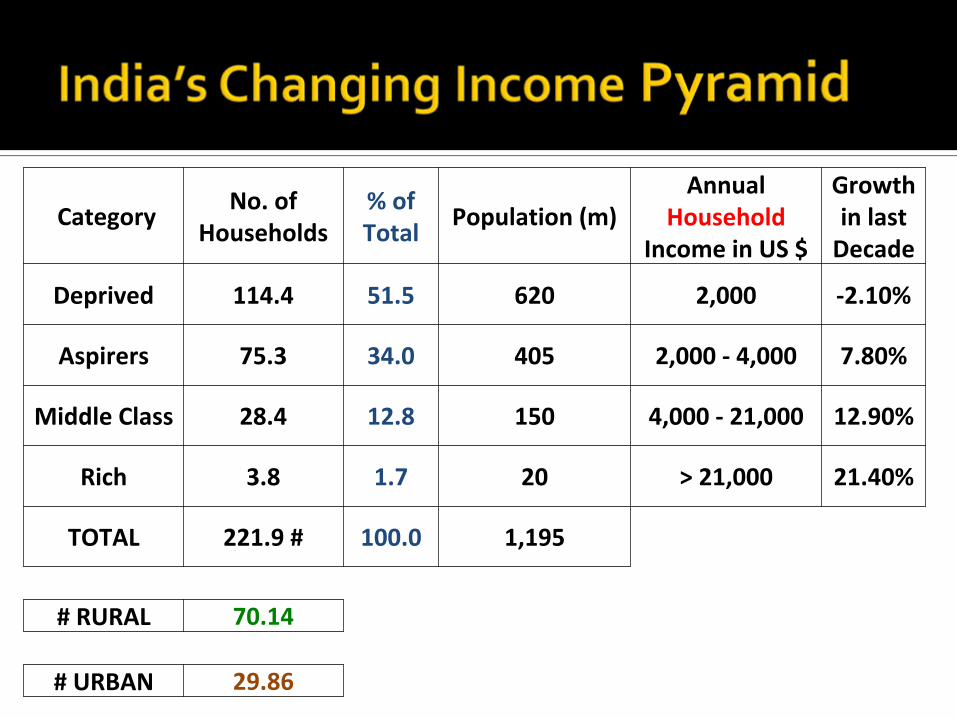
CategoryNo. of
Households% of
TotalPopulation (m)
Annual
Household
Income in US $
Growth
in last
Decade
Deprived 114.4 51.5 620 2,000 ‐2.10%
Aspirers 75.3 34.0 405 2,000 ‐
4,000 7.80%
Middle Class 28.4 12.8 150 4,000 ‐
21,000 12.90%
Rich 3.8 1.7 20 > 21,000 21.40%
TOTAL 221.9 # 100.0 1,195
# RURAL 70.14
# URBAN 29.86

1.
Do not look at India through ‘Western Eyes’Respect and learn to accept with the differencesLook for the strengths (and find own solutions for weaknesses)
2.
The 3 biggest problemsPrice control Lack of IPR [less of a problem today but still an issue] Dealing with the bureaucracy of the Indian Regulator
3.
Seek out Examples of Companies that have succeeded and
placed their bets differentlyGE [$ 3Bn. business – JW Tech Centre 5,500 Sc., 1,000 Patents]IBM [160,000 employees (more than US)]TI [entered early (1985) ‐ R&D Chip Design & Digital Signal]
4.
Glaxo – “the Multinational with a Brown Face”
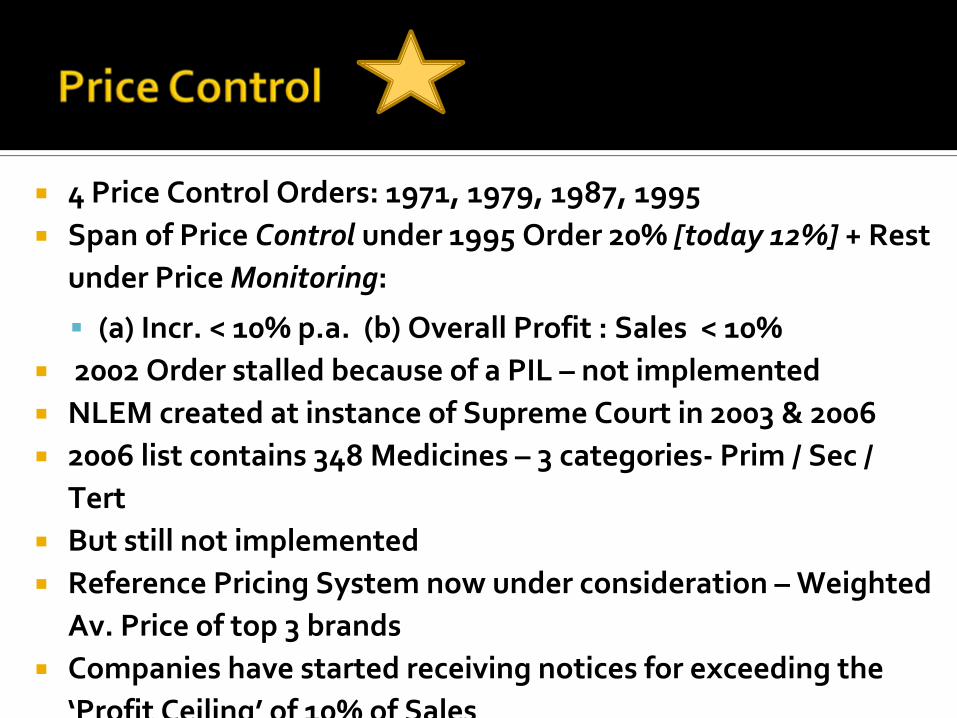
4 Price Control Orders: 1971, 1979, 1987, 1995Span of Price Control under 1995 Order 20% [today 12%] + Rest under Price Monitoring:
(a) Incr. < 10% p.a. (b) Overall Profit : Sales < 10%2002 Order stalled because of a PIL – not implementedNLEM created at instance of Supreme Court in 2003 & 20062006 list contains 348 Medicines – 3 categories‐ Prim / Sec / TertBut still not implementedReference Pricing System now under consideration –Weighted Av. Price of top 3 brandsCompanies have started receiving notices for exceeding the ‘Profit Ceiling’ of 10% of Sales

1.
Pre & Post Grant Opposition + Revocation Proceedings
2.
No Regulatory Data Protection
3.
No Improvements recognized without proven efficacy testing
4.
Threat of Compulsory Licensing (on commercial considerations
5.
Almost no Preliminary Injunctions

1.
‘EXPLORER’
(versus Harvester)
2.
‘COST CONSCIOUS INNOVATOR’
(versus large R&D spends)
3.
GO INDIAN (List Company on Indian Sock Exchanges)
& at all times:a)
Think and Act Local
b)
Devolve authority
c)
Have patience and do things the ‘Indian’
way

Tata values
• Integrity: Fair, honest & transparent in all dealings
• Understanding: Care, respect, compassion for customers and colleagues
• Excellence: Highest possible standards in quality of goods & services
• Unity: Strong relationships with partners and customers
• Responsibility: What comes from the people must go back to the people – many times over

Tata Sons
3%
18%
Tata Industries
49.5% 50.5%
Public trusts
Tata companies
Individuals
Other Corporates
Other Tata companies
Tata Sons & its Subsidiaries
Promotes group entry into new businesses
Shareholding in main Operating Companies
Invests to facilitate growth of main Operating Companies

''In a free enterprise, the Community is not just another stakeholder of the
business but its very purpose''Jamshetjee
Tata
Top Related