


Languages
Pages
Legal


This document is made available electronically by the Minnesota Legislative Reference Library as part of an ongoing digital archiving project. http://www.leg.state.mn.us/lrl/lrl.asp
MINNESOTA DEPARTMENT OF HUMAN SERVICES2009 4.0 CAHPS@ SURVEY
2009 Managed Care Public Programs Consumer Satisfaction Survey ResultsProject Evaluation Report
DataStat, Inc.July 2009
1.0 Introduction
This report summarizes the sample preparation, field work, and results of the 2009 CAHPS® 4.0 surveyconducted for the Minnesota Department of Human Services, offers comments on this year's project andmakes suggestions for the 2010 survey.
The adult members of six publicly funded managed care programs were the focus of this year's survey.The programs and their target age groups are:
Family & Children - MA (F&C-MA; formerly the Prepaid Medical Assistance Program): 18-64MinnesotaCare: 18-64Minnesota Senior Care (MSC): 65 and overMinnesota Senior Health Options (MSHO): 65 and overMinnesota Disabled Health Options (MnDHO): 18-64Special Needs Basic Care (SNBC): 18-64
Nine health plans that participate in one or more of these programs were part of the project. The surveyitself was administered over a ten-week period in the winter of2009, using a mixed mode, five-waveprotocol. The survey was conducted in English and Spanish.
2.0 Sampling
The survey drew as potential respondents adult members 18 years of age or older who were currentenrollees of one of the six programs named above, and had been enrolled for five out of the last sixmonths of 2008. The sample design called for a random sample of 900 respondents in each of 28plan/program subgroups. Four MinnesotaCare, seven Minnesota Senior Care, three MSHO, and sixSNBC plans did not have at least 900 eligible enrollees; these plans were combined (within theirrespective programs) and treated as a single reporting unit. Five plans had enough cases in their sampleframes but insufficient cases after deduplication; for these sample groups, all eligible emollees wereretained for the survey. The final selected sample was 24,823 (see Appendix A).
3.0 Field Work
Protocol. The 2009 survey used was an adaptation of the CAHPS® 4.0H Adult Medicaid questionnaire.Two versions were created this year: one with 65 items, including 22 supplemental questions, for F&CMA, MinnesotaCare, MnDHO, and SNBC; and the other with 69 items, including 28 supplementalquestions, for Minnesota Senior Care and MSHO. All letters were printed in English, with a Spanishtranslation on the back inviting respondents to contact DataStat if they wished to complete the survey inSpanish. Given the lack of requests for Spanish mail questionnaires over the past three years, no Spanishsecond mail questionnaires were prepared this year. Respondents who preferred to participate in Spanishwere contacted during the phone follow-up. In addition, a language block on the backside in Spanish,Vietnamese, Hmong, Russian and Somali let respondents with these native languages know that thesurvey was being administered in English and Spanish, and that they could call DataStat to have theirname removed from the sample list if they did not wish to participate. All mail materials werecustomized with plan-specific logos and signatures.
A mixed-mode (mail and telephone) five-wave protocol was adopted, consisting of a prenote letter, a firstquestionnaire packet, a reminder letter, a second mail questionnaire packet, and finally a phone follow-upto all selected individuals who had not responded to the mailings.
20094.0 CAHPS® Survey - Evaluation ReportDataStat, IncJuly 2009
2

The 10-week field calendar was as follows:
Prenote letter:First mail packet:Reminder letter:Second mail packet:Phone follow-up:Field end:
February 2, 2009February 9, 2009February 18, 2009March 9, 2009March 25, 2009April 20, 2009
Results. Completeness was defined using NCQA guidelines: questionnaires were considered complete ifrespondents did not say 'No' at Question 1 ("Our records show that you are now in <Name of healthplan>") and if they provided a valid response to at least one question. In 2009, complete questionnaireswere obtained from a total of 11,492 enrollees; the overall response rate was 50.0%. See Appendix A forresponse rates by program and plan subgroup.
4.0 Comments and suggestions
Sample frame. Once again, the sample frame was prepared by DHS and delivered to DataStat with asubgroup identifier. This was much appreciated it expedites the sampling process at the start of theproject, allowing us to get into the field quickly in January.
Subgroup sample size and completes. The sample size of 900 cases per subgroup, maintained from 2008,yielded good results. The target goal was at least 300 completes in each of the subgroups for analysis, fora total of 8,400 completes (33%). As in 2008, the 2009 overall response rate and number of completessurpassed the target. Response rates for each of the six programs ranged from 33% to 67%. The targetnumber of completes was easily met for all subgroups in all programs except F&C-MA, where severalsample groups fell short. While the same subgroups over the past several years have fallen short of thedesired target, of note is that the response rates and number of completes in these groups continue to showimprovement, along with all other subgroups.
Performance patterns this year were similar to years past: higher proportions of undeliverables and nonresponders among F&C-MA groups; highest percentage of ineligibles due to language barriers amongMinnesota Senior Care respondents; and a relatively high proportion of non-working phone numbersacross all subgroups during the phone follow-up.
To increase the number of completes for subgroups that continue to fall short, one reliable option toconsider for next year is to oversample in these groups alone, rather than increasing the sample size for allsample groups. Oversamples for shortfall groups would be calculated based on their performance overthe past couple of years. While oversampling would increase costs marginally, the benefit would be agreater number of completes for these sample groups, and, for some questions, sufficient cases forsignificance testing. An assessment of non-responders in F&C-MA shortfall groups showed that fewwere ineligible; the contact and call records reveal that these enrollees simply did not respond after 4mailings and 6-9 phone calls over the course of the 10 weeks. Consequently, it is unlikely that extendingthe field period (with a third mailing or more calls) will pull in more completes. Oversampling for thesegroups would be the more productive route to take.
Questionnaires. Use of the two versions for the six programs this year worked well, with no stickingpoints or troublesome skips.
Field calendar. The field calendar was 10 weeks, with an extra couple of days at the end to help increasecompletes in the' shortfall' groups. Although no health plans have yet opted to use these data for NCQA
20094.0 CAHPS® Survey - Evaluation ReportDataStat, IncJuly 2009
3
submission, the early start and mail material preparation in late fall allows for a smooth field period, andthe option to fold these data into an NCQA submission remains a possibility. We would opt forcontinuing with the same field calendar and dates.
Languages. Response from Spanish speakers was low. There were no requests for Spanish during themail phase. Of the 15,520 cases that went into the phone follow-up, 123 of them (0.8%) were Spanishspeakers, and 38 of those completed interviews.
About 3.6% of cases (900 out of24,823) were classified as ineligible due to a language barrier. Some ofthese were detected by calls to the 800 number, but most were identified during the phone follow-up. Areview of the call notes showed that most, but by no means all, were among the four languages used onthe letters: Vietnamese, Hmong, Russian and Somali. Neither the 800-number staff nor the interviewersreported any dissatisfaction from these callers or households. In the final dataset, these language groupsappear to be well represented: about 7.9% of respondents reported speaking a home language (languageused most often at home) other than English or Spanish, with the four above languages dominating.
Based on this year's experience, we see no reason to make changes to the language offerings or protocolin next year's survey. We would opt to continue to field the mail questionnaires in English and offerSpanish during the phone follow-up.
Combined CAHPS®/HEDIS® project. As mentioned, no plans opted to use the data from this year'sadministration for the purposes ofNCQA submission. Nonetheless, plans that may wish to do so in thefuture will need to increase their sample sizes to meet NCQA requirements, currently at 1350 cases foradult Medicaid surveys.
NCBD submission. Nine datasets-one per health plan-were submitted to NCBD on behalf ofMinnesota DHS in June and accepted for inclusion in the 2009 CAHPS Health Plan Survey Database. Acopy of these datasets is included in the final delivery.
Summary report. The format of the Summary Report remains the same as last year, with updates tocontent to accommodate the new programs and plan groups. The presentation is straightforward, withresults presented primarily through tables and graphs, rather than word descriptions. This makes for alogical, accessible report, with pertinant information for both health care management and the generalpublic. With the current set of supplemental questions and the new programs and plan groups, the reporthas increased in length.
5.0 Conclusions
This year's administration of the CAHPS® survey went very well. No problems were encountered duringfieldwork and delivery deadlines were met without delay. This year's field performance exceeded resultsfrom 2008, a combined result of robust sample sizes and higher response rates. To overcome remainingshortfalls in completes, sample sizes for selected subgroups can be increased in 2010. With these minoradjustments to the project, we're looking forward to another smooth ride for the 2010 administration ofthe CAHPS® survey.
2009 4.0 CAHPS® Survey - Evaluation ReportDataStat, IncJuly 2009
4

Appendix A: Selected sample andfinal disposition, by program and reporting unitMinnesota Department ofHuman Services2009 CAHPS Survey
Program Reporting Unit
July 2009
Refusal/Blank: Member verbally refilses to participate or returns blank survey (M32+T32)
BadAddress/Phone: Member address is bad and not reached by phone; member address and phone are bad (M23 +T23)NonResponse: No response by mail or phone. with no evidence that both address and phone are bad (M33 +T33)
PMAP Total 32.6% 7940 2488 1429 1059 161 143 5 307 296 4540BluePlus (strata=OI) 34.1% 900 295 164 131 16 18 1 48 18 504FirstPlan (strata=02) 36.2% 900 322 209 113 11 0 0 29 21 517HealthPartners (strata=03) 26.4% 900 225 104 121 14 35 0 30 43 553IMCare (strata=04) 34.6% 740 248 126 122 23 0 0 51 13 405Medica (strata=05) 30.1% 900 257 145 112 25 21 0 25 42 530Metro HP (strata=06) 21.9% 900 190 114 76 16 17 0 27 73 577PrimeWest (strata=07) 37.1% 900 327 193 134 17 0 1 44 16 495SCRA (strata=08) 36.1% 900 316 176 140 18 5 2 35 17 507Ucare (strata=09) 37.1% 900 308 198 110 21 47 1 18 53 452
MinnesotaCare Total 52.5% 5400 2725 1951 774 141 55 13 226 90 2150BluePlus (strata=10) 58.7% 900 513 376 137 22 3 1 49 7 305FirstPlan (strata=11) 55.4% 900 480 360 120 30 0 3 39 1 347HealthPartners (strata=12) 41.8% 900 361 230 131 17 17 2 44 24 435IMCIMHPIPW/SCRA (strata=13) 54.9% 900 472 336 136 36 3 1 31 23 334Medica (strata=14) 49.5% 900 429 306 123 20 12 2 34 20 383Ucare (strata=15) 54.7% 900 470 343 127 16 20 4 29 15 346
Senior Care Total 52.2% 2658 1138 896 242 27 310 140 177 57 809B1uePIus (strata=16) 52.5% 858 390 286 104 10 47 58 52 13 288Medica (strata=17) 52.6% 900 356 304 52 4 188 31 66 18 237Seven MCOs (strata=18) 51.5% 900 392 306 86 13 75 51 59 26 284
MSHO Total 67.1% 6225 3683 3104 579 40 353 340 308 85 1416BluePlus (strata=19) 69.3% 900 570 453 117 4 20 54 49 9 194HealthPartners (strata=20) 54.7% 900 402 332 70 8 127 30 40 15 278Medica (strata=21) 63.2% 900 493 404 89 3 66 51 56 15 216PrimeWest (strata=22) 73.8% 875 600 517 83 6 1 55 55 8 150SCRA (strata=23) 74.2% 850 577 504 73 6 6 60 52 6 143Ucare (strata=24) 64.4% 900 479 418 61 5 106 45 22 20 223FPIIMCIMHP (strata=25) 68.5% 900 562 476 86 8 27 45 34 12 212
MNDHO Total- UCare (strata=26) 53.1% 820 403 296 107 3 32 26 25 31 300
SNBC Total 61.3% 1780 1055 851 204 19 7 34 59 39 567B1uePIus (strata=27) 60.7% 880 520 411 109 10 4 9 28 21 288Six MCOs (strata=28) 62.0% 900 535 440 95 9 3 25 31 18 279
TOTAL 50.0% 24823 11492 8527 2965 391 900 558 1102 598 9782
Legend (in parentlreses=NCQA disposition code)Response rate: Total usables / Total selected - IneligiblesTotal Selected: Number ofcases in sampleTotal Usables: Mailusables + Phone usablesMail Usables: Complete questionnaires received by mail (MiO)Phone Usables: Complete questionnaires done by phone (TIO)ineligible - Population Criteria: does not meet enrollment or age criteria (M2I +T2I)Ineligible - Language: Member did not read/speak language in which survey was administered (M22+ T22)Ineligible - Deceased/Unable: Member deceased/Member physically or mentally incapacitated and unable to complete questionnaire (M20+ T20 + M2-1 +T2-1)
DataStat Inc.Evaluation Report
July 2009


For more information contact:
Robert Lloyd, Manager, Health Program Quality
Performance Measurement and Quality Improvement
Minnesota Department of Human Services
P.O. Box 64986
St. Paul, MN 55164-0986
Telephone: 651-431-2613
Fax: 651-431-7422
This information, along with previous CAHPS survey reports, is available on the
Minnesota Department of Human Services website
This information is available in alternative formats to individuals with disabilities by calling your agency at
651-431-2616. TTY users can call through Minnesota Relay at 800-627-3529.
For the Speech-to-Speech, call 877-627-3848.
For additional assistance with legal rights and protections for equal access to human services benefits,
contact your agency's ADA coordinator.
This report may be reproduced without restriction.
Citation of the source is appreciated.
July 2009
Pagei
Key Findings
About the 2009 Survey
Program Comparisons
Plan-Specific Comparisons - F&C-MA
Plan-Specific Comparisons - MinnesotaCare
Plan-Specific Comparisons - MSC/MSC+
Plan-Specific Comparisons - MSHO
Plan-Specific Comparisons - MnDHO
Plan-Specific Comparisons - SNBC
Health Plan Opportunities for Improvement
Supplemental Questions
Technical Notes
Respondent Characteristics
Page ii
01
04
07
10
17
24
31
38
45
52
56
82
87

Information obtained from consumer satisfaction surveys allows managed care organizations (health plans) to measure how well theyare meeting their members' expectations and needs. Surveys can also reveal areas of recent improvement and highlight other areasneeding attention to improve the quality of care provided.
Detailed findings from the 2009 Managed Care Public Programs Consumer Satisfaction Survey are presented throughout this report.This section highlights the Key Findings.
Average plan scores for satisfaction ratings and composites are compared using a difference-of-means statistical test. Key Findingsare defined as those plan scores that are significantly higher or lower than the program average, for the program in which that planparticipates.
Key Findings are based on a comparison of the survey data from the following programs, and the plans that cover the populationsthey serve.
• Families and Children - MA (F&C-MA)• MinnesotaCare• Minnesota Senior Care / Minnesota Senior Care Plus (MSC/MSC+)• Minnesota Senior Health Options (MSHO)• Minnesota Disability Health Options (MnDHO)• Special Needs Basic Care (SNBC)
Page 1

RatingsThe following plans rated significantly lower than the F&C-MA average:
.. Metropolitan Health Plan for Rating of all health care and Rating of health plan
The following plans rated significantly higher than the F&C-MA average:.. HealthPartners for Rating of health plan.. South Country Health Alliance for Rating of health plan
CompositesThe following plans rated significantly higher than the F&C-MA average:
.. FirstPlan Blue for Getting Care Quickly
.. PrimeWest Health for Getting Care Quickly
.. South Country Health Alliance for How Well Doctors Communicate
CompositesThe following plans rated significantly lower than the MinnesotaCare average:
.. HealthPartners for Getting Care Quickly
The following plans rated significantly higher than the MinnesotaCare average:.. FirstPlan Blue for Getting Care Quickly
No significant differences were observed for any plans in Minnesota Senior Care I Minnesota Senior Care Plus.
Page 2

RatingsThe following plans rated significantly lower than the MSHO average:
• HealthPartners for Rating of health plan
The following plans rated significantly higher than the MSHO average:• PrimeWest Health for Rating of all health care and Rating of health plan
CompositesThe following plans rated significantly higher than the MSHO average:
• PrimeWest Health for Getting Care Quickly
No significant differences were observed for any plans in Special Needs Basic Care.
Page 3
Who sponsored the survey?
The 2009 Managed Care Public Programs Consumer Satisfaction Survey was conducted by DataStat, Inc., an NCQA-certifiedCAHPS® vendor, under contract with the Minnesota Department of Human Services (DHS).
Why was the survey done?
The survey was designed to assess and compare the satisfaction of enrollees in public managed care programs administered by theMinnesota Department of Human Services (DHS). DHS conducts a consumer satisfaction survey of managed care enrollees everyyear.
What survey instrument was used?
The standardized survey instrument chosen for this study was the Consumer Assessment of Health Plans Survey (CAHPS®) 4.0HMedicaid Core Module. The core instrument includes 51 questions. The instrument assesses such topics as: how well doctorscommunicate; getting care without long waits; getting care that is needed; health plan customer service; and overall satisfaction withhealth plans and health care. DHS added questions to assess topics such as immunization, behavioral health and care coordination.
Who was surveyed?
The survey included six core publicly funded managed care population groups:• Families and Children - MA (F&C-MA)• MinnesotaCare• Minnesota Senior Care / Minnesota Senior Care Plus (MSC/MSC+)• Minnesota Senior Health Options (MSHO)• Minnesota Disability Health Options (MnDHO)• Special Needs Basic Care (SNBC)
In this report, all references to Minnesota Senior Care include the Minnesota Senior Care Plus population.
How was the data collected?
The survey was administered from February 2009 through April 2009. Each respondent received up to four waves of mail, andtelephone interview call attempts were made to non-responders. Participation in the survey was entirely voluntary and all datacollected is kept confidential. The mailing materials were sent in English and contained instructions in Spanish that told respondentsthey could complete the questionnaire in Spanish by calling an 800 number. In addition, a language block on the backside in Hmong,Russian, Somali, and Vietnamese let respondents with these native languages know that the survey was being administered inEnglish and Spanish, and that they could call DataStat to have their names removed from the sample list if they did not wish toparticipate.
Page 4
How was the data analyzed?
Data analysis was conducted in order to produce results for three levels of comparison reporting:
Program Level: overall comparisons of the six core population groups: Families and Children - MA (F&C-MA),MinnesotaCare, Minnesota Senior Care I Minnesota Senior Care Plus (MSC/MSC+), Minnesota Senior Health Options(MSHO), Minnesota Disability Health Options (MnDHO), and Special Needs Basic Care (SNBC).
• Health Plan Specific: comparisons of the managed care health plans participating in F&C-MA, MinnesotaCare, MSCIMSC+, MSHO, MnDHO and SNBC.
Aggregate Level: analysis was conducted for F&C-MA, MinnesotaCare, MSC/MSC+, MSHO, MnDHO and SNBC inorder to understand areas where these programs could improve quality and service and assist in assigning priorities toimprovement goals.
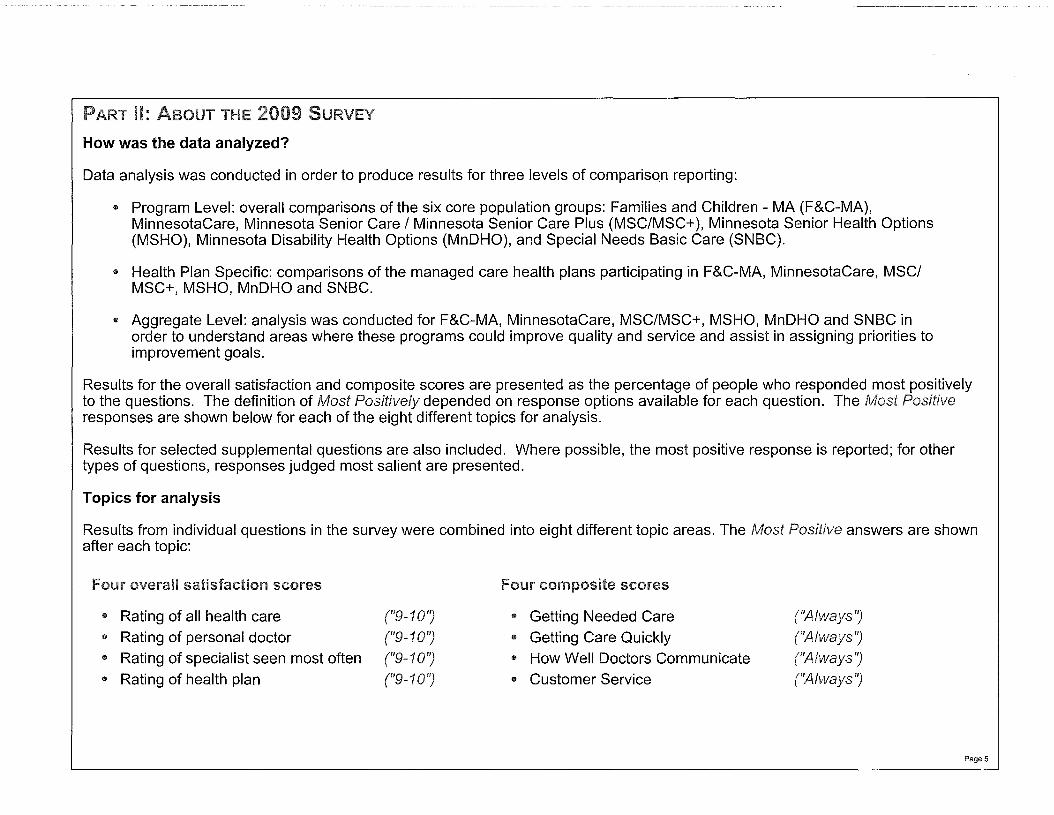
Results for the overall satisfaction and composite scores are presented as the percentage of people who responded most positivelyto the questions. The definition of Positively depended on response options available for each question. The Positiveresponses are shown below for each of the eight different topics for analysis.
Results for selected supplemental questions are also included. Where possible, the most positive response is reported; for othertypes of questions, responses judged most salient are presented.
Topics for analysis
Results from individual questions in the survey were combined into eight different topic areas. Theafter each topic:
answers are shown
Rating of all health careRating of personal doctorRating of specialist seen most oftenRating of health plan
Getting Needed Care" Getting Care Quickly@ How Well Doctors Communicate
• Customer Service
PageS

Quantity Eligible Response CasesInru ,I .J!.: for for-Jr"~._.~._.1 mailed analysis rate analysis The study had a goal of receiving at least 300 returned
F&C-MA questionnaires for each health plan or plan group in
Blue Plus 900 865 34% 295 each of six populations: 28 sample groups in all.
FirstPlan Blue 900 889 36% 322 To achieve this goal, the sample was designed to selectHealthPartners 900 851 26% 225 900 enrollees from each sample group. Several plans inItasca Medical Care 740 717 35% 248 the MinnesotaCare, Minnesota Senior Care, MSHO and
Medica 900 854 30% 257 SNBC populations did not have at least 900 eligible
Metropolitan Health Plan 900 867 22% 190enrollees, so they were combined and treated as asingle reporting unit. For single plans with insufficient
PrimeWest Health 900 882 37% 327 enrollees to achieve the target sample of 900, all eligibleSouth Country Health Alliance 900 875 36% 316 enrollees were selected. A total of 24,823 enrollees
UCare 900 831 37% 308 across all programs were selected to participate in them,,· ,..
-esurvey.
Blue Plus 900 874 59% 513 Questionnaires were mailed to all selected enrollees.FirstPlan Blue 900 867 55% 480 Enrollees who did not return a mail questionnaireHealthPartners 900 864 42% 361 received telephone calls and were offered the
Medica 900 866 50% 429 opportunity to complete the questionnaire over the
UCare 900 860 55% 470telephone. During the course of the survey, somesampled enrollees were determined to be ineligible.
IMCare / MHP / PW / SCHA 900 860 55% 472 Some were no longer enrolled; some were deceased;M~-'M~- others had language problems or incapacities that-
Blue Plus 858 743 52% 390 prevented them from completing the interview.
Medica 900 677 53% 356 The study response rate is the percentage of those whoFirstPlan Blue / HP / IMCare / MHP / 900 761 52% 392 completed an interview among all those who werePW / SCHA / UCare eligible to participate. Completed interviews were
MSHO obtained from 11,492 enrollees. The study response rateBlue Plus 900 822 69% 570 was 50.0%.
HealthPartners 900 735 55% 402Key to Managed Care Organizations:
Medica 900 780 63% 493PrimeWest Health 875 813 74% 600 · BluePlus (BluePlus)South Country Health Alliance 850 778 74% 577 · FirstPlan Blue of Minnesota (FirstPlan Blue)UCare 900 744 64% 479 · HealthPartners (HealthPartners)
FirstPlan Blue / IMCare / MHP 900 820 69% 562 · Itasca Medical Care (IMCare)
· Medica Health Plans (Medica)MnDHO · Metropolitan Health Plan (MHP)
UCare 820 759 53% 403 · PrimeWest Health (PrimeWest)SNBC · South Country Health Alliance (SCHA)
Blue Plus 880 857 61% 520 · UCare (UCare)
FirstPlan Blue / Medica / MHP / PW /SCHA/ UCare 900 863 62% 535 Page 6

Introduction
This section of the report shows overall comparisons of the six core population groups.
It Families and Children - MAIt MinnesotaCareIt Minnesota Senior Care / Minnesota Senior Care PlusIt Minnesota Senior Health OptionsIt Minnesota Disability Health OptionsIt Special Needs Basic Care
The survey results were adjusted for age and health status for all six programs using a regression technique that statisticallycontrolled for variations, so that managed care organizations with varying numbers of older or more ill people could be comparedfairly with other managed care organizations. Statistical testing of differences between health plans was based on adjusted results.
The first pages of this section show the percentage of enrollees who responded most positively (9 or 10) on the four overall surveyquestions that asked enrollees to rate their health care, doctor, specialist, and health plan.
The next pages show the percentage of enrollees who responded most positively (or "Always") to questions that formed the fourcomposite topics: Getting Needed Care, Getting Care Quickly, How Well Doctors Communicate and Customer Service.
When comparing ratings and percentages, the reader should ignore small differences between numbers. These small differencesmay reflect sampling variation rather than real differences.
Page 7

o 1 2 3 4 5 6 7 8 9 10The survey had questions that asked people to rate the health care thatthey received from their health plan and health care providers. Thesequestions asked people to give an overall rating by marking anynumber on a scale from 0 to 10, where 0 = "worst possible" and 10 ="best possible".
For each program, the number in the table shows the percent of allpeople who responded most positively (9 or 10) to these questions.
Worst
possible
Best
possible
Rating of Rating of Rating of Rating ofall health personal specialist healthseen mostcare doctor
oftenplan
F&C-MA 48% 67% 56%) 540/0
MinnesotaCare 52% 64% 64% 55%
MSC/MSC+ 56% 720/0 65% 66%
MSHO 64% 78% 71% 75%
MnDHO 48% 63% 64%) 55°!c>
SNBC 51°!c> 68% 61% 60%
Page 8

The survey had a series of questions that asked people to rate howoften:
• They got needed care• They got care without long waits• Their doctors communicated well• Their health plan's customer service was helpful and
courteous
These questions asked people to give a rating by marking Never,Sometimes, Usually, or Always.
For each program, the numbers in the table show the percent of allpeople who responded most positively (or "Always") to these questions.
Never Sometimes
Worst
possible
Usually Always
Best
possible
Getting Getting CareHow Well CustomerDoctors
Needed Care Quickly Communicate Service
F&C-MA 52% 56% 77% 580/0
MinnesotaCare 61% 59% 75% 62%)
MSC/MSC+ 52% 590/0 73% 61%
MSHO 620/0 67%) 77% 69%
MnDHO 50% 51% 720/0 55%
SNBC 55% 590/0 74% 65%
Page 9
Introduction
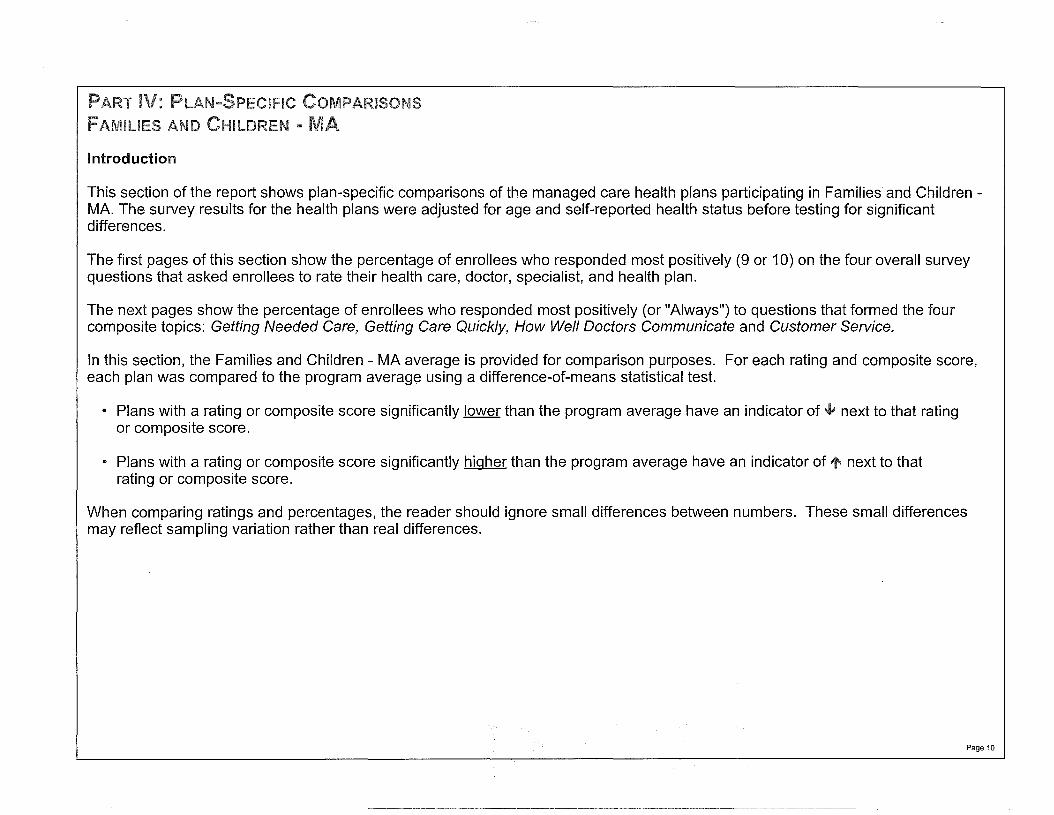
This section of the report shows plan-specific comparisons of the managed care health plans participating in Families and Children MA. The survey results for the health plans were adjusted for age and self-reported health status before testing for significantdifferences.
The first pages of this section show the percentage of enrollees who responded most positively (9 or 10) on the four overall surveyquestions that asked enrollees to rate their health care, doctor, specialist, and health plan.
The next pages show the percentage of enrollees who responded most positively (or "Always") to questions that formed the fourcomposite topics: Getting Needed Care, Getting Care Quickly, How Well Doctors Communicate and Customer Service.
In this section, the Families and Children - MA average is provided for comparison purposes. For each rating and composite score,each plan was compared to the program average using a difference-of-means statistical test.
• Plans with a rating or composite score significantly lower than the program average have an indicator of next to that ratingor composite score.
• Plans with a rating or composite score significantly higher than the program average have an indicator of next to thatrating or composite score.
When comparing ratings and percentages, the reader should ignore small differences between numbers. These small differencesmay reflect sampling variation rather than real differences.
Page 10

The survey had questions that asked people to rate the health care thatthey received from their health plan and health care providers. Thesequestions asked people to give an overall rating by marking anynumber on a scale from 0 to 10, where 0 ="worst possible" and 10 ="best possible".
o 1 2 3 4 5 6 7 8 9 10
Worst Best
For each health plan, the number in the table shows the percent of allpeople who responded positively by giving a score of 9 or 10. Theaverage of all plans in F&C-MA is shown as the F&C-MA Average.
possible possible
Rating of Rating ofRating of all personal
specialist Rating ofhealth care doctor seen most health plan
often
F&C-MA Average 48% 67% 56% 54%
Blue Plus 50% 69% 61% 50%
FirstPlan Blue 45% 66% 58% 51%
HealthPartners 50% 69% 51% 63%
Itasca Medical Care 45% 66% 57% 48%
Medica 51% 67% 49% 55%
Metropolitan Health Plan 40% 70% 57% 51%
PrimeWest Health 51% 61% 54% 53%
South Country Health Alliance 50% 71% 47% 64%
UCare 51% 66% 64% 54%
Page 11indicates a ra~ing .signific~mtly high~r/l.o,,:,er.than the F&~-~A prC?gr~m average

indicates a rating significantly higher/lower than the F&C-MA program average(see Appendix A: Technical Notes: Limitations and Statistical Signficance)
F&C-MA Average
Blue Plus
FirstPlan Blue
HealthPartners
Itasca Medical Care
Medica
Metropolitan Health Plan
PrimeWest Health
South Country Health Alliance
UCare
0% 10% 20% 30% 40% 50% 70% 80% 90% 100%
0% 10% 20% 30% 40% 50% 60% 70% 80% 90% 100%
F&C-MA Average
Blue Plus
FirstPlan Blue
HealthPartners
Itasca Medical Care
Medica
Metropolitan Health Plan
PrimeWest Health
South Country Health Alliance
UCare
indicates a rating significantly higher/lower than the F&C-MA program average(see Appendix A: Technical Notes: Limitations and Statistical Signficance)
Page 12

F&C-MA Average
Blue Plus
FirstPlan Blue
HealthPartners
Itasca Medical Care
Medica
Metropolitan Health Plan
PrimeWest Health
South Country Health Alliance
UCare
30% 40% 50% 60% 70% 80% 90%
1''''' indicates a rating significantly higher/lower than the F&C-MA program average(see Appendix A: Technical Notes: Limitations and Statistical Signficance)
0% 10% 20% 30% 40% 50% 60% 70% 80% 90% 100%
F&C-MA Average
Blue Plus
FirstPlan Blue
HealthPartners
Itasca Medical Care
Medica
Metropolitan Health Plan
PrimeWest Health
South Country Health Alliance
UCare
indicates a rating significantly higher/lower than the F&C-MA program average(see Appendix A: Technical Notes: Limitations and Statistical Signficance)
Page 13

The survey had a series of questions that asked people to rate howoften:
.. Their doctors communicated well• They got care without long waits• They got needed care• Their health plan's customer service was helpful and
courteous
These questions asked people to give a rating by marking Never,Sometimes, Usually, or Always.
For each health plan, the numbers in the table show the percent of allpeople who responded most positively (or "Always") to these questions.
Never Sometimes
Worst
possible
Usually Always
Best
possible
Getting Getting CareHowWefl
CustomerDoctorsNeeded Care Quickly Communicate Service
F&C-MA Average 52% 56% 77% 58%
Blue Plus 54% 52% 80% 51%
FirstPlan Blue 54% 63% ~ 74% 63%
HealthPartners 51% 58% 74% 64%
Itasca Medical Care 49% 47% 78% 57%
Medica 44% 53% 80% 60%
Metropolitan Health Plan 53% 52% 75% 45%
PrimeWest Health 52% 60% ~ 76% 57%
South Country Health Alliance 54% 55% 81% ~ 66%
UCare 55% 57% 74% 58%
indicates a rating significantly higher/lower than the F&C-MA program average(see Appendix A: Technical Notes: Limitations and Statistical Signficance)
Page 14

0% 10% 20% 30% 40% 50% 60% 70% 80% 90% 100%
F&C-MA Average
Blue Plus
FirstPlan Blue
HealthPartners
Itasca Medical Care
Medica
Metropolitan Health Plan
PrimeWest Health
South Country Health Alliance
UCare
indicates a rating significantly higher/lower than the F&C-MA program average(see Appendix A: Technical Notes: Limitations and Statistical Signficance)
Page 15

0% 10% 20% 30% 40% 50% 60% 70% 80% 90% 100%
F&C-MA Average
Blue Plus
FirstPlan Blue
HealthPartners
Itasca Medical Care
Medica
Metropolitan Health Plan
PrimeWest Health
South Country Health Alliance
UCare
indicates a rating significantly higher/lower than the F&C-MA program average(see Appendix A: Technical Notes: Limitations and Statistical Signficance)
Page 16
Introduction
This section of the report shows plan-specific comparisons of the managed care health plans participating in MinnesotaCare. Thesurvey results for the health plans were adjusted for age and self-reported health status before testing for significant differences.
The first pages of this section show the percentage of enrollees who responded most positively (9 or 10) on the four overall surveyquestions that asked enrollees to rate their health care, doctor, specialist, and health plan.
The next pages show the percentage of enrollees who responded most positively (or "Always") to questions that formed the fourcomposite topics: Getting Needed Care, Getting Care Quickly, How Well Doctors Communicate and Customer Service.
In this section, the MinnesotaCare average is provided for comparison purposes. For each rating and composite score, each planwas compared to the program average using a difference-of-means statistical test.
.. Plans with a rating or composite score significantly lower than the program average have an indicator of next to that ratingor composite score.
.. Plans with a rating or composite score significantly higher than the program average have an indicator of next to thatrating or composite score.
When comparing ratings and percentages, the reader should ignore small differences between numbers. These small differencesmay reflect sampling variation rather than real differences.
Page 17

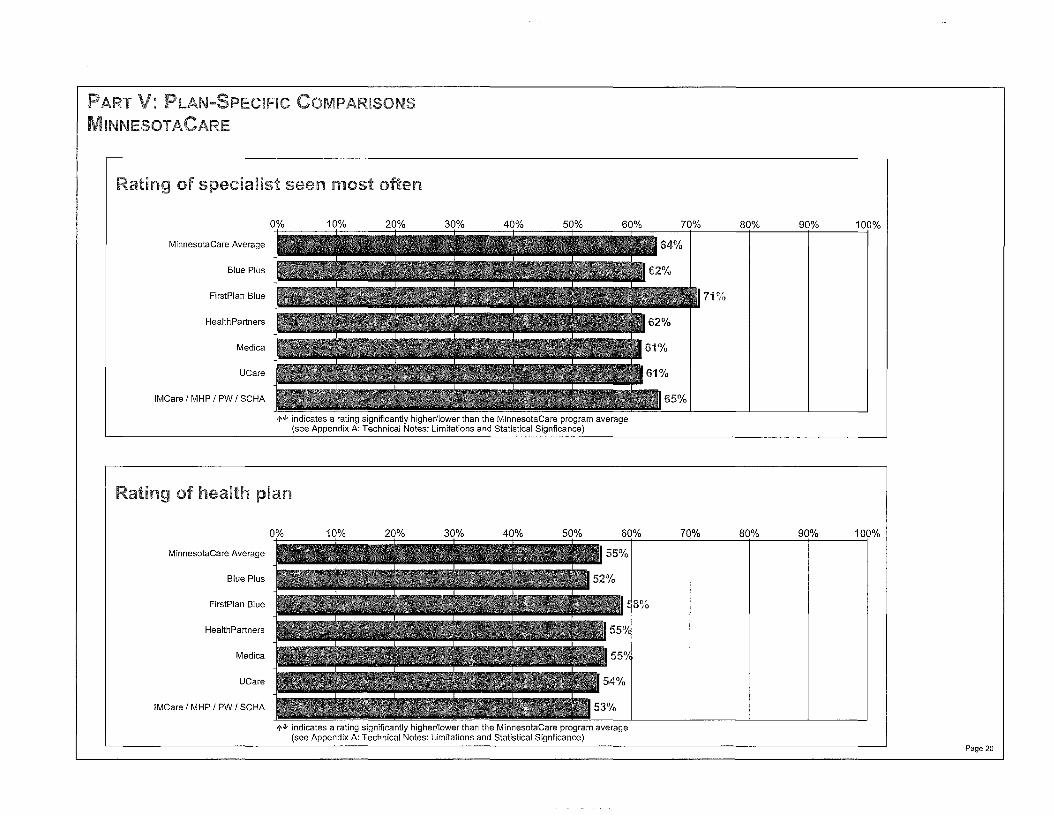
The survey had questions that asked people to rate the health care thatthey received from their health plan and health care providers. Thesequestions asked people to give an overall rating by marking anynumber on a scale from 0 to 10, where 0 ="worst possible" and 10 ="best possible".
o 1 2 3 4 5 6 7 8 9 10
Worst Best
For each health plan, the number in the table shows the percent of allpeople who responded positively by giving a score of 9 or 10. Theaverage of all plans in MinnesotaCare is shown as the MinnesotaCareAverage.
possible possible
Rating ofRating of
Rating of all personal specialist Rating ofhealth care doctor seen most health plan
often
MinnesotaCare Average 52% 64% 64% 55%
Blue Plus 49% 62% 62% 52%
FirstPlan Blue 57% 67% 71% 58%
HealthPartners 53% 67% 62% 55%
Medica 51% 61% 61% 55%
UCare 55% 65% 61% 54%
IMCare I MHP I PW I SCHA 48% 63% 65% 53%
indicates a rating significantly higher/lower than the MinnesotaCare program average(see Appendix A: Technical Notes: Limitations and Statistical Signficance)
Page 18

0% 10% 20% 30% 40% 50% 60% 70% 80% 90% 100%
MinnesotaCare Average
Blue Plus
FirstPlan Blue
HealthPartners
Medica
UCare
IMCare / MHP / PW / SCHA
indicates a rating significantly higher/lower than the MinnesotaCare program average(see Appendix A: Technical Notes: Limitations and Statistical Signficance)
Page 19
indicates a rating significantly higher/lower than the MinnesotaCare program average(see Appendix A: Technical Notes: Limitations and Statistical Signficance)
MinnesotaCare Average
Blue Plus
FirstPlan Blue
HealthPartners
Medica
UCare
IMCare / MHP / PW / SCHA
0% 10% 20% 30% 40% 50% 70% 80% 90% 100%
0% 10% 20% 30% 50% 60% 70% 80% 90% 100%
MinnesotaCare Average
Blue Plus
FirstPlan Blue
HealthPartners
Medica
UCare
IMCare / MHP / PW / SCHA
indicates a rating significantly higher/lower than the MinnesotaCare program average(see Appendix A: Technical Notes: Limitations and Statistical Signficance)
Page 20

The survey had a series of questions that asked people to rate howoften:
• Their doctors communicated well• They got care without long waits• They got needed care• Their health plan's customer service was helpful and
courteous
These questions asked people to give a rating by marking Never,Sometimes, Usually, or Always.
For each health plan, the numbers in the table show the percent of allpeople who responded most positively (or "Always") to these questions.
Never Sometimes
Worst
possible
Usually Always
Best
possible
I~c:.nt::a Getting Getting Care HowWeJl Customerm___ .. _
Needed Care Quickly Doctors ServiceCommunicate
MinnesotaCare Average 61% 59% 75% 62%
Blue Plus 57% 55% 73% 57%
FirstPlan Blue 63% 64% 77% 68%
HealthPartners 62% 55% 77% 70%
Medica 59% 59% 74% 65%
UCare 62% 62% 78% 56%
IMCare I MHP I PW I SCHA 61% 58% 75% 56%
indicates a rating significantly higher/lower than the MinnesotaCare program average(see Appendix A: Technical Notes: Limitations and Statistical Signficance)
Page 21

indicates a rating significantly higherflower than the MinnesotaCare program average(see Appendix A: Technical Notes: Limitations and Statistical Signficance)
MinnesotaCare Average
Blue Plus
FirstPlan Blue
HealthPartners
Medica
UCare
IMCare / MHP / PW / SCHA
0% 10% 20% 30% 40% 50% 60% 70% 80% 90% 100%
0% 10% 20% 30% 40% 50% 60% 70% 80% 90% 100%
MinnesotaCare Average
Blue Plus
FirstPlan Blue
HealthPartners
Medica
UCare
IMCare / MHP / PW / SCHA
indicates a rating significantly higher/lower thantheMinne~ot1ilCareprogram average(see Appendix A: Technical Notes: Limitations andStatisticaLSignficance)
Page 22

indicates a rating significantly higher/lower than the MinnesotaCare program average(see Appendix A: Technical Notes: Limitations and Statistical Signficance)
MinnesotaCare Average
Blue Plus
FirstPlan Blue
HealthPartners
Medica
UCare
IMCare / MHP / PW / SCHA
0% 10% 20% 30% 40% 50% 60% 70% 80% 90% 100%
MinnesotaCare Average
Blue Plus
FirstPlan Blue
HealthPartners
Medica
UCare
IMCare / MHP / PW / SCHA
.+=- .:.r:-: -=-=r:-: .....:....;~----:....:r:_:_---~r..:.....:....---~..:...::----.:...7_+0°.:...Yo=-----8.:..0+o.:...yo=__ 9.:..0=r°:.,:yo ....:.1....:...,OO%
indicates a rating significantly higher/lower than the MinnesotaCare program average(see Appendix A: Technical Notes: Limitations and Statistical Signficance)
Page 23
Introduction
This section of the report shows plan-specific comparisons of the managed care health plans participating in Minnesota Senior Care /Minnesota Senior Care Plus. The survey results for the health plans were adjusted for age and self-reported health status beforetesting for significant differences.
The first pages of this section show the percentage of enrollees who responded most positively (9 or 10) on the four overall surveyquestions that asked enrollees to rate their health care, doctor, specialist, and health plan.
The next pages show the percentage of enrollees who responded most positively (or "Always") to questions that formed the fourcomposite topics: Getting Needed Care, Getting Care Quickly, How Well Doctors Communicate and Customer Service.
In this section, the Minnesota Senior Care / Minnesota Senior Care Plus average is provided for comparison purposes. For eachrating and composite score, each plan was compared to the program average using a difference-of-means statistical test.
• Plans with a rating or composite score significantly lower than the program average have an indicator of next to that ratingor composite score.
.. Plans with a rating or composite score significantly higher than the program average have an indicator of next to thatrating or composite score.
When comparing ratings and percentages, the reader should ignore small differences between numbers. These small differencesmay reflect sampling variation rather than real differences.
Page 24

The survey had questions that asked people to rate the health care thatthey received from their health plan and health care providers. Thesequestions asked people to give an overall rating by marking anynumber on a scale from 0 to 10, where 0 = "worst possible" and 10 ="best possible".
o 1 2 3 4 5 6 7 8 9 10
Worst Best
For each health plan, the number in the table shows the percent of allpeople who responded positively by giving a score of 9 or 10. Theaverage of all plans in MSC/MSC+ is shown as the MSC/MSC+Average.
possible possible
Rating of Rating ofRating of all personal specialist Rating ofhealth care doctor seen most health plan
often
MSC/MSC+. Av~rage 56% 72% 65% 66%
Blue Plus 59% 73% 71% 68%
Medica 49% 68% 58% 62%
FirstPlan Blue I HP IIMCare I MHP I PW I59% 76% 71% 67%SCHAI UCare
indicates a rating significantly higher/lower than the MSC/MSC+ program average(see Appendix A: Technical Notes: Limitations and Statistical Signficance)
Page 25

0% 10% 20% 30% 40% 50% 60% 70% 80% 90% 100%
MSC/MSC+ Average
Blue Plus
Medica
FirstPlan Blue / HP / IMCare / MHP /PW / SCHA / UCare
indicates a rating significantly higher/lower than the MSC/MSC+ program average(see Appendix A: Technical Notes: Limitations and Statistical Signficance)
0% 10% 20% 30% 40% 50% 60% 70% 80% 90% 100%
MSC/MSC+ Average
Blue Plus
Medica
FirstPlan Blue / HP / IMCare / MHP /PW / SCHA / UCare
indicates a rating significantly higher/lower than the MSC/MSC+ program average(see Appendix A: Technical Notes: Limitations and Statistical Signficance)
Page 26

0% 10% 20% 30% 40% 50% 60% 70% 80% 90% 100%
MSC/MSC+ Average
Blue Plus
Medica
FirstPlan Blue / HP / IMCare / MHP /PW / SCHA / UCare
indicates a rating significantly higher/lower than the MSC/MSC+ program average(see Appendix A: Technical Notes: Limitations and Statistical Signficance)
0% 10% 20% 30% 40% 50% 60% 70% 80% 90% 100%
MSC/MSC+ Average
Blue Plus
Medica
FirstPlan Blue / HP / IMCare / MHP /PW / SCHA / UCare
indicates a rating significantly higher/lower than the MSC/MSC+ program average(see Appendix A: Technical Notes: Limitations and Statistical Signficance)
Page 27
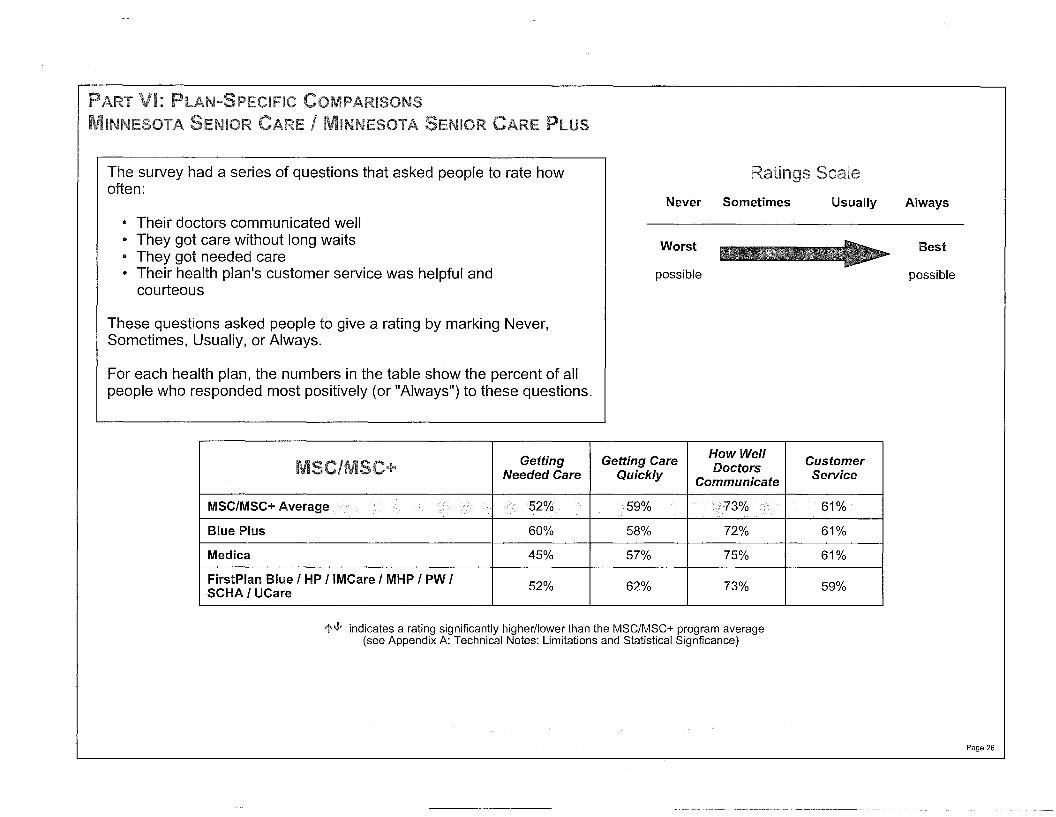
The survey had a series of questions that asked people to rate howoften:
• Their doctors communicated well• They got care without long waits• They got needed care• Their health plan's customer service was helpful and
courteous
These questions asked people to give a rating by marking Never,Sometimes, Usually, or Always.
For each health plan, the numbers in the table show the percent of allpeople who responded most positively (or "Always") to these questions.
Never Sometimes
Worst
possible
Usually Always
Best
possible
Getting Getting Care How WellCustomerMSC/MSC DoctorsNeeded Care Quickly Communicate Service
MSC/MSC+ A'vf;;, a!::lf;; 61%
Blue Plus 60% 58% 72% 61%
Medica 45% 57% 75% 61%
FirstPlan Blue I HP IIMCare I MHP I PW I 52% 62% 73% 59%SCHAI UCare
indicates a rating significantly higher/lower than the MSC/MSC+ program average(see Appendix A: Technical Notes: Limitations and Statistical Signficance)
Page 28

0% 10% 20% 30% 40% 50% 60% 70% 80% 90% 100%
MSC/MSC+ Average
Blue Plus
Medica
FirstPlan Blue / HP / IMCare / MHP /PW / SCHA / UCare
indicates a rating significantly higher/lower than the MSC/MSC+ program average(see Appendix A: Technical Notes: Limitations and Statistical Signficance)
0% 10% 20% 30% 40% 50% 60% 70% 80% 90% 100%
MSC/MSC+ Average
Blue Plus
Medica
FirstPlan Blue / HP / IMCare / MHP /PW / SCHA / UCare
indicates a rating significantly higher/lower than the MSC/MSC+ program average(see Appendix A: Technical Notes: Limitations and Statistical Signficance)
Page 29

0% 10% 20% 30% 40% 50% 60% 70% 80% 90% 100%
MSC/MSC+ Average
Blue Plus
Medica
FirstPlan Blue / HP /IMCare / MHP /PW / SCHA / UCare
indicates a rating significantly higher/lower than the MSC/MSC+ program average(see Appendix A: Technical Notes: Limitations and Statistical Signficance)
0% 10% 20% 30% 40% 50% 60% 70% 80% 90% 100%
MSC/MSC+ Average
Blue Plus
Medica
FirstPlan Blue / HP /IMCare / MHP /PW / SCHA / UCare
indicates a rating significantly higher/lower than the MSC/MSC+ program average(see Appendix A: Technical Notes: Limitations and Statistical Signficance)
Page 30

Introduction
This section of the report shows plan-specific comparisons of the managed care health plans participating in Minnesota Senior HealthOptions. The survey results for the health plans were adjusted for age and self-reported health status before testing for significantdifferences.
The first pages of this section show the percentage of enrollees who responded most positively (9 or 10) on the four overall surveyquestions that asked enrollees to rate their health care, doctor, specialist, and health plan.
The next pages show the percentage of enrollees who responded most positively (or "Always") to questions that formed the fourcomposite topics: Getting Needed Care, Getting Care Quickly, How Well Doctors Communicate and Customer Service.
In this section, the Minnesota Senior Health Options average is provided for comparison purposes. For each rating and compositescore, each plan was compared to the program average using a difference-of-means statistical test.
• Plans with a rating or composite score significantly lower than the program average have an indicator of next to that ratingor composite score.
• Plans with a rating or composite score significantly higher than the program average have an indicator of next to thatrating or composite score.
When comparing ratings and percentages, the reader should ignore small differences between numbers. These small differencesmay reflect sampling variation rather than real differences.
Page 31

possible
Worst Best
o 1 2 3 4 5 6 7 8 9 10
possibleFor each health plan, the number in the table shows the percent of allpeople who responded positively by giving a score of 9 or 10. Theaverage of all plans in MSHO is shown as the MSHO Average.
The survey had questions that asked people to rate the health care thatthey received from their health plan and health care providers. Thesequestions asked people to give an overall rating by marking anynumber on a scale from 0 to 10, where 0 = "worst possible" and 10 ="best possible".
Rating of Rating ofRating of all personal specialist Rating ofhealth care doctor seen most health plan
often
MSHO Average 64% 78% 71 75%
Blue Plus 65% 76% 65% 76%
HealthPartners 61% 77% 71% 67%
Medica 67% 78% 73% 76%
PrimeWest Health 70% 81% 74% 79%
South Country Health Alliance 62% 77% 76% 73%
UCare 59% 76% 71% 72%
FirstPlan Blue IIMCare I MHP 63% 80% 69% 76%
indicates a rating significantly higher/lower than the MSHO program average(see Appendix A: Technical Notes: Limitations and Statistical Signficance)
Page 32

0% 10% 20% 30% 40% 50% 60% 70% 80% 90% 100%
MSHO Average
Blue Plus
HealthPartners
Medica
PrimeWest Health
South Country Health Alliance
UCare
FirstPlan Blue / IMCare / MHP
indicates a rating significantly higher/lower than the MSHO program average(see Appendix A: Technical Notes: Limitations and Statistical Signficance)
indicates a rating significantly higher/lower than the MSHO program average(see Appendix A: Technical Notes: Limitations and Statistical Signficance)
MSHO Average
Blue Plus
HealthPartners
Medica
PrimeWest Health
South Country Health Alliance
UCare
FirstPlan Blue / IMCare / MHP
0% 10% 20% 30% 40% 50% 60% 70% 80% 90% 100%
Page 33

0% 10% 20% 30% 40% 50% 60% 70% 80% 90% 100%
MSHO Average
Blue Plus
HealthPartners
Medica
PrimeWest Health
South Country Health Alliance
UCare
FirstPlan Blue /IMCare / MHP
indicates a rating significantly higher/lower than the MSHO program average(see Appendix A: Technical Notes: Limitations and Statistical Signficance)
indicates a rating significantly higher/lower than the MSHO program average(see Appendix A: Technical Notes: Limitations and Statistical Signficance)
MSHO Average
Blue Plus
HealthPartners
Medica
PrimeWest Health
South Country Health Alliance
UCare
FirstPlan Blue /IMCare / MHP
20% 30% 40% 50% 60% 70% 80% 90% 100%
Page 34

The survey had a series of questions that asked people to rate howoften:
• Their doctors communicated well• They got care without long waits• They got needed care• Their health plan's customer service was helpful and
courteous
These questions asked people to give a rating by marking Never,Sometimes, Usually, or Always.
For each health plan, the numbers in the table show the percent of allpeople who responded most positively (or "Always") to these questions.
Never Sometimes
Worst
possible
Usually Always
Best
possible
Getting Getting Care How Well CustomerDoctorsNeeded Care Quickly Communicate Service
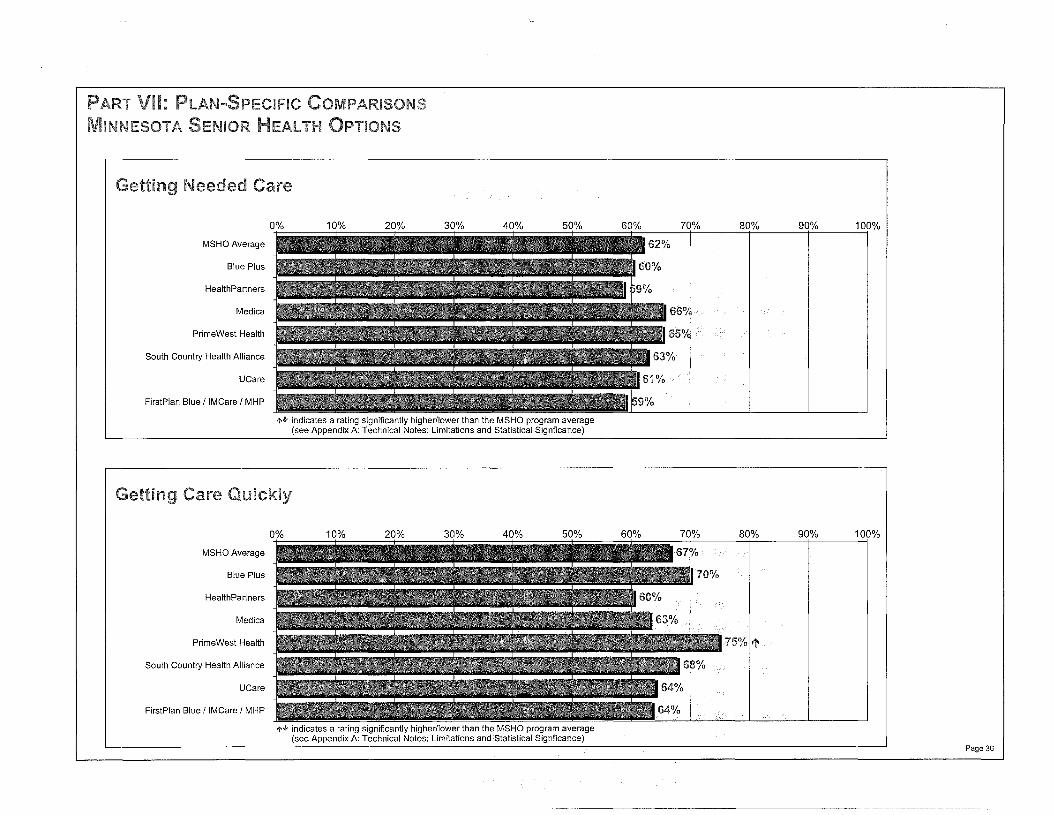
MSHO Average 62% 67% 77% 69%
Blue Plus 60% 70% 76% 65%
HealthPartners 59% 60% 77% 70%
Medica 66% 63% 77% 69%
PrimeWest Health 65% 75% 77% 71%
South Country Health Alliance 63% 68% 75% 74%
UCare 61% 64% 78% 66%
FirstPlan Blue I 1MCare I MHP 59% 64% 76% 70%
indicates a rating significantly higher/lower than the MSHO program average(see Appendix A: Technical Notes: Limitations and Statistical Signficance)
Page 35
0% 10% 20% 30% 40% 50% 60% 70% 80% 90% 100%
MSHO Average
Blue Plus
HealthPartners
Medica
PrimeWest Health
South Country Health Alliance
UCare
FirstPlan Blue / IMCare / MHP
indicates a rating significantly higher/lower than the MSHO program average(see Appendix A: Technical Notes: Limitations and Statistical Signficance)
Page 36

0% 10% 20% 30% 40% 60% 70% 80% 90% 100%
MSHO Average
Blue Plus
HealthPartners
Medica
PrimeWest Health
South Country Health Alliance
UCare
FirstPlan Blue /IMCare / MHP
indicates a rating significantly higher/lower than the MSHO program average(see Appendix A: Technical Notes: Limitations and Statistical Signficance)
MSHO Average
Blue Plus
HealthPartners
Medica
PrimeWest Health
South Country Health Alliance
UCare
FirstPlan Blue /IMCare / MHP
0% 10% 20% 30% 40% 50% 60% 70% 80% 90%
1'~ indicates a rating significantly higher/lower than the MSHO program average(see Appendix A: Technical Notes: Limitations and Statistical Signficance)
Page 37

Introduction
This section of the report shows the program and plan data for the single MeO participating in Minnesota Disability Health Options.Since only one plan currently participates, no significance testing was conducted.
The first pages of this section show the percentage of enrollees who responded most positively (9 or 10) on the four overall surveyquestions that asked enrollees to rate their health care, doctor, specialist, and health plan.
The next pages show the percentage of enrollees who responded most positively (or "Always") to questions that formed the fourcomposite topics: Getting Needed Care, Getting Care Quickly, How Well Doctors Communicate and Customer Service.
Although only one plan is in Minnesota Disability Health Options at present, both program and plan data are shown, to mirror thepresentation of data elsewhere in the report.
Page 38

The survey had questions that asked people to rate the health care thatthey received from their health plan and health care providers. Thesequestions asked people to give an overall rating by marking anynumber on a scale from 0 to 10, where 0 ="worst possible" and 10 ="best possible".
o 1 2 3 4 5 6 7 8 9 10
Worst Best
The number in the table shows the percent of all people who respondedpositively by giving a score of 9 or 10.
possible possible
Rating of Rating ofRating of all personal specialist Rating ofhealth care doctor seen most health plan
often
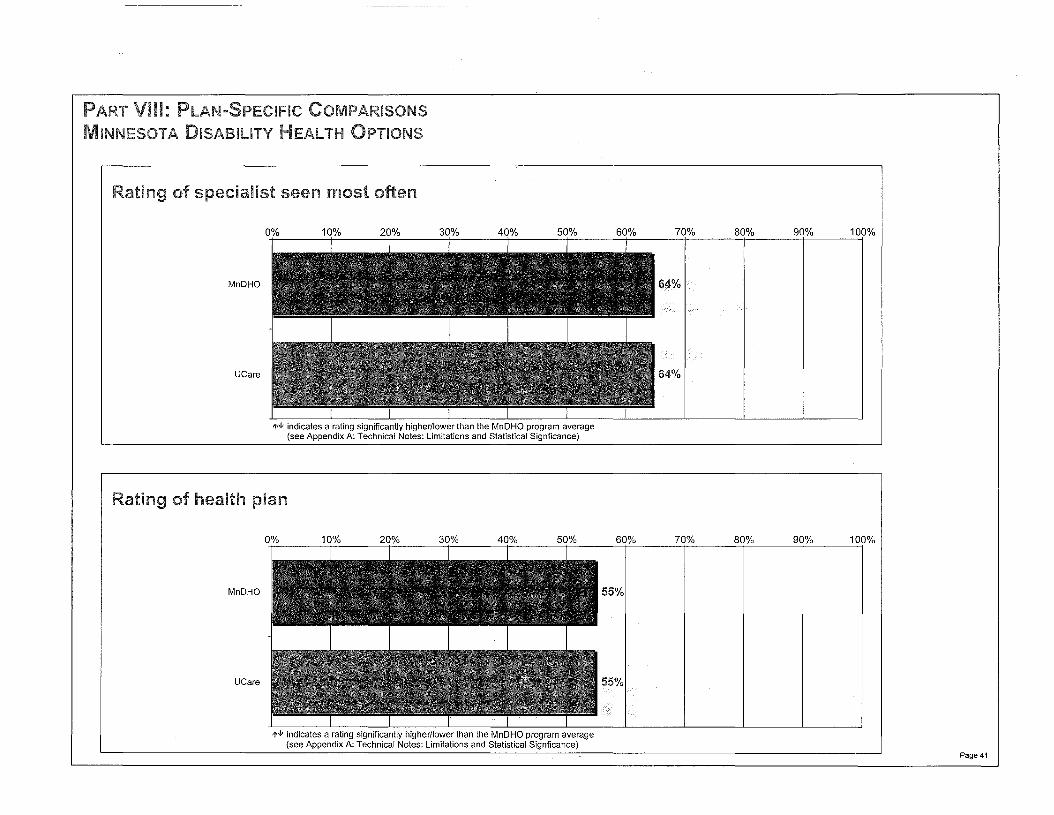
MnDHO 48% 63% 64% 55%
UCare 48% 63% 64% 55%
indicates a rating significantly higher/lower than the MnDHO program average(see Appendix A: Technical Notes: Limitations and Statistical Signficance)
Page 39

0% 10% 20% 30% 40% 50% 60% 70% 80% 90% 100%
MnDHO
UCare
indicates a rating significantly higherllower than the MnDHO program average(see Appendix A: Technical Notes: Limitations and Statistical Signficance)
0% 10% 20% 30% 40% 50% 60% 70% 80% 90% 100%
MnDHO
UCare
indicates a rating significantly higherllower than the MnDHO program average(see Appendix A: Technical Notes: Limitations and Statistical Signficance)
Page 40
0% 10% 20% 30% 40% 50% 60% 70% 80% 90% 100%
MnDHO
UCare
indicates a rating significantly higher/lower than the MnDHO program average(see Appendix A: Technical Notes: Limitations and Statistical Signficance)
0% 10% 20% 30% 40% 50% 60% 70% 80% 90% 100%
MnDHO
UCare
indicates a rating significantly higher/lower than the MnDHO program average(see Appendix A: Technical Notes: Limitations and Statistical Signficance)
Page 41

The survey had a series of questions that asked people to rate howoften:
• Their doctors communicated well• They got care without long waits• They got needed care• Their health plan's customer service was helpful and
courteous
These questions asked people to give a rating by marking Never,Sometimes, Usually, or Always.
For each health plan, the numbers in the table show the percent of allpeople who responded most positively (or "Always") to these questions.
Never Sometimes
Worst
possible
Usually Always
Best
possible
Getting Getting Care HowWelJ CustomerDoctorsNeeded Care Quickly Communicate Service
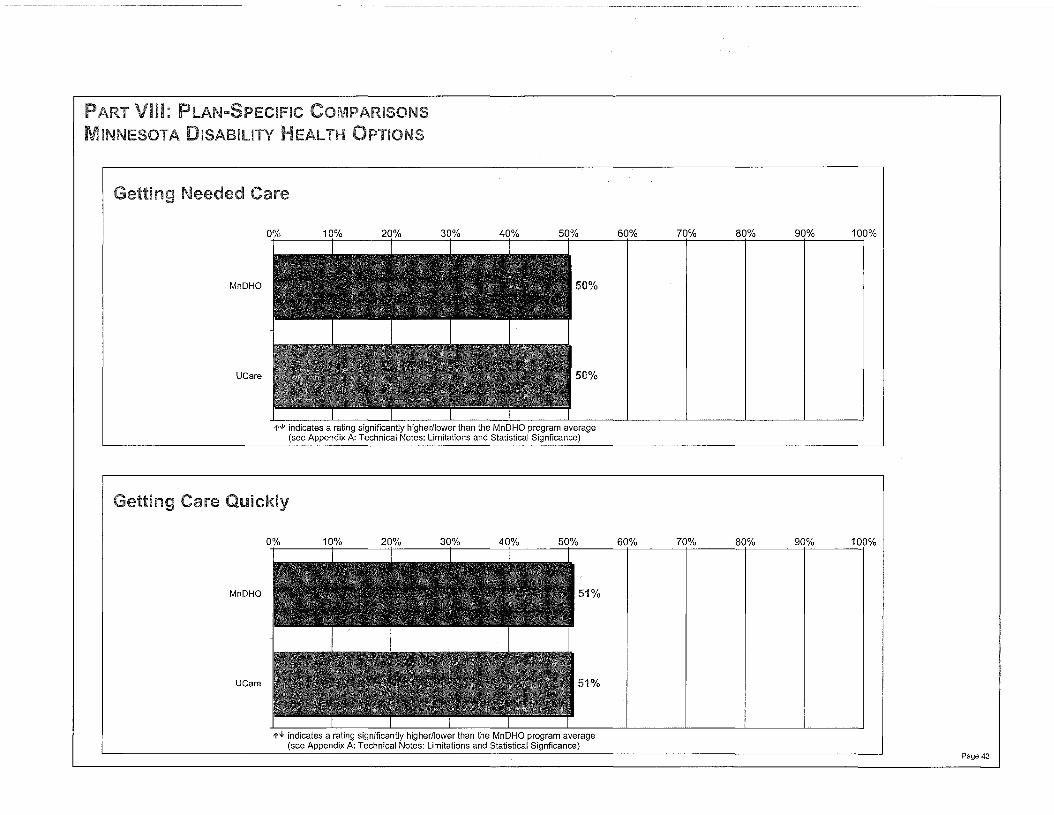
MnDHO 50% 51% 72% 55%
UCare 50% 51% 72% 55%
indicates a rating significantly higher/lower than the MnDHO program average(see Appendix A: Technical Notes: Limitations and Statistical Signficance)
Page 42
0% 10% 20% 30% 40% 50% 60% 70% 80% 90% 100%
MnDHO
UCare
indicates a rating significantly higher/lower than the MnDHO program average(see Appendix A: Technical Notes: Limitations and Statistical Signficance)
0% 10% 20% 30% 40% 50% 60% 70% 80% 90% 100%
MnDHO
UCare
indicates a rating significantly higher/lower than the MnDHO program average(see Appendix A: Technical Notes: Limitations and Statistical Signficance)
Page 43

MnDHO
UCare
MnDHO
UCare
0-j-o/c_o 1_0+0_Yo 2_0+o/c_o 3_0t-o/c_o 4_0t-o/c_o 5....,0l-o/c_o 6-;0_% 7-t0 _% 8_0-j-°_Yo 9_0+0_Yo 1--;00%
indicates a rating significantly higher/lower than the MnDHO program average(see Appendix A: Technical Notes: Limitations and Statistical Signficance)
+- t- --+.:...:-- ---+-- ..:r:--: r:-:- ..::....::r.:...:-- 7.....:.0r.:-o/c..:...o ..:...80+0:...;Yo .....:.9.....:.0r.:-o/c..:...o 1:...:..,00%
1'~ indicates a rating significantly higher/lower than the MnDHO program average(see Appendix A: Technical Notes: Limitations and Statistical Signficance)
Page 44

Introduction
This section of the report shows plan-specific comparisons of the managed care health plans participating in Special Needs BasicCare. The survey results for the health plans were adjusted for age and self-reported health status before testing for significantdifferences.
The first pages of this section show the percentage of enrollees who responded most positively (9 or 10) on the four overall surveyquestions that asked enrollees to rate their health care, doctor, specialist, and health plan.
The next pages show the percentage of enrollees who responded most positively (or "Always") to questions that formed the fourcomposite topics: Getting Needed Care, Getting Care Quickly, How Well Doctors Communicate and Customer Service.
In this section, the Special Needs Basic Care average is provided for comparison purposes. For each rating and composite score,each plan was compared to the program average using a difference-of-means statistical test.
• Plans with a rating or composite score significantly lower than the program average have an indicator of next to that ratingor composite score.
III Plans with a rating or composite score significantly higher than the program average have an indicator of next to thatrating or composite score.
When comparing ratings and percentages, the reader should ignore small differences between numbers. These small differencesmay reflect sampling variation rather than real differences.
Page 45

The survey had questions that asked people to rate the health care thatthey received from their health plan and health care providers. Thesequestions asked people to give an overall rating by marking anynumber on a scale from 0 to 10, where 0 ="worst possible" and 10 ="best possible".
o 1 2 3 4 5 6 7 8 9 10
Worst Best
For each health plan, the number in the table shows the percent of allpeople who responded positively by giving a score of 9 or 10. Theaverage of all plans in SNBC is shown as the SNBC Average.
possible possible
Rating of Rating ofRating of all personal specialist Rating ofhealth care doctor seen most health plan
often
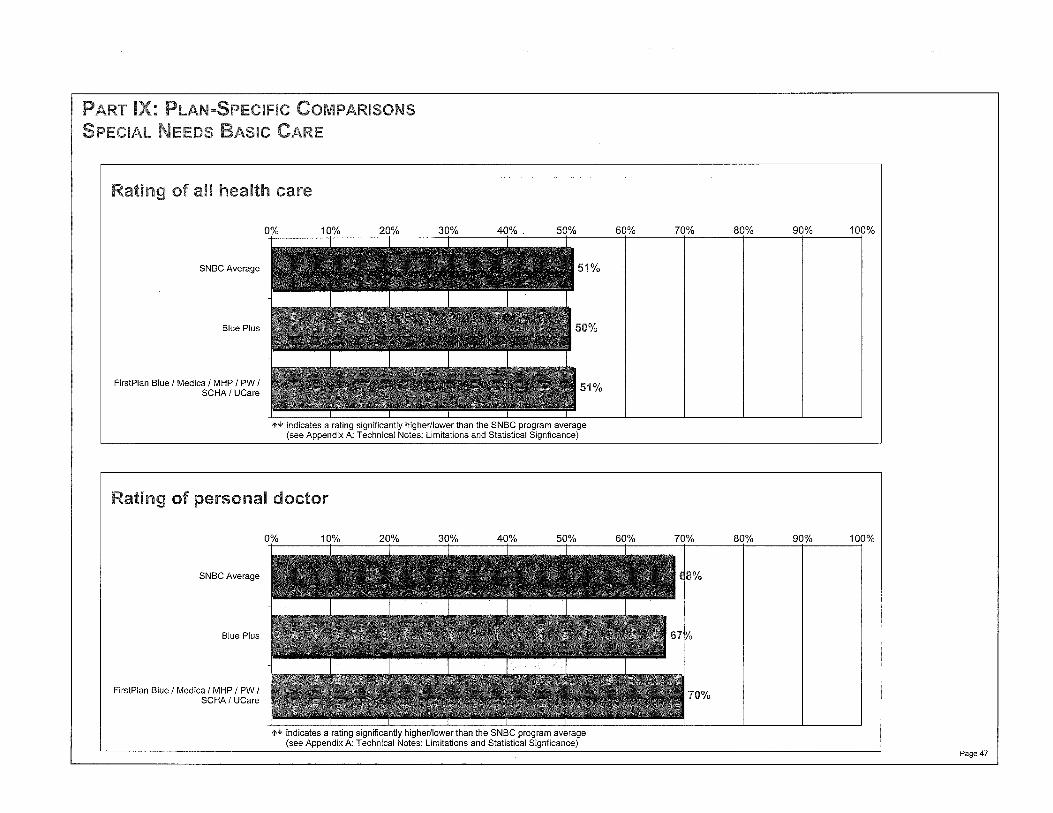
SNBC Average 51% 68% 60%
Blue Plus 50% 67% 59% 56%
FirstPlan Blue I Medica I MHP I PW I SCHA I 51% 70% 64% 64%UCare
indicates a rating significantly higher/lower than the SNBC program average(see Appendix A: Technical Notes: Limitations and Statistical Signficance)
Page 46
0% 10% 20% 30% 40% 50% 60% 70% 80% 90% 100%
SNBC Average
Blue Plus
FirstPlan Blue / Medica / MHP / PW /SCHA/ UCare
indicates a rating significantly higher/lower than the SNBC program average(see Appendix A: Technical Notes: Limitations and Statistical Signficance)
0% 10% 20% 30% 40% 50% 60% 70% 80% 90% 100%
SNBC Average
Blue Plus
FirstPlan Blue / Medica / MHP / PW /SCHA/ UCare
indicates a rating significantly higher/lower than the SNBC program average(see Appendix A: Technical Notes: Limitations and Statistical Signficance)
Page 47

0% 10% 20% 30% 40% 50% 60% 70% 80% 90% 100%
SNBC Average
Blue Plus
FirstPlan Blue / Medica / MHP / PW /SCHA/ UCare
indicates a rating significantly higher/lower than the SNBC program average(see Appendix A: Technical Notes: Limitations and Statistical Signficance)
indicates a rating significantly higher/lower than the SNBC program average(see Appendix A: Technical Notes: Limitations and Statistical Signficance)
SNBC Average
Blue Plus
FirstPlan Blue / Medica / MHP / PW /SCHA/ UCare
10% 20% 30% 40% 50% 60% 70% 80% 90% 100%
Page 48
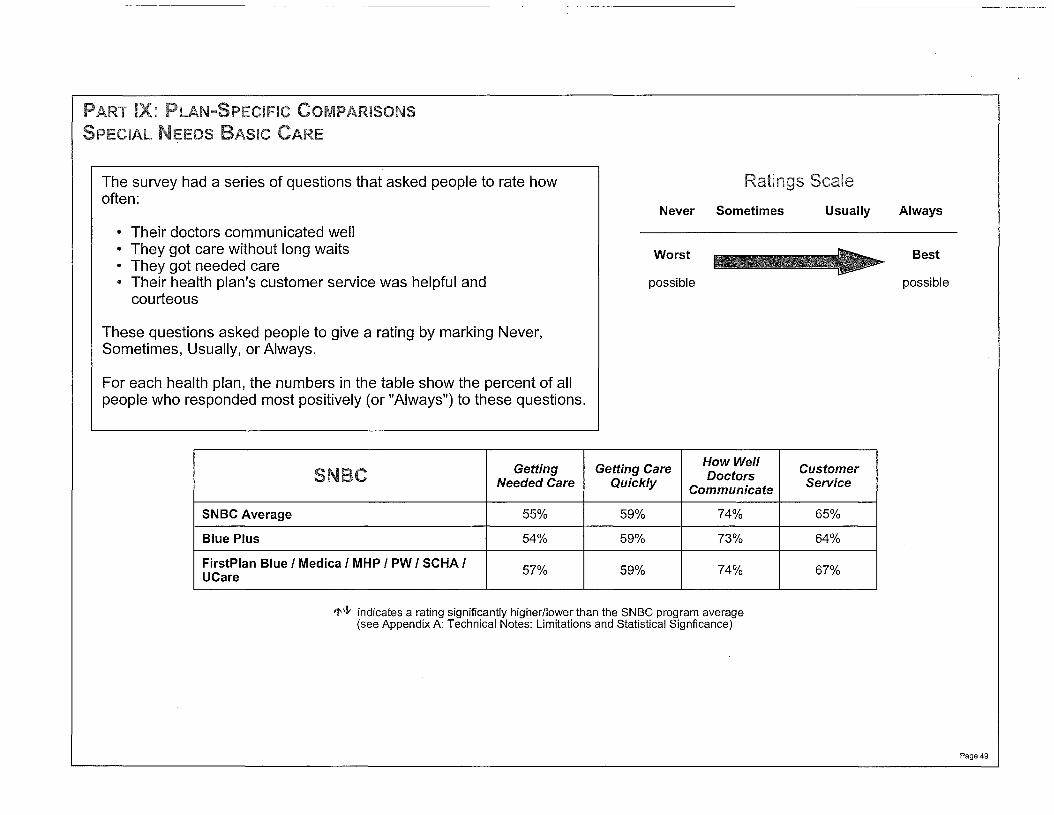
The survey had a series of questions that asked people to rate howoften:
• Their doctors communicated well• They got care without long waits• They got needed care• Their health plan's customer service was helpful and
courteous
These questions asked people to give a rating by marking Never,Sometimes, Usually, or Always.
For each health plan, the numbers in the table show the percent of allpeople who responded most positively (or "Always") to these questions.
Never Sometimes
Worst
possible
Usually Always
Best
possible
Getting Getting CareHow Well CustomerDoctorsNeeded Care Quickly Communicate Service
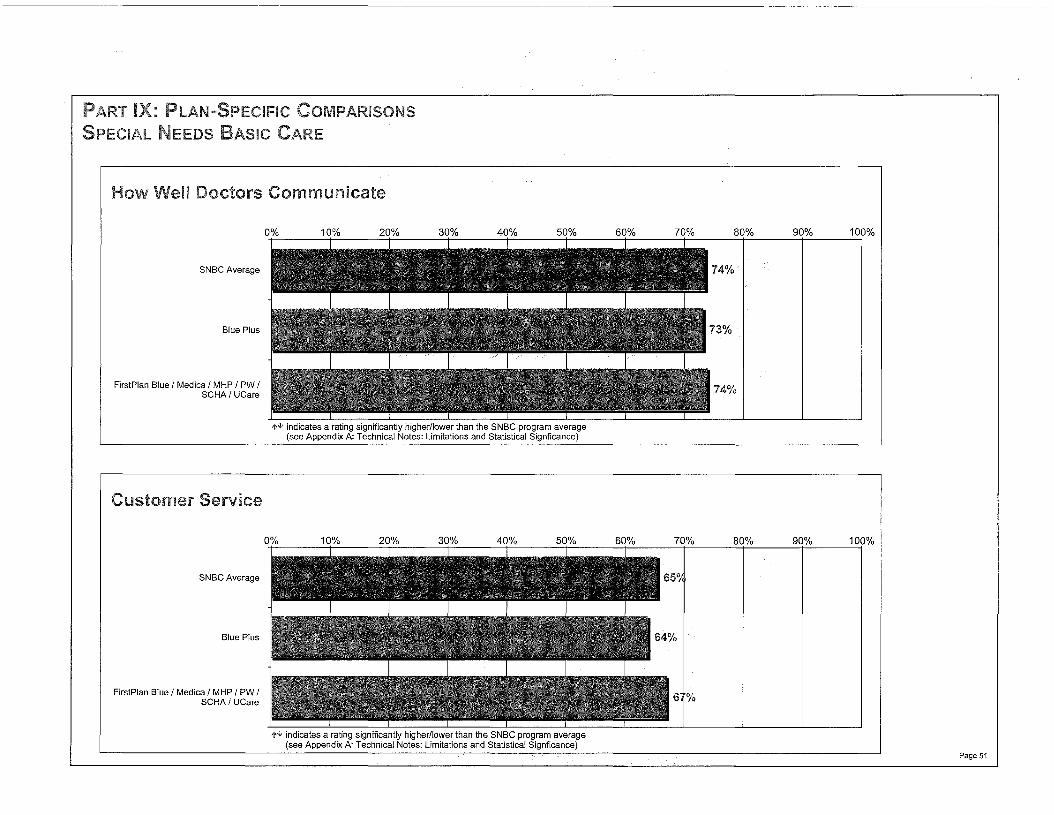
SNBC Average 55% 59% 74% 65%
Blue Plus 54% 59% 73% 64%
FirstPlan Blue I Medica I MHP I PW I SCHA I 57% 59% 74% 67%UCare
indicates a rating significantly higher/lower than the SNBC program average(see Appendix A: Technical Notes: Limitations and Statistical Signficance)
Page 49

indicates a rating significantly higher/lower than the SNBC program average(see Appendix A: Technical Notes: Limitations and Statistical Signficance)
SNBC Average
Blue Plus
FirstPlan Blue / Medica / MHP / PW /SCHA/ UCare
0% 10% 20% 30% 60% 70% 80% 90% 100%
SNBC Average
Blue Plus
FirstPlan Blue / Medica / MHP / PW /SCHA/ UCare
0-+o/c_o 10+0_1o 2_0+0_1o 3_0+o/c_o +- t-- 6-10r--o/c_o 7-10_% 8+0°.:....1o:....- 9_0+0....,:yo 1..:...00%
indicates a rating significantly higher/lower than the SNBC program average(see Appendix A: Technical Notes: Limitations and Statistical Signficance)
Page 50
0% 10% 20% 30% 40% 50% 60% 70% 80% 90% 100%
SNBC Average
Blue Plus
FirstPlan Blue / Medica / MHP / PW /SCHA/ UCare
indicates a rating significantly higher/lower than the SNBC program average(see Appendix A: Technical Notes: Limitations and Statistical Signficance)
0% 10% 20% 30% 40% 50% 60% 70% 80% 90% 100%
SNBC Average
Blue Plus
FirstPlan Blue / Medica / MHP / PW /SCHA/UCare
indicates a rating significantly higher/lower than the SNBC program average(see Appendix A: Technical Notes: Limitations and Statistical Signficance)
Page 51

Introduction
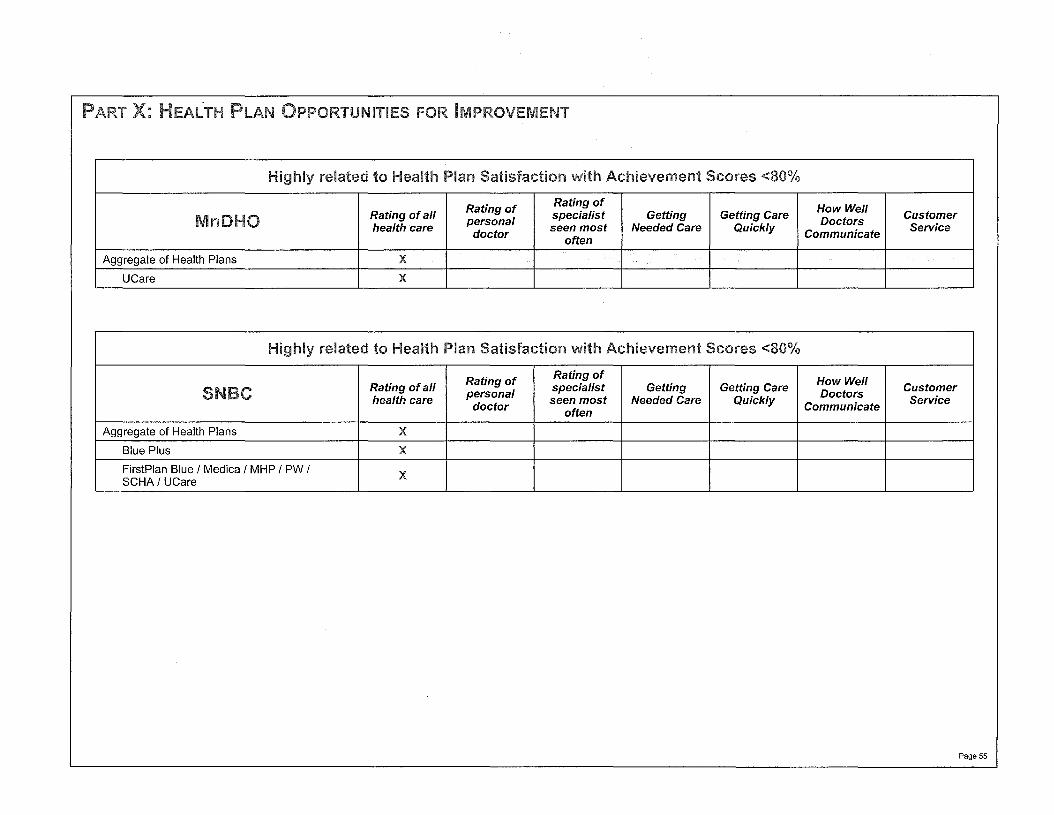
CAHPS surveys offer the possibility of spotlighting opportunities for improvement, by allowing plans to identify areas of service orcare that are highly associated with overall enrollee satisfaction but show lower levels of achievement.
Enrollee responses to survey questions can be summarized as achievement scores. Responses indicating a positive experience arelabeled achievements, and an achievement score is computed equal to the proportion of responses qualifying as achievements.
Since achievement scores for survey questions represent the proportion of enrollees who indicate a positive experience, the lowerthe achievement score, the greater the need for a health plan to improve. For the purpose of identifying opportunities forimprovement in this report, achievements are defined as responses of 'Always' or 'Usually', and responses of 8,9 or 10 to ratingquestions. An achievement score is considered high when the score is 800/0 or greater, and low if below 80%.
To help determine which of the satisfaction ratings and composite topics are most closely related to health plan satisfaction, acorrelation analysis was performed. Correlation analysis is a statistical technique that shows how strongly various factors -- such assatisfaction with the doctor or the items in each composite -- influence overall satisfaction with the health plan. This information helpshealth plans know which areas of service or care are most important in the overall enrollee satisfaction, and, in turn, set priorities forimprovement.
For each program and plan, the tables on the following pages show which ratings and composites were identified in this survey ashighly related to overall satisfaction with the health plan and had achievement scores below 80%. An 'X' under a given rating orcolumn thus represents an opportunity for improvement.
If a health plan has one or more opportunities for improvement, it will want to focus attention on those ratings and topics that arehighly related to enrollee satisfaction with the plan. If the health plan has additional resources for improvement, it might then addressareas less closely related to enrollee satisfaction. For ratings and topics where plans already have high achievement scores, ongoingmonitoring would be needed to maintain high scores.
Page 52

I .... .11 If::'" L~ ,if. L~ .i-., .... If::"'__ _..... , ......-- .;;)t:U...~.~ _~._ •• IIt:Vt::IIIt:IU .;;)\"VI t::~
Rating ofRating of How Well
~&C-MRating ofall personal specialist Getting Getting Care Doctors
Customerhealth care
doctorseen most Needed Care Quickly Communicate
Serviceoften
Aggregate of Health Plans
Blue Plus
FirstPlan Blue
HealthPartners
Itasca Medical Care
Medica
Metropolitan Health Plan
PrimeWest Health
South Country Health Alliance
UCare
__ I_&_...lI S-od.:_.l:__.lI.:_- ,;""'.. L e-m "':I.-II •.I~ I IIt:: V t::1 I 11I:::1 n. ";'\"VI t:~
Rating of Rating of How WellRating of all personal specialist Getting Getting Care Doctors Customerhealth care doctor seen most Needed Care Quickly Communicate
Serviceoften
Aggregate of Health Plans
Blue Plus
FirstPlan Blue
HealthPartners
Medica
UCare
IMCare / MHP / PW / SCHA
Page 53

Aggregate of Health Plans
Blue Plus
Medica
FirstPlan Blue I HP IIMCare I MHP I PWI SCHA I UCare
Rating ofallhealth care
Rating ofpersonaldoctor
Rating ofspecialistseen most
often
GettingNeeded Care
Getting CareQuickly
How WellDoctors
Communicate
CustomerService
,I.A. .JI ".s." Z ".s." _~i_,. ___ ... 1::" __ ..._ ....1 __ - __
h::UI::;'.~_~._H •11t::''Vt::'1 I It::' ' ••;n",UI t::'.-:::ll
Rating of Rating of How WellRating ofall personal specialist Getting Getting Care Doctors Customerhealth care doctor seen most Needed Care Quickly Communicate Service
often
Aggregate of Health Plans*
Blue Plus*
HealthPartners
Medica*
PrimeWest Health*
South Country Health Alliance*
UCare
FirstPlan Blue IIMCare I MHP
*No items identified
Page 54
CustomerService
How WellDoctors
Communicate
Getting CareQuickly
Rating ofpersonal
doctor
Rating ofallhealth care
UCare
Aggregate of Health Plans
Rating ofallhealth care
Rating ofpersonal
doctor
Rating ofspecialistseen most
often
GettingNeeded Care
Getting CareQuickly
How WellDoctors
Communicate
CustomerService
Aggregate of Health Plans
Blue Plus
FirstPlan Blue / Medica / MHP / PW /SCHA/ UCare
Page 55
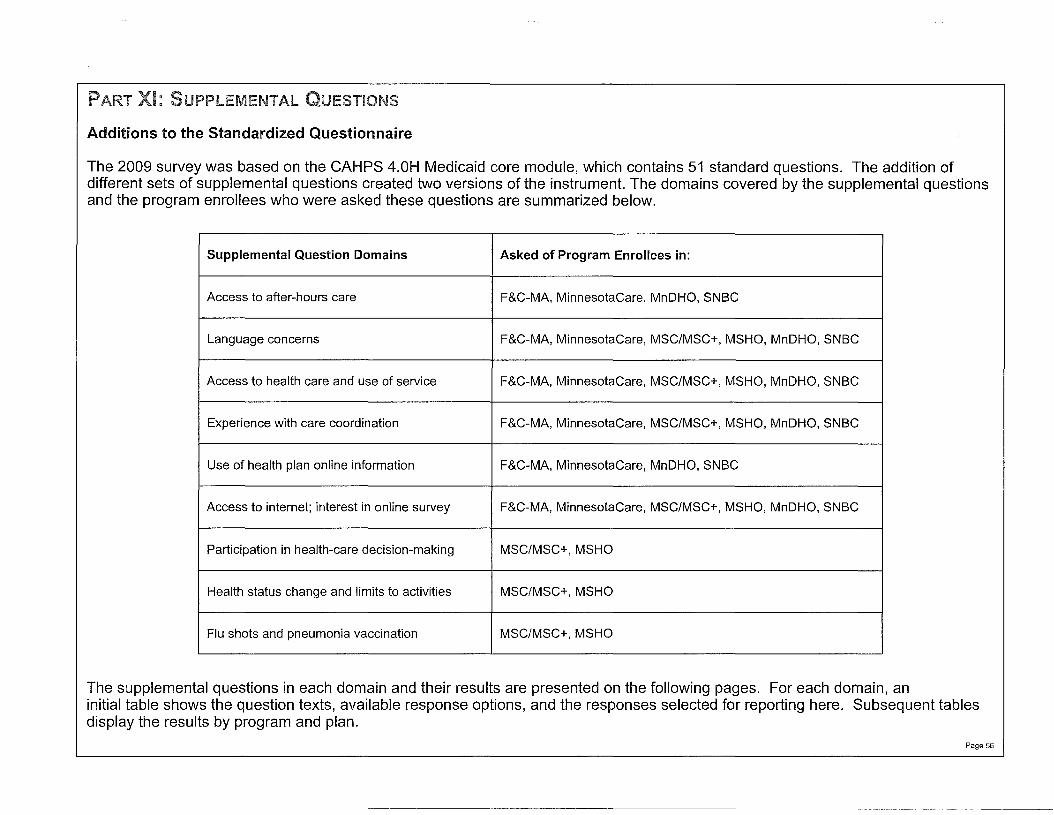
Additions to the Standardized Questionnaire
The 2009 survey was based on the CAHPS 4.0H Medicaid core module, which contains 51 standard questions. The addition ofdifferent sets of supplemental questions created two versions of the instrument. The domains covered by the supplemental questionsand the program enrollees who were asked these questions are summarized below.
Supplemental Question Domains Asked of Program Enrollees in:
Access to after-hours care F&C-MA, MinnesotaCare, MnDHO, SNBC
Language concerns F&C-MA, MinnesotaCare, MSC/MSC+, MSHO, MnDHO, SNBC
Access to health care and use of service F&C-MA, MinnesotaCare, MSC/MSC+, MSHO, MnDHO, SNBC
Experience with care coordination F&C-MA, MinnesotaCare, MSC/MSC+, MSHO, MnDHO, SNBC
Use of health plan online information F&C-MA, MinnesotaCare, MnDHO, SNBC
Access to internet; interest in online survey F&C-MA, MinnesotaCare, MSC/MSC+, MSHO, MnDHO, SNBC
Participation in health-care decision-making MSC/MSC+, MSHO
Health status change and limits to activities MSC/MSC+, MSHO
Flu shots and pneumonia vaccination MSC/MSC+, MSHO
The supplemental questions in each domain and their results are presented on the following pages. For each domain, aninitial table shows the question texts, available response options, and the responses selected for reporting here. Subsequent tablesdisplay the results by program and plan.
Page 56

Enrollees in F&C-MA, MinnesotaCare, MnDHO and SNBC were asked three questions to assessaccess to after hours care. Questiontext and response options are presented first, followed by program and plan results.
After hours care is health care when your usual doctor's office or clinic is closed. Inthe last 6 months, did you need to visit a doctor's office or clinic for after hourscare?
In the last 6 months, how often was it easy to get the after hours care you thoughtyou needed?
Were any of the following a reason it was not easy to get the after hours care youthought you needed? Please mark all that apply.
- You did not know where to go for after hours care- You weren't sure where to find a list of doctor's offices or clinics in your
health plan or network that are open for after hours care- The doctor's office or clinic that had after hours care was too far away- Office or clinic hours for after hours care did not meet your needs- Some other reason
Yes, No
Never, Sometimes, Usually,Always
Yes, No
Page 57

Always easy Reasons not easy to get needed after hours care:'&C~MA
Needed after to gethours care needed after Office/clinic
hours care Didn't know NotsU?l Too faraway hours didn't Other reasonwhere to go where to md meet needs
F&C-MA Average 18% 46% 13% 16% 0% 24% 36%Blue Plus 19% 35% 8% 19% 14% 14% 22%FirstPlan Blue 15% 50% 9% 13% 13% 30% 35%HealthPartners 19% 47% 10% 25% 0% 15% 60%Itasca Medical Care 16% 51% 32% 16% 11% 26% 37%Medica 22% 44% 23% 13% 23% 30% 33%Metropolitan Health Plan 19% 32% 17% 22% 4% 13% 17%PrimeWest Health 14%
""53% 15% 10% 5% 25% 40%
South Country Health20% 52% 3% 10% 7% 31% 48%Alliance
UCare 21% 50% 10% 13% 10% 30% 37%
indicates a rating significantly higher/lower than the program average(see Appendix A: Technical Notes: Limitations and Statistical Signficance)
Always easy Reasons not easy to get needed after hours care:.ll. Needed after to getil. ___ ~_
hours care needed after Office/clinichours care
Didn't know NotSU?l Too faraway hours didn't Other reasonwhere to go where to md meet needs
MinnesotaCare Average 9% 53% 18% 12% 13% 27% 29%
Blue Plus 8% 50% 26% 11% 21% 32% 26%
FirstPlan Blue 7%
""53% 13% 7% 7% 20% 7%
HealthPartners . 12% 51% 10% 20% 15% 25% 30%
Medica 12% l' 62% 21% 16% 16% 37% 37%
UCare 9% 45% 14% 5% 10% 33% 19%
IMCare I MHP I PW I SCHA 10% 57% 21% 16% 11% 16% 53%
indicates a rating significantly higher/lower than the program average(see Appendix A: Technical Notes: Limitations and Statistical Signficance)
Page 58
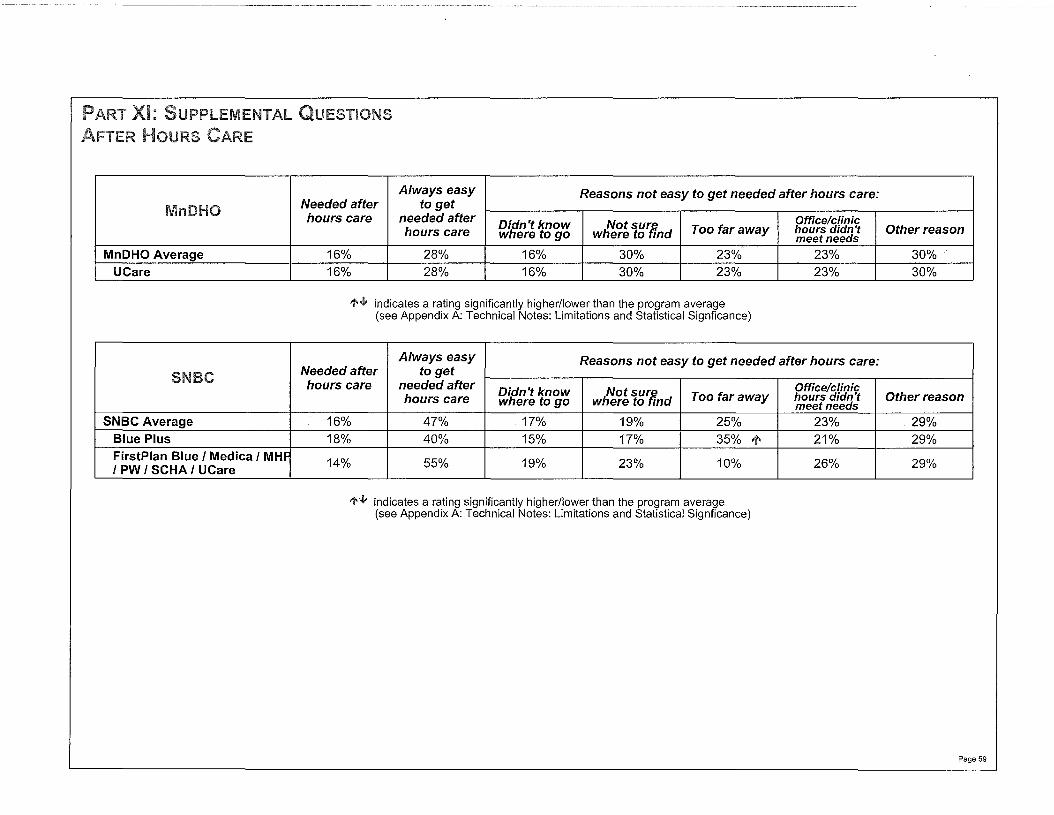
Always easy Reasons not easy to get needed after hours care:Needed after to gethours care needed after Didn't know Not sU1i Office/clinic
hours care where to go where to md Too faraway hours didn't Other reasonmeet needs
MnDHO Average 16% 28% 16% 30% 23% 23% 30%UCare 16% 28% 16% 30% 23% 23% 30%
indicates a rating significantly higher/lower than the program average(see Appendix A: Technical Notes: Limitations and Statistical Signficance)
Always easy Reasons not easy to get needed after hours care:Needed after to gethours care needed after Didn't know Not sU'll Office/clinic
hours care where to go where to md Too faraway hours didn't Other reasonmeet needs
SNBC Average ·16% 47% 17% 19% 25% 23% 29%Blue Plus 18% 40% 15% 17% 35% l' 21% 29%FirstPlan Blue I Medica I MHF 14% 55% 19% 23% 10% 26% 29%I PW I SCHA I UCare
indicates a rating significantly higher/lower than the program average(see Appendix A: Technical Notes: Limitations and Statistical Signficance)
Page 59
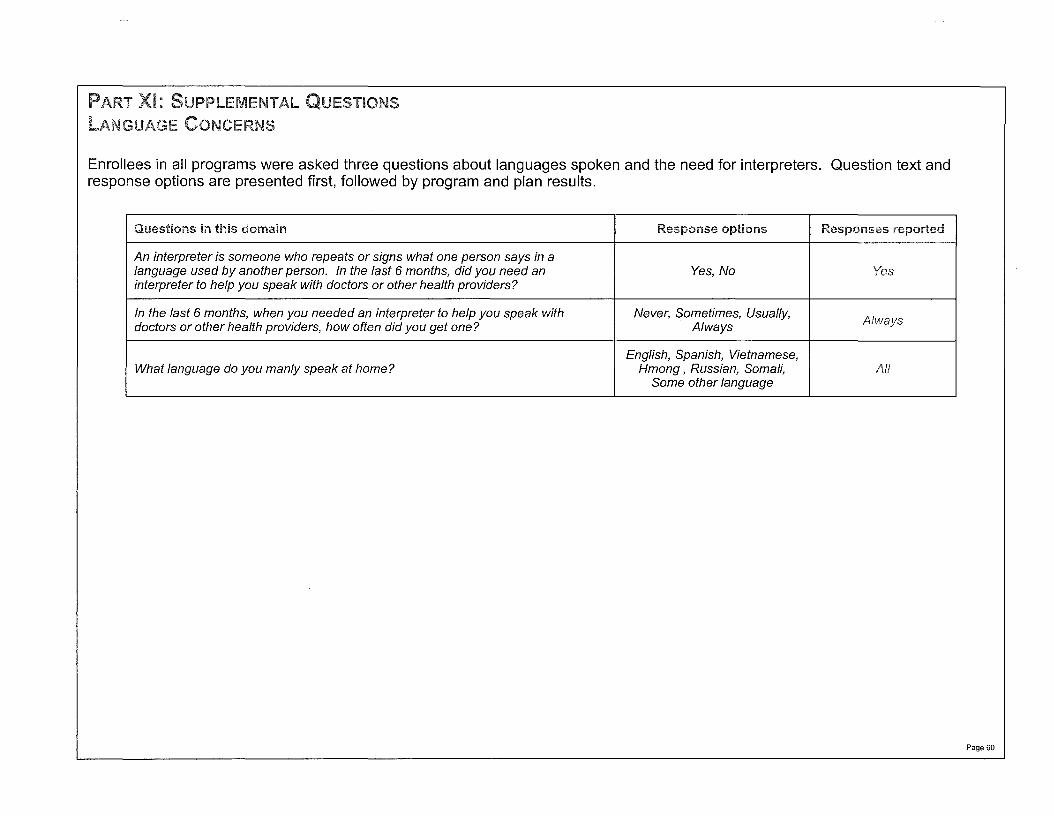
Enrollees in all programs were asked three questions about languages spoken and the need for interpreters. Question text andresponse options are presented first, followed by program and plan results.
f"h ..., _. . , ... ,: .... _,- _fiI~ I ............ I1"'''"''''~l;;:: T - , ..- 1l;;::f-!'UII.l;;::U
An interpreter is someone who repeats or signs what one person says in alanguage used by another person. In the last 6 months, did you need an Yes, Nointerpreter to help you speak with doctors or other health providers?
In the last 6 months, when you needed an interpreter to help you speak with Never, Sometimes, Usually,A/vialsdoctors or other health providers, how often did you get one? Always
English, Spanish, Vietnamese,What language do you manly speak at home? Hmong , Russian, Somali,
Some other language
Page 60

C-MA Needed Always got Language mainly spoken at home?
interpreter interpreter English Spanish Vietnamese Hmong Russian Somali Other
F&C-MA Average 4% 56% 91% 1% 0% 4% 0% 2% 2%
Blue Plus 2% 67% 96% 1% 0% 1% 0% 1% 1%
FirstPlan Blue 0% 0% 100% 0% 0% 0% 0% 0% 0%
HealthPartners 8% 59% 80% ~ 2% 1% 4% 0% 5% 7%
Itasca Medical Care 0% 0% 100% 0% 0% 0% 0% 0% 0%
Medica 6% 43% 87% 0% 0% 3% 1% 4% 4%
Metropolitan Health Plan 6% 40% 84% 4% 1% 7% 1% 1% 4%
PrimeWest Health 1% 0% 99% 1% 0% 0% 0% 0% 0%
South Country Health Alliance 2% 33% 97% 1% 0% 0% 0% 1% 1%
UCare 15% 70% 71% 1% 0% 18% 0% 5% 4%
indicates a rating significantly higher/lower than the program average(see Appendix A: Technical Notes: Limitations and Statistical Signficance)
lnnt:;:)ulcu.':a. Needed Always got Language mainly spoken at home?
interpreter interpreter English Spanish Vietnamese Hmong Russian Somali Other
MinnesotaCare Average 2% 54% 95% 1% 1% 1% 0% 1% 2%
Blue Plus 0% 100% 99% 1% 0% 0% 0% 0% 1%
FirstPlan Blue 0% 100% 0% 0% 0% 0% 0% 0%
HealthPartners 5% 65% 85% ~ 1% 3% 2% 1% 2% 6%
Medica 1% 33% 94% 0% 1% 0% 1% 1% 1%
UCare 3% 50% 92% 1% 0% 3% 0% 1% 2%
IMCare I MHP I PW I SCHA 2% 43% 96% 1% 0% 0% 0% 1% 1%
indicates a rating significantly higher/lower than the program average(see Appendix A: Technical Notes: Limitations and Statistical Signficance)
Page 61

Needed Always got Language mainly spoken at home?
interpreter interpreterEnglish Spanish Vietnamese Hmong Russian Somali Other
MSC/MSC+ Average 19% 71% 76% 2% 2% 2% 14% 1% 3%
Blue Plus 8% 58% 91% 2% 1% 2% 0% 1% 3%
Medica 39% 76% 50% 1% 2% 1% 42% 0% 4%
FirstPlan Blue I HP IIMCare I 11% 65% 86% 2% 2% 3% 3% 1% 3%MHP/PW/SCHA/UCare
indicates a rating significantly higher/lower than the program average(see Appendix A: Technical Notes: Limitations and Statistical Signficance)
Needed Always got Language mainly spoken at home?
interpreter interpreterEnglish Spanish Vietnamese Hmong Russian Somali Other
MSHO Average 9% 69% 89% 1% 2% 3% 1% 1% 3%
Blue Plus 6% 61% 95% 1% 1% + 2% 0% 0% + 1%
HealthPartners 25% 68% 69% 4% 8% 7% 2% 1% 10%
Medica 11% 65% 86% 1% 2% 3% 2% 1% 4%
PrimeWest Health 1% 71% 99% 0% 0% 0% 0% 0% 0%
South Country Health Alliance 1% 100% 98% 1% 0% 0% 0% 0% 1%
UCare 23% 74% 73% 2% 4% 9% 2% 4% 5%
FirstPlan Blue IIMCare I MHP 8% 68% 92% 0% 2% 1% 0% 1% 3%
indicates a rating significantly higher/lower than the program average(see Appendix A: Technical Notes: Limitations and Statistical Signficance)
Page 62

Needed Always got Language mainly spoken at home?
interpreter interpreter English Spanish Vietnamese Hmong Russian Somali Other
MnDHO Average 9% 58% 90% 0% 0% 4% 0% 3% 2%
UCare 9% 58% 90% 0% 0% 4% 0% 3% 2%
indicates a rating significantly higher/lower than the program average(see Appendix A: Technical Notes: Limitations and Statistical Signficance)
Needed Always got Language mainly spoken at home?
interpreter interpreter English Spanish Vietnamese Hmong Russian Somali Other
SNBC Average 2% 39% 99% 0% 0% 0% 0% 0% 0%
Blue Plus 2% 30% 99% 0% 0% 0% 0% 0% 0%
FirstPlan Blue / Medica / MHP / 3% 46% 99% 0% 0% 0% 0% 0% 0%PW / SCHA / UCare
indicates a rating significantly higher/lower than the program average(see Appendix A: Technical Notes: Limitations and Statistical Signficance)
Page 63

A group of eleven supplemental questions about access to care and use of service were asked of enrollees in all six programs.Seven of these questions, whose responses could be characterized as positive, are presented here. The question texts, targetprograms, response options available and reported are shown first. Results for the questions specific to each program and planfollow.
In
nl "_. . D~~~~~__ ,: ''''''''''''I!''''"' ll:;:)~;:)I:;:) UUIIICiIII .. .....""'I!"'''''ll:;:)l:: "
l::IIIUIIl::l:::;:) 1l::IJUII.l::U
In the last 6 months, not counting the times you needed health care right away, F&C-MA Same day, 1 day, 2 to 3 days, 4 to 7
how many days did you usually have to wait between making an appointment and MinnesotaCare days, 8 to 14 days, 15 to 30 days,
actually seeing a health provider? (Asked if respondent made appointment) MnDHO,SNBC 31 to 60 days, 61 to 90 days, 91days or longer
In the last 6 months, how many times did you go to an emergency room to get careAll programs None, 1, 2, 3, 4, 5 to 9, 10 or morefor yourself?
In the last 6 months, how often were you taken to the exam room within 15 minutes MSC/MSC+Never, Sometimes, Usually, Alwaysofyour appointment? (Asked if respondent got care in last 6 months) MSHO
In the last 6 months, how often did office staff at the doctor's office or clinic treat MSC/MSC+Never, Sometimes, Usually, Alwaysyou with courtesy and respect? (Asked if respondent got care in last 6 months) MSHO
In the last 6 months, how often were office staff at a doctor's office or clinic asMSC/MSC+helpful as you thought they should be? (Asked if respondent got care in last 6 MSHO Never, Sometimes, Usually, Always
months)
In the last 6 months, how often was it easy to get a referral to a specialist that you F&C-MAMinnesotaCare Never, Sometimes, Usually, Always
needed to see? (Asked if respondent tried to make appointment in last 6 months) MnDHO,SNBC
Were any of the following a reason it was not easy to get an appointment with aspecialist? (Asked if respondent tried to make appointment and didn't always find iteasy to get one)
- Your doctor didn't think you needed to see a specialistF&C-MA- Your health plan approval/authorization was delayed
MinnesotaCare- You weren't sure where to find a list of specialists in your health plan or networkMnDHO
Yes, No- Specialists you had to choose from were too far away
SNBC- You didn't have enough specialists to choose from- Specialist you wanted didn't belong to your health plan or network- You couldn't get an appointment at a convenient time- Some other reason
Page 64

HowHow often Not easy to get appointment because...
Wait for easy toappt: 14 many gettimes to Dr didn't Health Weren't Specialist Not Specialist No apptatdays or ER: referral to thinkle°u plan sure too far enough to wanted convenient Other
less Nonespecialist: nee ed approval where to away choose not in time reason
Always one delayed find one from plan
F&C-MA Average 92% 70% 55% 7% 9% 10% 14% 12% 10% 44% 26%
Blue Plus 90% 70% 54% 4% 13% 10% 19% 13% 8% 46% 33%
FirstPlan Blue 91% 72% 66% 1" 8% 4% 14% 8% 6% 6% 55% 12% ~
HealthPartners 95% 1" 72% 50% 17% 5% 19% 17% 12% 14% 43% 29%
Itasca Medical Care 96% 1" 65% 59% 8% 23% 5% 18% 15% 3% 38% 33%
Medica 91% 76% 1" 49% 2% ~ 11% 9% 13% 25% 1" 11% 47% 22%
Metropolitan Health Plan 93% 60% ~ 43% 16% 16% 8% 8% 16% 16% 32% 32%
PrimeWest Health 90% 74% 53% 5% 7% 9% 18% 7% 11% 39% 23%
South Country Health Alliance 92% 68% 63% 4% 2% 11% 11% 4% 11% 50% 20%
UCare 89% 72% 56% 9% 4% 9% 13% 7% 11% 35% 35%
indicates a rating significantly higher/lower than the program average(see Appendix A: Technical Notes: Limitations and Statistical Signficance)
How How often Not easy to get appointment because...Wait for easy to
Inesota appt: 14 many gettimes to Dr didn't Health Weren't Not Specialistdays or ER: referral to thinkle°u plan sure Specialist enough to wanted No apptat Other
less specialist: nee ed approval where to too far choose not in convenientNone away time reason
Always one delayed find one from plan
MinnesotaCare Average 88% 83% 64% 6% 6% 7% 11% 6% 8% 39% 27%
Blue Plus 89% 83% 56% ~ 5% 5% 4% 5% ~ 1% ~ 4% 39% 30%
FirstPlan Blue 86% 84% 68% 3% 6% 3% 11% 5% 8% 26% ~ 35%
HealthPartners 88% 83% 67% 2% 6% 4% 6% 6% 6% 57% 22%
Medica 87% 81% 65% 10% 6% 4% 11% 7% 7% 38% 27%
UCare 89% 84% 64% 4% 4% 13% 11% 9% 14% 31% 23%
IMCare I MHP I PW I SCHA 86% 83% 62% 11% 6% 11% 18% 11% 10% 45% 26%
indicates a rating significantly higher/lower than the program average(see Appendix A: Technical Notes: Limitations and Statistical Signficance)
Page 65

How often to How often How oftenHow many exam room office staffoffice stafftimes to ER: within 15 courteous/ helpful:None minutes: respectful:
Always Always Always
MSC/MSC+ Average 73% 81% 67%
Blue Plus 74% 27% 82% 68%
Medica 71% 26% 78% 64%
FirstPlan Blue I HP IIMCare I MHP I PW I SCHA I 73% 32% 82% 68%UCare
1'~ indicates a rating significantly higher/lower than the program average(see Appendix A: Technical Notes: Limitations and Statistical Signficance)
How often to How often How oftenHow many exam room office staff
office staffMSHO times to ER: within 15 courteous/ helpful:None minutes: respectful: Always
Always Always
MSHOAverage 75% 32% 85% 72%
Blue Plus 75% 31% 87% 73%
HealthPartners 73% 28% 80% 67%
Medica 72% 30% 85% 70%
PrimeWest Health 78% 33% 90% 78%
South Country Health Alliance 75% 33% 88% 73%
UCare 77% 33% 81% 71%
FirstPlan Blue IIMCare I MHP 74% 35% 85% 71%
indicates a rating significantly higher/lower than the program average(see Appendix A: Technical Notes: Limitations and Statistical Signficance)
Page 66

HowHow often Not easy to get appointment because...
Wait for easy toappt: 14 many
gettimes to Dr didn't Health Weren't Not Specialistdays or ER: referral to think!e0u plan sure Specialist enough to wanted No apptat Othertoo far convenientless
Nonespecialist: nee ed approval where to away choose not in time reason
Always one delayed find one from plan
MnDHO Average 84% 64% 58% 5% 12% 7% 5% 9% 13% 41% 26%
UCare 84% 64% 58% 5% 12% 7% 5% 9% 13% 41% 26%
indicates a rating significantly higher/lower than the program average(see Appendix A: Technical Notes: Limitations and Statistical Signficance)
How How often Not easy to get appointment because...Wait for easy toappt: 14 many
gettimes to Dr didn't Health Weren't Not Specialistdays or
ER: referral to think!e0u plan sure Specialist enough to wanted No apptat Othertoo far convenientlessNone
specialist: nee ed approval where to away choose not in time reasonAlways one delayed find one from plan
SNBC Average 86% 66% 58% 7% 8% 13% 16% 10% 10% 34% 23%
Blue Plus 88% 65% 57% 7% 8% 14% 20% 12% 10% 34% 22%
FirstPlan Blue I Medica I MHP I P\I\84% 67% 59% 6% 8% 11% 12% 8% 11% 35% 25%I SCHA I UCare
indicates a rating significantly higher/lower than the program average(see Appendix A: Technical Notes: Limitations and Statistical Signficance)
Page 67
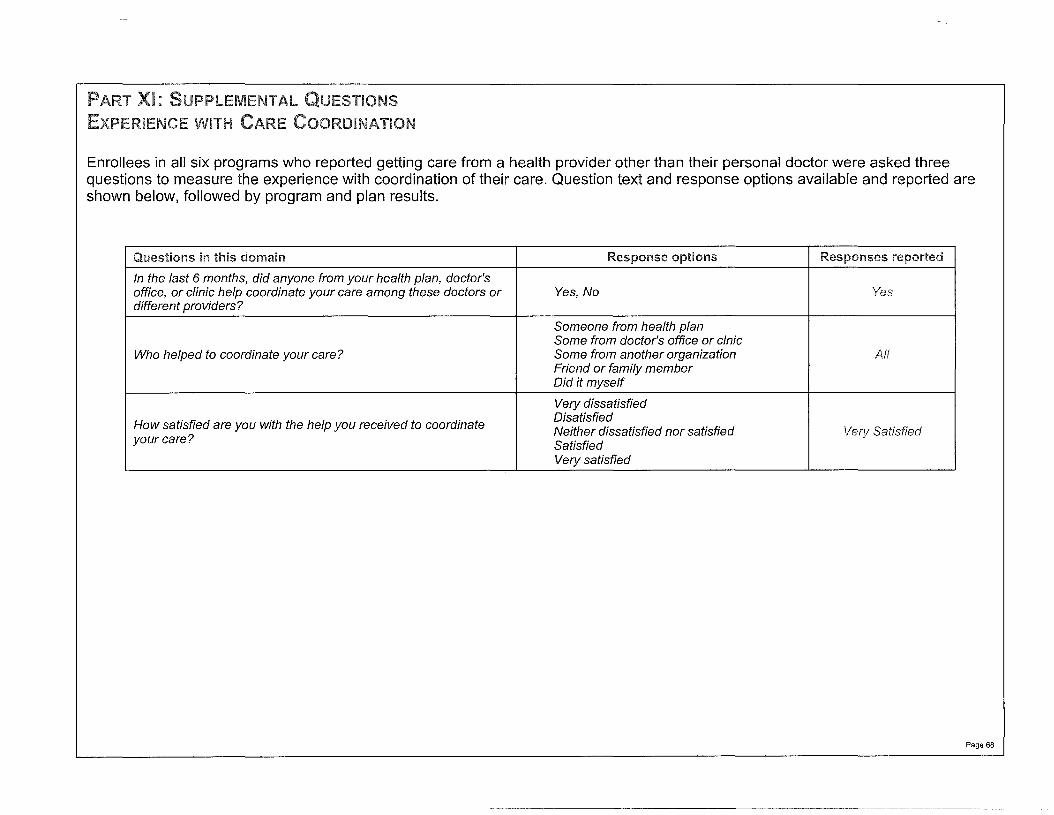
Enrollees in all six programs who reported getting care from a health provider other than their personal doctor were asked threequestions to measure the experience with coordination of their care. Question text and response options available and reported areshown below, followed by program and plan results.
In the last 6 months, did anyone from your health plan, doctor'soffice, or clinic help coordinate your care among these doctors ordifferent providers?
Who helped to coordinate your care?
How satisfied are you with the help you received to coordinateyour care?
Yes, No
Someone from health planSome from doctor's office or clnicSome from another organizationFriend or family memberDid it myself
Very dissatisfiedDisatisfiedNeither dissatisfied nor satisfiedSatisfiedVery satisfied
Page 68

Got help From... Very satisfied:&C..MA coordinating with care
care Health plan Doctor's office Another Friend or Did it myself coordinationor clinic organization family member
F&C-MA Average 56% 4% 71% 2% 5% 19% 46%
Blue Plus 53% 4% 77% 0% 4% 15% 40%
FirstPlan Blue 57% 5% 77% 0% 1% W 16% 49%
HealthPartners 54% 10% 65% 3% 3% 19% 48%
Itasca Medical Care 51% 2% 71% 4% 6% 17% 46%
Medica 61% 2% 69% 2% 4% 23% 38%
Metropolitan Health Plan 55% 4% 65% 4% 8% 19% 33%
PrimeWest Health 58% 1% 74% 0% 7% 18% 50%
South Country Health Alliance 54% 2% 70% 2% 5% 21% 53%
UCare 61% 6% 63% 5% 6% 20% 48%
indicates a rating significantly higher/lower than the program average(see Appendix A: Technical Notes: Limitations and Statistical Signficance)
Got help From... Very satisfied11I11I: """::::U'e1'11111 coordinating with care
care Health plan Doctor's office Another Friend or Did it myself coordinationor clinic organization family member
MinnesotaCare Average 57% 4% 81% 1% 4% 11% 48%
Blue Plus 56% 0% 86% 1% 2% 11% 43%
FirstPlan Blue 53% 2% 83% 1% 1% W 13% 46%
HealthPartners 64% 11% 75% 0% 6% 8% 59%
Medica 55% 6% 76% 0% 5% 13% 49%
UCare 58% 2% 76% 2% 7% 13% 53%
IMCare I MHP I PW I SCHA 57% 4% 83% 1% 2% 9% 42%
indicates a rating significantly higher/lower than the program average(see Appendix A: Technical Notes: Limitations and Statistical Signficance)
Page 69

Got help From... Very satisfiedcoordinating with care
care Health plan Doctor's office Another Friend or Did it myself coordinationor clinic organization family member
MSC/MSC+ Average 70% 7% 57% 7% 15% 14% 44%
Blue Plus 69% 6% 55% 9% 18% 12% 48%
Medica 68% 7% 53% 7% 12% 21% 1- 35%
FirstPlan Blue I HP IIMCare I74% 8% 62% 6% 15% 9% 48%MHP I PW I SCHA I UCare
indicates a rating significantly higher/lower than the program average(see Appendix A: Technical Notes: Limitations and Statistical Signficance)
Got help From... Very satisfiedcoordinating with care
care Health plan Doctor's office Another Friend or Did it myself coordinationor clinic organization family member
MSHO Average 71% 16% 52% 6% 17% 9% 51%
Blue Plus 67% 12% 60% 2% 18% 8% 46%
HealthPartners 79% 27% 1- 37% 4% 22% 11% 50%
Medica 71% 15% 44% 10% 17% 13% 42%
PrimeWest Health 74% 19% 54% 9% 12% 7% 55%
South Country Health Alliance 71% 8% ~ 64% 9% 16% 3% ~ 53%
UCare 69% 17% 52% 5% 18% 8% 59%
FirstPlan Blue IIMCare I MHP 70% 18% 50% 4% 16% 13% 56%
indicates a rating significantly higher/lower than the program average(see Appendix A: Technical Notes: Limitations and Statistical Signficance)
Page 70

Got help From... Very satisfiedcoordinating with care
care Health plan Doctor's office Another Friend or Did it myself coordinationor clinic organization family member
MnDHO Average 73% 46% 21% 15% 5% 13% 45%
UCare 73% 46% 21% 15% 5% 13% 45%
indicates a rating significantly higher/lower than the program average(see Appendix A: Technical Notes: Limitations and Statistical Signficance)
Got help From... Very satisfiedcoordinating with care
care Health plan Doctor's office Another Friend or Did it myself coordinationor clinic organization family member
SNBC Average 68% 16% 56% 8% 6% 15% 48%
Blue Plus 68% 15% 54% 7% 6% 18% 46%
FirstPlan Blue I Medica I MHP I67% 17% 58% 9% 5% 11% 50%
PW I SCHA I UCare
indicates a rating significantly higher/lower than the program average(see Appendix A: Technical Notes: Limitations and Statistical Signficance)
Page 71
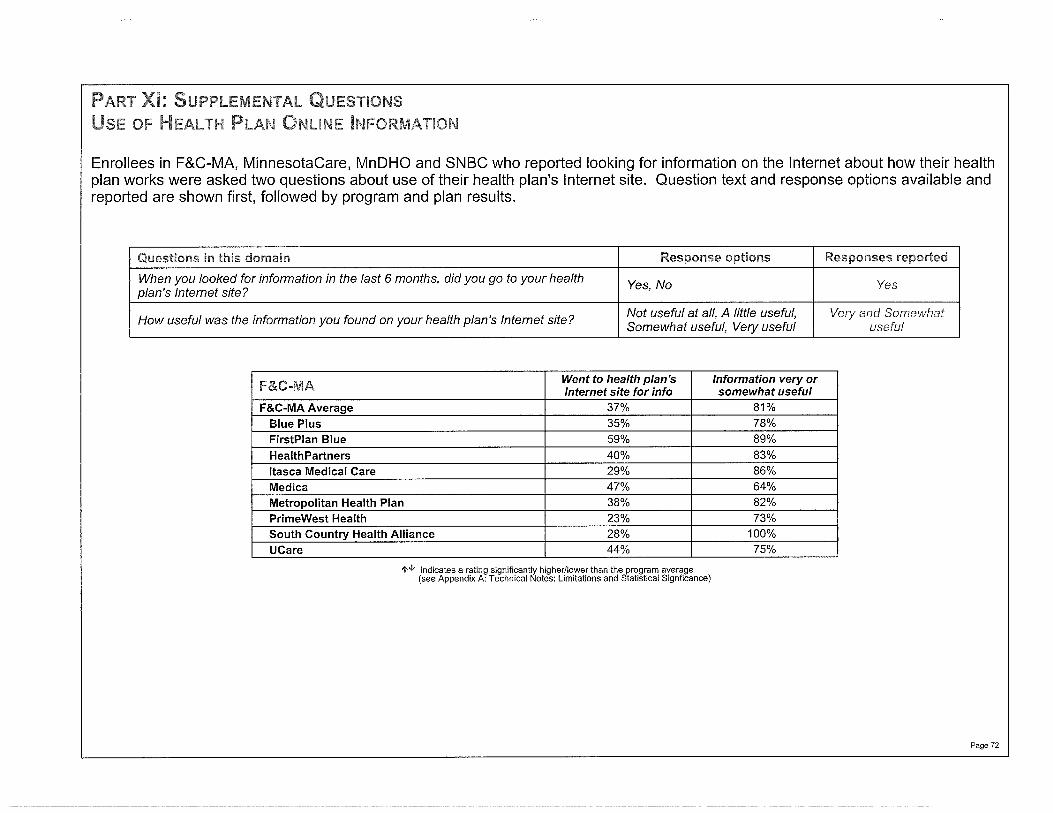
Enrollees in F&C-MA, MinnesotaCare, MnDHO and SNBC who reported looking for information on the Internet about how their healthplan works were asked two questions about use of their health plan's Internet site. Question text and response options available andreported are shown first, followed by program and plan results.
When you looked for information in the last 6 months, did you go to your healthplan's Internet site?
How useful was the information you found on your health plan's Internet site?
Yes, No
Not useful at all, A little useful,Somewhat useful, Vety useful
F&C·MAWent to health plan's Information very orInternet site for info somewhat useful
F&C-MA Average 37% 81%
Blue Plus 35% 78%
FirstPlan Blue 59% 89%
HealthPartners 40% 83%Itasca Medical Care 29% 86%
Medica 47% 64%
Metropolitan Health Plan 38% 82%
PrimeWest Health 23% 73%South Country Health Alliance 28% 100%
UCare 44% 75%
indicates a rating significantly higher/lower than the program average(see Appendix A: Technical Notes: Limitations and Statistical Signficance)
Page 72

.ll. I~~ Went to health plan's Information very orII Internet site for info somewhat useful
MinnesotaCare Average 41% 77%Blue Plus 48% 90%
FirstPlan Blue 33% 71%
HealthPartners 53% 83%
Medica 46% 81%
UCare 43% 60%IMCare I MHP I PW I SCHA 29% ~ 76%
indicates a rating significantly higher/lower than the program average(see Appendix A: Technical Notes: Limitations and Statistical Signficance)
Went to health plan's Information very orInternet site for info somewhat useful
MnDHO Average 27% 65%UCare 27% 65%
indicates a rating significantly higher/lower than the program average(see Appendix A: Technical Notes: Limitations and Statistical Signficance)
Went to health plan's Information very orInternet site for info somewhat useful
SNBC Average 33% 84%Blue Plus 38% 84%FirstPlan Blue I Medica I MHP I PW I SCHA I UCare 26% 83%
l'w indicates a rating significantly higher/lower than the program average(see Appendix A: Technical Notes: Limitations and Statistical Signficance)
Page 73

All enrollees were asked about access to the Internet and their interest in doing surveys like the CAHPS survey on the Internet.There were four questions in this domain. Question texts and response options availabe and reported are shown first, followed byprogram and plan results.
...0 ..., .... ..., ""''''''t''",,:I;:):;:)
:I;:) "~_I""~il;:)1l;;:: UIJ~IVII.;::J>
ICIJVI u;;:u
Is there a 0 VO player in the home? Yes, No
Do you have easy access to the Internet? Yes, No
Never, Less than once a month,How often do you use the Internet? 1 to 3 times each month, 1 to 3
times each week, Every day
Would you complete a survey like this one on the Internet? Yes, No
Easy Uses Internet... Would
~&CmMADVD player
access tocomplete
in home Internet Less than 1 to 3 times survey onNever once a each 1 to 3 times Everyday Internet
month month each week
F&C-MA Average 96% 71% 14% 10% 13% 19% 44% 53%
Blue Plus 97% 71% 13% 11% 13% 17% 46% 55%
FirstPlan Blue 98% l' 78% 10% 8% 14% 18% 50% l' 53%
HealthPartners 95% 70% 12% 8% 10% 22% 48% 56%
Itasca Medical Care 97% 72% 15% 11% 13% 23% 38% 56%
Medica 95% 70% 15% 9% 10% 18% 48% 52%
Metropolitan Health Plan 90% 65% 20% 10% 16% 18% 35% 51%
PrimeWest Health 96% 73% 11% 11% 14% 18% 46% 54%
South Country Health Alliance 96% 74% 13% 11% 15% 16% 45% 52%
UCare 94% 62% ~ 19% l' 13% 12% 21% 35% 50%
indicates a rating significantly higher/lower than the program average(see Appendix A: Technical Notes: Limitations and Statistical Signficance)
Page 74

Easy Uses Internet. .. WouldI1U!!~ ... DVD player completeIlIUIII ::::11
in home access toInternet Less than 1 to 3 times 1 to 3 times
survey onNever once a each each week Everyday Internet
month month
MinnesotaCare Average 91% 68% 23% 6% 10% 18% 43% 47%
Blue Plus 94% 75% 19% ~ 5% 9% 20% 46% 49%
FirstPlan Blue 91% 63% 25% 8% 11% 15% 41% 42% ~
HealthPartners 88% 73% l' 20% 4% ~ 11% 18% 47% 49%
Medica 93% 70% 20% 8% 7% ~ 18% 47% 52% l'UCare 90% 67% 26% 5% 12% 16% 41% 48%
IMCare I MHP I PW I SCHA 87% 61% ~ 27% l' 8% 10% 19% 36% ~ 44%
indicates a rating significantly higher/lower than the program average(see Appendix A: Technical Notes: Limitations and Statistical Signficance)
Page 75

Easy Uses Internet... WouldDVD player
access to completein home
Internet Less than 1 to 3 times survey onNever once a each 1 to 3 times Everyday Internet
month month each week
MSC/MSC+ Average 59% 24% 81% 3% 3% 5% 9% 11%
Blue Plus 56% 23% 82% 4% 2% 5% 7% 14%
Medica 60% 27% 76% 2% 3% 5% 13% 1" 6%
FirstPlan Blue I HP IIMCare I59% 22% 83% 3% 2% 5% 7% 14%MHP/PW/SCHA/UCare
indicates a rating significantly higher/lower than the program average(see Appendix A: Technical Notes: Limitations and Statistical Signficance)
Easy Uses Internet. .. WouldDVD player
access tocomplete
in home Internet Less than 1 to 3 times survey onNever once a each 1 to 3 times Everyday Internet
month month each week
MSHO Average 53% 18% 87% 3% 2% 3% 6% 10%
Blue Plus 51% 13% ~ 88% 3% 2% 2% 5% 10%
HealthPartners 65% 24% 82% 5% 2% 4% 7% 15%
Medica 57% 19% 87% 3% 1% 3% 6% 10%
PrimeWest Health 42% 17% 89% 1% 1% 3% 6% 8%
South Country Health Alliance 46% 16% 88% 3% 1% 2% 5% 7% ~
UCare 58% 1" 18% 86% 3% 2% 3% 7% 10%
FirstPlan Blue I 1MCare I MHP 58% 1" 19% 85% 2% 3% 1" 3% 7% 12%
indicates a rating significantly higher/lower than the program average(see Appendix A: Technical Notes: Limitations and Statistical Signficance)
Page 76
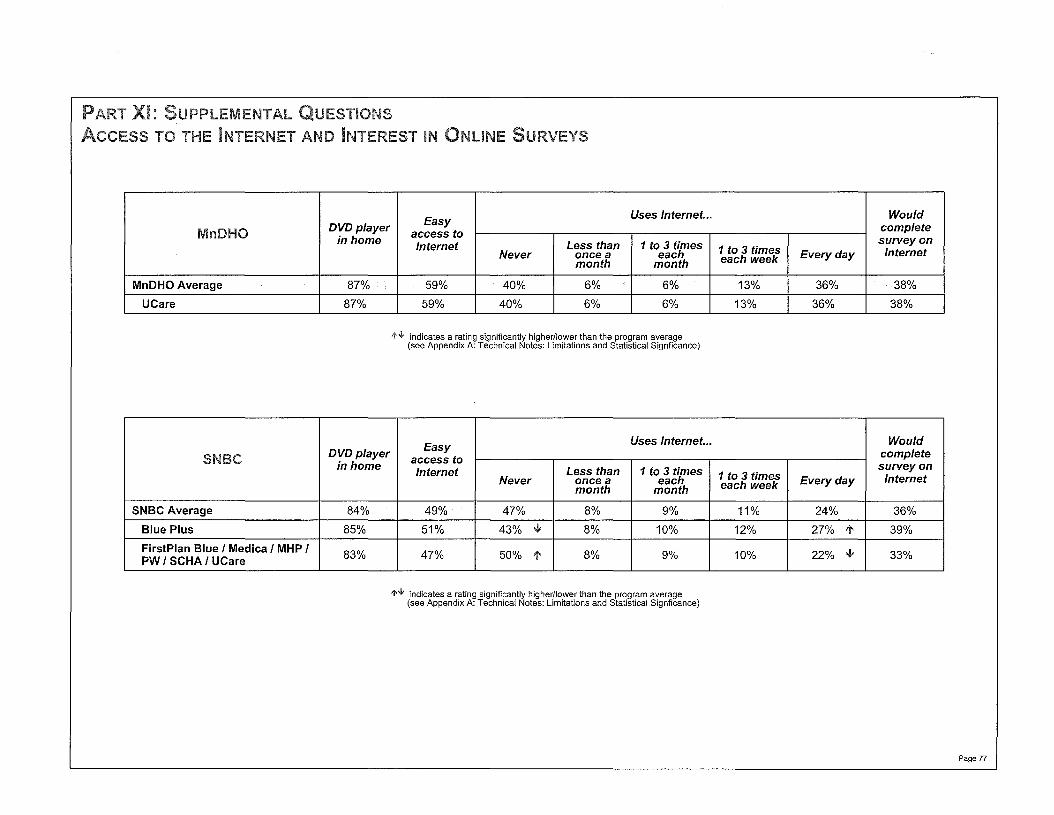
EasyUses Internet... Would
DVD player access tocomplete
in homeInternet Less than 1 to 3 times survey on
Never once a each 1 to 3 times Everyday Internetmonth month each week
MnDHO Average 87% 59% 40% 6% 6% 13% 36% 38%
UCare 87% 59% 40% 6% 6% 13% 36% 38%
indicates a rating significantly higher/lower than the program average(see Appendix A: Technical Notes: Limitations and Statistical Signficance)
EasyUses Internet... Would
DVD player access to completein home
Internet Less than 1 to 3 times survey onNever once a each 1 to 3 times Everyday Internet
month month each week
SNBC Average 84% 49% 47% 8% 9% 11% 24% 36%
Blue Plus 85% 51% 43% ~ 8% 10% 12% 27% 39%
FirstPlan Blue I Medica I MHP I83% 47% 50% 8% 9% 10% 22% 33%PW I SCHA I UCare
indicates a rating significantly higher/lower than the program average(see Appendix A: Technical Notes: Limitations and Statistical Signficance)
Page 77
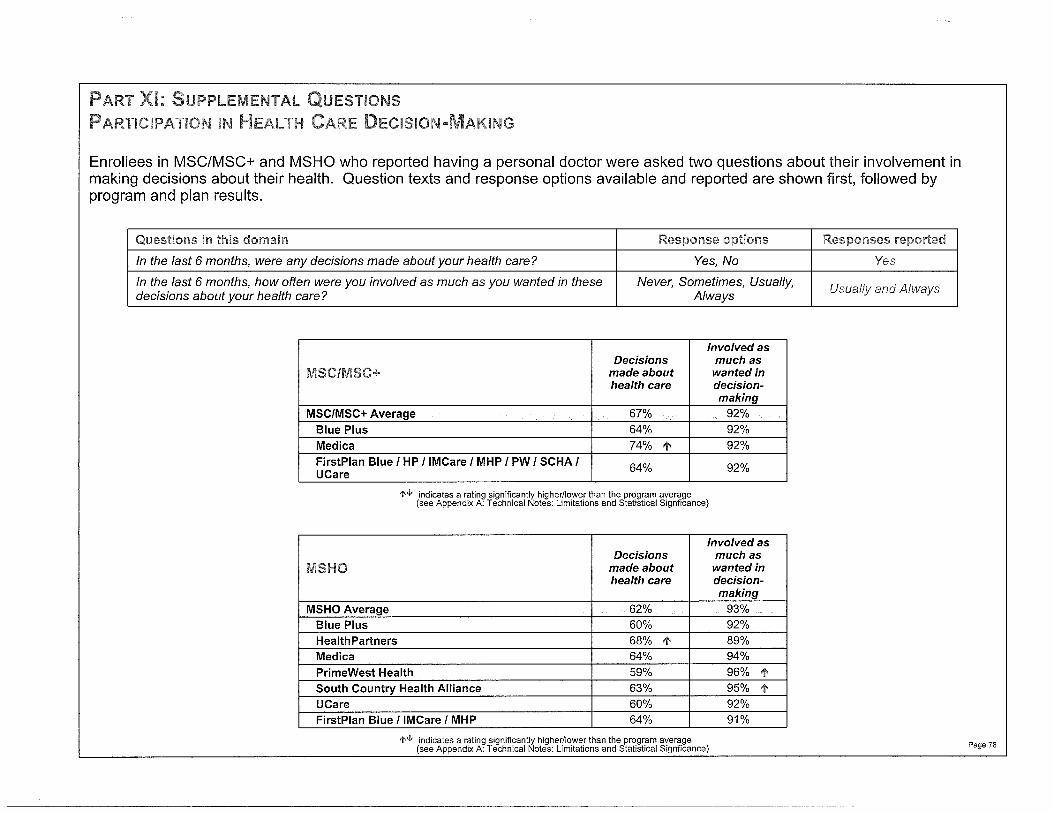
Enrollees in MSC/MSC+ and MSHO who reported having a personal doctor were asked two questions about their involvement inmaking decisions about their health. Question texts and response options available and reported are shown first, followed byprogram and plan results.
In the last 6 months, were any decisions made about your health care?
In the last 6 months, how often were you involved as much as you wanted in thesedecisions about your health care?
Yes, No
Never, Sometimes, Usually,Always
Involved asDecisions much as
MSC/MSC made about wanted inhealth care decision-
makingMSC/MSC+ Average 67% 92%
Blue Plus 64% 92%
Medica 74% 110 92%
FirstPlan Blue I HP IIMCare I MHP I PW I SCHA I 64% 92%UCare
indicates a rating significantly higher/lower than the program average(see Appendix A: Technical Notes: Limitations and Statistical Signficance)
Involved asDecisions much as
made about wanted inhealth care decision-
making
MSHO Average 62% 93%
Blue Plus 60% 92%
HealthPartners 68% 110 89%
Medica 64% 94%
PrimeWest Health 59% 96% 110
South Country Health Alliance 63% 95% 110
UCare 60% 92%
FirstPlan Blue IIMCare I MHP 64% 91%
indicates a rating significantly higher/lower than the program average(see Appendix A: Technical Notes: Limitations and Statistical Signficance) Page 78
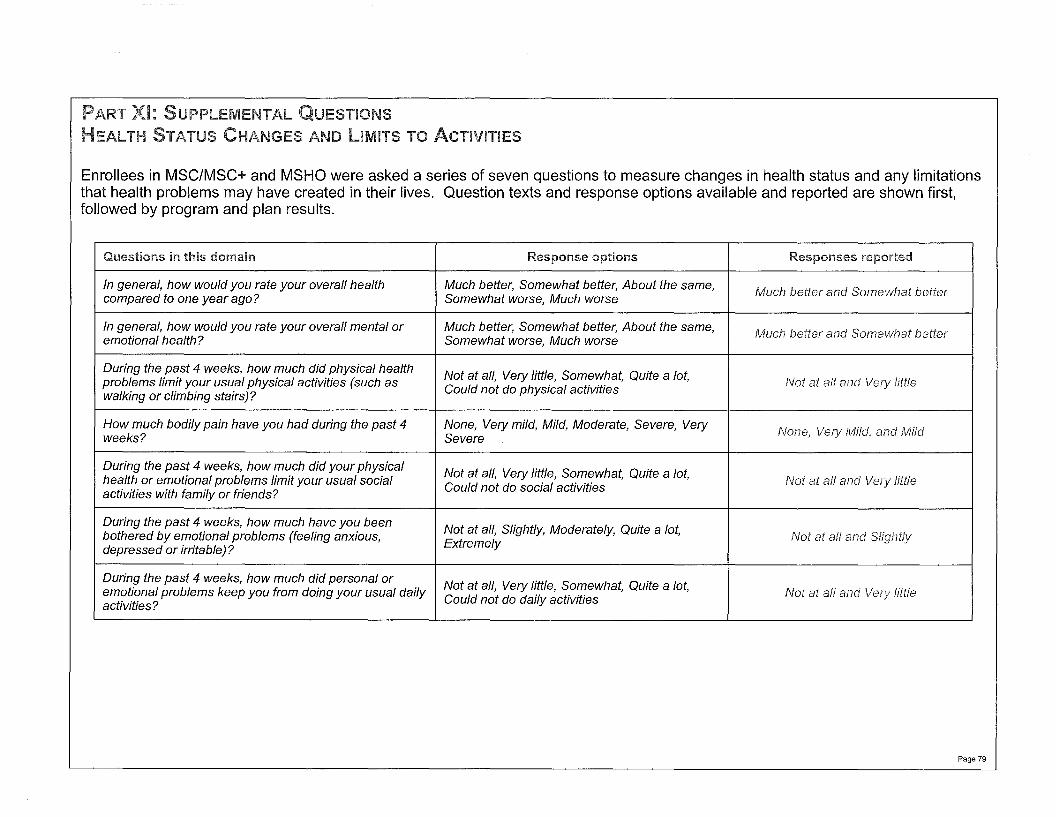
Enrollees in MSC/MSC+ and MSHO were asked a series of seven questions to measure changes in health status and any limitationsthat health problems may have created in their lives. Question texts and response options available and reported are shown first,followed by program and plan results.
In general, how would you rate your overall healthcompared to one year ago?
In general, how would you rate your overall mental oremotional health?
During the past 4 weeks, how much did physical healthproblems limit your usual physical activities (such aswalking or climbing stairs)?
How much bodily pain have you had during the past 4weeks?
During the past 4 weeks, how much did your physicalhealth or emotional problems limit your usual socialactivities with family or friends?
During the past 4 weeks, how much have you beenbothered by emotional problems (feeling anxious,depressed or irritable) ?
During the past 4 weeks, how much did personal oremotional problems keep you from doing your usual dailyactivities?
Much better, Somewhat better, About the same,Somewhat worse, Much worse
Much better, Somewhat better, About the same,Somewhat worse, Much worse
Not at all, Very little, Somewhat, Quite a lot,Could not do physical activities
None, Very mild, Mild, Moderate, Severe, VerySevere
Not at all, Very little, Somewhat, Quite a lot,Could not do social activities
Not at all, Slightly, Moderately, Quite a lot,Extremely
Not at all, Very little, Somewhat, Quite a lot,Could not do daily activities
Page 79
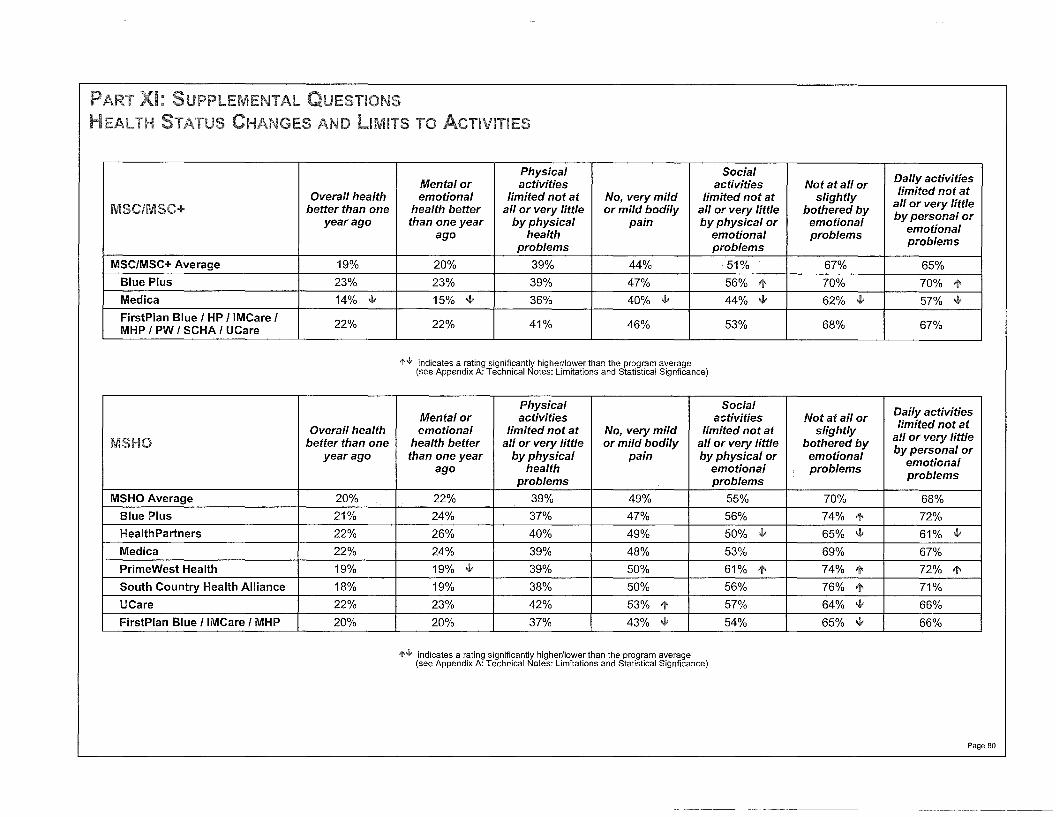
Physical SocialDaily activitiesMental or activities activities Not at all or
Overall health emotional limited not at No, very mild limited not at slightly limited not at
better than one health better all or very little or mild bodily all or very little bothered by all or very little
year ago than one year by physical pain by physical or emotional by personal oremotionalago health emotional problems problemsproblems problems
MSC/MSC+ Average 19% 20% 39% 44% 51% 67% 65%
Blue Plus 23% 23% 39% 47% 56% >t 70% 70% >tMedica 14% ~ 15% ~ 36% 40% ~ 44% 62% ~ 57% ~
FirstPlan Blue I HP IIMCare I 22% 22% 41% 46% 53% 68% 67%MHP/PW/SCHA/UCare
1'~ indicates a rating significantly higher/lowerthan the program average(see Appendix A: Technical Notes: Limitations and Statistical Signficance)
Physical Social Daily activitiesMental or activities activities Not at all orOverall health emotional limited not at No, very mild limited not at slightly limited not at
better than one health better all or very little or mild bodily all or very little bothered by all or very little
year ago than one year by physical pain by physical or emotional by personal oremotionalago health emotional problemsproblemsproblems problems
MSHO Average 20% 22% 39% 49% 55% 70% 68%
Blue Plus 21% 24% 37% 47% 56% 74% >t 72%
HealthPartners 22% 26% 40% 49% 50% ~ 65% ~ 61% ~
Medica 22% 24% 39% 48% 53% 69% 67%
PrimeWest Health 19% 19% ~ 39% 50% 61% >t 74% >t 72% >tSouth Country Health Alliance 18% 19% 38% 50% 56% 76% >t 71%
UCare 22% 23% 42% 53% >t 57% 64% ~ 66%
FirstPlan Blue IIMCare I MHP 20% 20% 37% 43% ~ 54% 65% ~ 66%
1'~ indicates a rating significantly higher/lower than the program average(see Appendix A: Technical Notes: Limitations and Statistical Signficance)
Page 80

Enrollees in MSC/MSC+ and MSHO were asked three questions to determine how many had received flu shots and pneumoniavaccinations. Question texts and response options available and reported are shown first, followed by program and plan results.
Have you had a flu shot since September 1, 2008?
Did you get the flu shot at your doctor's office or clinic or did you get it from anotherplace like a store (for example, Cub Foods or Wal-Mart) or senior center?
Have you ever had a pneumonia vaccination?
Yes, No
Doctor's office or clinic; Anotherplace: store or senior center
Yes, No
Got flu shot at:
Had flu shot Had pneumonia
Doctor's office or vaccinationclinic Another place
MSC/MSC+ Average 73% 81% 19% 76%Blue Plus 79% l' 78% 22% 81% l'Medica 73% 81% 19% 71%
""FirstPlan Blue I HP IIMCare I MHP I PW I SCHA I UCare 67%""
84% 16% 75%
indicates a rating significantly higher/lower than the program average(see Appendix A: Technical Notes: Limitations and Statistical Signficance)
Got flu shot at:
Had flu shot Had pneumonia
Doctor's office or vaccinationclinic Another place
MSHO Average 79% 75% 25% 82%Blue Plus 81% 72% 28% 82%HealthPartners 82% 86% l' 14%
""82%
Medica 76% 75% 25% 82%PrimeWest Health 81% 75% 25% 79%South Country Health Alliance 77% 69%
""31% l' 86% l'
UCare 78% 74% 26% 80%FirstPlan Blue I 1MCare I MHP 77% 77% 23% 84%
indicates a rating significantly higher/lower than the program average(see Appendix A: Technical Notes: Limitations and Statistical Signficance)
Page 81

Overview of Programs
Families and Children - MA (F&C-MA; formerly called the Prepaid Medical Assistance Plan or PMAP) - A state-run managedcare plan that purchases health care services on a prepaid capitated basis from licensed health maintenance organizations andcounty based purchasers. Families and Children - MA provides health care services to people with low income who are blind ordisabled, to children in families with low incomes, and children who are needy.
MinnesotaCare - A state health care program for uninsured Minnesota residents who meet certain income and other eligibilityrequirements. MinnesotaCare offers a benefit package of services through prepaid managed care health plans. All enrollees inMinnesotaCare pay a premium based on family size and income. The premium is the monthly amount the enrollees must pay tocontinue health coverage. Premiums are determined based on a sliding scale of household income and size and the number ofindividuals covered.
Minnesota Senior Care (MSC) - A mandatory managed care program that provides most state plan Medicaid health care services toincome-eligible persons age 65 and older, under a 1915(b) waiver.
Minnesota Senior Care Plus (MSC+) - A mandatory managed care program for eligible persons age 65 and older, that providesmost Medicaid State Plan services offered under the Minnesota Senior Care program (as permitted under the 1915(b) waiver);Elderly Waiver (EW) services (as permitted under a 1915(c) waiver); and the first 180 days of care in a nursing facility, after whichtime coverage reverts to fee-for-service and is paid for by the State instead of the managed care organization. These services areprovided through managed care organizations selected by enrollees. The managed care organization contracts with the State todeliver care under a capitated payment arrangement. In 2007, enrollment was limited to county-based purchasing managed careorganizations. For the purpose of this report, MSC+ enrollees are combined with MSC enrollees.
Minnesota Senior Health Options (MSHO) - A voluntary managed care program for eligible persons, age 65 and older, that,operating under 1915(a), provides Medicaid State Plan services offered under the Minnesota Senior Care program (MSC); allMedicare services under parts A, Band 0; Elderly Waiver (EW) services (as permitted under a 1915(c) waiver); and the first 180 daysof care in a nursing facility, after which time coverage reverts to fee-for-service and is paid for by the State instead of the managedcare organization. These services are provided through managed care organizations selected by enrollees. The managed careorganization contracts with the State to deliver the care under a capitated payment arrangement.
Page 82

Minnesota Disability Health Options (MnDHO) - MnDHO is a voluntary program for enrollees with physical disabilities who arebetween ages 18 through 64, or over 64 if the enrollees are enrolled prior to reaching their 65th birthday. DHS contracts with oneMedicare Advantage Special Needs Plan to integrate Medicare and Medicaid services for enrollees, including Part D drug coverage.MnDHO serves both dual and non-dual members. They must be eligible for MA, reside within the MnDHO service area, and have acertified disability. MnDHO also covers enrollees in nursing facilities, acute care facilities, and enrollees living in the community.Enrollees may also be identified by CMS as having end-stage renal disease or age 65 after enrollment in the MCO's MnDHO productand may remain enrolled in the MCO's MnDHO product, after reaching age 65. UCare is currently the only participating MCO.
Special Needs Basic Care (SNBC) - SNBC, implemented on January 1, 2008, is a voluntary managed care program that combinesMedicare and Medicaid financing and services for people ages 18 to 64, who have a certified disability or are determined to have adisability by the local agency for individuals with developmental disabilities, and are eligible for MA, with or without Medicare. DHScontracts with seven Medicare Advantage Special Needs Plans to provide SNBC. SNBC offers all medically necessary MedicaidState plan services with the exception of Home and Community Based Service (HCBS) waivers, Personal Care Attendant (PCA) andPrivate Duty Nursing (PDN). HCBS waiver services, PCA, and PDN will continue to be paid by MA fee-far-service. If an enrollee isMedicare eligible, the SNBC plan covers all Medicare services, including prescription drugs covered by the Medicare prescriptiondrug program (Part D), and any alternative services the health plan may choose to offer. The SNBC health plan pays for the first 100days of nursing facility care for community enrollees who enter a nursing facility after enrollment.
Page 83

Composites and Related Questions
Each individual composite presented in this report includes a series of related questions, as follows:
The survey asked people to report how often doctors or other health providers:1. Listened carefully2. Explained things in an understandable way3. Showed respect for what they had to say4. Spent enough time with them
The survey asked people to report how often:health plan's customer service gave needed information or help
They were treated with courtesy and respect by their health plan's customer service
Page 84
limitations and Statistical Significance
Difference-of-means statistical tests for significant differences were used in this report. Small differences between numbers shouldbe ignored when comparing the ratings and percentages in the tables and graphs. These small differences may reflect samplingvariation rather than real differences. In some instances, a difference between two numbers may be indicated as significant, but, inother instances, an equivalent difference is not indicated as significant. The ability to detect significant differences is related to themagnitude of the difference but also to the number of cases available for statistical analysis. Because the number of completed casesvaried among the plans, equivalent differences could have varying statistical significance.
Readers should also note that results have been rounded to the nearest whole number. Thus, results between 0 and .5 appear as 0,but may still be considered statistically significant.
The findings in this report are subject to some limitations in survey design and analysis. These limitations should be consideredcarefully when interpreting or generalizing the findings presented. These limitations include:
Adjustments to the comparisons. Before conducting significance tests, the data were adjusted for differences in enrollees' ageand self-reported health status. Data were not adjusted, however, for enrollee variations that were not measured in the survey, suchas income, employment status, specific health conditions, and beliefs or expectations.
Single point in time. The results of this survey represent a snapshot of comparisons of health plans at a single point in time. Thesecomparisons may not reflect stable patterns of consumer ratings over time. Additional surveys over time using the same questionsand methods will be needed to establish trends.
Subjective measurements only. The questions in this survey reflect the subjective evaluation and opinions of the respondents.The relationship between these responses and other measures of health plan performance and service quality have not beenestablished.
Causal inference. Although this analysis examines whether enrollees of various health plans report differential satisfaction withvarious aspects of their plan, these differences cannot be attributed totally to the plan. People choose to become members ofspecific health plans for reasons that cannot be fully addressed in this analysis (such as income, prior medical experience, anticipatedneeds, and expectations).
Page 85

Sampling error. The results in this report were determined by surveying a sample of all enrollees. Sampling error is the extent towhich survey results may differ from results that could have been obtained if all enrollees in a plan had been surveyed. The size ofthe error is dependent on the number of enrollees in the sample that responded to the survey. In this survey, the sampling error forthe different plans varies from approximately 4% to 7%. The smaller sample errors are associated with having a greater number ofcases available for analysis.
Averages for programs. Programs such as the Families and Children - MA (F&C-MA) have several participating plans. This reportshows results for each plan separately and also shows an average for the entire program. To calculate the program average, theresponses from enrollees in all plans within the program were considered together.
Summary rates. Summary rates are single statistics calculated for a question according to CAHPS specifications. Summary ratesrepresent the percentage of respondents who choose the most positive response option ("always", or a "9" or "10").
It is important to note that in those sections of this report for Plan Comparisons (Parts IV, V, VI, and VII), ratings of 9 and 10 areconsidered to be Most Positive ratings when reporting the percentages of people who rated the plan most positively. In the sectionon Health Plan Opportunities for Improvement (Part VIII), average ratings of 8, 9, or 10 are considered as an Opportunity forImprovement.
Valid surveys and unanswered questions. In this survey, DHS adopted NCQA 4.0H guidelines for determining a completedquestionnaire. According to these guidelines, questionnaires were considered complete if respondents did not say 'No' to Question 1("Our records show that you are now in (plan name). Is that right?" ) and if they provided a valid response to at least one question.While the majority of respondents who started the questionnaire provided responses to most items, some did not. Missing answerswere not included in the results.
Page 86

Several questions in the survey ask about respondent characteristics. These questions include gender, age, health status,educational level, and race and ethnicity. For each program, the percent of respondents within each of these categories is shown inthe table below:
Male 190/0 40% 290/0 25% 47% 35%Female 81% 60% 71% 75% 53% 65%
HS or less 53% 43% 69% 81% 51% 62%Some college 40% 43% 17% 13% 33%> 30%
College graduate 7% 14% 15% 6% 17% 8%
ExcellenWery Good 50% 49% 17% 20% 23% 20%Good 34% 34% 36% 38% 340/0 32%Fair/Poor 160/0 17% 47% 42% 430/0 480/0
Yes 5% 2% 3% 4% 3% 4%No 95% 980/0 97% 96% 97% 96%
White 69% 840/0 800/0 79% 66% 85%Black/African American 11% 50/0 4% 5% 17% 7%Asian 6% 3% 6% 9% 6% 1%Pacific Islander 1% 0% 0% 0% 0% 00/0American Indian 5% 2% 3% 2% 3% 4%
Other 4% 3% 2% 2% 4% 4%
Page 87
Top Related