


Languages
Pages
Legal

MINISTRY USE ONLY
Place Personal Education Number (PEN) here.
© 2004 Ministry of Education
MINISTRY USE ONLY
Place Personal Education Number (PEN) here.
MINISTRY USE ONLY
Geography 12
JANUARY 2004
Course Code = GEO
Student Instructions1. Place the stickers with your Personal
Education Number (PEN) in the allottedspaces above. Under no circumstance isyour name or identification, other thanyour Personal Education Number, toappear on this booklet.
2. Ensure that in addition to this examinationbooklet, you have a Data Booklet and anExamination Response Form. Follow thedirections on the front of the ResponseForm.
3. Disqualification from the examination willresult if you bring books, paper, notes orunauthorized electronic devices into theexamination room.
4. When instructed to open this booklet, checkthe numbering of the pages to ensure thatthey are numbered in sequence from pageone to the last page, which is identified by
*END OF EXAMINATION* .
5. At the end of the examination, place yourResponse Form inside the front cover of thisbooklet and return the booklet and yourResponse Form to the supervisor.

Question 1:
1. .
(6)
Question 2:
2. .
(4)
Question 3:
3. .
(6)
Question 4:
4. .
(4)
Question 5:
5. .
(5)
Question 6:
6. .
(4)
Question 7:
7. .
(4)
Question 8:
8. .
(3)
Question 9:
9. .
(4)
Question 10:
10. .
(10)

Geography 12
JANUARY 2004
Course Code = GEO

GENERAL INSTRUCTIONS
1. Electronic devices, including dictionaries and pagers, are not permitted in theexamination room.
2. All multiple-choice answers must be entered on the Response Form using anHB pencil. Multiple-choice answers entered in this examination booklet will notbe marked.
3. For each of the written-response questions, write your answer in ink in the spaceprovided in this booklet.
4. Ensure that you use language and content appropriate to the purpose and audienceof this examination. Failure to comply may result in your paper being awarded azero.
5. This examination is designed to be completed in two hours. Students may,however, take up to 30 minutes of additional time to finish.
GEOGRAPHY 12 PROVINCIAL EXAMINATION
ValueSuggested
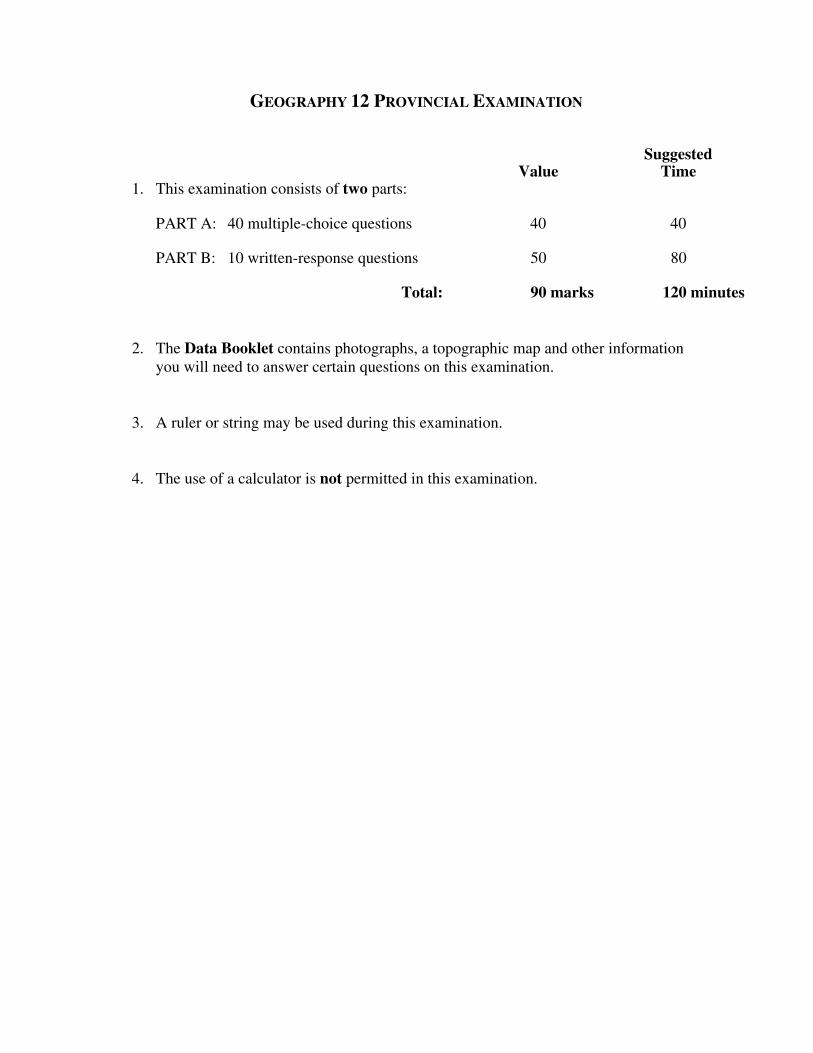
Time1. This examination consists of two parts:
PART A: 40 multiple-choice questions 40 40
PART B: 10 written-response questions 50 80
Total: 90 marks 120 minutes
2. The Data Booklet contains photographs, a topographic map and other informationyou will need to answer certain questions on this examination.
3. A ruler or string may be used during this examination.
4. The use of a calculator is not permitted in this examination.

THIS PAGE INTENTIONALLY BLANK

OVER- 1 -
PART A: MULTIPLE CHOICE
Value: 40 marks Suggested Time: 40 minutes
INSTRUCTIONS: For each question, select the best answer and record your choice on the ResponseForm provided. Using an HB pencil, completely fill in the circle that has the lettercorresponding to your answer.
1. Identify the world’s largest reserves of freshwater.
A. lakesB. riversC. glaciersD. aquifers
Use the following diagram to answer question 2.
cool water ispumped down
hot waterreturns
powerstation
heated rock
2 km
2. What type of power generation is illustrated in the diagram?
A. geothermalB. hydro-electricC. nuclear fusionD. thermal energy
3. What is the main cause of desertification?
A. salinization of soilB. poor irrigation practicesC. overgrazing by livestockD. growing of monoculture crops

- 2 -
4. Tsunamis are associated with which two spheres?
A. atmosphere and biosphereB. lithosphere and hydrosphereC. lithosphere and asthenosphereD. hydrosphere and thermosphere
Use the following table to answer question 5.
Skills
• surveying• map plotting• contouring techniques• geographic information systems (GIS)
5. Which career is based upon an expert knowledge of the skills above?
A. ranchersB. cartographersC. meteorologistsD. horticulturalists
6. Which of the following is the major cause of Antarctica’s shrinking ice sheet?
A. sulphur dioxide destroying stratospheric ozoneB. an increase in carbon dioxide in the atmosphereC. a rise in methane levels from the burning of rainforestsD. chlorofluorocarbons released during thermal power production
7. In which layer of the atmosphere are clouds primarily found?
A. troposphereB. mesosphereC. stratosphereD. thermosphere
8. What term describes the temperature at which water vapour in the air condenses?
A. dew pointB. translocationC. relative humidityD. evapotranspiration

OVER- 3 -
Use the following weather data to answer questions 9 to 11.
R
1000
996992
Q
SP
Weather MapWeather Station
8
7
924
–12
ZY10
8
960
–10
8
3
014
+08
W
7
2
022
+06
X
9. Identify the wind direction at weather station Y.
A. southeastB. northeastC. southwestD. northwest
10. Which weather station best represents location P on the weather map above?
A. WB. XC. YD. Z
Use the following cross-section along with the weather map above to answer question 11.
cool air
land
warm air
11. Which location on the weather map best represents the cross-section above?
A. PB. QC. RD. S

- 4 -
Use the following map to answer questions 12 and 13.
North America
49∞N
30∞N
49∞N
30∞N
X
Y
12. Identify the prevailing winds at location X on the map.
A. ChinookB. WesterliesC. Polar EasterliesD. Northeast Trade
13. Which of the following moderates the temperatures at location Y on themap above?
A. katabatic windsB. urban heat islandC. warm ocean currentD. continental air mass
Use the following description to answer question 14.
Weather Phenomena
• generates energy from warm ocean• influences large geographic region• rotation: counterclockwise around an eye• duration: lasts several days
14. Which of the following phenomena is described above?
A. tornadoB. hurricaneC. equatorial monsoonD. mid-latitude cyclone
OVER- 5 -
REFER TODATA BOOKLET
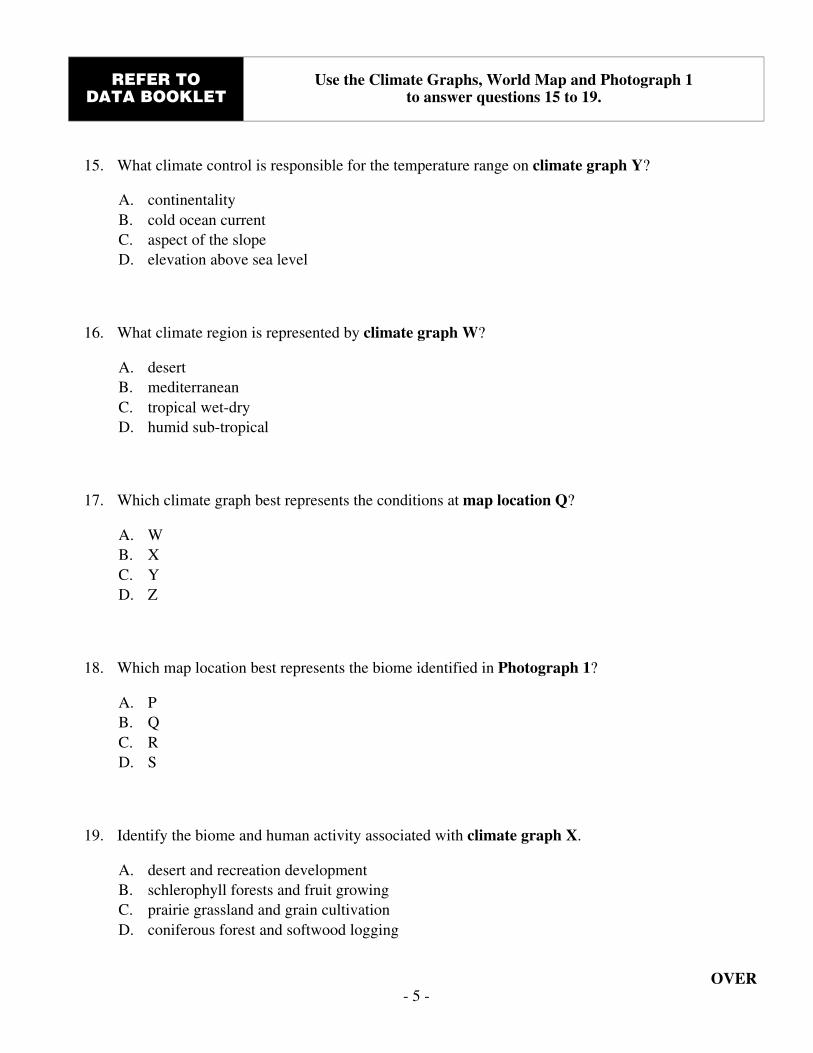
Use the Climate Graphs, World Map and Photograph 1to answer questions 15 to 19.
15. What climate control is responsible for the temperature range on climate graph Y?
A. continentalityB. cold ocean currentC. aspect of the slopeD. elevation above sea level
16. What climate region is represented by climate graph W?
A. desertB. mediterraneanC. tropical wet-dryD. humid sub-tropical
17. Which climate graph best represents the conditions at map location Q?
A. WB. XC. YD. Z
18. Which map location best represents the biome identified in Photograph 1?
A. PB. QC. RD. S
19. Identify the biome and human activity associated with climate graph X.
A. desert and recreation developmentB. schlerophyll forests and fruit growingC. prairie grassland and grain cultivationD. coniferous forest and softwood logging

- 6 -
Use the following description to answer question 20.
Tundra vegetation such as mosses and lichenare found at high latitudes and high elevations.
20. Which geographic theme is associated with the description above?
A. regionB. movementC. absolute locationD. human/physical interaction
21. Which rock classification is associated with folded strata and fossil fuels?
A. igneousB. magmaticC. sedimentaryD. metamorphic

OVER- 7 -
Use the following map to answer question 22.
Plate boundary
•
••
• •••
• Number of deaths
4 200
22 700
66 000
83 000 100 000
200 000
143 000
Number of Deaths Resulting from Major Earthquakes
22. According to the data above the largest number of deaths is associated with whichplate activity?
A. riftingB. divergenceC. convergenceD. translocation
23. The convection currents that move crustal plates are found within which sphere?
A. troposphereB. centrosphereC. thermosphereD. asthenosphere

- 8 -
Use the following diagram to answer questions 24 and 25.
X
24. Which process is responsible for the formation of X in the diagram above?
A. tensionB. shearingC. compressionD. fluvial erosion
25. Which of the following features is shown at X?
A. horstB. grabenC. fault scarpD. block mountain
OVER- 9 -
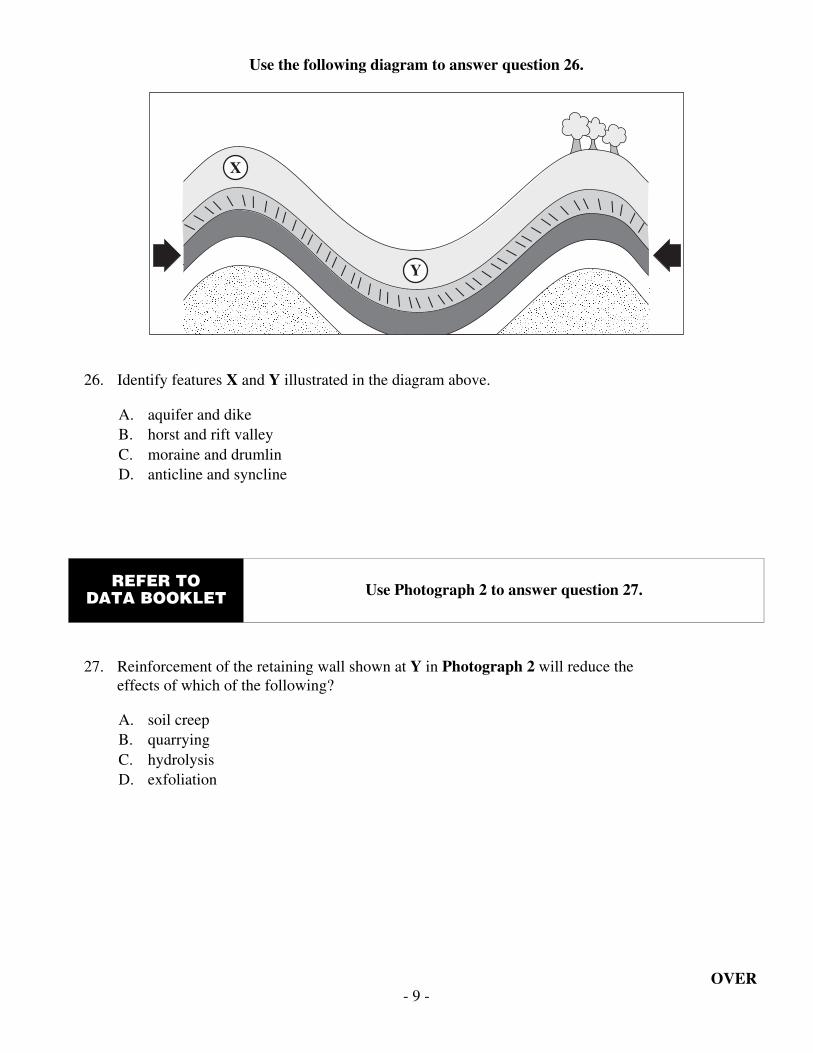
Use the following diagram to answer question 26.
\ \ \ \ \ \ \ \ \ \ \ \ \ \ \ \ \ \ \ \ \ \ \ \ \ \ \ \ \ \ \ \ \ \ \ \ \ \ \ \ \ \ \ \ \ \ \
\X
Y
26. Identify features X and Y illustrated in the diagram above.
A. aquifer and dikeB. horst and rift valleyC. moraine and drumlinD. anticline and syncline
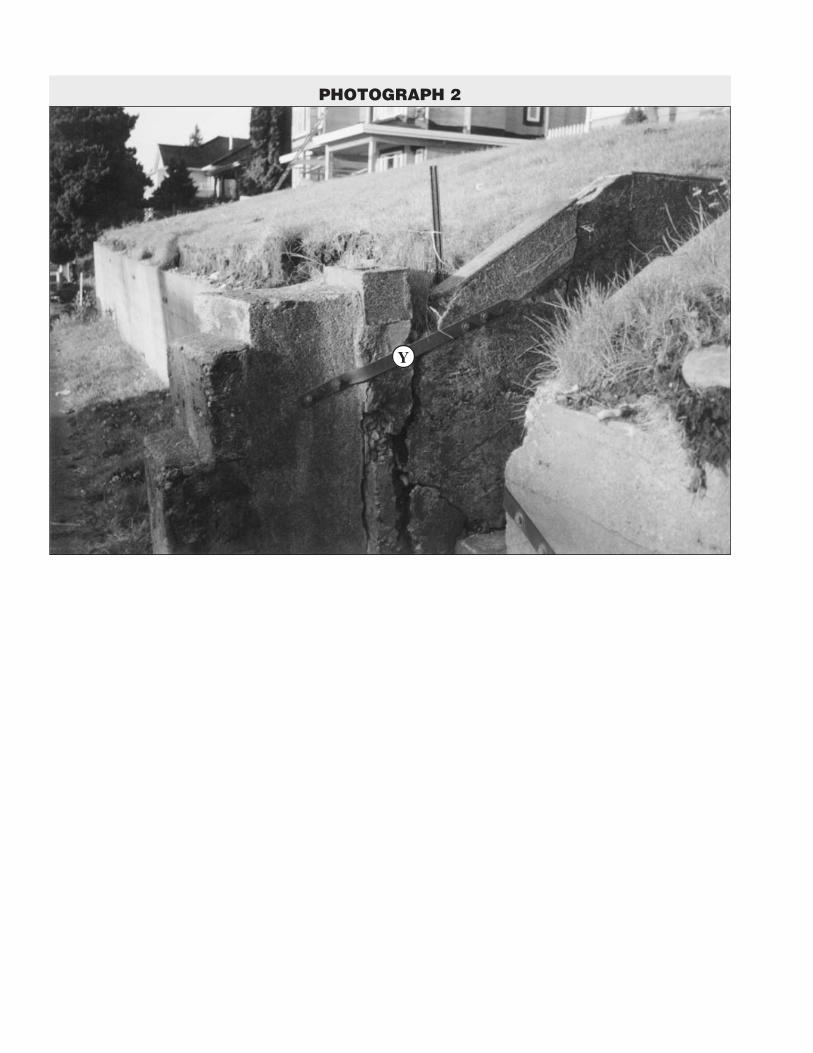
REFER TODATA BOOKLET Use Photograph 2 to answer question 27.
27. Reinforcement of the retaining wall shown at Y in Photograph 2 will reduce theeffects of which of the following?
A. soil creepB. quarryingC. hydrolysisD. exfoliation

- 10 -
REFER TODATA BOOKLET Use Photograph 3 to answer question 28 and 29.
28. What is the horizontal band of igneous rock shown at Z in the photograph?
A. sillB. dikeC. eskerD. aquifer
29. What weathering process is dominant in Photograph 3?
A. deflationB. carbonationC. frost shatteringD. hydraulic action

OVER- 11 -
Use the following diagram to answer questions 30 and 31.
X
Bas
ed o
n a
diag
ram
fro
m I
nch
and
Ston
e, T
he P
hysi
cal
Env
iron
men
t, 2n
d ed
., ©
1972
, McG
raw
-Hill
Rye
rson
.
30. Identify feature X in the diagram.
A. cirqueB. moraineC. truncated spurD. hanging valley
31. Which processes shaped the landscape in the diagram above?
A. plucking and abrasionB. quarrying and saltationC. frost shattering and deflationD. mass wasting and deposition
- 12 -
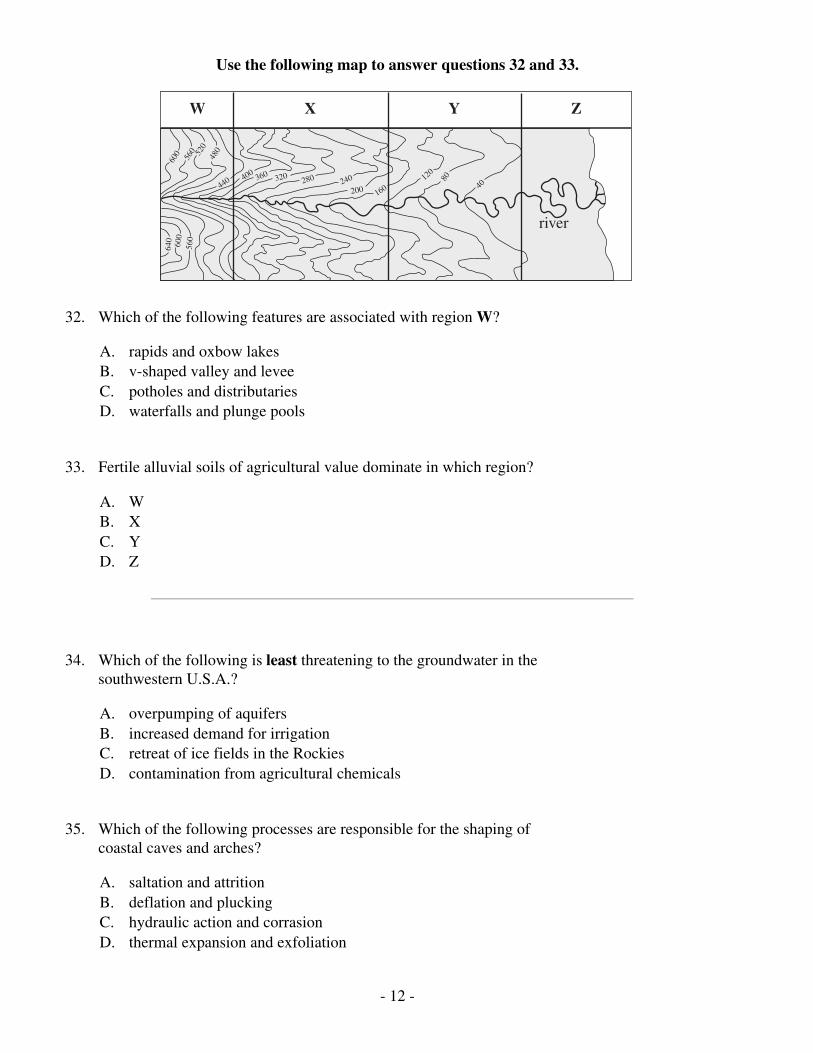
Use the following map to answer questions 32 and 33.
600 560 52
048
0
440 400 360 320 280 240
200 16012
0
80
4056
0
600
640
W X Y Z
river
32. Which of the following features are associated with region W?
A. rapids and oxbow lakesB. v-shaped valley and leveeC. potholes and distributariesD. waterfalls and plunge pools
33. Fertile alluvial soils of agricultural value dominate in which region?
A. WB. XC. YD. Z
34. Which of the following is least threatening to the groundwater in thesouthwestern U.S.A.?
A. overpumping of aquifersB. increased demand for irrigationC. retreat of ice fields in the RockiesD. contamination from agricultural chemicals
35. Which of the following processes are responsible for the shaping ofcoastal caves and arches?
A. saltation and attritionB. deflation and pluckingC. hydraulic action and corrasionD. thermal expansion and exfoliation
OVER- 13 -
REFER TODATA BOOKLET
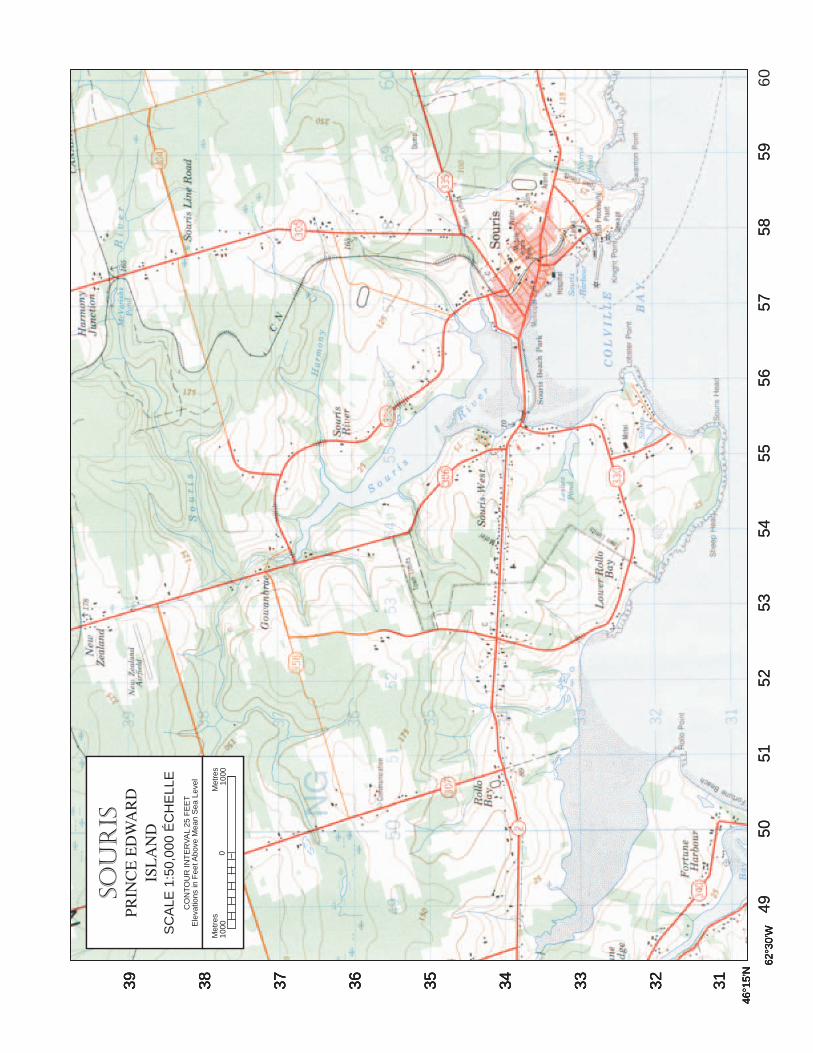
Use Photograph 4 and the Topographic Map to answer questions 36 to 40.
36. What is the direction from Harmony Junction (5739) to Fortune Harbour (4931)?
A. northeastB. northwestC. southeastD. southwest
37. What is the approximate road distance between the intersection at 508340 and thebridge at 554337?
A. 2.25 kmB. 4.5 kmC. 9.0 kmD. 18 km
38. Which of the following grid squares has the steepest slopes?
A. 5136B. 5333C. 5438D. 5937
39. What is the physical feature found at 14D on the air photograph?
A. spitB. stackC. tomboloD. headland
40. What is the purpose of the cultural feature at grid reference 575327?
A. as docks for fishing vesselsB. a recreation area for the people of the regionC. to protect the harbour from the action of wavesD. to provide a ramp for the vehicles to board the ferry

- 14 -
PART B: WRITTEN RESPONSE
Value: 50 marks Suggested Time: 80 minutes
INSTRUCTIONS: Answer each question in the space provided. You may not need all of the spaceprovided. Answers should be written in ink. Comprehensive answers arerequired for full marks.
REFER TODATA BOOKLET Use Photograph 4 and the Topographic Map to answer question 1.
1. a) Using the air photograph and the topographic map, describe three ways thatthe physical environment benefits humans. (3 marks)
i)
ii)
iii)
b) Outline three different threats that human activities have on the Souris region. (3 marks)
i)
ii)
iii)
OVER- 15 -
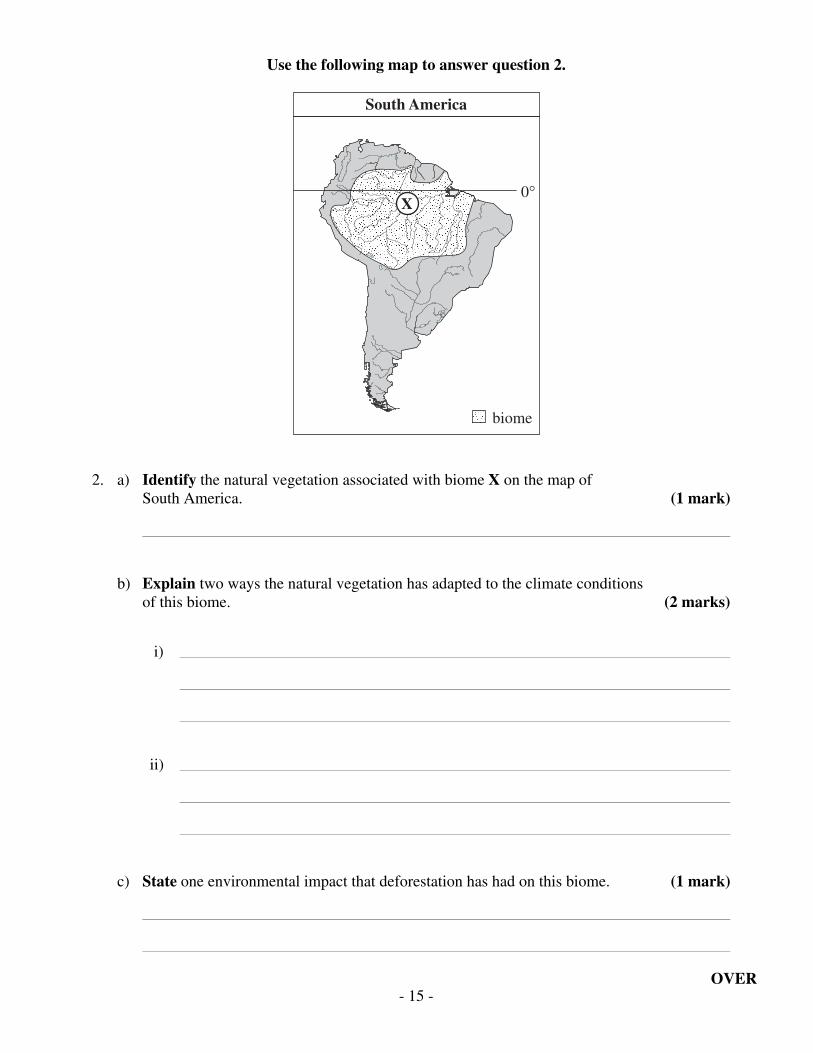
Use the following map to answer question 2.
South America
X0∞
biome
2. a) Identify the natural vegetation associated with biome X on the map ofSouth America. (1 mark)
b) Explain two ways the natural vegetation has adapted to the climate conditionsof this biome. (2 marks)
i)
ii)
c) State one environmental impact that deforestation has had on this biome. (1 mark)

- 16 -
Organization and Planning
OVER- 17 -
REFER TODATA BOOKLET Use the Muskwa-Kechika information to answer question 3.
3. Defend one of the following positions. Indicate your selection with a ✓. (6 marks)
Develop the Muskwa-Kechika for its natural resources.
Expand the Muskwa-Kechika region as a protected area.
- 18 -
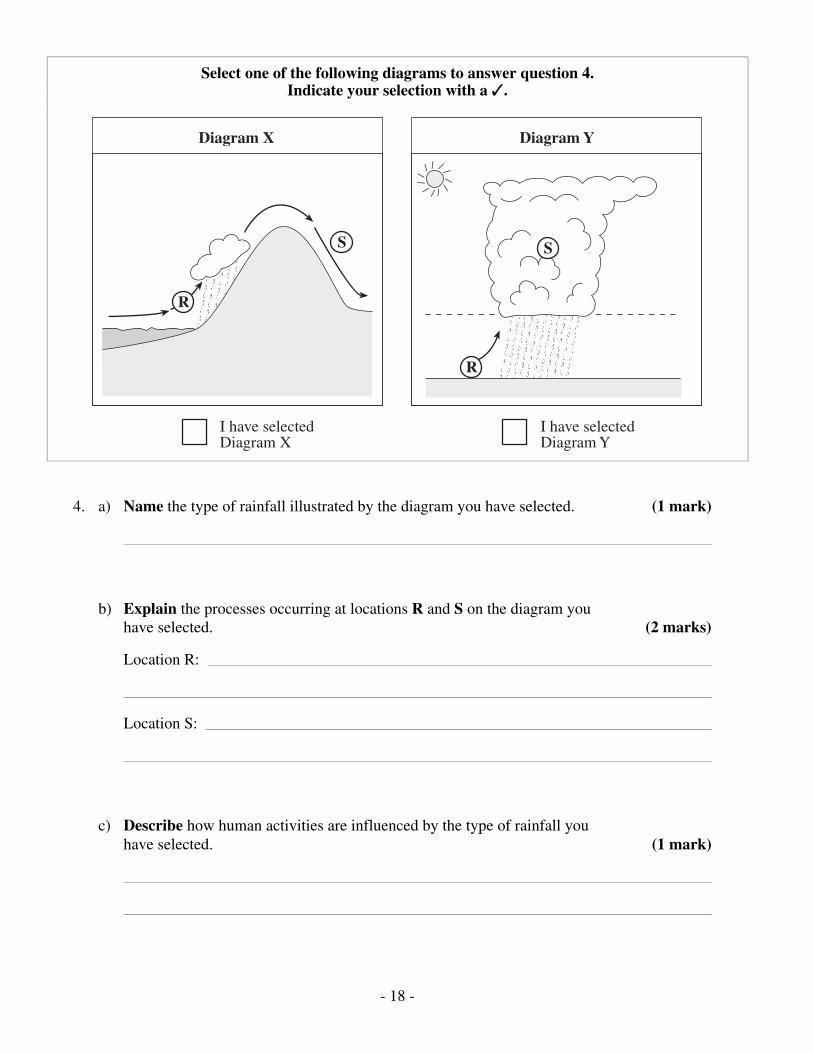
Select one of the following diagrams to answer question 4.Indicate your selection with a ✓.
R
S
////
/ / / //
//
S
R
I have selectedDiagram Y
I have selectedDiagram X
Diagram X Diagram Y
4. a) Name the type of rainfall illustrated by the diagram you have selected. (1 mark)
b) Explain the processes occurring at locations R and S on the diagram youhave selected. (2 marks)
Location R:
Location S:
c) Describe how human activities are influenced by the type of rainfall youhave selected. (1 mark)

OVER- 19 -
REFER TODATA BOOKLET Use Photograph 5 to answer question 5.
5. a) Explain the processes that have created this volcanic cone. (2 marks)
b) Outline one physical and one economic threat of volcanic activity. (2 marks)
Physical Threat:
Economic Threat:
c) Suggest one way that people could prepare for a volcanic eruption. (1 mark)

- 20 -
Select one of the following atmospheric threats to answer question 6.Indicate your selection with a ✓.
Ozone depletionAcid precipitation
6. a) State a major cause of the atmospheric threat that you have selected. (1 mark)
b) Explain how the atmospheric threat you selected impacts the environment. (1 mark)
c) Suggest two different solutions to the atmospheric threat you selected. (2 marks)
i)
ii)

OVER- 21 -
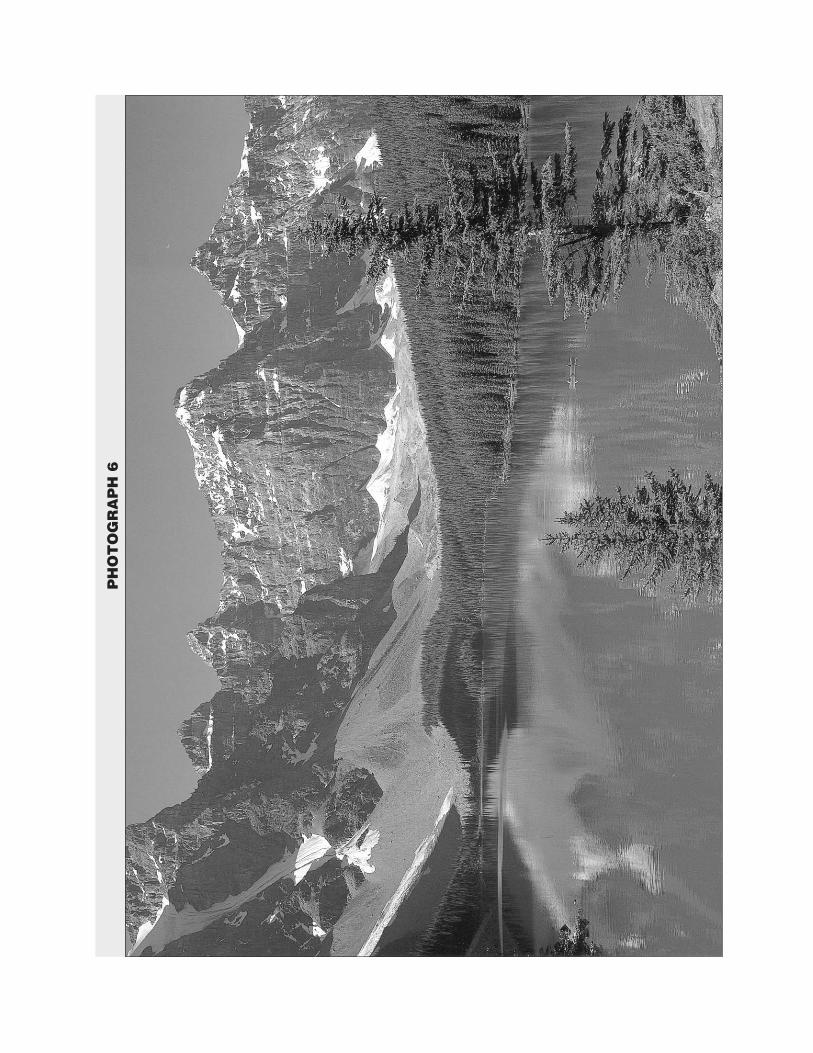
REFER TODATA BOOKLET Use Photograph 6 to answer question 7.
7. Analyze the geographic theme of place (physical/natural and humancharacteristics) in landscapes like the one in Photograph 6. (4 marks)

- 22 -
Use the following headline to answer question 8.
“Millions of tons of rich soils lostneedlessly each year in Canada,”reports Agriculture Canada.
World Examiner
From
Und
erst
andi
ng O
ur E
nvir
onm
ent
by D
unlo
p an
d Ja
ckso
n.O
xfor
d U
nive
rsity
Pre
ss.
©19
91.
8. Outline three soil conservation techniques that could be used to reduce the causesof soil erosion in Canada. (3 marks)
i)
ii)
iii)
OVER- 23 -
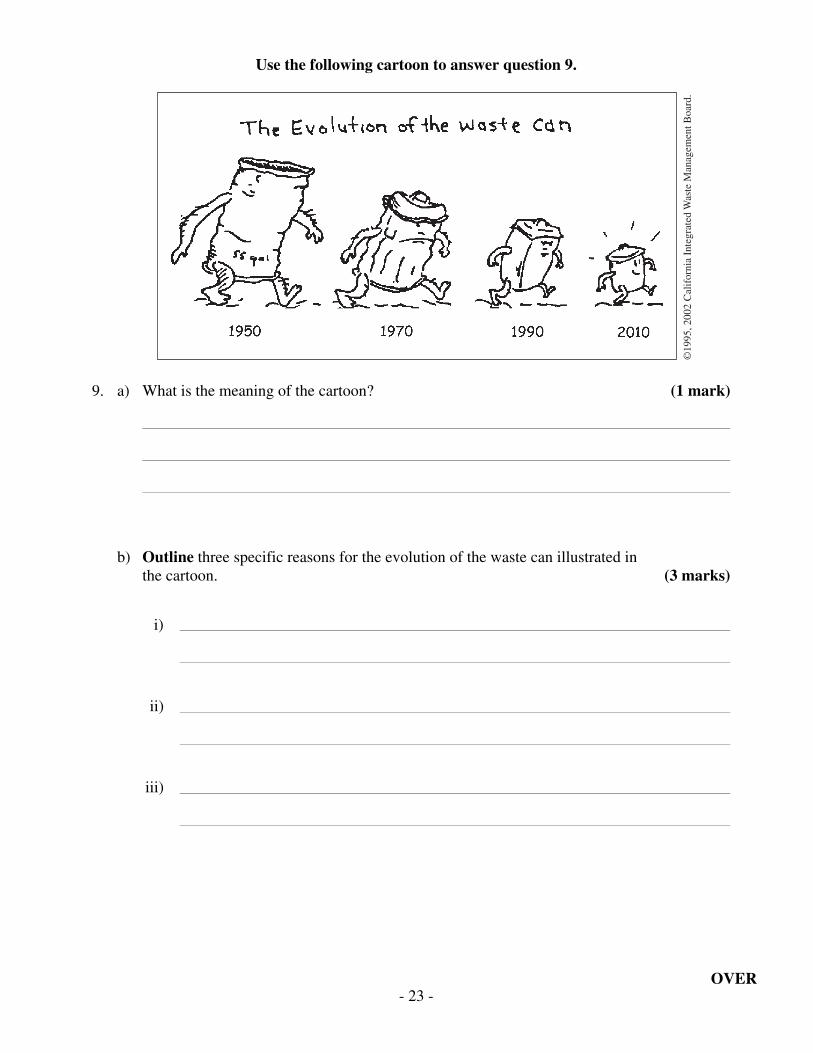
Use the following cartoon to answer question 9.
©19
95, 2
002
Cal
ifor
nia
Inte
grat
ed W
aste
Man
agem
ent B
oard
.
9. a) What is the meaning of the cartoon? (1 mark)
b) Outline three specific reasons for the evolution of the waste can illustrated inthe cartoon. (3 marks)
i)
ii)
iii)

- 24 -
Organization and Planning
OVER- 25 -
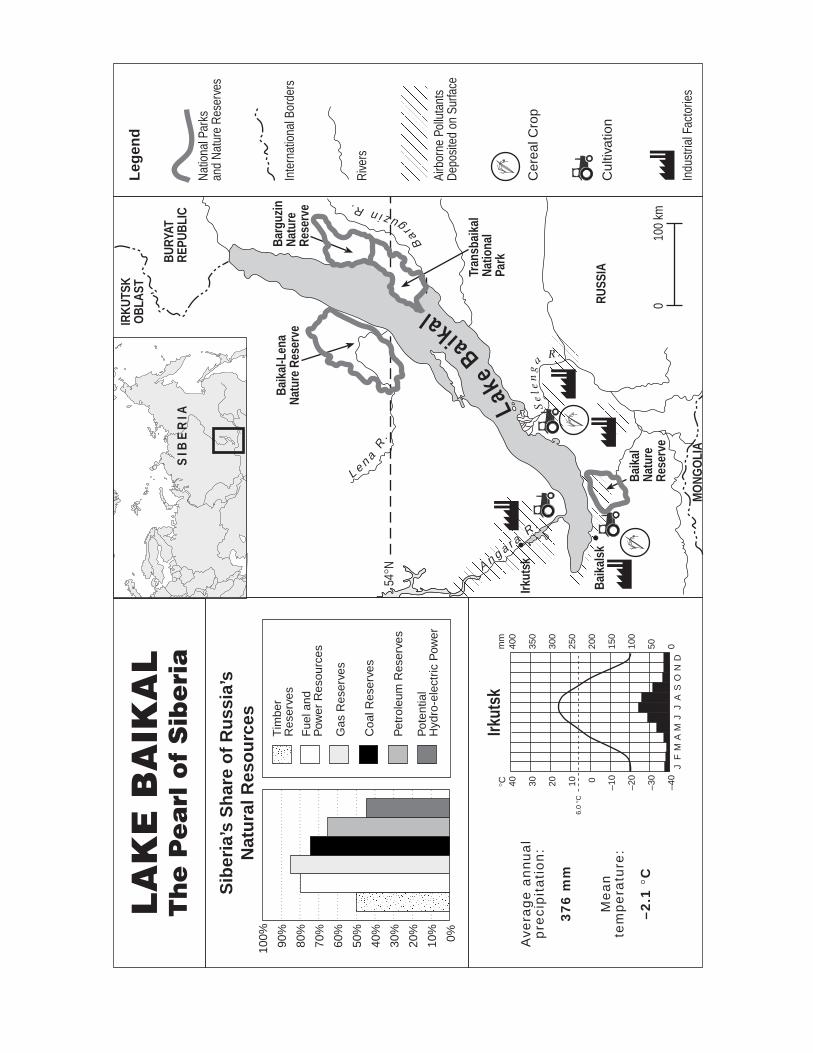
REFER TODATA BOOKLET Use the Case Study of Lake Baikal to answer question 10.
10. Using your understanding of geography and the data provided:
• Describe the physical and natural characteristics of the Lake Baikal region.
• Assess the environmental impacts that would be associated with further resourceexploration and development in this region.
• Propose management strategies that may strike a balance between the use of theBaikal’s resources and the protection of its ecosystem.
Answer in multi-paragraph form. (10 marks)

- 26 -
FINISHED WORK

- 27 -
FINISHED WORK
END OF EXAMINATION

THIS PAGE INTENTIONALLY BLANK

GEOGRAPHY 12
©2004 MINISTRY OF EDUCATION
JANUARY 2004
DATA BOOKLET

6.0 ∞C
Average annual precipitation: 1044 mmMean temperature: 10.1 ∞C
J F M A M J J A S O N D–40
–30
–20
–10
0
10
20
30
40
0
50
100
150
200
250
300
350
400
∞C mm
CLIMATE GRAPHS
W X
Y Z
6.0 ∞C
Average annual precipitation: 370 mmMean temperature: 18.0 ∞C
J F M A M J J A S O N D–40
–30
–20
–10
0
10
20
30
40
0
50
100
150
200
250
300
350
400
∞C mm
6.0 ∞C
Average annual precipitation: 516 mmMean temperature: 2.5 ∞C
J F M A M J J A S O N D–40
–30
–20
–10
0
10
20
30
40
0
50
100
150
200
250
300
350
400
∞C mm
6.0 ∞C
Average annual precipitation: 1128 mmMean temperature: 13.0 ∞C
J F M A M J J A S O N D–40
–30
–20
–10
0
10
20
30
40
0
50
100
150
200
250
300
350
400
∞C mm

WORLD MAP
0∞R
P Q
S
••
•
•
PHOTOGRAPH 1
PHOTOGRAPH 2
Y

Z
PHOTOGRAPH 3

PHOTOGRAPH 4
1 2 3 4 5 6 7 8 9 10 11 12 13 14 15 16 17
A
B
C
D
E
F
G
H
I
J
K
L
M
N
O
P
Q
R
S
T
U
6059
5857
5655
5453
5251
5049
33343536373839 3132
46∞1
5'N
62∞3
0'W
Sou
ris
PRIN
CE
ED
WA
RD
ISL
AN
DS
CA
LE 1
:50,
000
ÉC
HE
LLE
CO
NT
OU
R IN
TE
RV
AL
25 F
EE
TE
leva
tions
in F
eet A
bove
Mea
n S
ea L
evel
Met
res
1000
0M
etre
s10
00
33343536373839 3132
46∞1
5'N
62∞3
0'W
5958
5756
5554
5352
5150
49
33343536373839 3132
46∞1
5'N
62∞3
0'W
Sou
ris
PRIN
CE
ED
WA
RD
ISL
AN
DS
CA
LE 1
:50,
000
ÉC
HE
LLE
CO
NT
OU
R IN
TE
RV
AL
25 F
EE
TE
leva
tions
in F
eet A
bove
Mea
n S
ea L
evel
Met
res
1000
0M
etre
s10
00
33343536373839 32
46∞1
5'N
62∞3
0'W
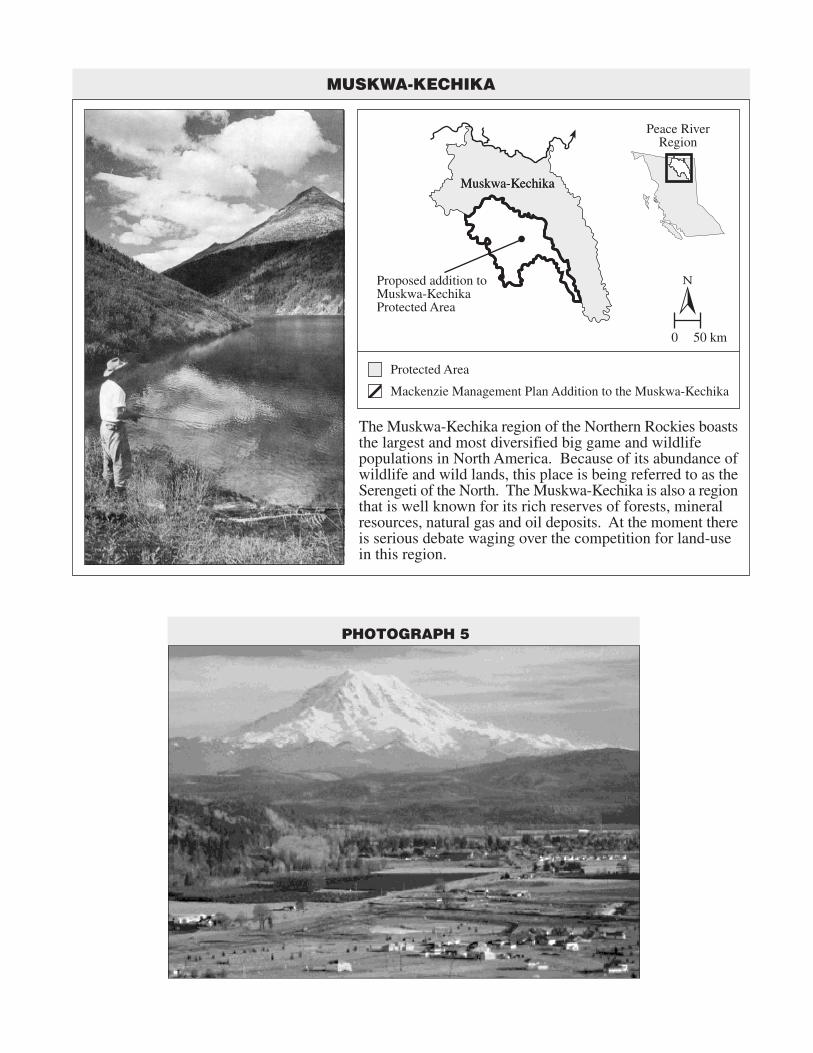
MUSKWA-KECHIKA
Mackenzie Management Plan Addition to the Muskwa-Kechika
Protected Area
The Muskwa-Kechika region of the Northern Rockies boaststhe largest and most diversified big game and wildlifepopulations in North America. Because of its abundance ofwildlife and wild lands, this place is being referred to as theSerengeti of the North. The Muskwa-Kechika is also a regionthat is well known for its rich reserves of forests, mineralresources, natural gas and oil deposits. At the moment thereis serious debate waging over the competition for land-usein this region.
Muskwa-Kechika
Proposed addition toMuskwa-KechikaProtected Area �
0 50 km
Muskwa-Kechika
PHOTOGRAPH 5
Peace RiverRegion
PH
OT
OG
RA
PH
6
�
��
Pot
entia
lH
ydro
-ele
ctric
Pow
er
Pet
role
um R
eser
ves
Coa
l Res
erve
s
Gas
Res
erve
s
Fue
l and
Pow
er R
esou
rces
Tim
ber
Res
erve
s
0%10%
20%
30%
40%
50%
60%
70%
80%
90%
100%
Sib
eria
’s S
har
e o
f R
uss
ia’s
Nat
ura
l Res
ou
rces
�Baik
alsk
•
54∞N
Leg
end
LA
KE
BA
IKA
LT
he
Pe
arl
of
Sib
eri
aN
atio
nal P
arks
and
Nat
ure
Res
erve
s
Airb
orne
Pol
luta
nts
Dep
osite
d on
Sur
face
Rive
rs
Inte
rnat
iona
l Bor
ders
6.0 ∞C
JF
MA
MJ
JA
SO
ND
–40
–30
–20
–10010203040
050100
150
200
250
300
350
400
∞Cm
m
Ave
rag
e a
nn
ua
lp
rec
ipit
ati
on
:
37
6 m
m
Me
an
tem
pe
ratu
re:
–2
.1 ∞
C
Irkut
sk
Irkut
sk•
Se
len
g
aR .
Lake
Baikal
SIB
ER
IA
� Indu
stria
l Fac
torie
s
Cul
tivat
ion
Cer
eal C
rop
Baik
al-L
ena
Natu
re R
eser
veBa
rguz
inNa
ture
Rese
rve
Tran
sbai
kal
Natio
nal
Park
Baik
alNa
ture
Rese
rve
RUSS
IA
MO
NGO
LIA
L e n a
R.
IRKU
TSK
OBL
AST
BURY
ATRE
PUBL
IC
Barg
uzinR.
010
0 km
A n g a r aR .

•T
he d
evel
opm
ent o
f Sib
eria
has
alw
ays
been
ass
ocia
ted
with
exp
loita
tion
of it
s
natu
ral r
esou
rces
: fir
st fi
sh a
nd fu
rs,
then
ric
h ta
iga
fore
st la
nds
and
prec
ious
met
als,
now
mos
tly p
ower
res
ourc
es.
•D
ue to
the
econ
omic
cris
is c
ause
d by
the
colla
pse
of th
e fo
rmer
Sov
iet U
nion
,
the
Lake
Bai
kal r
egio
n is
bei
ng r
apid
ly
expl
oite
d fo
r its
eco
nom
ic p
oten
tial.
•T
here
are
a n
umbe
r of
pro
tect
ed a
reas
in th
e B
aika
l bas
in.
The
Rus
sian
Sta
te
Com
mitt
ee o
f Env
ironm
enta
l Pro
tect
ion
man
ages
man
y of
thes
e ar
eas
as w
ell
as a
dmin
iste
ring
and
coor
dina
ting
the
effo
rts
of th
e fe
dera
l and
reg
iona
l
gove
rnm
ents
.
La
ke
Ba
ika
l F
ac
t F
ile
Lak
e B
aika
l Reg
ion
:
•T
he w
orld
’s o
ldes
t and
larg
est l
ake
with
20%
of t
he w
orld
’sfr
esh
wat
er s
uppl
y (a
ll th
e w
ater
in N
orth
Am
eric
a’s
Gre
atLa
kes
com
bine
d) is
sur
roun
ded
by r
ugge
d m
ount
ains
.
•M
axim
um d
epth
of L
ake
Bai
kal i
s 17
00 m
.
•33
5 riv
ers
feed
into
Lak
e B
aika
l and
one
dra
ins
out o
f it,
the
Ang
ara
Riv
er.
Sp
ecie
s:
•70
% o
f spe
cies
foun
d in
the
regi
on a
re fo
und
now
here
else
in th
e w
orld
. S
ome
of th
ese
spec
ies
incl
ude:
fres
hwat
er s
eal (
nerp
a), f
ish
(om
ul),
cra
yfis
h (e
pish
ura)
.
Bai
kals
k P
ulp
an
d P
aper
Pla
nt
Indu
stria
lizat
ion
brou
ght p
opul
atio
n gr
owth
and
fact
orie
s in
to th
ear
ea, b
ut fo
r m
any
year
s w
ere
neith
er m
onito
red
nor
cont
rolle
d.
ACKNOWLEDGEMENTS
Photograph 4 is based on information taken from the collection of the National Air PhotoLibrary – Photograph A24328-88 (Souris, Prince Edward Island), ©1976 Her Majesty the Queenin Right of Canada, reproduced with permission of Natural Resources Canada.
The topographic map is based on information taken from the National Topographic Systemmap sheet number: 11L/8 Edition 4 (Souris, Prince Edward Island), ©1991 Her Majesty theQueen in Right of Canada, reproduced with permission of Natural Resources Canada.
Muskwa-Kechika is based on information from “Protecting God’s Country,” by Larry Pynn,The Vancouver Sun, Wednesday, November 15, 2000, p. A3. Photographer Wayne Sawchuk/Specialto the Vancouver Sun.
Photograph 5, David Wieprecht (USGS)
Photograph 6, by Bob Herger, Canada’s Rocky Mountains – 2002 Scenic Calendar,High Country Colour.
Case Study Factory Photograph,www.earthisland.org/project/reportPage2.cfm?reportContentID=12&subSiteID=1&pageID=71
Top Related