


Languages
Pages
Legal


Microneedle Array Design Determines the Induction ofProtective Memory CD8+ T Cell Responses Induced by aRecombinant Live Malaria Vaccine in MiceJohn B. Carey1, Frances E. Pearson2, Anto Vrdoljak1, Marie G. McGrath1, Abina M. Crean1, Patrick T.
Walsh3, Timothy Doody1, Conor O’Mahony4, Adrian V. S. Hill2, Anne C. Moore1,5*
1 School of Pharmacy, University College Cork, Cork, Ireland, 2 The Jenner Institute, University of Oxford, Oxford, United Kingdom, 3 National Childrens’ Research Centre,
Our Lady’s Childrens’ Hospital Crumlin, Dublin, Ireland, 4 Tyndall National Institute, Lee Maltings, University College Cork, Cork, Ireland, 5 Department of Pharmacology,
University College Cork, Cork, Ireland
Abstract
Background: Vaccine delivery into the skin has received renewed interest due to ease of access to the immune system andmicrovasculature, however the stratum corneum (SC), must be breached for successful vaccination. This has been achievedby removing the SC by abrasion or scarification or by delivering the vaccine intradermally (ID) with traditional needle-and-syringes or with long microneedle devices. Microneedle patch-based transdermal vaccine studies have predominantlyfocused on antibody induction by inactivated or subunit vaccines. Here, our principal aim is to determine if the design of amicroneedle patch affects the CD8+ T cell responses to a malaria antigen induced by a live vaccine.
Methodology and Findings: Recombinant modified vaccinia virus Ankara (MVA) expressing a malaria antigen waspercutaneously administered to mice using a range of silicon microneedle patches, termed ImmuPatch, that differed inmicroneedle height, density, patch area and total pore volume. We demonstrate that microneedle arrays that have smalltotal pore volumes induce a significantly greater proportion of central memory T cells that vigorously expand to secondaryimmunization. Microneedle-mediated vaccine priming induced significantly greater T cell immunity post-boost andequivalent protection against malaria challenge compared to ID vaccination. Notably, unlike ID administration, ImmuPatch-mediated vaccination did not induce inflammatory responses at the site of immunization or in draining lymph nodes.
Conclusions/Significance: This study demonstrates that the design of microneedle patches significantly influences themagnitude and memory of vaccine-induced CD8+ T cell responses and can be optimised for the induction of desiredimmune responses. Furthermore, ImmuPatch-mediated delivery may be of benefit to reducing unwanted vaccinereactogenicity. In addition to the advantages of low cost and lack of pain, the development of optimised microneedle arraydesigns for the induction of T cell responses by live vaccines aids the development of solutions to current obstacles ofimmunization programmes.
Citation: Carey JB, Pearson FE, Vrdoljak A, McGrath MG, Crean AM, et al. (2011) Microneedle Array Design Determines the Induction of Protective Memory CD8+ TCell Responses Induced by a Recombinant Live Malaria Vaccine in Mice. PLoS ONE 6(7): e22442. doi:10.1371/journal.pone.0022442
Editor: Erika Martins Braga, Universidade Federal de Minas Gerais, Brazil
Received January 24, 2011; Accepted June 27, 2011; Published July 25, 2011
Copyright: � 2011 Carey et al. This is an open-access article distributed under the terms of the Creative Commons Attribution License, which permitsunrestricted use, distribution, and reproduction in any medium, provided the original author and source are credited.
Funding: This study was funded by Enterprise Ireland (CFTD 07/117, http://www.enterprise-ireland.com), Science Foundation Ireland (NAP156, NAP170, www.sfi.ie) and the Medical Research Council, United Kingdom (G0600311, www.mrc.ac.uk). The funders had no role in study design, data collection and analysis, decisionto publish, or preparation of the manuscript.
Competing Interests: The authors have declared that no competing interests exist.
* E-mail: [email protected]
Introduction
Vaccination represents the primary public health measure to
combat infectious diseases. However estimates of the cost of global
immunization programmes to 2015 demonstrate that up to 60% of
the total cost of administering some vaccines will be due to systems
costs, predominantly cold chain, personnel and training [1]. Use of
a simpler vaccine delivery device, which is preferably pain-free,
that eliminated sharps waste and reduces the requirements for
training in immunization technique and logistics should have a
significant positive outcome on the cost and effectiveness of
immunization programmes. The intradermal route has demon-
strated significant advantages with respect to dose-sparing and
immunogenicity in comparison to other routes [2], however ID
immunization with needle–and-syringe is technically challenging
to administer and inaccurate administration can lead to increased
side effects [3,4]. Skin scarification administration of poxviruses is
efficacious, as evidenced by the smallpox eradication campaign
and the recent demonstration in mice that delivery of the poxvirus,
modified vaccinia virus Ankara (MVA), by skin scarification
induced greater protective efficacy against vaccinia virus com-
pared to systemic immunization [5]. However this vaccine delivery
method also requires specialised training and equipment and
cannot be self-administered [5]. Alternative epidermal abrasion
vaccination techniques are being developed, however these can
result in increased adverse events compared to intradermal (ID)
delivery [6]. Microneedles are micron-scale needles that penetrate
the stratum corneum (SC), creating temporary conduits for
PLoS ONE | www.plosone.org 1 July 2011 | Volume 6 | Issue 7 | e22442

percutaneous drug or vaccine administration to desired depths in
the skin or underlying tissue. Due to their micron sized height,
they do not stimulate underlying pain receptors [7]. We developed
a method of manufacturing ‘wet-etch’ solid silicon microneedle
array patches [8] that produces microneedles with an outer
pyramidal profile (Fig. 1), termed ImmuPatch. By virtue of their
smooth surface and ultrasharp tips, these ImmuPatch devices go
cleanly in and out of tissue at very low insertion forces. Thus,
ImmuPatch arrays do not abrade the skin, instead they create
temporary pores through the stratum corneum (SC) through
which vaccine enters the skin.
The microneedle vaccine delivery field has predominantly
focussed on antibody induction by subunit vaccines [9]. It was
previously concluded, using a subunit vaccine that induction of
serum antibody responses was independent of depth of delivery,
density of microneedles or area of application [10], thus proposing
that the design of the microneedle array has little impact on the
induction of immunity. Furthermore, efficacy studies of micro-
needle-delivered vaccines have centred on mucosal protection,
generally of influenza virus respiratory challenge.
Live recombinant viral vectors that induce T cell responses are
demonstrating potential as vaccine platforms against diseases such
as malaria, tuberculosis HIV and cancer [11]. The investigation of
microneedle-delivery of live vaccines has to date been limited to
antibody induction by a Japanese Encephalitis virus vaccine and
guinea pig CD4+ T cell responses to BCG vaccination [12,13].
Induction of protective, systemic, anti-malarial cellular immunity,
particularly mediated by CD8+ T cells, has not been investigated
in any microneedle live vaccine delivery study, to our knowledge.
In this study we examined the use of microneedle arrays to
administer recombinant MVA to induce this CD8+ T cell re-
sponse. This replication incompetent poxvirus is demonstrating
strong clinical potential in malaria and TB immunization regimes
where the intradermal route has been a traditional route of choice
[11]. The present study was designed with two main objectives.
Firstly, we aimed to determine if microneedle array design
impacted on the induction of primary and secondary T cell
responses by a live vaccine. The second objective was to determine
if microneedle-mediated immunization could increase the immu-
nogenicity and efficacy of homologous, repeated immunization
with the same virus vector. Here, we demonstrate that micro-
needle percutaneous immunization induces increased post-boost
CD8+ T cell response, compared to intradermal immunization,
using a live recombinant vaccine. Secondly, unlike previous studies
examining antibody induction, the design of the microneedle array
has a significant impact on the magnitude and the memory phe-
notype of the vaccine-induced CD8+ T cell response. Finally, we
demonstrate that ImmuPatch delivery of a live vaccine does not
induce a pro-inflammatory response, in contrast to ID immuni-
zation and therefore may be of particular benefit to reducing
vaccine reactogenicity.
Results
Microneedle array design influences the magnitude andphenotype of vaccine-induced CD8+ T cell response
Using a mouse malaria model of recombinant MVA-PbCSP-
induced immunity and protection [14], we determined if the
dimensions of microneedle arrays affects the phenotype and mag-
nitude of the vaccine-induced immunity. A range of ImmuPatch
microneedle arrays were fabricated that differed in the area of the
patch, the density of the microneedles, the height of each micro-
needle and the total pore volume of each patch. The total pore
volume of the microneedle array refers to the maximum volume of
the conduits that can be created in the skin after application of a
microneedle array and has been arbitrarily defined as small,
intermediate or large. Nine array types with increasing total pore
volume that differ in microneedle density or height were fabricated
(Table 1).
Female BALB/c mice were immunized with MVA-PbCSP by
the intradermal (ID) route or by ImmuPatch-based immunization.
The ID route was chosen as it has been repeatedly used in clinical
studies and, similar to microneedles, the vaccine is delivered to
skin. Two weeks after priming, the frequency, multi-functional
quality [15] and memory phenotype [16,17] of CD8+ T cells in the
spleen that recognised the dominant, nine-mer, MHC class I
epitope in PbCSP, termed Pb9, was determined. Flow cytometry
combined with Boolean analysis revealed that two populations of
polyfunctional antigen-specific CD8+ T-cell responses were
primed by MVA-PbCSP immunization, namely CD8+IFN-c+,
single cytokine-secreting cells and CD8+IFN-c+TNF-a+, dual
cytokine producing T cells. These populations were approximately
equivalent in frequency in each group (Fig. 2A, compare
IFN+TNF+ with TNF+, Figure S1). No other multi-functional
phenotype was observed. Of interest, immunization using arrays A
and F, that possess the smallest total pore volume, induced
Figure 1. ImmuPatch microneedle arrays. Left: Scanning electron micrograph (SEM) that compares the bevel of a 26G needle to microneedleson an ImmuPatch device. Right: SEM image of individual microneedle.doi:10.1371/journal.pone.0022442.g001
ImmuPatch Mediated MVA Vaccination
PLoS ONE | www.plosone.org 2 July 2011 | Volume 6 | Issue 7 | e22442

significantly decreased frequencies of antigen-specific single and
dual cytokine-secreting CD8+ T cells, compared to intradermal
needle-and-syringe vaccination (ID) (Fig. 2A). In contrast,
immunization with larger pore volume microneedle arrays in-
duced a T cell response that was equivalent in magnitude and
multi-functionality to ID. Vaccination using a flat silicon patch,
with no microneedles, resulted in a background T cell response
(data not shown), demonstrating that breaching the SC is required
to induce immunity.
We used a conventional gating strategy to determine the
memory phenotype of antigen-specific CD8+ T cells, using the
expression of CD62L and CD127 on TAPI-2 treated cells to
identify central memory T cells (TCM: CD62L+ CD127+), effector
memory T cells (TEM: CD62L2 CD127+), effector T cells (TE:
CD62L2 CD1272) and intermediate phenotype T cells (Tint,
CD62L+ CD1272 ) [16,17]. Subsequent to a 6 hour stimulation
with the Pb9 epitope, examination of the memory phenotype of all
antigen-specific, cytokine-secreting T cells demonstrated that, in
contrast to ID immunization, the use of a small volume micro-
needle array induced a significantly higher proportion of central
memory (TCM) CD8+ T cells and significantly reduced effector
memory (TEM) response (Fig. 2B, Figure S1). Therefore,
Table 1. Microneedle Array Designs.
Microneedle Array Microneedle height Number of Microneedles per Array Array Area (mm2) Total volume mm3 Pore volume range
A 100 mm 16 29.16 0.0018 Small
F 100 mm 100 29.16 0.0113 Small
B 200 mm 16 29.16 0.0145 Intermediate
D 200 mm 25 29.16 0.0227 Intermediate
E 200 mm 36 29.16 0.0326 Intermediate
C 300 mm 16 29.16 0.0499 Intermediate
G 200 mm 81 54.76 0.0734 Large
T125 125 mm 400 100 0.0902 Large
H 300 mm 36 54.76 0.1123 Large
doi:10.1371/journal.pone.0022442.t001
Figure 2. Magnitude and phenotype of the antigen-specific CD8+ T cell response after a single immunization. Groups of 5 BALB/c micewere immunized with MVA-PbCSP by the intradermal (id) route or using an ImmuPatch device of increasing pore volume as outlined in Table 1. (A)Antigen-specific polyfunctional CD8+ T cell responses in spleen cells were quantified after intracellular cytokine staining (ICS) of IFN-c, TNF-a, and IL-2subsequent to stimulation with the immunodominant Pb9 peptide. Data are expressed as the frequencies of single cytokine secreting IFN-c+ anddual-secreting IFN-c+TNF-a+ CD8+ T cells, +/2 standard error of the mean (+/2SEM), 2 weeks after immunization. No IL-2 production was observed.(B) Memory phenotype of the antigen-specific response. Splenocytes were also stained for CD62L and CD127 in addition to CD8 and ICS of cytokines.The percentage of cytokine-producing CD8+ T cells that were central memory TCM (blue pie section), effector T cells, TE (red pie section), effectormemory T cells, TEM,: (green pie section) and intermediate phenotype, Tint, (orange pie sections) were determined. Each dot represents one mouse.Graphs were generated after performing a Boolean analysis in FlowJo and data analysis in SPICE software. Pie charts display relative percentages ofCD8+ T cells that are TCM, TEM and TE. * p,0.05, ** p,0.01, ***p,0.001 compared with ID vaccinated mice in (A) by one way ANOVA and in (B) byunpaired student t test. Similar results were obtained in four independent experiments.doi:10.1371/journal.pone.0022442.g002
ImmuPatch Mediated MVA Vaccination
PLoS ONE | www.plosone.org 3 July 2011 | Volume 6 | Issue 7 | e22442

immunization with ImmuPatch arrays with small volumes induces
an immune response that has a lower frequency of cytokine-
producing T cells, which have differentiated to a TCM memory
phenotype.
We demonstrate that microneedle height is not the predominant
factor responsible for T cell response. Vaccine delivery using T125
arrays, which have microneedles of height 125 mm, similar to
patches A and F, but with a pore volume similar to patches G and
H, induced a response that was significantly different to A and F
but equivalent to patches G and H (Fig. 2). This demonstrates
that, compared to administration depth, the total volume of a
microneedle array is a dominant feature that influences the
magnitude and phenotype of the vaccine-induced T cell response.
The most significant and strongest positive correlation (Spear-
man’s rho = 0.6859 p,0.0001) was observed between total volume
and cytokine producing CD8+ T cell responses post-prime. In
contrast, other design parameters, such as microneedle height
were either not as strongly correlated (Spearman’s rho = 0.516,
p,0.001) or, in the case of the number of microneedles per array,
did not correlate (Spearman’s rho = 0.289, not significant) with
antigen-specific CD8+ T cell responses. Therefore, we demon-
strate that total volume of the microneedle array and not
microneedle length is a dominant design feature that impacts the
type and magnitude of a CD8+ T cell response that is induced by a
live vaccine.
Post-boost CD8+ T cell responsesThe ability of T cells induced by ID or ImmuPatch
immunization to re-expand to a secondary homologous immuni-
zation with MVA-PbCSP was examined two weeks after an ID
boosting immunization. All groups were boosted in the same
manner so that post-boost immunity reflected differences in the
existing primary response. Priming using small pore volume
microneedle arrays (arrays A and F) resulted in significantly
increased post-boost T cell response compared to ID immuniza-
tion (Fig. 3A, Figure S2). No significant increase in the
magnitude of the T cell response was observed in any other
group compared to priming with a flat microneedle patch. The
post-boost response was dominated by IFN-c+ CD8+ T cells,
compared to an equivalent frequency of both cytokine-secreting
populations post-prime. A significant negative correlation between
pore volume and antigen-specific T cell responses was observed for
post-boost total CD8+ T cell responses (p,0.0001 r = 20.4786).
Thus delivering a vaccine with a small volume microneedle array
induces a primary T cell response, with a higher proportion of
antigen-specific T cells that are of a TCM memory phenotype that
responds vigorously to secondary immunization. Analysis of the
total number of antigen-specific CD8+ T cells post-prime and post-
boost demonstrated a similar pattern as that observed for the
percentage of antigen-specific CD8+ T cells, for example, priming
with the smallest pore volume microneedle arrays induced a
significantly decreased number of antigen-specific CD8+ T cells
post-prime and a significantly increased number of antigen-specific
CD8+ T cells subsequent to ID boosting (Figure S3).
The memory phenotype in all groups subsequent to an ID boost
was predominantly TEM (Fig. 3B, Figure S2). Priming with
ImmuPatch array F, but not other small volume arrays, induced
a significantly increased proportion of TEM and significantly
decreased TCM CD8+ T cell phenotype compared to ID immu-
nization post-boost.
Figure 3. Magnitude and phenotype of the antigen-specific CD8+ T cell response after an ID boosting immunization. Groups of 5BALB/c mice were immunized with MVA-PbCSP by the ID route or using an ImmuPatch device of increasing pore volume as outlined in Table 1.Alternatively vaccine was administered to mice with a silicon patch that was not etched with microneedles, termed ‘Flat’. Two weeks after priming, allmice were immunized with MVA-PbCSP by the intradermal (id) route. (A) Antigen-specific polyfunctional CD8+ T cell responses in spleen cells werequantified as described in Figure 2, two weeks after the boosting immunization. Data are expressed as the frequencies of single cytokine secretingIFN-c+ and dual-secreting IFN-c+TNF-a+ CD8+ T cells, +/2 standard error of the mean (+/2SEM), 2 weeks after immunization. (B) Memory phenotypeof the antigen-specific response was determined as described in Fig. 2B. Pie charts display relative percentages of CD8+ T cells that are TCM, TEM andTE. * p,0.05, ** p,0.01, ***p,0.001 compared with ID vaccinated mice in (A) by one way ANOVA and in (B) by unpaired student t test. Data is pooledfrom four independent experiments (n = 5 mice/group per experiment).doi:10.1371/journal.pone.0022442.g003
ImmuPatch Mediated MVA Vaccination
PLoS ONE | www.plosone.org 4 July 2011 | Volume 6 | Issue 7 | e22442
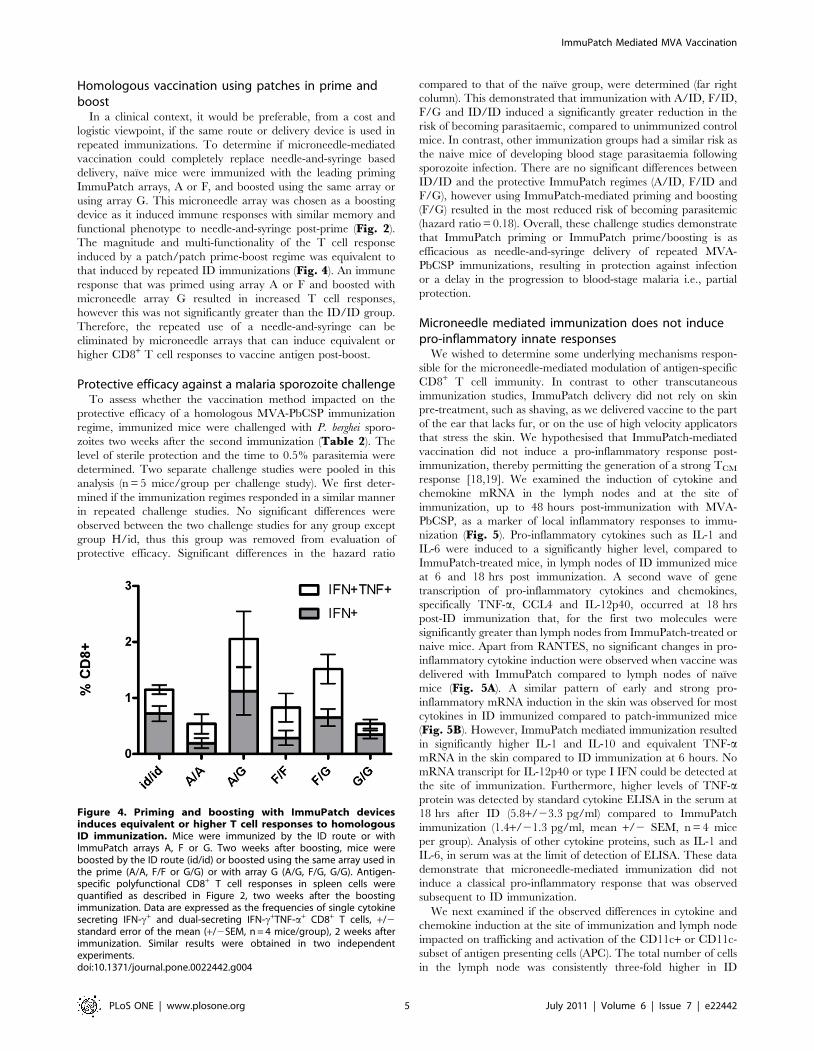
Homologous vaccination using patches in prime andboost
In a clinical context, it would be preferable, from a cost and
logistic viewpoint, if the same route or delivery device is used in
repeated immunizations. To determine if microneedle-mediated
vaccination could completely replace needle-and-syringe based
delivery, naı̈ve mice were immunized with the leading priming
ImmuPatch arrays, A or F, and boosted using the same array or
using array G. This microneedle array was chosen as a boosting
device as it induced immune responses with similar memory and
functional phenotype to needle-and-syringe post-prime (Fig. 2).
The magnitude and multi-functionality of the T cell response
induced by a patch/patch prime-boost regime was equivalent to
that induced by repeated ID immunizations (Fig. 4). An immune
response that was primed using array A or F and boosted with
microneedle array G resulted in increased T cell responses,
however this was not significantly greater than the ID/ID group.
Therefore, the repeated use of a needle-and-syringe can be
eliminated by microneedle arrays that can induce equivalent or
higher CD8+ T cell responses to vaccine antigen post-boost.
Protective efficacy against a malaria sporozoite challengeTo assess whether the vaccination method impacted on the
protective efficacy of a homologous MVA-PbCSP immunization
regime, immunized mice were challenged with P. berghei sporo-
zoites two weeks after the second immunization (Table 2). The
level of sterile protection and the time to 0.5% parasitemia were
determined. Two separate challenge studies were pooled in this
analysis (n = 5 mice/group per challenge study). We first deter-
mined if the immunization regimes responded in a similar manner
in repeated challenge studies. No significant differences were
observed between the two challenge studies for any group except
group H/id, thus this group was removed from evaluation of
protective efficacy. Significant differences in the hazard ratio
compared to that of the naı̈ve group, were determined (far right
column). This demonstrated that immunization with A/ID, F/ID,
F/G and ID/ID induced a significantly greater reduction in the
risk of becoming parasitaemic, compared to unimmunized control
mice. In contrast, other immunization groups had a similar risk as
the naive mice of developing blood stage parasitaemia following
sporozoite infection. There are no significant differences between
ID/ID and the protective ImmuPatch regimes (A/ID, F/ID and
F/G), however using ImmuPatch-mediated priming and boosting
(F/G) resulted in the most reduced risk of becoming parasitemic
(hazard ratio = 0.18). Overall, these challenge studies demonstrate
that ImmuPatch priming or ImmuPatch prime/boosting is as
efficacious as needle-and-syringe delivery of repeated MVA-
PbCSP immunizations, resulting in protection against infection
or a delay in the progression to blood-stage malaria i.e., partial
protection.
Microneedle mediated immunization does not inducepro-inflammatory innate responses
We wished to determine some underlying mechanisms respon-
sible for the microneedle-mediated modulation of antigen-specific
CD8+ T cell immunity. In contrast to other transcutaneous
immunization studies, ImmuPatch delivery did not rely on skin
pre-treatment, such as shaving, as we delivered vaccine to the part
of the ear that lacks fur, or on the use of high velocity applicators
that stress the skin. We hypothesised that ImmuPatch-mediated
vaccination did not induce a pro-inflammatory response post-
immunization, thereby permitting the generation of a strong TCM
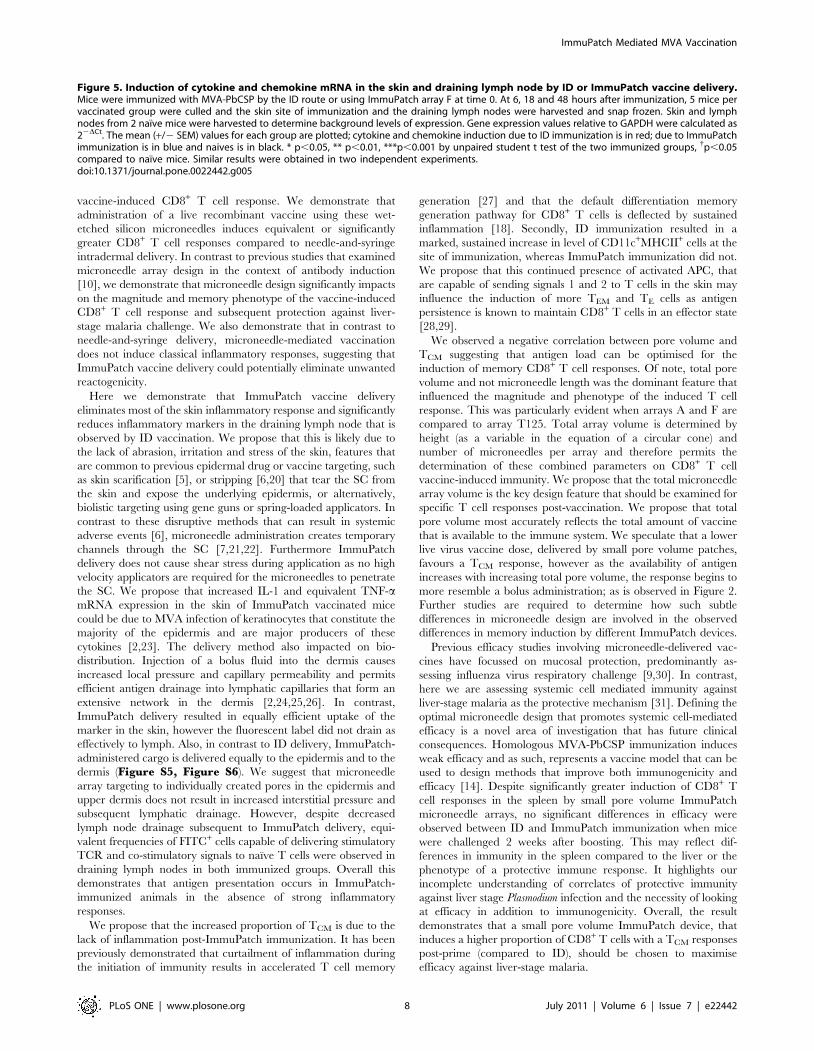
response [18,19]. We examined the induction of cytokine and
chemokine mRNA in the lymph nodes and at the site of
immunization, up to 48 hours post-immunization with MVA-
PbCSP, as a marker of local inflammatory responses to immu-
nization (Fig. 5). Pro-inflammatory cytokines such as IL-1 and
IL-6 were induced to a significantly higher level, compared to
ImmuPatch-treated mice, in lymph nodes of ID immunized mice
at 6 and 18 hrs post immunization. A second wave of gene
transcription of pro-inflammatory cytokines and chemokines,
specifically TNF-a, CCL4 and IL-12p40, occurred at 18 hrs
post-ID immunization that, for the first two molecules were
significantly greater than lymph nodes from ImmuPatch-treated or
naive mice. Apart from RANTES, no significant changes in pro-
inflammatory cytokine induction were observed when vaccine was
delivered with ImmuPatch compared to lymph nodes of naı̈ve
mice (Fig. 5A). A similar pattern of early and strong pro-
inflammatory mRNA induction in the skin was observed for most
cytokines in ID immunized compared to patch-immunized mice
(Fig. 5B). However, ImmuPatch mediated immunization resulted
in significantly higher IL-1 and IL-10 and equivalent TNF-amRNA in the skin compared to ID immunization at 6 hours. No
mRNA transcript for IL-12p40 or type I IFN could be detected at
the site of immunization. Furthermore, higher levels of TNF-aprotein was detected by standard cytokine ELISA in the serum at
18 hrs after ID (5.8+/23.3 pg/ml) compared to ImmuPatch
immunization (1.4+/21.3 pg/ml, mean +/2 SEM, n = 4 mice
per group). Analysis of other cytokine proteins, such as IL-1 and
IL-6, in serum was at the limit of detection of ELISA. These data
demonstrate that microneedle-mediated immunization did not
induce a classical pro-inflammatory response that was observed
subsequent to ID immunization.
We next examined if the observed differences in cytokine and
chemokine induction at the site of immunization and lymph node
impacted on trafficking and activation of the CD11c+ or CD11c-
subset of antigen presenting cells (APC). The total number of cells
in the lymph node was consistently three-fold higher in ID
Figure 4. Priming and boosting with ImmuPatch devicesinduces equivalent or higher T cell responses to homologousID immunization. Mice were immunized by the ID route or withImmuPatch arrays A, F or G. Two weeks after boosting, mice wereboosted by the ID route (id/id) or boosted using the same array used inthe prime (A/A, F/F or G/G) or with array G (A/G, F/G, G/G). Antigen-specific polyfunctional CD8+ T cell responses in spleen cells werequantified as described in Figure 2, two weeks after the boostingimmunization. Data are expressed as the frequencies of single cytokinesecreting IFN-c+ and dual-secreting IFN-c+TNF-a+ CD8+ T cells, +/2standard error of the mean (+/2SEM, n = 4 mice/group), 2 weeks afterimmunization. Similar results were obtained in two independentexperiments.doi:10.1371/journal.pone.0022442.g004
ImmuPatch Mediated MVA Vaccination
PLoS ONE | www.plosone.org 5 July 2011 | Volume 6 | Issue 7 | e22442

compared to ImmuPatch treated and naı̈ve mice (Figure S4).
Modest increases were observed in the numbers of CD11c+ cells
and MHC class II expression in the lymph node after ImmuPatch
immunization compared to naı̈ve mice at 24 hours (Fig. 6). In
contrast, ID administration of MVA caused a more substantial
increase in CD11c+MHCII+ and CD11c+MHCII- cells in the
lymph node at both 24 and 96 hours post-immunization. A similar
effect was noted at the site of immunization; ImmuPatch delivery
of MVA resulted in a transient increase in CD11c+MHCII- cells
at 24 hrs and CD11c-MHCII+ cells at 24 and 96 hrs, while the
proportion of CD11c+MHCII+ cells was similar to naı̈ve at both
times. In contrast, ID delivery induced a substantial increase in
CD11c+MHCII+ cells that were maintained in the ear up to
96 hrs post-vaccination. These changes in APC numbers and
MHCII expression are consistent with increased inflammatory
chemokine and cytokine expression (Fig. 5).
Biodistribution due to ID or ImmuPatch deliveryNext we wished to determine if the administration route
impacted on the biodistribution of the delivered material. Firstly,
we histologically determined that microneedle-delivered material
is distributed mainly in the epidermis, with some delivery to the
dermis, 30 minutes after administration of red fluorescent beads
(100nm diameter) to mice ears using Array F (Figure S5). A
similar distribution was observed when MVA expressing red
fluorescent protein (MVA-RFP) was administered to ex vivo
porcine skin. In comparison to ID injection of MVA-RFP, where
transfected cells were observed in a dermal bolus, a tract of mostly
epidermal infected cells was observed subsequent to ImmuPatch
Array G administration (Figure S6).
Secondly, we determined the amount of red fluorescent beads
that can be recovered from inside the skin of mouse ears
subsequent to ImmuPatch administration. To lessen the effects
of biodistribution, we harvested ears 30 minutes after treatment.
Approximately 3% of the original material was delivered into the
ear (Figure S7). No significant difference in the percentage
recovered was observed between microneedle designs in this study,
at this early timepoint.
Finally, in the absence of having an MVA that highly expressed
a fluorescent marker that could be easily detected by flow
cytometry, we administered FITC mixed with the vaccine. A
similar frequency of live cells in the ear contained FITC at 24 and
96 hours in both groups (Fig. 7). However, ID delivery resulted in
higher levels of FITC in the lymph node compared to ImmuPatch.
Therefore, both ID and ImmuPatch administration result in
sustained presence of the delivered cargo up to 96 hrs in cells at
the site of administration, however ID delivery resulted in greater
transport to the lymph node.
We next examined the frequency of cells that had taken up
FITC that were capable of delivering signal 1 (MHC class II) and
signal 2 (CD80) to T cells in the lymph node (Fig. 8). We gated
out CD3+ T cells and CD19+ B cell and focused on live FITC+cells that were MHCII+ and/or CD80+ that can be viewed as
capable of antigen presentation and co-stimulation. Similar
frequencies of FITC+MHCIIhiCD80hi cells were detected in both
groups at both times. ImmuPatch treated mice had twice the
frequency of MHCII+CD80+ cells compared to ID at 24 hours
(35% compared to 16.8%). A higher proportion of FITC+ cells
that were negative for both CD80 and MHC class II were detected
in ID treated compared to ImmuPatch treated animals (24%
compared to 6% at 24 hours).
Therefore, although the proportion of cells that are FITC+ in
the lymph node is lower in ImmuPatch versus ID-treated mice, the
frequency of FITC+ cells capable of delivering signal 1 and 2 from
the same cell is equivalent in both groups and ImmuPatch treated
mice have fewer cells incapable of delivering either signal 1 or 2 to
T cells.
Discussion
Development of low cost, needle-free, painless, safe, efficacious
immunization strategies is an important goal in global health care.
ImmuPatch is a microneedle-based technology that is being
developed as an easy-to-use, pain-free, patch that, by creating
temporary channels through the impermeable stratum corneum,
delivers vaccine through the skin. Here we aimed to determine if
the patch design impacted on the magnitude and phenotype of the
Table 2. Microneedle-mediated immunization induces efficacy against P. berghei sporozoite infection.
Immunization Regime(Prime/Boost) No. protected/total Protection (%)
Median time to 0.5%parasiteamia in days Hazard Ratio (95% CI)a p-valueb
Naı̈ve 0/10 0 6.52 - -
ID/ID 4/10 40 6.91 0.25 (0.08–0.81) 0.020*
A/ID 3/10 30 6.76 0.33 (0.11–1.00) 0.050*
F/ID 5/10 50 7.46 0.25 (0.08–0.80) 0.020*
F/G 5/10 50 6.88 0.18 (0.05–0.68) 0.011*
B/ID 4/10 40 6.49 0.39 (0.13–1.16) 0.090
D/ID 2/10 20 6.61 0.44 (0.16–1.22) 0.120
E/ID 3/10 30 6.38 0.59 (0.22–1.59) 0.300
C/ID 4/10 40 6.55 0.61 (0.22–1.74) 0.360
G/ID 4/10 40 6.47 0.39 (0.13–1.17) 0.090
H/ID 6/10 60 ndc 0.04 (0.005–0.32)c 0.002c
Mice were immunized and challenged and protection results analysed as described in Methods.aCompared to Naı̈ve, unimmunized mice (95% confidence interval);bcompared to Naı̈ve,*p#0.05.cNot determined or unable to determine significance compared to naive group as repeated challenge studies were significantly different.doi:10.1371/journal.pone.0022442.t002
ImmuPatch Mediated MVA Vaccination
PLoS ONE | www.plosone.org 6 July 2011 | Volume 6 | Issue 7 | e22442

ImmuPatch Mediated MVA Vaccination
PLoS ONE | www.plosone.org 7 July 2011 | Volume 6 | Issue 7 | e22442
vaccine-induced CD8+ T cell response. We demonstrate that
administration of a live recombinant vaccine using these wet-
etched silicon microneedles induces equivalent or significantly
greater CD8+ T cell responses compared to needle-and-syringe
intradermal delivery. In contrast to previous studies that examined
microneedle array design in the context of antibody induction
[10], we demonstrate that microneedle design significantly impacts
on the magnitude and memory phenotype of the vaccine-induced
CD8+ T cell response and subsequent protection against liver-
stage malaria challenge. We also demonstrate that in contrast to
needle-and-syringe delivery, microneedle-mediated vaccination
does not induce classical inflammatory responses, suggesting that
ImmuPatch vaccine delivery could potentially eliminate unwanted
reactogenicity.
Here we demonstrate that ImmuPatch vaccine delivery
eliminates most of the skin inflammatory response and significantly
reduces inflammatory markers in the draining lymph node that is
observed by ID vaccination. We propose that this is likely due to
the lack of abrasion, irritation and stress of the skin, features that
are common to previous epidermal drug or vaccine targeting, such
as skin scarification [5], or stripping [6,20] that tear the SC from
the skin and expose the underlying epidermis, or alternatively,
biolistic targeting using gene guns or spring-loaded applicators. In
contrast to these disruptive methods that can result in systemic
adverse events [6], microneedle administration creates temporary
channels through the SC [7,21,22]. Furthermore ImmuPatch
delivery does not cause shear stress during application as no high
velocity applicators are required for the microneedles to penetrate
the SC. We propose that increased IL-1 and equivalent TNF-amRNA expression in the skin of ImmuPatch vaccinated mice
could be due to MVA infection of keratinocytes that constitute the
majority of the epidermis and are major producers of these
cytokines [2,23]. The delivery method also impacted on bio-
distribution. Injection of a bolus fluid into the dermis causes
increased local pressure and capillary permeability and permits
efficient antigen drainage into lymphatic capillaries that form an
extensive network in the dermis [2,24,25,26]. In contrast,
ImmuPatch delivery resulted in equally efficient uptake of the
marker in the skin, however the fluorescent label did not drain as
effectively to lymph. Also, in contrast to ID delivery, ImmuPatch-
administered cargo is delivered equally to the epidermis and to the
dermis (Figure S5, Figure S6). We suggest that microneedle
array targeting to individually created pores in the epidermis and
upper dermis does not result in increased interstitial pressure and
subsequent lymphatic drainage. However, despite decreased
lymph node drainage subsequent to ImmuPatch delivery, equi-
valent frequencies of FITC+ cells capable of delivering stimulatory
TCR and co-stimulatory signals to naı̈ve T cells were observed in
draining lymph nodes in both immunized groups. Overall this
demonstrates that antigen presentation occurs in ImmuPatch-
immunized animals in the absence of strong inflammatory
responses.
We propose that the increased proportion of TCM is due to the
lack of inflammation post-ImmuPatch immunization. It has been
previously demonstrated that curtailment of inflammation during
the initiation of immunity results in accelerated T cell memory
generation [27] and that the default differentiation memory
generation pathway for CD8+ T cells is deflected by sustained
inflammation [18]. Secondly, ID immunization resulted in a
marked, sustained increase in level of CD11c+MHCII+ cells at the
site of immunization, whereas ImmuPatch immunization did not.
We propose that this continued presence of activated APC, that
are capable of sending signals 1 and 2 to T cells in the skin may
influence the induction of more TEM and TE cells as antigen
persistence is known to maintain CD8+ T cells in an effector state
[28,29].
We observed a negative correlation between pore volume and
TCM suggesting that antigen load can be optimised for the
induction of memory CD8+ T cell responses. Of note, total pore
volume and not microneedle length was the dominant feature that
influenced the magnitude and phenotype of the induced T cell
response. This was particularly evident when arrays A and F are
compared to array T125. Total array volume is determined by
height (as a variable in the equation of a circular cone) and
number of microneedles per array and therefore permits the
determination of these combined parameters on CD8+ T cell
vaccine-induced immunity. We propose that the total microneedle
array volume is the key design feature that should be examined for
specific T cell responses post-vaccination. We propose that total
pore volume most accurately reflects the total amount of vaccine
that is available to the immune system. We speculate that a lower
live virus vaccine dose, delivered by small pore volume patches,
favours a TCM response, however as the availability of antigen
increases with increasing total pore volume, the response begins to
more resemble a bolus administration; as is observed in Figure 2.
Further studies are required to determine how such subtle
differences in microneedle design are involved in the observed
differences in memory induction by different ImmuPatch devices.
Previous efficacy studies involving microneedle-delivered vac-
cines have focussed on mucosal protection, predominantly as-
sessing influenza virus respiratory challenge [9,30]. In contrast,
here we are assessing systemic cell mediated immunity against
liver-stage malaria as the protective mechanism [31]. Defining the
optimal microneedle design that promotes systemic cell-mediated
efficacy is a novel area of investigation that has future clinical
consequences. Homologous MVA-PbCSP immunization induces
weak efficacy and as such, represents a vaccine model that can be
used to design methods that improve both immunogenicity and
efficacy [14]. Despite significantly greater induction of CD8+ T
cell responses in the spleen by small pore volume ImmuPatch
microneedle arrays, no significant differences in efficacy were
observed between ID and ImmuPatch immunization when mice
were challenged 2 weeks after boosting. This may reflect dif-
ferences in immunity in the spleen compared to the liver or the
phenotype of a protective immune response. It highlights our
incomplete understanding of correlates of protective immunity
against liver stage Plasmodium infection and the necessity of looking
at efficacy in addition to immunogenicity. Overall, the result
demonstrates that a small pore volume ImmuPatch device, that
induces a higher proportion of CD8+ T cells with a TCM responses
post-prime (compared to ID), should be chosen to maximise
efficacy against liver-stage malaria.
Figure 5. Induction of cytokine and chemokine mRNA in the skin and draining lymph node by ID or ImmuPatch vaccine delivery.Mice were immunized with MVA-PbCSP by the ID route or using ImmuPatch array F at time 0. At 6, 18 and 48 hours after immunization, 5 mice pervaccinated group were culled and the skin site of immunization and the draining lymph nodes were harvested and snap frozen. Skin and lymphnodes from 2 naı̈ve mice were harvested to determine background levels of expression. Gene expression values relative to GAPDH were calculated as22DCt. The mean (+/2 SEM) values for each group are plotted; cytokine and chemokine induction due to ID immunization is in red; due to ImmuPatchimmunization is in blue and naives is in black. * p,0.05, ** p,0.01, ***p,0.001 by unpaired student t test of the two immunized groups, {p,0.05compared to naı̈ve mice. Similar results were obtained in two independent experiments.doi:10.1371/journal.pone.0022442.g005
ImmuPatch Mediated MVA Vaccination
PLoS ONE | www.plosone.org 8 July 2011 | Volume 6 | Issue 7 | e22442

Figure 6. Cell trafficking at the site of immunization and lymph node subsequent to ImmuPatch or ID vaccination. Cells were isolatedfrom the site of immunization (A), or lymph node (B), from naı̈ve mice (upper left panel) or mice immunized with MVA-PbCSP using ImmuPatch arrayF (upper middle and upper right panels) or ID (lower middle and lower right panels) at 24 (middle panels) or 96 hours (right panels) post-administration. The expression of CD11c and MHC class II was assessed on live CD3- and CD19- cells. Each plot is representative of 3 samples pergroup. Similar results were obtained in two independent experiments.doi:10.1371/journal.pone.0022442.g006
ImmuPatch Mediated MVA Vaccination
PLoS ONE | www.plosone.org 9 July 2011 | Volume 6 | Issue 7 | e22442

Figure 7. Biodistribution and clearance subsequent to ID or ImmuPatch delivery. FITC (1mg/ml) was added to MVA-PbCSP andadministered to mice by the ID route or using ImmuPatch array F. At 24 and 96 hours ears and lymph nodes were harvested from 3 mice per group.The level of FITC detected in live cells from the skin and lymph nodes of ImmuPatch (top panels) or ID (lower panels) treated animals at 24 and96 hours post-immunization. Vaccinated mice are represented by the bold line, naive mice by the shaded histogram. The plots are representative of 3mice per group and of 3 repeated experiments.doi:10.1371/journal.pone.0022442.g007
Figure 8. Antigen presentation capability subsequent to ID or ImmuPatch delivery. FITC and MVA-PbCSP was administered to mice andmonitored as described in Figure 7. The expression of MHC class II and CD80 on FITC+ CD32CD192 live cells was determined in the lymph node oftreated animals. Numbers in the upper right hand of each plot represent the percentage of live CD32CD192 cells that express high or positive levelsor are negative for CD80 and MHC class II. The plots are representative of 3 mice per group and of 3 repeated experiments.doi:10.1371/journal.pone.0022442.g008
ImmuPatch Mediated MVA Vaccination
PLoS ONE | www.plosone.org 10 July 2011 | Volume 6 | Issue 7 | e22442

Therefore, ImmuPatch mediated immunization is a viable
alternative to needle-and-syringe based administration of a T cell
inducing live vaccine that reduces innate inflammation, with
potentially reduced reactogenicity. The design of the microneedle
device impacts on the magnitude and phenotype of the induced
immunity and efficacy and should be optimised for use with a
CD8+ T cell inducing live vaccine. This finding underlies future
studies to develop coated or dissolvable microneedle systems
incorporating vaccines that induce cell-mediated immunity. In
human studies to date (data not shown and refs [7,22]) no adverse
events or pain have been reported using these microneedle arrays.
In combination with other advantages of this system, including the
lack of pain, the elimination of sharps waste and the capacity to
affordably mass manufacture these microneedles, ImmuPatch
mediated vaccination demonstrates potential as a feasible needle-
free approach to vaccination that aims to overcome several cost
and logistic obstacles of immunization programmes.
Materials and Methods
ImmuPatch microneedle patch designSilicon microneedles were fabricated using wet-etch technology
as previously described [8]. The area of each microneedle patch
and the length and number of microneedles per patch were
designed to produce a microneedle patch that created specific total
pore volumes when inserted into skin. The pore volume of these
pyramidal silicon microneedles was determined using the formula
to calculate the volume of a right circular cone. The total pore
volume per array is the sum of the volume of each pore on the
array. The specific dimensions of each patch is detailed in
Table 1.
VaccinesThe construction, design and preparation of Modified Vaccinia
Virus Ankara (MVA) expressing P. berghei CSP (MVA-PbCSP) and
red fluorescent protein (MVA-RFP)) have been previously
described [32]. All viruses were resuspended in endotoxin-free
PBS for immunization.
Animals and ImmunizationFemale BALB/c mice 4–6 weeks old (Harlan UK) were used in
all experiments which were conducted in strict accordance with the
terms of licences from the Irish Department of Health and Children,
under the Cruelty to Animals Act (licence numbers B100/4034 and
B100/3157) and the UK Home Office, under the terms of the
Animals (Scientific Procedures) Act 1986 (licence numbers 30/7793
and 30/2414)and according to the approval of the UCC AECC and
University of Oxford Animal Ethics Commitees. Mice were
immunized with 16106pfu MVA-PbCSP in phosphate buffered
saline (PBS) (Sigma). Vaccine was administered with a conventional
28G needle and syringe intradermally (ID) into the ear (50 ml of
16106pfu per mouse). Alternatively, 5 ml of vaccine was placed on
the dorsal surface of the ear and administered to the anaesthetised
mouse by pressing a microneedle array onto the ear, using a force of
approximately 10–20N (16106pfu in 10 ml per mouse). Mice were
primed on day 0. Post-prime T cell responses were analysed in the
spleen on day 14 after immunization. Mice were boosted by the ID
route or using a microneedle array at day 14 post-immunization.
Vaccine-induced immunity was tested in the spleen of all groups 14
days after boosting.
Immunogenicity StudiesT cell responses to the dominant MHC class I epitope Pb9
(SYIPSAEKI) [14] were analysed by intracellular cytokine staining
and flow cytometry (ICS) in the same method as previously
described [17,33]. Briefly, ACK-treated splenocytes were pre-
incubated for 1 hour with TAPI-2 (4 mg/well, equivalent to
100 mM peptide, Peptides International [34] and subsequently
incubated for 5 h in the presence of 1 mg/mL Pb9, 100 mM TAPI-
2 and 2 mL/mL Golgi-Plug (BD Biosciences). Staining antibodies
were specific for mouse and purchased from eBioscience. After
blocking Fc receptors with anti-CD16/CD32, cells were surface
stained for 30 min at 4uC with Pacific Blue-labeled anti-CD8a and
APC-Alexa Fluor 700-labeled anti-CD4, PE-Cy7-labeled CD127
and PerCpCy5.5-labeled CD62L. Cells were permeabilized in
Cytofix/Cytoperm solution as per manufacturer’s instructions (BD
Biosciences). Intracellular cytokines were stained with APC-
labeled anti-IFN-c, FITC-labeled anti-TNF-a, and PE-labeled
anti-IL-2. Flow cytometric analyses were performed using an
LSRII (BD Biosciences) and data were analyzed with FlowJo (Tree
Star) software. One million events per sample were acquired.
Analysis of multifunctional T cell responses was performed by
using Boolean analysis in FlowJo software and SPICE 4.0 (M.
Roederer NIH, Bethesda). Three major subsets of cytokine-
expressing, antigen-specific T cells were defined according to their
expression of CD62L and CD127 [16,17]. These markers are
associated with central memory T cells (TCM: CD62L+ CD127+),
effector memory T cells (TEM: CD62L2 CD127+), effector T cells
(TE: CD62L2 CD1272) and intermediate phenotype T cells (Tint,
CD62L+ CD1272 ).
Sporozoite challenge and survival analysisMice were challenged intravenously with 1000 Plasmodium berghei
sporozoites (ANKA 234) as described previously [14,17]. Giemsa-
stained blood smears were screened to day 20 post-challenge and
% parasitaemia ascertained [35]. Linear regression analysis was
used to determine the timepoint at which parasiteamia would
reach 0.5% in parasitic mice. A Cox’s Proportional Hazards
Regression model was used to test for significant differences in the
chance of reaching the 0.5% parasitaemia threshold at any one
timepoint (assuming that this ratio is the same at each time point)
as compared to the naı̈ve control group during the monitoring
period.
FITC uptake and cell traffickingFITC (1mg/ml solution in PBS) was added to MVA-PbCSP
and administered to mice by the ID route or using ImmuPatch
array F in the same manner as used for immunization. At 24 and
96 hours after delivery ears and lymph nodes were harvested from
3 mice per group per timepoint. Cells were isolated from ears by
modifying a previously described method [36]. Briefly ears were
separated into dorsal and ventral leaflets, placed dermal side down
in supplemented RPMI1640 media, scored with a blade and
scraped to encourage release of cells from the tissue. Following one
hour incubation at 37uC, 5% CO2, cells were collected and passed
through a 70 mm strainer, centrifuged and re-suspended in PBS.
Similarly, the LNs were homogenised through a 70 mm cell
strainer, centrifuged and re-suspended in PBS. Sample cell
suspensions were blocked with Fc-block (BD) and subsequently
stained with anti-mouse CD3 and CD19 to gate T and B cells,
CD11c, MHC class II (IA/IE) and CD80 (ebioscience). A live/
dead cell stain (Invitrogen) was included. Cells within the live cell
gate were then analysed for levels of FITC or surface markers.
RT-PCR assessment of cytokine and chemokine inductionEars and lymph nodes were snap-frozen in liquid nitrogen
immediately after harvesting. Tissues were then disrupted using
MagNA Lyser Green Beads and total RNA purified using High
ImmuPatch Mediated MVA Vaccination
PLoS ONE | www.plosone.org 11 July 2011 | Volume 6 | Issue 7 | e22442

Pure RNA tissue kit following the manufacturer’s protocol (Roche,
Germany). cDNA was prepared from isolated RNA using The
High Capacity cDNA Reverse Transcription Kit (Applied
Biosystems, USA). Real-time quantitative RT-PCR analysis of
cDNA samples, prepared from isolated RNA, for selected genes
were performed using the TaqManH Gene Expression Assays and
ABI7300 Real time PCR System instrument and software (Applied
Biosystems) following the manufacturer’s protocols. The relative
expression of the following genes was measured: TNF-a (ID:
Mm00443258_m1), IL1-a (ID: Mm00439620_m1), IL-1b (ID:
Mm00434228_m1), IL-6 (ID: Mm00446190_m1), IL-10 (ID:
Mm00439616_m1), TGF-b1 (ID: Mm00441726_m1), Ccl4 (ID:
Mm00443112_m1), Ccl5 (ID: Mm01302428_m1), IL-12b (ID:
Mm00434174_m1), IFN-b (ID: Mm00439552_s1). The house-
keeping gene used was GAPDH (ID: 4352932E). Real-time PCR
data were analyzed as follows: cycle numbers at threshold crossing
(Ct) values were subtracted from Ct values for a control house-
keeping gene, GAPDH, to generate DCt values. Gene expression
values relative to GAPDH were calculated as 22DCt.
Statistical AnalysisData were analyzed using GraphPad Prism version 5 for
Windows (GraphPad Software, San Diego, California, USA).
Normality of was assessed by Kolmogorov-Smirnov test. Unpaired
two-tailed Student’s t-test or one way ANOVA were performed, as
appropriate, to compare the responses between groups. Cox’s
Proportional Hazards Regression analysis was preformed using
STATA.
Supporting Information
Figure S1 Sample FACS plots Figure 2. Mice were
immunized by the ID route (top panels) or using microneedle
Array F (middle panels) or Array G (lower panels). (A) Magnitude
of the multi-functional TNF-a (Y-axis), IFN-c (X-axis) response in
gated live CD8+ T cells that were unstimulated (left panels) or
stimulated with Pb9 epitope (right panels). (B) Memory phenotype
of antigen-specific CD8+ T cells; CD62L (Y-axis) CD127 (X-axis).
(PDF)
Figure S2 Sample FACS plots Figure 3. Mice were primed
by the ID route (top panels) or using microneedle Array F (middle
panels) or Array G (lower panels) and boosted by the ID route. (A)
Magnitude of the multi-functional TNF-a (Y-axis), IFN-c (X-axis)
response in gated live CD8+ T cells that were unstimulated (left
panels) or stimulated with Pb9 epitope (right panels). (B) Memory
phenotype of antigen-specific CD8+ T cells; CD62L (Y-axis)
CD127 (X-axis).
(PDF)
Figure S3 Total number of antigen-specific CD8+ T cellsafter a prime and prime-boost immunization. BALB/c
mice were immunized with MVA-PbCSP by the intradermal (id)
route or using an ImmuPatch device of increasing pore volume
and were examined after priming or after and ID boost. The total
number of antigen-specific CD8+ T cells in spleens were quantified
after intracellular cytokine staining (ICS) of IFN-c, TNF-a, and
IL-2 subsequent to stimulation with the immunodominant Pb9
peptide. Data are expressed as the total number of cytokine-
secreting CD8+ T cells, +/2 standard error of the mean (+/
2SEM), 2 weeks after a single (A) or prime-boost (B) immuniza-
tion. * p,0.05, ** p,0.01, ***p,0.001 compared with ID
vaccinated mice in by one way ANOVA.
(PDF)
Figure S4 Total cell counts in draining lymph nodespost-immunization. BALB/c mice were immunized with
MVA-PbCSP by the ID route or using microneedle array F
(‘Patch’). Naive mice were untreated. Mean with individual cell
counts in homogenised lymph nodes that were harvested from all
mice at 24 hours (top panel) or 48 hours (bottom panel) after
immunization was determined using a Coulter counter. * p,0.05,
** p,0.01 compared with ID vaccinated mice in by one way
ANOVA.
(PDF)
Figure S5 Distribution of microneedle-delivered fluo-rescent nanospheres in mouse ear. A 5 ml solution of red
fluorescent nanospheres, 100nm in diameter (Invitrogen) were
administered to the ears of anaesthetised BALB/c mice using
microneedle array F. Thirty minutes post-administration, animals
were culled and ears were removed, preserved and cryosectioned
into 10 mm sections. Cell nuclei were stained using DAPI. Samples
were examined by fluorescent microscopy (106).
(PDF)
Figure S6 Recombinant MVA infects different skinlayers when administered by ID or ImmuPatch. Trans-
gene expression (red fluorescent protein RFP) detected in ex vivo
pig skin cultures when MVA-RFP (16106pfu) is delivered by ID or
microneedle array G. Freshly excised pig skin was setup in a short-
term ex vivo culture. MVA-RFP was injected intradermally or
administered using microneedle array G and skin was cultured
for 14 hours at 37uC to permit virus infection and transgene
expression. Skin was then snap frozen and cryo-sectioned into
10 mm sections. Samples were examined by light microscopy
(406). The site of MVA administration is indicated by arrows.
Similar results were obtained in four independent experiments.
(PDF)
Figure S7 Delivery efficiency of nanospheres intomurine skin. Red fluorescent nanospheres were administered
to mice in the same manner as described in Figure S4, using arrays
F, C or H or using a flat silicon patch with no microneedles (‘flat’).
After 30 minutes, animals were sacrificed and the outside of the
ears were swabbed with wet cotton wool to remove beads that
were on the skin surface. Ears were homogenised in a HCl/
Tween80/PBS solution (1.0:0.1:0.07 v/v/v). The homogenate
was centrifuged at 1400rpm for 3 minutes and the fluorescence in
the supernatant was determined and compared to the fluorescence
present in the original nanosphere solution administered to mice.
Mean (+/2 SEM) with individual percentage fluorescence
recovered from inside the ear is represented for each group.
Mean (+/2 SEM) for Flat patch = 0.96 (0.14)%; Patch F = 3.17
(0.46)%; Patch C = 2.58 (0.60)%; Patch H = 2.87 (0.30)%.
(PDF)
Acknowledgments
The authors wish to thank Sarah Gilbert and Ali Turner at the Jenner
Institute for support with virus vectors, Hilary Watt at the Jenner Institute
for statistical support and James Birchall, School of Pharmacy, University
of Cardiff for support in establishing the ex vivo skin culture model.
Author Contributions
Conceived and designed the experiments: JBC FEP AV AVSH ACM.
Performed the experiments: JBC FEP AV PTW MGM TD. Analyzed the
data: JBC FEP AV PTW ACM. Contributed reagents/materials/analysis
tools: AMC PTW COM AVSH. Wrote the paper: FEP ACM.
ImmuPatch Mediated MVA Vaccination
PLoS ONE | www.plosone.org 12 July 2011 | Volume 6 | Issue 7 | e22442

References
1. Wolfson LJ, Gasse F, Lee-Martin SP, Lydon P, Magan A, et al. (2008)Estimating the costs of achieving the WHO-UNICEF Global Immunization
Vision and Strategy, 2006–2015. Bull World Health Organ 86: 27–39.2. Nicolas JF, Guy B (2008) Intradermal, epidermal and transcutaneous
vaccination: from immunology to clinical practice. Expert Rev Vaccines 7:1201–1214.
3. Ormerod LP, Garnett JM (1988) Tuberculin response after neonatal BCG
vaccination. Arch Dis Child 63: 1491–1492.4. Ormerod LP, Palmer C (1993) Tuberculin reactivity after neonatal percutaneous
BCG immunisation. Arch Dis Child 69: 155.5. Liu L, Zhong Q, Tian T, Dubin K, Athale SK, et al. (2009) Epidermal injury
and infection during poxvirus immunization is crucial for the generation of
highly protective T cell-mediated immunity. Nat Med 16: 224–227.6. Laurent PE, Bourhy H, Fantino M, Alchas P, Mikszta JA (2010) Safety and
efficacy of novel dermal and epidermal microneedle delivery systems for rabiesvaccination in healthy adults. Vaccine 28: 5850–5856.
7. Haq MI, Smith E, John DN, Kalavala M, Edwards C, et al. (2008) Clinical
administration of microneedles: skin puncture, pain and sensation. BiomedMicrodevices 11: 35–47.
8. Wilke N, Mulcahy A, Ye SR, Morrissey A (2005) Process optimization andcharacterization of silicon microneedles fabricated by wet etch technology.
Microelectronics Journal 36: 650–656.9. Prausnitz MR, Mikszta JA, Cormier M, Andrianov AK (2009) Microneedle-
based vaccines. Curr Top Microbiol Immunol 333: 369–393.
10. Widera G, Johnson J, Kim L, Libiran L, Nyam K, et al. (2006) Effect of deliveryparameters on immunization to ovalbumin following intracutaneous adminis-
tration by a coated microneedle array patch system. Vaccine 24: 1653–1664.11. Draper SJ, Heeney JL (2010) Viruses as vaccine vectors for infectious diseases
and cancer. Nat Rev Microbiol 8: 62–73.
12. Hiraishi Y, Nandakumar S, Choi SO, Lee JW, Kim YC, et al. (2011) BacillusCalmette-Guerin vaccination using a microneedle patch. Vaccine.
13. Dean CH, Alarcon JB, Waterston AM, Draper K, Early R, et al. (2005)Cutaneous delivery of a live, attenuated chimeric flavivirus vaccine against
Japanese encephalitis (ChimeriVax)-JE) in non-human primates. Hum Vaccin 1:106–111.
14. Moore AC, Gallimore A, Draper SJ, Watkins KR, Gilbert SC, et al. (2005) Anti-
CD25 antibody enhancement of vaccine-induced immunogenicity: increaseddurable cellular immunity with reduced immunodominance. J Immunol 175:
7264–7273.15. Darrah PA, Patel DT, De Luca PM, Lindsay RW, Davey DF, et al. (2007)
Multifunctional TH1 cells define a correlate of vaccine-mediated protection
against Leishmania major. Nat Med 13: 843–850.16. Bachmann MF, Wolint P, Schwarz K, Jager P, Oxenius A (2005) Functional
properties and lineage relationship of CD8+ T cell subsets identified byexpression of IL-7 receptor alpha and CD62L. J Immunol 175: 4686–4696.
17. Reyes-Sandoval A, Sridhar S, Berthoud T, Moore AC, Harty JT, et al. (2008)Single-dose immunogenicity and protective efficacy of simian adenoviral vectors
against Plasmodium berghei. Eur J Immunol 38: 732–741.
18. Pham NL, Badovinac VP, Harty JT (2009) A default pathway of memory CD8T cell differentiation after dendritic cell immunization is deflected by encounter
with inflammatory cytokines during antigen-driven proliferation. J Immunol183: 2337–2348.
19. Joshi NS, Cui W, Chandele A, Lee HK, Urso DR, et al. (2007) Inflammation
directs memory precursor and short-lived effector CD8(+) T cell fates via thegraded expression of T-bet transcription factor. Immunity 27: 281–295.
20. Vogt A, Mahe B, Costagliola D, Bonduelle O, Hadam S, et al. (2008)
Transcutaneous anti-influenza vaccination promotes both CD4 and CD8 T cell
immune responses in humans. J Immunol 180: 1482–1489.
21. Milewski M, Brogden NK, Stinchcomb AL (2010) Current aspects of
formulation efforts and pore lifetime related to microneedle treatment of skin.
Expert Opin Drug Deliv 7: 617–629.
22. Enfield J, O’Connell ML, Lawlor K, Jonathon E, O’Mahony C, et al. (2010) In
vivo dynamic characterization of microneedle skin penetration using optical
coherence tomography (OCT). J Biomedical Optics 15: 046001.
23. Kupper TS (1990) The activated keratinocyte: a model for inducible cytokine
production by non-bone marrow-derived cells in cutaneous inflammatory and
immune responses. J Invest Dermatol 94: 146S–150S.
24. Gopee NV, Roberts DW, Webb P, Cozart CR, Siitonen PH, et al. (2007)
Migration of intradermally injected quantum dots to sentinel organs in mice.
Toxicol Sci 98: 249–257.
25. Puri N, Weyand EH, Abdel-Rahman SM, Sinko PJ (2000) An investigation of
the intradermal route as an effective means of immunization for microparticulate
vaccine delivery systems. Vaccine 18: 2600–2612.
26. Harvey AJ, Kaestner SA, Sutter DE, Harvey NG, Mikszta JA, et al. (2010)
Microneedle-Based Intradermal Delivery Enables Rapid Lymphatic Uptake and
Distribution of Protein Drugs. Pharm Res.
27. Badovinac VP, Messingham KA, Jabbari A, Haring JS, Harty JT (2005)
Accelerated CD8+ T-cell memory and prime-boost response after dendritic-cell
vaccination. Nat Med 11: 748–756.
28. Finn JD, Bassett J, Millar JB, Grinshtein N, Yang TC, et al. (2009) Persistence of
transgene expression influences CD8+ T-cell expansion and maintenance
following immunization with recombinant adenovirus. J Virol 83: 12027–12036.
29. Tatsis N, Fitzgerald JC, Reyes-Sandoval A, Harris-McCoy KC, Hensley SE,
et al. (2007) Adenoviral vectors persist in vivo and maintain activated CD8+T cells: implications for their use as vaccines. Blood 110: 1916–1923.
30. Koutsonanos DG, del Pilar Martin M, Zarnitsyn VG, Sullivan SP,
Compans RW, et al. (2009) Transdermal influenza immunization with
vaccine-coated microneedle arrays. PLoS One 4: e4773.
31. Good MF, Doolan DL (1999) Immune effector mechanisms in malaria. Curr
Opin Immunol 11: 412–419.
32. Schneider J, Gilbert SC, Blanchard TJ, Hanke T, Robson KJ, et al. (1998)
Enhanced immunogenicity for CD8+ T cell induction and complete protective
efficacy of malaria DNA vaccination by boosting with modified vaccinia virus
Ankara. Nat Med 4: 397–402.
33. Sridhar S, Reyes-Sandoval A, Draper SJ, Moore AC, Gilbert SC, et al. (2008)
Single-dose protection against Plasmodium berghei by a simian adenovirus
vector using a human cytomegalovirus promoter containing intron A. J Virol 82:
3822–3833.
34. Jabbari A, Harty JT (2006) Simultaneous assessment of antigen-stimulated
cytokine production and memory subset composition of memory CD8 T cells.
J Immunol Methods 313: 161–168.
35. Draper SJ, Moore AC, Goodman AL, Long CA, Holder AA, et al. (2008)
Effective induction of high-titer antibodies by viral vector vaccines. Nat Med 14:
819–821.
36. Belkaid Y, Jouin H, Milon G (1996) A method to recover, enumerate and
identify lymphomyeloid cells present in an inflammatory dermal site: a study in
laboratory mice. J Immunol Methods 199: 5–25.
ImmuPatch Mediated MVA Vaccination
PLoS ONE | www.plosone.org 13 July 2011 | Volume 6 | Issue 7 | e22442
Top Related