


Languages
Pages
Legal

Meta-analysis of Error Sources in the Determination of Micro- and Nanoplastics
by
Cayla R. Cook
A Thesis Presented in Partial Fulfillment
of the Requirements for the Degree
Master of Science
Approved October 2018 by the
Graduate Supervisory Committee:
Rolf Halden, Chair
Giuseppe Mascaro
Kerry Hamilton
ARIZONA STATE UNIVERSITY
December 2018
i
ABSTRACT
The occurrence of micro-and nanoplastic (MNP) debris in the environment is a
research area of considerable public health concern. Various combinations of methods for
extraction, isolation, and quantification of MNP have been applied but literature studies
evaluating the appropriateness and efficacy of these protocols are lacking. A meta-analysis
of the literature (n=134; years 2010-2017) was conducted to inventory and assess the
appropriateness of methodologies employed. Some 30.6% of studies employed visual
identification only, which carried a calculated misidentification error of 25.8-74.2%. An
additional 6.7% of studies reported counts for particles smaller than the cutoff value of the
selected collection pore size, and 9.7% of studies utilized extraction solution densities
which exclude some of the polymers commonly occurring in the environments
investigated. A composite value of data vulnerability of 43.3% was determined for the
sample, indicating considerable weaknesses in the robustness of information available on
MNP occurrence and type. Additionally, the oxidizing solutions documented in the
literature frequently were deemed unsuccessful in removing interfering organic matter.
Whereas nanoplastics measuring <1 µm in diameter are likely principal drivers of health
risk, polymer fragments reported on in the literature are much larger, measuring 10+ µm
in diameter due to lack of standardized methods. Thus, current inventories of MNP in the
environmental MNP feature data quality concerns that should be addressed moving
forward by using more robust and standardized techniques for sampling, processing and
polymer identification to improve data quality and avoid the risk of misclassification.
ii
ACKNOWLEDGEMENTS
I would first like to thank Dr. Rolf Halden of the Biodesign Center for
Environmental Health and Engineering (CEHE) at Arizona State University for being the
most amazing leader and academic advisor. Through the perfect balance of pressure,
encouragement, and constructive criticism, you slowly transformed this thesis into a
higher quality than I would have ever dreamed otherwise.
I would also like to thank other members of CEHE who have answered many
emails, provided suggestions to improve the clarity, and pretended to have never seen the
material in front of them for many rounds of internal peer review.
Although not necessarily beside me throughout the course of my thesis, I would
like to thank my friends and family members that have cultivated the goals that have led
me this far. To my late grandmother and grandfather, Rebecca and Bobby J. Cook, my
every achievement is an acknowledgement to your love.

iii
TABLE OF CONTENTS
Page
LIST OF TABLES ............................................................................................................ vi
LIST OF FIGURES .......................................................................................................... vii
CHAPTER
1. INTRODUCTION .....................................................................................................1
2. METHODS ................................................................................................................4
Literature Search ..........................................................................................4
Data Extraction and Meta-Analysis .............................................................5
Identification Error Analysis........................................................................6
Composite Data Vulnerability Analysis ......................................................6
3. RESULTS ..................................................................................................................7
Literature Meta-Analysis Results ................................................................7
Vulnerability to Potential Misquantification .............................................10
Appropriateness to Sample Screening Procedure ..........................10
Appropriateness of Density Separation Solution ...........................11
Misidentification ........................................................................................12
Other Sources of Misquantification ...........................................................13
Importance of Nanoplastic Analysis Review .............................................14
4. DISCUSSION ..........................................................................................................16
REFERENCES ........................................................................................................22
APPENDICES .........................................................................................................35
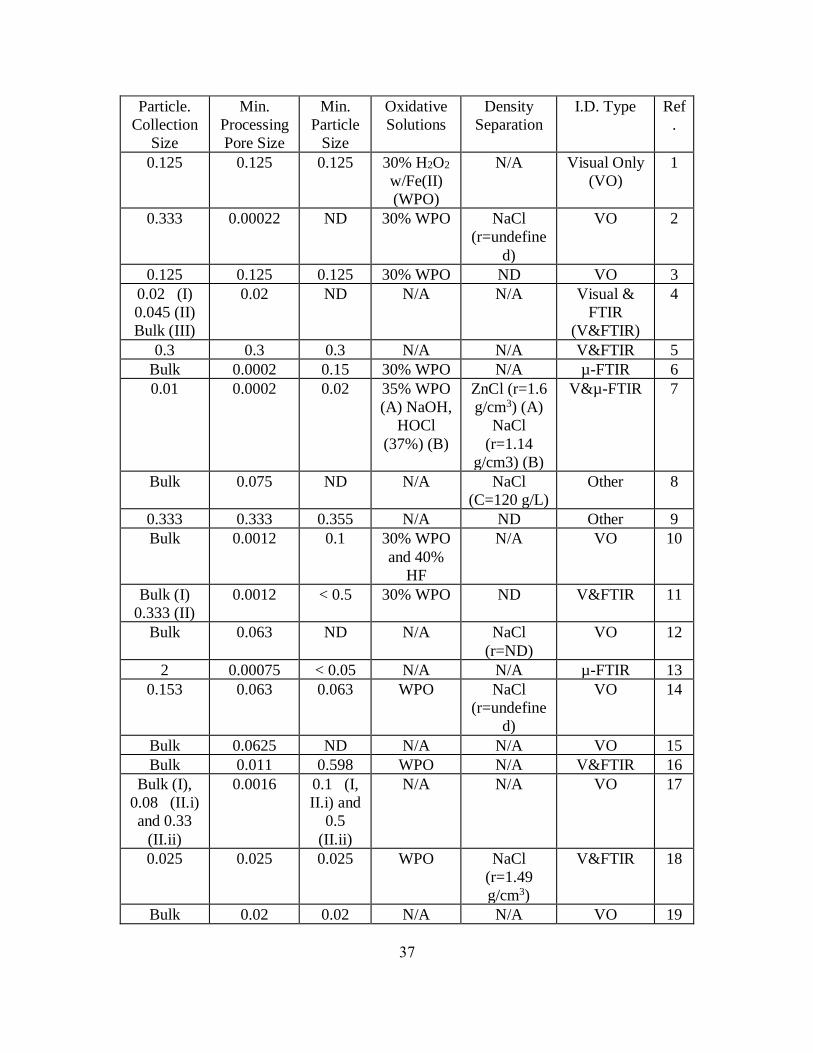
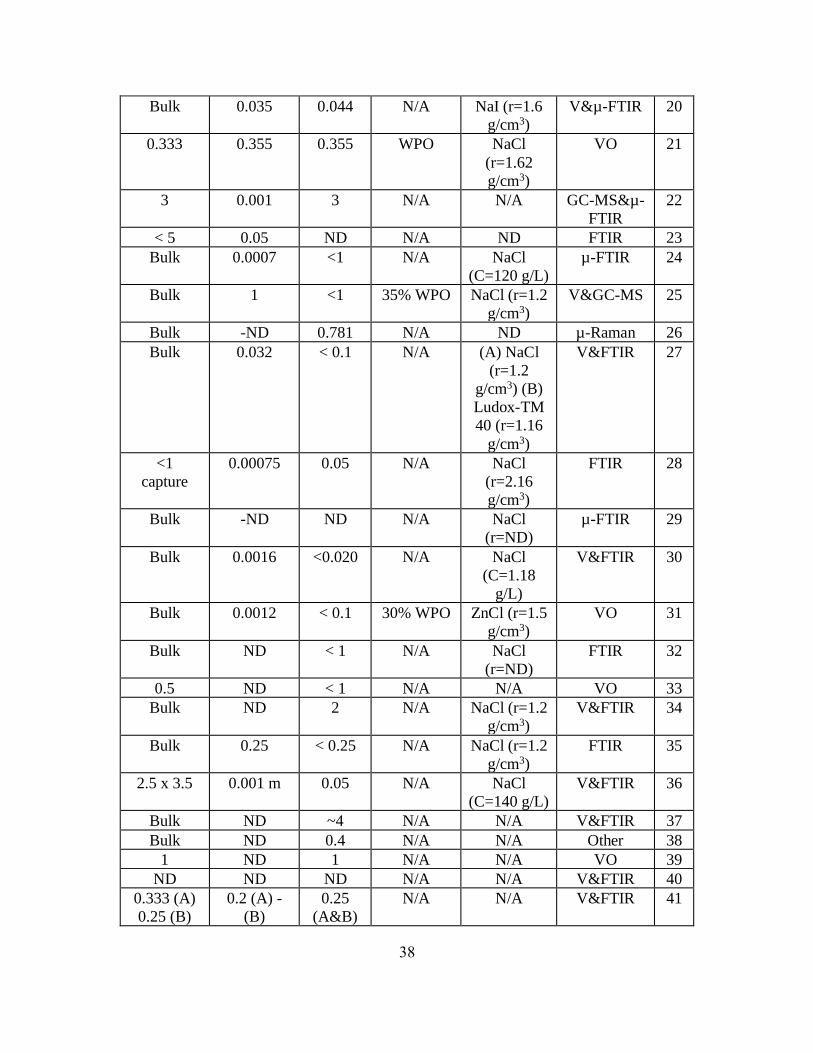
APPENIDX A: META-ANALYSIS INVENTORY ................................36

iv
CHAPTER Page
APPENIDX B: VISUAL IDENTIFICATION ERROR ESTIMATION ..44
APPENIDX C: DENSITY SEPARATION MISMATCH .......................46
APPENIDX D: MATERIAL AND VISUAL CHARACTERIZATION
SIZE LIMITATIONS ...............................................................................48
v
LIST OF TABLES
TABLE Page
1. Mismatch of particles analyzed and collection pore size. ............................................ 11
vi
LIST OF FIGURES
FIGURE Page
Figure 1: Results from the meta-analysis on microplastics literature (n=134) .................. 9
Figure 2: Density of common marine polymers and density of applied solutions for
separation in 119 studies ....................................................................................................12
Figure 3: Characterization of micro-and nanoplastics by size (Ref. in Supplementary
Information). ......................................................................................................................13
Figure 4: Health impacts of plastics and plastic additives .................................................14
Figure 5: Schematic illustrating potential source of error and recommended method ......16
Figure 6: Recommended methods diagram with increasing data quality ..........................19
1
Introduction
Beginning in 1972, microplastic pollution has been documented in every part of the
world from ice cores in the Arctic to polymeric particles in Antarctica (Munari et al.,
2017; Obbard et al., 2014; Lusher, Tirelli, O’Conner, & Officer, 2015; Cózar et al., 2017;
Bergmann et al., 2017). Despite the pervasive nature of polymeric litter, uniform methods
to analyze and quantify these microplastics have yet to be widely adopted. After more
than four decades of polymeric litter studies, methods of quantification are finally
beginning to approach the smaller size range: nanoplastics (Catarino, Macchia,
Sanderson, Thompson & Henry, 2018).
Toxicological studies on the burden of microplastics taken up by biota have shown
microplastics <110 µm enter the blood stream and are transported into the lymphatic
system, bile, urine, and cerebrospinal fluid. Accumulation occurs in the liver, kidney, and
gut at sizes <20 µm of mice, producing neurotoxic responses among others (Deng, Zhang,
Lemos, & Ren, 2017). Microfibers have even been discovered at sizes up to 135 µm in
the lungs of lung cancer patients with links to carcinogenic effects at sizes >10 µm in
length (Pauly et al., 1998; Omenn et al., 1986; Wright & Kelly, 2017). Moreover, 78% of
the US EPA’s priority pollutants are utilized to either synthesize plastics or have been
found adsorbed onto plastic litter (Rochman et al., 2013). Sources of microplastic
ingestion include bottled water, sea salt, sugar, beer, honey, shellfish, and crustaceans
(Liebezeit & Liebezeit, 2017; Schymanski, Goldbeck, Humpf, & Fürst, 2018; Yang et al.,
2015).
One common polymer identification classification approach focuses on the size of
plastic debris. The largest plastics occur as macroplastics (>25 mm) and mesoplastics (5-

2
25 mm). Although microplastics (MP) are sometimes referred to as particles less than 5
mm, academic literature is establishing a lower size limit of 1 µm along the longest axis
(Andrady, 2011). Particles measuring <1 µm are classified as nanoplastics (NP) (Mattson,
Jocic & Doverbratt, 2018). However, upper and lower size limits are openly debated in
literature (Cole, Lindeque, Halsband, & Galloway, 2011).
Another sub-classification scheme distinguishes primary and secondary micro-and
nanoplastics (MNPs), dependent upon their occurrence in a manufactured, virgin state or
as the progeny of primary plastics, resulting from mechanical, chemical, thermal, and
ultraviolet degradation. Thus, both primary and secondary plastics over time do break
down along a continuum from macro- to meso- to micro- to nanoplastics.
Due to polymer’s ubiquitous applications, MNPs are documented to occur from a
variety of merchandise as well as from releases from point and non-point sources.
Sources of primary MNPs include but are not limited to facial products, toothpaste,
glitter, gel nail polishes, abrasive paints, manufactured pellets, and engineered
nanomaterials. Sources of secondary plastics, as previously mentioned, include the
plethora of plastic debris in the environment breaking down such as macro-and
mesoplastic merchandises. These macro-and mesoplastics include synthetic clothing,
food containers, wrappers, utensils, plastic bags, and fishing supplies. Point sources of
MNPs into the environment include wastewater treatment plants, city dust, and other
highly anthropogenic locations produced from abrasion of macroplastics.
MNP composition differs by environmental sample type and location. A spectrum
of combinations of organic polymer additives, inorganic polymer additives, and polymer
types are documented. The most common microplastic litter in sediment is as follows:
3
polyethylene (PE), polypropylene (PP), polystyrene (PS), polyethylene terephthalate
(PET), polyvinyl alcohol (PVA), polyamide (PA), polyurethane (PU), and polyvinyl
chloride (PVC) (Burns & Boxall, 2018). Standard thermoplastics make up the vast
majority of plastics produced and account for approximately 229 million metric tons
globally annually (Plastic Europe, 2015). Of the polymers listed, monomer constituents
have well established toxicity including PVC and PU causing carcinogenic effects and
cellular mutagenicity (Lithner, Larrson, & Dave, 2011).
Organic plastic additives such as diethyl phthalate, diethylhexyl phthalate (DEHP),
disobutyl phthalate (DBP), and dimethyl phthalate are recorded in environmental
microplastic samples as well (Fries et al., 2013). Inorganic plastic additives found in MPs
include aluminum, titanium dioxide, barium, sulphur, oxygen, and zinc (Fries et. al,
2013). Notably, DEHP and DBP have been correlated with serious developmental issues
most likely due to endocrine disrupting effects (Heudorf, Bolker, & Jürgen, 2007).
Currently, MP sample processing consists of three phases: collection, extraction,
and analysis. The collection phase can be bulk removal in sediment, water, or ice whereas
size-specific removal involves various pore sizes of nets, sieves, or filters. Next,
extraction involves either density separation (DS), oxidation, DS and oxidation, or no
additional processing (NAP). The analysis phase then involves either visual only,
material only, visual and material, or visual sample interrogation.
In the absence of a uniform method, this study aims at assessing the certain, or
robust data, produced by historical methods. Likewise, addressing the uncertain, or
vulnerable data, produced by other methods will provide additional clarity. The objective
of this study was to identify vulnerable or flawed microplastic studies in order to prevent
4
their propagation in future studies. Additionally, recognizing potential sources of error in
microplastic analyses will assist in creating methods for environmental nanoplastic
analysis and quantification as literature progresses to this size range.
Methods
Literature Search. A comprehensive database of environmental microplastic studies
was acquired following PRISMA meta-analyses guidelines (McInnes et al., 2018) of the
following databases: Google Scholar, Science Direct, Arizona State University’s Library
One, and ResearchGate. Advanced search terms included small plastic litter
(microplastic, nanoplastic, microfiber, or plastic litter) and matrices of occurrence (water,
wastewater, sediment, or soil). Journal articles excluded were as follows (1) a comparison
of methods or novel methods, (2) occurrence of MNPs within organisms, (3)
unpublished, (4) not accessible within the databases listed above, or (5) not translated
into English. Inclusion criteria focused on articles which target the microplastic size
range and collect, extract, and analyze these particles within the study. A sample search
term of Google Scholar is as follows: ‘allintitle: MICROPLASTIC -METHOD -
MICROALGAE -FOOD -BIOACCUMULATION -PREDICTION -MODEL -
PLANKTON -BIOTA -HERRING -ALGAE -GASTROINTESTINAL -COD -GUT -
TROPHIC -MUSSEL -MUSSELS -FISH -CRAB -MODEL -CRUSTACEANS -
INGESTION’ (year: 2010-2017) (n=288); the ‘-‘ term denotes NOT. Studies were
screened individually to further identify their suitability. Exclusion criteria included
papers exploring novel identification methods and those which enumerate microplastics
which occur within biota. Additionally, abstracts were reviewed to further apply
5
exclusion and inclusion criteria. The literature search considered publications occurring
on or before January 2018. The final sample of studies entering the analysis was n=134.
Data Extraction and Meta-Analysis. Literature which met all criteria were then
individually inventoried for multiple parameters including: sample environment,
minimum collection, filter or sieve processing, and particle size, oxidative solution(s),
density solution(s), applied quality control method(s), applied analysis method(s), and
spectroscopy library reference for material identification. Oxidative solutions were
categorized as none, wet peroxide oxidation (WPO), WPO & other, undefined (ND), and
other. Density separation solution(s) were categorized as NaCl, ZnCl, none, ND, and
other. Applied quality control methods include the following: avoidance of synthetic
instrumentation or dishware, procedural control blanks, extraction control blanks, and
nonsynthetic clothing, e.g. lab coat. Applied analysis methods were then categorized into
types including: visual only, visual and macro-spectroscopy [Fourier Transform Infrared
Spectroscopy (FTIR); Raman], micro-spectroscopy (µ-FTIR; µ-Raman; Scanning
Electron Microscope-Energy Dispersive X-ray Spectroscopy (SEM-EDS)], visual and
pyrolysis gas-chromatography mass spectrometry (Pyro. GC-MS), and other. For samples
which apply spectroscopy, material identification reference are differentiated by manual
with reference, manual with no reference, and automatic referencing which calculates a
percentage match or best fit to material. Simple statistical analyses were then conducted
within Microsoft Excel to innumerate and sort each category. All data included in the
meta-analysis are provided in the Supporting Information (SI).
6
Error analyses were conducted from this literature sample to determine sources
and quantify prevalence. Data to determine particles analyzed outside of the sampling
size range was extracted from the text of literature as well as graphical images. Sizes
were determined from graphical images using microscope scale bars when provided. All
meta-analysis literature which contained author’s calculated error values for
misidentification of organic particles for microplastics were collected alongside total
particles analyzed for the cumulative error analysis. Density outliers were isolated
through binning data.
Identification Error Analysis. A weighted average of cumulative error was then
calculated using Equation 1.
Eq. 1
Where: % 𝑒𝑟𝑟𝑜𝑟 is percent error of the respective study.
𝑛 is the number of particles analyzed.
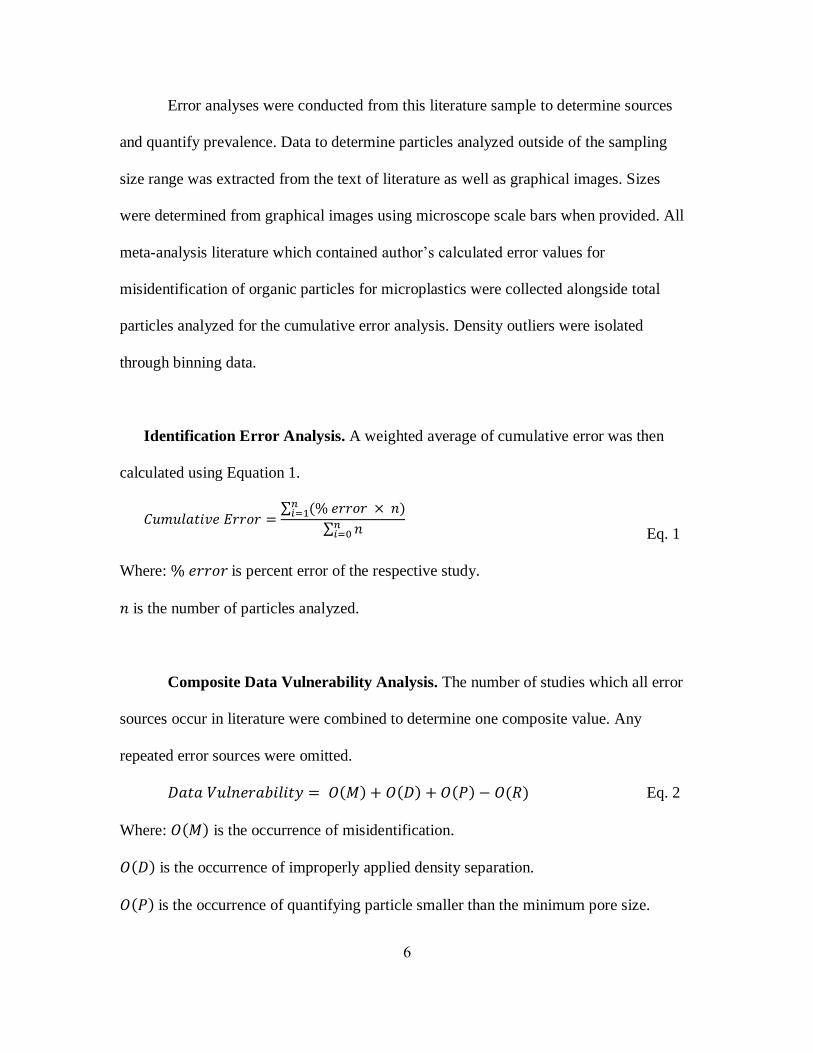
Composite Data Vulnerability Analysis. The number of studies which all error
sources occur in literature were combined to determine one composite value. Any
repeated error sources were omitted.
𝐷𝑎𝑡𝑎 𝑉𝑢𝑙𝑛𝑒𝑟𝑎𝑏𝑖𝑙𝑖𝑡𝑦 = 𝑂(𝑀) + 𝑂(𝐷) + 𝑂(𝑃) − 𝑂(𝑅) Eq. 2
Where: 𝑂(𝑀) is the occurrence of misidentification.
𝑂(𝐷) is the occurrence of improperly applied density separation.
𝑂(𝑃) is the occurrence of quantifying particle smaller than the minimum pore size.
𝐶𝑢𝑚𝑢𝑙𝑎𝑡𝑖𝑣𝑒 𝐸𝑟𝑟𝑜𝑟 =∑ (% 𝑒𝑟𝑟𝑜𝑟 × 𝑛)𝑛
𝑖=1
∑ 𝑛𝑛𝑖=0

7
𝑂(𝑅) is the occurrence of repeated error sources.
Results
Literature Meta-Analysis Results. Upon literature search (n=380) and
application of exclusion criteria, a total of 134 studies published between 2010 and 2017
remained for consideration. Among this body of literature, studies enumerate MPs from
sediment, saltwater, freshwater, brackish water, wastewater treatment plants (WWTPs),
street dust, and sea ice. With respect to sample pre-treatment, a majority of the literature
applied no oxidation (66.4%) (n=134) or wet peroxide oxidation (WPO) (26%)as well as
the following: (other, 3.7%; WPO and other, 2.2%; undefined, 1.5%). Solutions applied
for density separation included primarily NaCl (41.8%) followed by additional separation
compounds or lack thereof (none, 35.8%; undefined, 9%; other, 8.2%; ZnCl, 5.2%). None
dictates the process was never applied. Undefined solvents are essentially studies which
state using the process but never identify the solvent. Quality control methods applied
include none (40.2%) followed by one (22.4%), two (20.1%), three (14.9%), and four
(2.2%). Methods of polymer identification were also analyzed with the majority applying
visual and macro-spectroscopy (34.8%), visual only (30.6%), micro-spectroscopy
(13.4%), other (9.7%) spectroscopy only (5.2%), and visual and Pyro. GC-MS (2.2%).
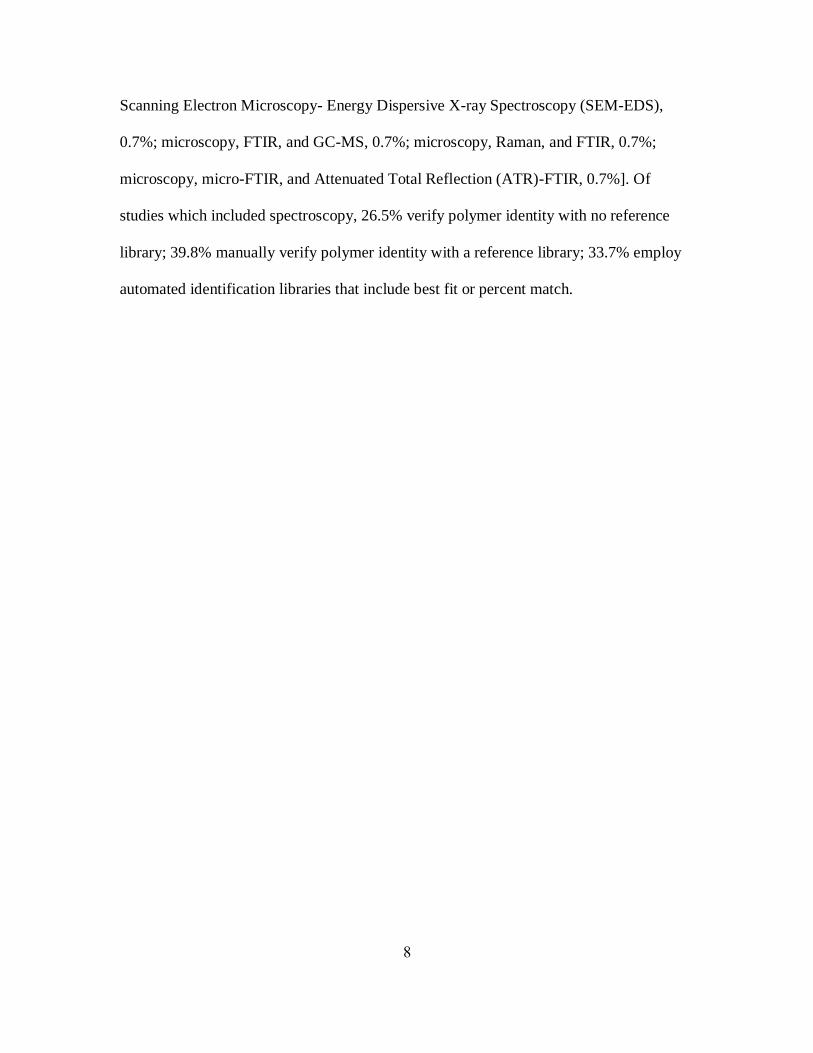
The “Other” data category in Fig. 1 includes combinations of methods that add a level of
robustness to the study design: Pyrolysis Gas Chromatography-Mass Spectrometry (Pyro.
GC-MS) and microscopy with Fourier Transform Infrared Spectroscopy (FTIR), 0.7%;
microscopy, FTIR, and differential scanning calorimeter (DSC), 0.7%; microscopy and
DSC, 0.7%; Pyrolysis Gas Chromatography-Mass Spectrometry (Pyro. GC-MS) and
8
Scanning Electron Microscopy- Energy Dispersive X-ray Spectroscopy (SEM-EDS),
0.7%; microscopy, FTIR, and GC-MS, 0.7%; microscopy, Raman, and FTIR, 0.7%;
microscopy, micro-FTIR, and Attenuated Total Reflection (ATR)-FTIR, 0.7%]. Of
studies which included spectroscopy, 26.5% verify polymer identity with no reference
library; 39.8% manually verify polymer identity with a reference library; 33.7% employ
automated identification libraries that include best fit or percent match.

9
Figure 1. QC=Quality Control. Results from the meta-analysis on microplastics
literature (n=134). Number of peer-reviewed publications by year fitting the exclusion
criteria of this review (A), pre-processing of environmental samples (B, C), applied
characterization or visual methods to sample (D), and smallest sieve, filter, or mesh size
applied during processing. The red sector highlights lack of any spectroscopy,
spectrometry, or other material verification instrument. Applied quality control methods
includes a combination of sample contamination mitigation techniques such as
nonsynthetic lab instruments and apparel (E). For studies which utilizes spectroscopy, a
Spectroscopy
Only5.2%Other
9.7%
Visual & Pyro. GC-MS
2.2%
Visual & macro-
Spectroscopy38.8%
µ-Spectroscopy
13.4%
Visual Only
30.6%
Methods of Polymer I.D. (n=134)
None
35.8%
NaCl
41.8%
Undefined
9.0%
ZnCl
5.2%
Other
8.2%
Density Separation (n=134)
Undefined
1.5%
None
66.4%
H2O2/Fenton
26%
Other
3.7%WPO & Other
2.2%
Oxidative Solutions (n=134)
1✕10-3 mm 1✕10-2 mm 1✕10-1 mm 1 mm1✕10-4 mm
(2, 6, 7, 12, 13, 24, 28, 48, 50, 58, 59, 69, 76, 80, 83, 85, 88, 98, 107, 109, 119)
(36, 22, 46, 77, 78, 99, 100,10, 11, 43, 94, 70, 31, 62, 66, 2016,
118, 17, 60, 30, 103 ,110)
(4, 8, 14, 15, 16, 18, 19, 20, 23, 27, 49, 51, 54, 55, 61, 63, 68, 73, 74, 86, 92, 101, 102,
108, 111, 112, 113, 114, 115)
(1, 3, 5, 9, 35, 41, 42, 45, 48, 65, 67, 72, 81, 84, 87, 96, 97,
104, 117)
(25, 53, 93, 71, 72)
A
15
3 5 39
2023
29
42
0
10
20
30
40
50
1972-2009 2010 2011 2012 2013 2014 2015 2016 2017
Nu
mb
er
of
Stu
die
s
Publication Activity B
C D
G
References
None
40.3%
One
22.4%
Two
20.1%
Three
14.9%
Four
2.2%
QC Methods Applied (n=134)
Automated
33.7%
Manual with
No
Reference26.5%
Manual with
Reference
39.8%
Spectra Material Identification (n=83)E F

10
differentiation of manual, manual no reference, and manual with reference material
identification libraries are shown (F). The red and black dashed lines show the average
smallest extraction pore size of the sample compared the average smallest particle studied
(F). ‘None’ dictates the process was never applied. Studies which utilize the processing
method but do not identify the solvent are shown as ‘undefined’. The other category
includes rarely applied methods.
Vulnerability to Potential Misquantification.
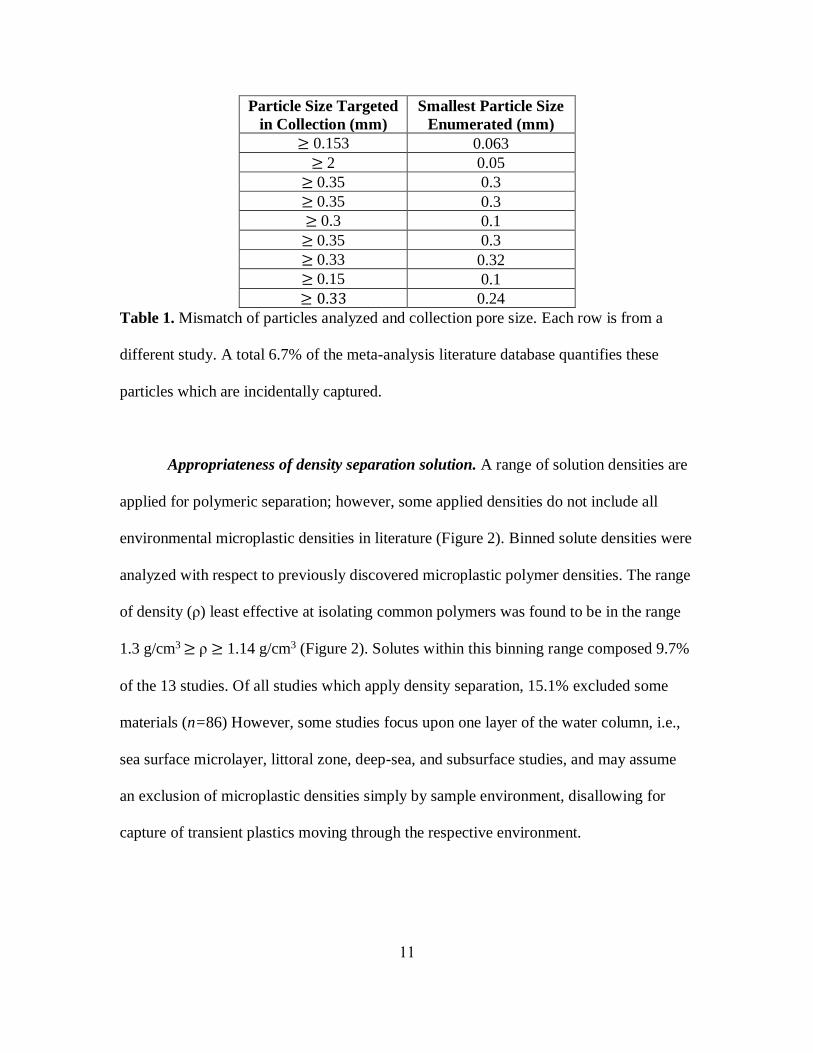
Appropriateness of sample screening procedure. Aqueous and sediment sample
extraction typically varies in that aqueous samples focus on the filter cake whereas
sediment samples focus on the filtrate. Thus, incidental capture and enumeration of
particles in screens, i.e. nets or sieves, has a false positive effect on aqueous samples and
false negative effect on sediment samples. Of course, false negatives in this instance
would not be recorded; however, false positives are noted via microscope images of
samples, description of minimum particle size counted, and other ways. This source of
false positive occurs when applying sieve, mesh, or nets to retain particles of analysis and
these incidentally captured particles by pore blockage. A small portion (6.7%;n=134) of
literature analyzed particles which were smaller than the retaining pore size. Mismatches
of collection size and pore size are summarized in Table 1. All of these studies occurred
in aqueous samples.
11
Particle Size Targeted
in Collection (mm)
Smallest Particle Size
Enumerated (mm)
≥ 0.153 0.063
≥ 2 0.05
≥ 0.35 0.3
≥ 0.35 0.3
≥ 0.3 0.1
≥ 0.35 0.3
≥ 0.33 0.32
≥ 0.15 0.1
≥ 0.33 0.24
Table 1. Mismatch of particles analyzed and collection pore size. Each row is from a
different study. A total 6.7% of the meta-analysis literature database quantifies these
particles which are incidentally captured.
Appropriateness of density separation solution. A range of solution densities are
applied for polymeric separation; however, some applied densities do not include all
environmental microplastic densities in literature (Figure 2). Binned solute densities were
analyzed with respect to previously discovered microplastic polymer densities. The range
of density (ρ) least effective at isolating common polymers was found to be in the range
1.3 g/cm3 ≥ ρ ≥ 1.14 g/cm3 (Figure 2). Solutes within this binning range composed 9.7%
of the 13 studies. Of all studies which apply density separation, 15.1% excluded some
materials (n=86) However, some studies focus upon one layer of the water column, i.e.,
sea surface microlayer, littoral zone, deep-sea, and subsurface studies, and may assume
an exclusion of microplastic densities simply by sample environment, disallowing for
capture of transient plastics moving through the respective environment.

12
Figure 2. Densities of common marine polymers and densities of applied solutions for
separation in 134 studies. Red lines denote the occurrence of densities found in literature
that exclude common polymeric materials. The empirical density used is shown to the
right of each line. An error occurs when 𝜌𝑝𝑜𝑙𝑦𝑚𝑒𝑟 < 𝜌𝑠𝑜𝑙𝑢𝑡𝑒 .
Misidentification. In terms of microplastic analysis, robust data is preferred to
verify polymeric composition. If the material composition is not defined, then the particle
may not be polymeric. As described in Figure 1.D, 30.6% of literature categorized
particles as microplastics with only microscopy. Without the application of material
identification, an identification error of 25.8-74.2% (n=6) was determined utilizing
recorded errors of visually identified microplastics. This is also sometimes referred to in
literature as observer bias and is one large source of error preventing equal comparison
across microplastic literature. Particles commonly mistaken for microplastics or
microfibers include fly ash, cotton fibers, and red algal fibers (Dubaish & Leibezeit,
13
2013) . Additionally, misidentification potential is found in studies categorized as “other”
(mechanical testing, 0.7%; “hot needle testing”, 0.7%; strong acids, 0.7%). Mechanical
testing is described as physical pressure applied to the material. Hot needle testing applies
heat to a potential synthetic material to verify by melting point; strong acid tests also
determined if synthetic material melted when exposed.
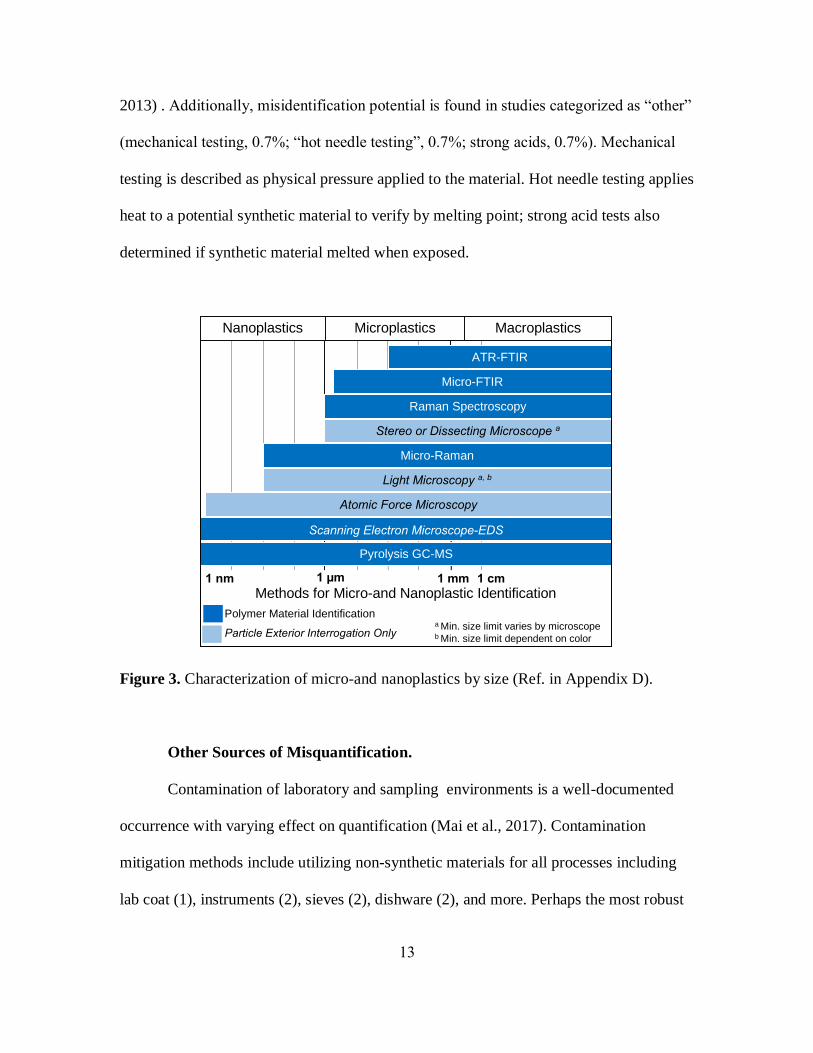
Figure 3. Characterization of micro-and nanoplastics by size (Ref. in Appendix D).
Other Sources of Misquantification.
Contamination of laboratory and sampling environments is a well-documented
occurrence with varying effect on quantification (Mai et al., 2017). Contamination
mitigation methods include utilizing non-synthetic materials for all processes including
lab coat (1), instruments (2), sieves (2), dishware (2), and more. Perhaps the most robust
ATR-FTIR
Raman Spectroscopy
Atomic Force Microscopy
Light Microscopy a, b
Stereo or Dissecting Microscope a
Pyrolysis GC-MS
Micro-FTIR
Micro-Raman
Scanning Electron Microscope-EDS
1 nm 1 µm 1 mm
Polymer Material Identification
Particle Exterior Interrogation Onlya Min. size limit varies by microscopeb Min. size limit dependent on color
Methods for Micro-and Nanoplastic Identification
MicroplasticsNanoplastics Macroplastics
1 cm

14
of all would be the subtraction of both extraction (3) and procedural blanks (4). In the
peer reviewed studies analyzed, 40.3% included none of the four contamination
mitigation techniques numbered above. Moreover, only 2.2% applied all four mitigation
techniques. Naturally, cleansing of instruments, filtering solvents, utilizing a fume hood,
and air filtration devices further prevent contamination. Lastly, utilization of controls or
processing blanks, sampling blanks, testing bench surfaces, identification of research
vessels color and material ID (Bagaev, Khatmullina, & Chubarenko, 2017), and more
methods can prevent the contamination of samples.
Importance of Nanoplastic Analysis. The smallest particle size analyzed from
an environmental matrix is currently ~10 µm; however, the presence and potential
abundance of nanoplastics are widely acknowledged to be produced from degradation as
well as occurring in a manufactured state. Although the average minimum pore size of
filtration or screening in the meta-analysis is 146.8 µm, data shows that the average
particle size included in quantification is 354.8 µm (n=134). Additionally, an increasing
presence of decreasing particle size with continued exposure happens over relatively
short time periods (Hahladakis et al., 2017).
Moreover, microplastic toxicity is directly related to particle size and mechanism
of exposure. Persistent microfibers have been discovered in lung tissue of lung cancer
patients at sizes up to 135 µm. Beginning at 130 µm, particles begin to enter the
lymphatic system. Studies have also noted the occurrence of microplastics at up to 110
µm in blood, urine, and cerebrospinal fluid of dogs following ingestion. Moreover,
deposition in the liver, kidney, and gut increase for particles <20 µm (Deng, Zhang,
15
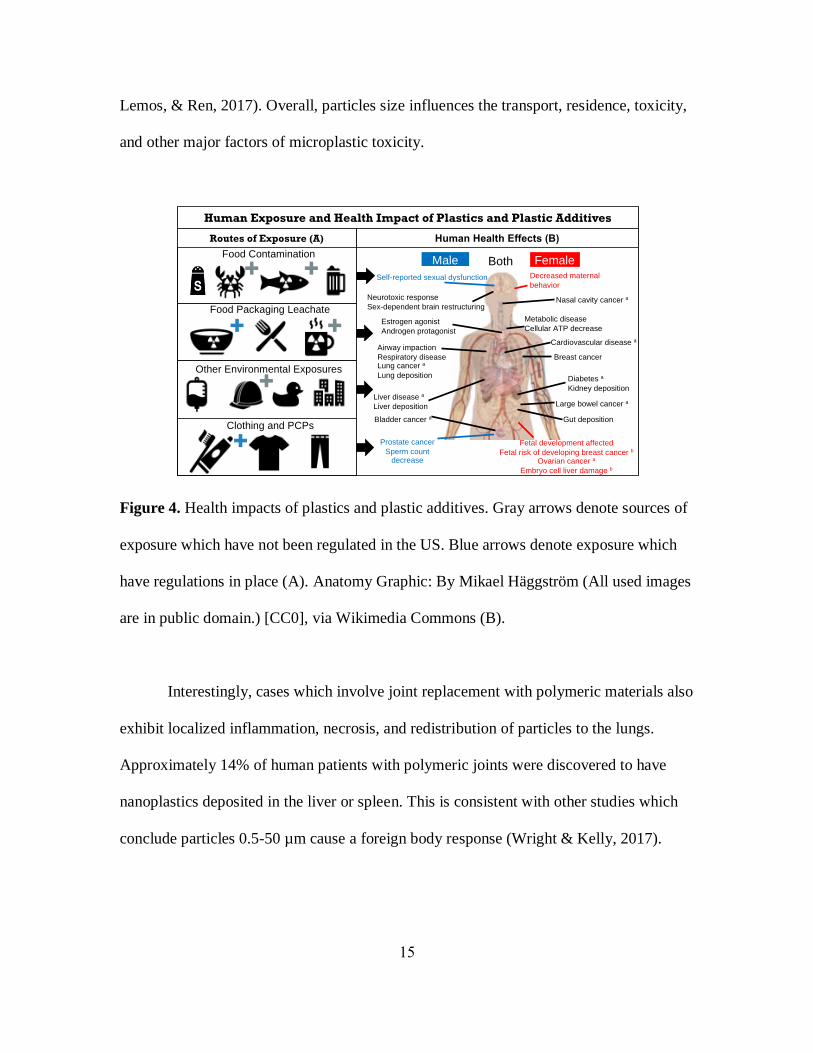
Lemos, & Ren, 2017). Overall, particles size influences the transport, residence, toxicity,
and other major factors of microplastic toxicity.
Figure 4. Health impacts of plastics and plastic additives. Gray arrows denote sources of
exposure which have not been regulated in the US. Blue arrows denote exposure which
have regulations in place (A). Anatomy Graphic: By Mikael Häggström (All used images
are in public domain.) [CC0], via Wikimedia Commons (B).
Interestingly, cases which involve joint replacement with polymeric materials also
exhibit localized inflammation, necrosis, and redistribution of particles to the lungs.
Approximately 14% of human patients with polymeric joints were discovered to have
nanoplastics deposited in the liver or spleen. This is consistent with other studies which
conclude particles 0.5-50 µm cause a foreign body response (Wright & Kelly, 2017).
Food Contamination
Food Packaging Leachate
Other Environmental Exposures
Clothing and PCPs
Male FemaleBoth
Neurotoxic response
Sex-dependent brain restructuring
Cardiovascular disease a
Liver disease a
Liver deposition
Diabetes a
Kidney deposition
Metabolic disease
Cellular ATP decrease
Fetal development affected
Fetal risk of developing breast cancer b
Ovarian cancer a
Embryo cell liver damage b
Gut deposition
Prostate cancer
Sperm count decrease
Estrogen agonist
Androgen protagonist
Breast cancer
Decreased maternal
behaviorSelf-reported sexual dysfunction
Airway impaction
Respiratory diseaseLung cancer a
Lung deposition
Nasal cavity cancer a
Large bowel cancer a
Bladder cancer a
Human Exposure and Health Impact of Plastics and Plastic Additives
Routes of Exposure (A) Human Health Effects (B)

16
Discussion
This literature review identified a number of vulnerabilities in the collection,
extraction, and analysis of environmental MNP. All in all, very few microplastic methods
of extraction, isolation, and quantification are similar. Error sources begin with sample
processing as 6.7% of studies analyzed particles retained in nets, sieves, or filters smaller
than the pore size of the extraction instrument. Next, 50.4% of studies used only density
separation with 9.7% of all studies densities leaving out portions of the environmental
polymer population. Furthermore, oxidation is not always successful for removing
organic matter according to literature. No processing, e.g. density separation or oxidation,
remains the greatest risk for sample misidentification particularly if applied in
conjunction with only visual identification. Most importantly, 30.6% of the sample
applied no methods of material identification to verify polymeric composition. Within
30.6% of meta-analysis studies, an average 25.8-74.2% of misidentified microplastics
was calculated from published data sources. Some studies binned within the “other”
category contain error sources through polymeric analysis involving vulnerable methods
such as ‘flame tests’ and mechanical prodding of objects accounting for 1.4%.
17
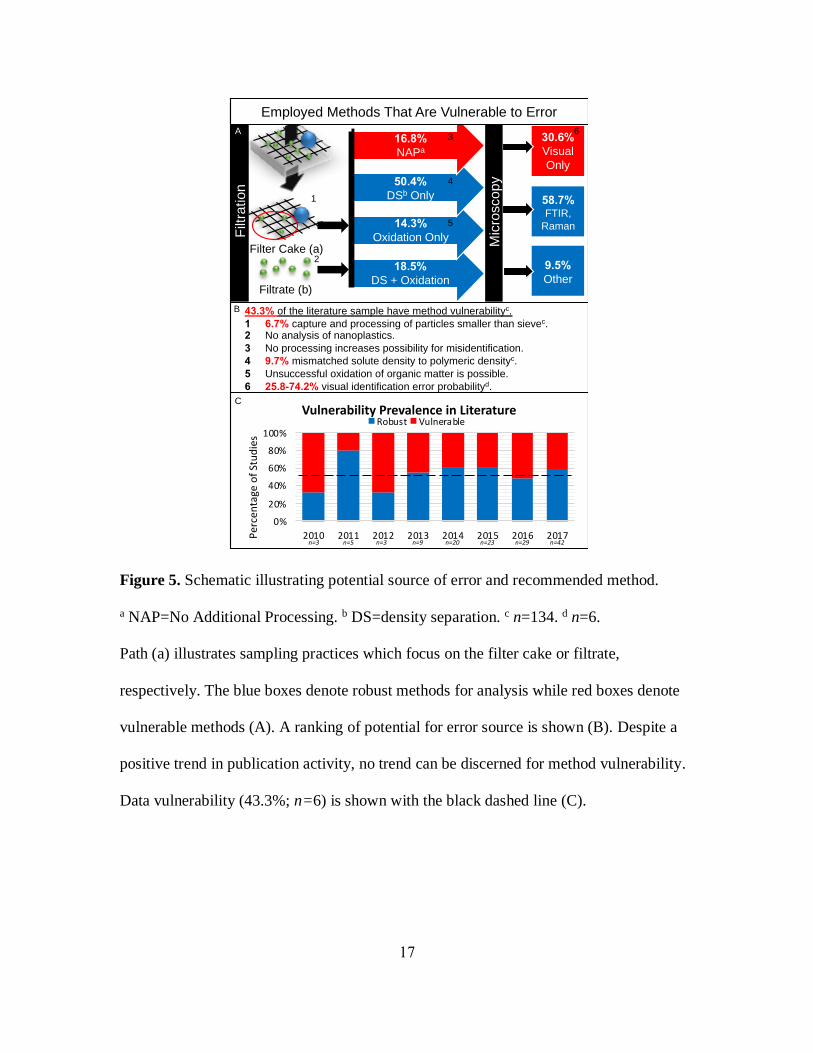
Figure 5. Schematic illustrating potential source of error and recommended method.
a NAP=No Additional Processing. b DS=density separation. c n=134. d n=6.
Path (a) illustrates sampling practices which focus on the filter cake or filtrate,
respectively. The blue boxes denote robust methods for analysis while red boxes denote
vulnerable methods (A). A ranking of potential for error source is shown (B). Despite a
positive trend in publication activity, no trend can be discerned for method vulnerability.
Data vulnerability (43.3%; n=6) is shown with the black dashed line (C).
Filter Cake (a)
Filtrate (b)
18.5%
DS + Oxidation
14.3%
Oxidation Only
50.4%
DSb Only
16.8%
NAPa
9.5%
Other
30.6%
Visual
Only
Filt
ration
58.7%FTIR,
Raman
Mic
roscopy
Employed Methods That Are Vulnerable to Error
1
3
4
6
5
A
43.3% of the literature sample have method vulnerabilityc.
1 6.7% capture and processing of particles smaller than sievec.2 No analysis of nanoplastics.
3 No processing increases possibility for misidentification.
4 9.7% mismatched solute density to polymeric densityc.
5 Unsuccessful oxidation of organic matter is possible.
6 25.8-74.2% visual identification error probabilityd.
B
2
C
0%
20%
40%
60%
80%
100%
2010 2011 2012 2013 2014 2015 2016 2017Per
cen
tage
of
Stu
die
s
Vulnerability Prevalence in LiteratureRobust Vulnerable
n=3 n=5 n=3 n=9 n=20 n=23 n=29 n=42

18
Prospectively, studies can avoid these sources of error through design of methods
focusing on the particular sample composition and desired size range. Mismatch of
particle size and pore size is easily avoided with extraction techniques which contain a
larger range of microplastics such as bulk or core samples. Additionally, binning particles
by size is a reliable way to prevent any particles beyond the size range of sampling.
Optimal density separation is applied as a two-stage method of a hyper-dense
solution followed by a moderately dense solution (2.0 g/cm3 ≤ ρ1 then 1.3 g/cm3 < ρ2 <
1.8 g/cm3). Note the solution is soaked for several hours, the supernatant is extracted
carefully, and then the remaining solution is sonicated and separated by density two
additional times (Mai et al., 2017). Oxidative solutions are optimized as a multi-stage
system to target a desired level of organic matter removal. These solutions must be
cleansed, sonicated, and filtered between stages as well. Application of density separation
is most beneficial in samples consisting of sediment, whereas oxidation techniques would
be most beneficial in highly organic sample environments such as saltwater. Both density
separation and oxidation would be optimally applied to a highly organic sample such as
wastewater.

19
Figure 6. Recommended method diagram with increasing data quality.
Due to the high error rate of visually identified samples, application of methods
which employ material identification provide the most robust data set. Studies can
optimize material identification further by applying the appropriate characterization
instrument based upon the smallest particle size desired to characterize. Micro-Raman
and Raman have shown interference of material identification due to biofilms or dyes
influencing the monochromatic laser (Lenz et al., 2015). However, automated single-
particle exploration (APSE) micro-Raman has been shown to produce robust results with
more accurate quantification of MPs <500 µm (Cabernard et al., 2018). Micro-FTIR
offers robust data analysis when coupled with two spectral databases (Primpke et al.,
2017). Pyrolysis GC-MS is effective in identifying polymer composition; however, the
destruction of samples is undesirable. Although physical stress tests may be applicable
for larger particles, i.e. >1000 µm, this method is less reliable with decreasing particle
size and shown in the “other” category.
With consideration for error sources, current microplastic inventory could be
overestimated or underestimated. As the size range of studies approach the nanoplastic
Water or Sediment Recommended Processing
Net
Filter
Sieve
Bulk Removal ASPE-µ-Raman
Raman
Pyro. GC-MSExtr
actio
n
Isola
tion
Iden
tifica
tio
n
Density Separation +
Oxidation
Oxidation Only
Density Separation Only
No Processing
FTIR
ATR-FTIR
Sort
ing
Light Microscope
Stereo Microscope
No ProcessingOther
Water Sample Sediment Sample Potential for ErrorAll Sample Types
NAP
Legend
Qu
ality of D
ata

20
region, more sensitive and automated methods must be applied in order to truly quantify
existing plastic exposure, predict future plastic exposure, prevent human bias, and assess
the hazard of environmental MNPs.
21
Abbreviations.
SPT, Sodium Polytungstate; PP, polypropylene; LDPE, low density polyethylene; HDPE,
high density polyethylene; PS, polystyrene; Nylon, Nylon 12, 11 and Nylon 6 6,6;
PMAA, poly(methyl) methacrylate; PET, polyethylene terephthalate; PVC,
polyvinylchloride; PU, polyurethane; PES, polyester; PVF, polyvinyl fluoride; PTFE,
polytetrafluorethylene; FTIR, Fourier Transform Infrared Spectroscopy; Pyr. GC-MS,
Pyrolysis Gas Chromatography-Mass Spectrometry; EDS, Energy Dispersive X-ray
Spectroscopy
22
REFERENCES
Abayomi, O. A., Range, P., Al-Ghouti, M. A., Obbard, J. P., Almeer, S. H., & Ben-
Hamadou, R. (2017). Microplastics in coastal environments of the Arabian Gulf. Marine
pollution bulletin, 124(1), 181-188.
Abidli, S., Toumi, H., Lahbib, Y., & El Menif, N. T. (2017). The First Evaluation of
Microplastics in Sediments from the Complex Lagoon-Channel of Bizerte (Northern
Tunisia). Water, Air, & Soil Pollution, 228(7), 262.
Acosta-Coley, I., & Olivero-Verbel, J. (2015). Microplastic resin pellets on an urban
tropical beach in Colombia. Environmental monitoring and assessment, 187(7), 435.
Alomar, C., Estarellas, F., & Deudero, S. (2016). Microplastics in the Mediterranean Sea:
deposition in coastal shallow sediments, spatial variation and preferential grain
size. Marine environmental research, 115, 1-10.
Antunes, J. C., Frias, J. G. L., Micaelo, A. C., & Sobral, P. (2013). Resin pellets from
beaches of the Portuguese coast and adsorbed persistent organic pollutants. Estuarine,
Coastal and Shelf Science, 130, 62-69.
Akhbarizadeh, R., Moore, F., Keshavarzi, B., & Moeinpour, A. (2017). Microplastics and
potentially toxic elements in coastal sediments of Iran's main oil terminal (Khark
Island). Environmental Pollution, 220, 720-731.
Anderson, P. J., Warrack, S., Langen, V., Challis, J. K., Hanson, M. L., & Rennie, M. D.
(2017). Microplastic contamination in Lake Winnipeg, Canada. Environmental
pollution, 225, 223-231.
Andrady, A. L. (2011). Microplastics in the marine environment. Marine pollution
bulletin, 62(8), 1596-1605.
Bagaev, A., Khatmullina, L., & Chubarenko, I. (2017). Anthropogenic microlitter in the
Baltic Sea water column. Marine pollution bulletin.
Ballent, A., Corcoran, P. L., Madden, O., Helm, P. A., & Longstaffe, F. J. (2016).
Sources and sinks of microplastics in Canadian Lake Ontario nearshore, tributary and
beach sediments. Marine pollution bulletin, 110(1), 383-395.
Bayo, J., Olmos, S., López-Castellanos, J., & Alcolea, A. (2016). Microplastics And
Microfibers In The Sludge Of A Municipal Wastewater Treatment Plant. International
Journal of Sustainable Development and Planning, 11(5), 812-821.
Baztan, J., Carrasco, A., Chouinard, O., Cleaud, M., Gabaldon, J. E., Huck, T., ... &
Vanderlinden, J. P. (2014). Protected areas in the Atlantic facing the hazards of micro-

23
plastic pollution: first diagnosis of three islands in the Canary Current. Marine Pollution
Bulletin, 80(1-2), 302-311.
Beer, S., Garm, A., Huwer, B., Dierking, J., & Nielsen, T. G. (2017). No increase in
marine microplastic concentration over the last three decades–A case study from the
Baltic Sea. Science of the Total Environment.
Bergmann, M., Wirzberger, V., Krumpen, T., Lorenz, C., Primpke, S., Tekman, M. B., &
Gerdts, G. (2017). High Quantities of Microplastic in Arctic Deep-Sea Sediments from
the HAUSGARTEN Observatory. Environmental science & technology, 51(19), 11000-
11010.
Blašković, A., Fastelli, P., Čižmek, H., Guerranti, C., & Renzi, M. (2017). Plastic litter in
sediments from the Croatian marine protected area of the natural park of Telaščica bay
(Adriatic Sea). Marine pollution bulletin, 114(1), 583-586.
Blumenröder, J., Sechet, P., Kakkonen, J. E., & Hartl, M. G. J. (2017). Microplastic
contamination of intertidal sediments of Scapa Flow, Orkney: A first assessment. Marine
pollution bulletin, 124(1), 112-120.
Browne, M. A., Crump, P., Niven, S. J., Teuten, E., Tonkin, A., Galloway, T., &
Thompson, R. (2011). Accumulation of microplastic on shorelines woldwide: sources
and sinks. Environmental science & technology, 45(21), 9175-9179.
Browne, M. A., Galloway, T. S., & Thompson, R. C. (2010). Spatial patterns of plastic
debris along estuarine shorelines. Environmental Science & Technology, 44(9), 3404-
3409.
Burns, E. E., & Boxall, A. B. (2018). Microplastics in the aquatic environment: Evidence
for or against adverse impacts and major knowledge gaps. Environmental Toxicology and
Chemistry.
Cabernard, L., Roscher, L., Lorenz, C., Gerdts, G., & Primpke, S. (2018). Comparison of
Raman and Fourier Transform Infrared Spectroscopy for the Quantification of
Microplastics in the Aquatic Environment. Environmental Science & Technology.
Carr, S. A., Liu, J., & Tesoro, A. G. (2016). Transport and fate of microplastic particles
in wastewater treatment plants. Water research, 91, 174-182.
Carson, H. S., Colbert, S. L., Kaylor, M. J., & McDermid, K. J. (2011). Small plastic
debris changes water movement and heat transfer through beach sediments. Marine
Pollution Bulletin, 62(8), 1708-1713.
de Carvalho, D. G., & Neto, J. A. B. (2016). Microplastic pollution of the beaches of
Guanabara Bay, Southeast Brazil. Ocean & Coastal Management, 128, 10-17.

24
Castañeda, R. A., Avlijas, S., Simard, M. A., & Ricciardi, A. (2014). Microplastic
pollution in St. Lawrence river sediments. Canadian Journal of Fisheries and Aquatic
Sciences, 71(12), 1767-1771.
Catarino, A. I., Macchia, V., Sanderson, W. G., Thompson, R. C., & Henry, T. B. (2018).
Low levels of microplastics (MP) in wild mussels indicate that MP ingestion by humans
is minimal compared to exposure via household fibres fallout during a
meal. Environmental Pollution, 237, 675-684.
Chae, D. H., Kim, I. S., Kim, S. K., Song, Y. K., & Shim, W. J. (2015). Abundance and
distribution characteristics of microplastics in surface seawaters of the Incheon/Kyeonggi
coastal region. Archives of environmental contamination and toxicology, 69(3), 269-278.
Cincinelli, A., Scopetani, C., Chelazzi, D., Lombardini, E., Martellini, T., Katsoyiannis,
A., ... & Corsolini, S. (2017). Microplastic in the surface waters of the Ross Sea
(Antarctica): Occurrence, distribution and characterization by FTIR. Chemosphere, 175,
391-400.
Claessens, M., De Meester, S., Van Landuyt, L., De Clerck, K., & Janssen, C. R. (2011).
Occurrence and distribution of microplastics in marine sediments along the Belgian
coast. Marine Pollution Bulletin, 62(10), 2199-2204.
Clunies-Ross, P. J., Smith, G. P. S., Gordon, K. C., & Gaw, S. (2016). Synthetic
shorelines in New Zealand? Quantification and characterisation of microplastic pollution
on Canterbury's coastlines. New Zealand Journal of Marine and Freshwater
Research, 50(2), 317-325.
Cluzard, M., Kazmiruk, T. N., Kazmiruk, V. D., & Bendell, L. I. (2015). Intertidal
concentrations of microplastics and their influence on ammonium cycling as related to
the shellfish industry. Archives of environmental contamination and toxicology, 69(3),
310-319.
Cole, M., Lindeque, P., Halsband, C., & Galloway, T. S. (2011). Microplastics as
contaminants in the marine environment: a review. Marine pollution bulletin, 62(12),
2588-2597.
Collignon, A., Hecq, J. H., Glagani, F., Voisin, P., Collard, F., & Goffart, A. (2012).
Neustonic microplastic and zooplankton in the North Western Mediterranean
Sea. Marine pollution bulletin, 64(4), 861-864.
Corcoran, P. L., Norris, T., Ceccanese, T., Walzak, M. J., Helm, P. A., & Marvin, C. H.
(2015). Hidden plastics of Lake Ontario, Canada and their potential preservation in the
sediment record. Environmental pollution, 204, 17-25.
Cordova, M. R., & Wahyudi, A. J. (2016). Microplastic in the deep-sea sediment of
southwestern Sumatera waters. Marine Research in Indonesia, 41(1), 27-35.

25
Costa, M. F., Do Sul, J. A. I., Silva-Cavalcanti, J. S., Araújo, M. C. B., Spengler, Â., &
Tourinho, P. S. (2010). On the importance of size of plastic fragments and pellets on the
strandline: a snapshot of a Brazilian beach. Environmental Monitoring and
Assessment, 168(1-4), 299-304.
Cózar, A., Echevarría, F., González-Gordillo, J. I., Irigoien, X., Úbeda, B., Hernández-
León, S., ... & Fernández-de-Puelles, M. L. (2014). Plastic debris in the open
ocean. Proceedings of the National Academy of Sciences, 111(28), 10239-10244.
Cózar, A., Martí, E., Duarte, C. M., García-de-Lomas, J., Van Sebille, E., Ballatore, T. J.,
... & Troublè, R. (2017). The Arctic Ocean as a dead end for floating plastics in the North
Atlantic branch of the Thermohaline Circulation. Science advances, 3(4), e1600582.
Dehghani, S., Moore, F., & Akhbarizadeh, R. (2017). Microplastic pollution in deposited
urban dust, Tehran metropolis, Iran. Environmental Science and Pollution
Research, 24(25), 20360-20371.
Deng, Y., Zhang, Y., Lemos, B., & Ren, H. (2017). Tissue accumulation of microplastics
in mice and biomarker responses suggest widespread health risks of exposure. Scientific
Reports, 7, 46687.
Dekiff, J. H., Remy, D., Klasmeier, J., & Fries, E. (2014). Occurrence and spatial
distribution of microplastics in sediments from Norderney. Environmental Pollution, 186,
248-256.
Desforges, J. P. W., Galbraith, M., Dangerfield, N., & Ross, P. S. (2014). Widespread
distribution of microplastics in subsurface seawater in the NE Pacific Ocean. Marine
pollution bulletin, 79(1), 94-99.
Dris, R., Gasperi, J., Rocher, V., Saad, M., Renault, N., & Tassin, B. (2015). Microplastic
contamination in an urban area: a case study in Greater Paris. Environmental
Chemistry, 12(5), 592-599.
Dubaish, F., & Liebezeit, G. (2013). Suspended microplastics and black carbon particles
in the Jade system, southern North Sea. Water, Air, & Soil Pollution, 224(2), 1352.
Dyachenko, A., Mitchell, J., & Arsem, N. (2017). Extraction and identification of
microplastic particles from secondary wastewater treatment plant (WWTP)
effluent. Analytical Methods, 9(9), 1412-1418.
Enders, K., Lenz, R., Stedmon, C. A., & Nielsen, T. G. (2015). Abundance, size and
polymer composition of marine microplastics≥ 10 μm in the Atlantic Ocean and their
modelled vertical distribution. Marine pollution bulletin, 100(1), 70-81.
26
Eriksen, M., Mason, S., Wilson, S., Box, C., Zellers, A., Edwards, W., ... & Amato, S.
(2013). Microplastic pollution in the surface waters of the Laurentian Great
Lakes. Marine pollution bulletin, 77(1), 177-182.
Esiukova, E. (2017). Plastic pollution on the Baltic beaches of Kaliningrad region,
Russia. Marine pollution bulletin, 114(2), 1072-1080.
Estahbanati, S., & Fahrenfeld, N. L. (2016). Influence of wastewater treatment plant
discharges on microplastic concentrations in surface water. Chemosphere, 162, 277-284.
Plastic Europe. (2015). Plastics–the Facts 2014/2015 An analysis of European plastics
production, demand and waste data. Plastic Europe.
Fastelli, P., Blašković, A., Bernardi, G., Romeo, T., Čižmek, H., Andaloro, F., ... &
Renzi, M. (2016). Plastic litter in sediments from a marine area likely to become
protected (Aeolian Archipelago's islands, Tyrrhenian sea). Marine pollution
bulletin, 113(1-2), 526-529.
Faure, F., Demars, C., Wieser, O., Kunz, M., & De Alencastro, L. F. (2015). Plastic
pollution in Swiss surface waters: nature and concentrations, interaction with
pollutants. Environmental chemistry, 12(5), 582-591.
Fischer, E. K., Paglialonga, L., Czech, E., & Tamminga, M. (2016). Microplastic
pollution in lakes and lake shoreline sediments–A case study on Lake Bolsena and Lake
Chiusi (central Italy). Environmental pollution, 213, 648-657.
Fok, L., & Cheung, P. K. (2015). Hong Kong at the Pearl River Estuary: a hotspot of
microplastic pollution. Marine pollution bulletin, 99(1-2), 112-118.
Fotopoulou, K. N., & Karapanagioti, H. K. (2012). Surface properties of beached plastic
pellets. Marine environmental research, 81, 70-77.
Free, C. M., Jensen, O. P., Mason, S. A., Eriksen, M., Williamson, N. J., & Boldgiv, B.
(2014). High-levels of microplastic pollution in a large, remote, mountain lake. Marine
pollution bulletin, 85(1), 156-163.
Frias, J. P. G. L., Gago, J., Otero, V., & Sobral, P. (2016). Microplastics in coastal
sediments from Southern Portuguese shelf waters. Marine Environmental Research, 114,
24e30.
Fries, E., Dekiff, J. H., Willmeyer, J., Nuelle, M. T., Ebert, M., & Remy, D. (2013).
Identification of polymer types and additives in marine microplastic particles using
pyrolysis-GC/MS and scanning electron microscopy. Environmental Science: Processes
& Impacts, 15(10), 1949-1956.

27
Gallagher, A., Rees, A., Rowe, R., Stevens, J., & Wright, P. (2016). Microplastics in the
Solent estuarine complex, UK: an initial assessment. Marine pollution bulletin, 102(2),
243-249.
Guerranti, C., Cannas, S., Scopetani, C., Fastelli, P., Cincinelli, A., & Renzi, M. (2017).
Plastic litter in aquatic environments of Maremma Regional Park (Tyrrhenian Sea, Italy):
Contribution by the Ombrone river and levels in marine sediments. Marine pollution
bulletin, 117(1-2), 366-370.
Hahladakis, J. N., Velis, C. A., Weber, R., Iacovidou, E., & Purnell, P. (2017). An
overview of chemical additives present in plastics: Migration, release, fate and
environmental impact during their use, disposal and recycling. Journal of hazardous
materials.
Heudorf, U., Mersch-Sundermann, V., & Angerer, J. (2007). Phthalates: toxicology and
exposure. International journal of hygiene and environmental health, 210(5), 623-634.
Hidalgo-Ruz, V., & Thiel, M. (2013). Distribution and abundance of small plastic debris
on beaches in the SE Pacific (Chile): A study supported by a citizen science
project. Marine environmental research, 87, 12-18
Horton, A. A., Svendsen, C., Williams, R. J., Spurgeon, D. J., & Lahive, E. (2017). Large
microplastic particles in sediments of tributaries of the River Thames, UK–Abundance,
sources and methods for effective quantification. Marine pollution bulletin, 114(1), 218-
226.
Imhof, H. K., Sigl, R., Brauer, E., Feyl, S., Giesemann, P., Klink, S., ... & Muszynski, S.
(2017). Spatial and temporal variation of macro-, meso-and microplastic abundance on a
remote coral island of the Maldives, Indian Ocean. Marine pollution bulletin, 116(1-2),
340-347.
Isobe, A. (2016). Percentage of microbeads in pelagic microplastics within Japanese
coastal waters. Marine pollution bulletin, 110(1), 432-437.
Imhof, H. K., Ivleva, N. P., Schmid, J., Niessner, R., & Laforsch, C. (2013).
Contamination of beach sediments of a subalpine lake with microplastic
particles. Current biology, 23(19), R867-R868.
Isobe, A., Uchida, K., Tokai, T., & Iwasaki, S. (2015). East Asian seas: a hot spot of
pelagic microplastics. Marine pollution bulletin, 101(2), 618-623.
Isobe, A., Uchiyama-Matsumoto, K., Uchida, K., & Tokai, T. (2017). Microplastics in
the Southern Ocean. Marine pollution bulletin, 114(1), 623-626.
28
Kang, J. H., Kwon, O. Y., Lee, K. W., Song, Y. K., & Shim, W. J. (2015). Marine
neustonic microplastics around the southeastern coast of Korea. Marine pollution
bulletin, 96(1-2), 304-312.
Kirstein, I. V., Kirmizi, S., Wichels, A., Garin-Fernandez, A., Erler, R., Löder, M., &
Gerdts, G. (2016). Dangerous hitchhikers? Evidence for potentially pathogenic Vibrio
spp. on microplastic particles. Marine environmental research, 120, 1-8.
Kim, I. S., Chae, D. H., Kim, S. K., Choi, S., & Woo, S. B. (2015). Factors influencing
the spatial variation of microplastics on high-tidal coastal beaches in Korea. Archives of
environmental contamination and toxicology, 69(3), 299-309.
Klein, S., Worch, E., & Knepper, T. P. (2015). Occurrence and spatial distribution of
microplastics in river shore sediments of the Rhine-Main area in
Germany. Environmental science & technology, 49(10), 6070-6076.
Kramm, J., Volker, C., & Wagner, M. (2018). Superficial or Substantial: Why Care about
Microplastics in the Anthropocene?.
Kunz, A., Walther, B. A., Löwemark, L., & Lee, Y. C. (2016). Distribution and quantity
of microplastic on sandy beaches along the northern coast of Taiwan. Marine pollution
bulletin, 111(1-2), 126-135.
La Daana, K. K., Officer, R., Lyashevska, O., Thompson, R. C., & O'Connor, I. (2017).
Microplastic abundance, distribution and composition along a latitudinal gradient in the
Atlantic Ocean. Marine pollution bulletin, 115(1-2), 307-314.
Laglbauer, B. J., Franco-Santos, R. M., Andreu-Cazenave, M., Brunelli, L., Papadatou,
M., Palatinus, A., ... & Deprez, T. (2014). Macrodebris and microplastics from beaches in
Slovenia. Marine Pollution Bulletin, 89(1-2), 356-366.
Lambert, S., & Wagner, M. (2016). Characterisation of nanoplastics during the
degradation of polystyrene. Chemosphere, 145, 265-268.
Lechner, A., Keckeis, H., Lumesberger-Loisl, F., Zens, B., Krusch, R., Tritthart, M., ... &
Schludermann, E. (2014). The Danube so colourful: a potpourri of plastic litter
outnumbers fish larvae in Europe's second largest river. Environmental Pollution, 188,
177-181.
Lenz, R., Enders, K., Stedmon, C. A., Mackenzie, D. M., & Nielsen, T. G. (2015). A
critical assessment of visual identification of marine microplastic using Raman
spectroscopy for analysis improvement. Marine pollution bulletin, 100(1), 82-91.
Leslie, H. A., Brandsma, S. H., Van Velzen, M. J. M., & Vethaak, A. D. (2017).
Microplastics en route: Field measurements in the Dutch river delta and Amsterdam
29
canals, wastewater treatment plants, North Sea sediments and biota. Environment
international, 101, 133-142.
Leslie, H. A., Van Velzen, M. J. M., & Vethaak, A. D. (2013). Microplastic survey of the
Dutch environment. Novel data set of microplastics in North Sea sediments, treated
wastewater effluents and marine biota.
Liebezeit, G., & Dubaish, F. (2012). Microplastics in beaches of the East Frisian islands
Spiekeroog and Kachelotplate. Bulletin of environmental contamination and
toxicology, 89(1), 213-217.
Liebezeit, G., & Liebezeit, E. (2014). Synthetic particles as contaminants in German
beers. Food Additives & Contaminants: Part A, 31(9), 1574-1578.
Ling, S. D., Sinclair, M., Levi, C. J., Reeves, S. E., & Edgar, G. J. (2017). Ubiquity of
microplastics in coastal seafloor sediments. Marine pollution bulletin, 121(1-2), 104-110.
Lithner, D., Larsson, Å., & Dave, G. (2011). Environmental and health hazard ranking
and assessment of plastic polymers based on chemical composition. Science of the Total
Environment, 409(18), 3309-3324.
Lots, F. A., Behrens, P., Vijver, M. G., Horton, A. A., & Bosker, T. (2017). A large-scale
investigation of microplastic contamination: Abundance and characteristics of
microplastics in European beach sediment. Marine pollution bulletin, 123(1-2), 219-226.
Lozoya, J. P., de Mello, F. T., Carrizo, D., Weinstein, F., Olivera, Y., Cedrés, F., ... &
Fossati, M. (2016). Plastics and microplastics on recreational beaches in Punta del Este
(Uruguay): Unseen critical residents?. Environmental pollution, 218, 931-941
Lusher, A. L., Burke, A., O’Connor, I., & Officer, R. (2014). Microplastic pollution in
the Northeast Atlantic Ocean: validated and opportunistic sampling. Marine pollution
bulletin, 88(1-2), 325-333.
Lusher, A. L., Tirelli, V., O’Connor, I., & Officer, R. (2015). Microplastics in Arctic
polar waters: the first reported values of particles in surface and sub-surface
samples. Scientific reports, 5, 14947.
Magnusson, K., & Norén, F. (2014). Screening of microplastic particles in and down-
stream a wastewater treatment plant.
Mani, T., Hauk, A., Walter, U., & Burkhardt-Holm, P. (2015). Microplastics profile
along the Rhine River. Scientific reports, 5, 17988.
Mai, L., Bao, L., Shi, C., Wong, S., & Zeng, E. (2018). A review of methods for
measuring microplastics in aquatic environments. Environmental Science and Pollution
Research, 25(12), 11319-11332.
30
Martin, J., Lusher, A., Thompson, R. C., & Morley, A. (2017). The deposition and
accumulation of microplastics in marine sediments and bottom water from the Irish
continental shelf. Scientific Reports, 7(1), 10772.
Martins, J., & Sobral, P. (2011). Plastic marine debris on the Portuguese coastline: A
matter of size?. Marine pollution bulletin, 62(12), 2649-2653.
Mason, S. A., Garneau, D., Sutton, R., Chu, Y., Ehmann, K., Barnes, J., ... & Rogers, D.
L. (2016). Microplastic pollution is widely detected in US municipal wastewater
treatment plant effluent. Environmental Pollution, 218, 1045-1054.
Mathalon, A., & Hill, P. (2014). Microplastic fibers in the intertidal ecosystem
surrounding Halifax Harbor, Nova Scotia. Marine pollution bulletin, 81(1), 69-79.
Matsuguma, Y., Takada, H., Kumata, H., Kanke, H., Sakurai, S., Suzuki, T., ... & Weerts,
S. (2017). Microplastics in Sediment Cores from Asia and Africa as Indicators of
Temporal Trends in Plastic Pollution. Archives of environmental contamination and
toxicology, 73(2), 230-239.
Mattsson, K., Jocic, S., Doverbratt, I., & Hansson, L. A. (2018). Nanoplastics in the
aquatic environment. In Microplastic Contamination in Aquatic Environments (pp. 379-
399).
McCormick, A. R., Hoellein, T. J., London, M. G., Hittie, J., Scott, J. W., & Kelly, J. J.
(2016). Microplastic in surface waters of urban rivers: concentration, sources, and
associated bacterial assemblages. Ecosphere, 7(11).
McCormick, A., Hoellein, T. J., Mason, S. A., Schluep, J., & Kelly, J. J. (2014).
Microplastic is an abundant and distinct microbial habitat in an urban
river. Environmental science & technology, 48(20), 11863-11871.
McInnes, M. D., Moher, D., Thombs, B. D., McGrath, T. A., Bossuyt, P. M., Clifford, T.,
... & Hunt, H. A. (2018). Preferred reporting items for a systematic review and meta-
analysis of diagnostic test accuracy studies: the PRISMA-DTA statement. Jama, 319(4),
388-396.
Mendoza, L. M. R., & Jones, P. R. (2015). Characterisation of microplastics and toxic
chemicals extracted from microplastic samples from the North Pacific
Gyre. Environmental Chemistry, 12(5), 611-617.
Michielssen, M. R., Michielssen, E. R., Ni, J., & Duhaime, M. B. (2016). Fate of
microplastics and other small anthropogenic litter (SAL) in wastewater treatment plants
depends on unit processes employed. Environmental Science: Water Research &
Technology, 2(6), 1064-1073.

31
Mintenig, S. M., Int-Veen, I., Löder, M. G., Primpke, S., & Gerdts, G. (2017).
Identification of microplastic in effluents of waste water treatment plants using focal
plane array-based micro-Fourier-transform infrared Imaging. Water research, 108, 365-
372.
Mistri, M., Infantini, V., Scoponi, M., Granata, T., Moruzzi, L., Massara, F., ... &
Munari, C. (2017). Small plastic debris in sediments from the Central Adriatic Sea:
Types, occurrence and distribution. Marine pollution bulletin, 124(1), 435-440.
Morét-Ferguson, S., Law, K. L., Proskurowski, G., Murphy, E. K., Peacock, E. E., &
Reddy, C. M. (2010). The size, mass, and composition of plastic debris in the western
North Atlantic Ocean. Marine Pollution Bulletin, 60(10), 1873-1878.
Munari, C., Infantini, V., Scoponi, M., Rastelli, E., Corinaldesi, C., & Mistri, M. (2017).
Microplastics in the sediments of Terra Nova Bay (Ross Sea, Antarctica). Marine
pollution bulletin, 122(1-2), 161-165.
Murphy, F., Ewins, C., Carbonnier, F., & Quinn, B. (2016). Wastewater treatment works
(WwTW) as a source of microplastics in the aquatic environment. Environmental science
& technology, 50(11), 5800-5808.
Naji, A., Esmaili, Z., & Khan, F. R. (2017). Plastic debris and microplastics along the
beaches of the Strait of Hormuz, Persian Gulf. Marine pollution bulletin, 114(2), 1057-
1062.
Naji, A., Esmaili, Z., Mason, S. A., & Vethaak, A. D. (2017). The occurrence of
microplastic contamination in littoral sediments of the Persian Gulf, Iran. Environmental
Science and Pollution Research, 24(25), 20459-20468.
Nel, H. A., & Froneman, P. W. (2015). A quantitative analysis of microplastic pollution
along the south-eastern coastline of South Africa. Marine pollution bulletin, 101(1), 274-
279.
Nel, H. A., Hean, J. W., Noundou, X. S., & Froneman, P. W. (2017). Do microplastic
loads reflect the population demographics along the southern African coastline?. Marine
pollution bulletin, 115(1-2), 115-119.
Nor, N. H. M., & Obbard, J. P. (2014). Microplastics in Singapore’s coastal mangrove
ecosystems. Marine pollution bulletin, 79(1), 278-283.
Nuelle, M. T., Dekiff, J. H., Remy, D., & Fries, E. (2014). A new analytical approach for
monitoring microplastics in marine sediments. Environmental Pollution, 184, 161-169.
Obbard, R. W., Sadri, S., Wong, Y. Q., Khitun, A. A., Baker, I., & Thompson, R. C.
(2014). Global warming releases microplastic legacy frozen in Arctic Sea ice. Earth's
Future, 2(6), 315-320.

32
Omenn, G. S., Merchant, J., Boatman, E., Dement, J. M., Kuschner, M., Nicholson, W.,
... & Rosenstock, L. (1986). Contribution of environmental fibers to respiratory
cancer. Environmental health perspectives, 70, 51.
Pauly, J. L., Stegmeier, S. J., Allaart, H. A., Cheney, R. T., Zhang, P. J., Mayer, A. G., &
Streck, R. J. (1998). Inhaled cellulosic and plastic fibers found in human lung
tissue. Cancer Epidemiology and Prevention Biomarkers, 7(5), 419-428.
Peng, G., Zhu, B., Yang, D., Su, L., Shi, H., & Li, D. (2017). Microplastics in sediments
of the Changjiang Estuary, China. Environmental Pollution, 225, 283-290.
Primpke, S., Lorenz, C., Rascher-Friesenhausen, R., & Gerdts, G. (2017). An automated
approach for microplastics analysis using focal plane array (FPA) FTIR microscopy and
image analysis. Analytical Methods, 9(9), 1499-1511.
Primpke, S., Wirth, M., Lorenz, C., & Gerdts, G. (2018). Reference database design for
the automated analysis of microplastic samples based on Fourier transform infrared
(FTIR) spectroscopy. Analytical and bioanalytical chemistry, 410(21), 5131-5141.
Qiu, Q., Peng, J., Yu, X., Chen, F., Wang, J., & Dong, F. (2015). Occurrence of
microplastics in the coastal marine environment: first observation on sediment of
China. Marine pollution bulletin, 98(1-2), 274-280.
Rochman, C. M., Browne, M. A., Halpern, B. S., Hentschel, B. T., Hoh, E.,
Karapanagioti, H. K., ... & Thompson, R. C. (2013). Policy: Classify plastic waste as
hazardous. Nature, 494(7436), 169
Schymanski, Darena, et al. "Analysis of microplastics in water by micro-Raman
spectroscopy: release of plastic particles from different packaging into mineral
water." Water research129 (2018): 154-162.
Song, Y. K., Hong, S. H., Jang, M., Kang, J. H., Kwon, O. Y., Han, G. M., & Shim, W. J.
(2014). Large accumulation of micro-sized synthetic polymer particles in the sea surface
microlayer. Environmental science & technology, 48(16), 9014-9021.
Song, Y. K., Hong, S. H., Jang, M., Han, G. M., & Shim, W. J. (2015). Occurrence and
distribution of microplastics in the sea surface microlayer in Jinhae Bay, South
Korea. Archives of environmental contamination and toxicology, 69(3), 279-287.
Sruthy, S., & Ramasamy, E. V. (2017). Microplastic pollution in Vembanad Lake,
Kerala, India: The first report of microplastics in lake and estuarine sediments in
India. Environmental pollution, 222, 315-322.
Strand, J., & Tairova, Z. (2016). Microplastic particles in North Sea sediments 2015. and
no.: Scientific Report from DCE–Danish Centre for Environment and Energy, (178).
33
Stolte, A., Forster, S., Gerdts, G., & Schubert, H. (2015). Microplastic concentrations in
beach sediments along the German Baltic coast. Marine pollution bulletin, 99(1-2), 216-
229.
Syakti, A. D., Bouhroum, R., Hidayati, N. V., Koenawan, C. J., Boulkamh, A., Sulistyo,
I., ... & Wong-Wah-Chung, P. (2017). Beach macro-litter monitoring and floating
microplastic in a coastal area of Indonesia. Marine pollution bulletin, 122(1-2), 217-225.
Su, L., Xue, Y., Li, L., Yang, D., Kolandhasamy, P., Li, D., & Shi, H. (2016).
Microplastics in taihu lake, China. Environmental Pollution, 216, 711-719.
Sutton, R., Mason, S. A., Stanek, S. K., Willis-Norton, E., Wren, I. F., & Box, C. (2016).
Microplastic contamination in the San Francisco Bay, California, USA. Marine pollution
bulletin, 109(1), 230-235.
Tagg, A. S., Sapp, M., Harrison, J. P., & Ojeda, J. J. (2015). Identification and
quantification of microplastics in wastewater using focal plane array-based reflectance
micro-FT-IR imaging. Analytical chemistry, 87(12), 6032-6040.
Turner, A., & Holmes, L. A. (2015). Adsorption of trace metals by microplastic pellets in
fresh water. Environmental Chemistry, 12(5), 600-610.
Turner, A., & Holmes, L. (2011). Occurrence, distribution and characteristics of beached
plastic production pellets on the island of Malta (central Mediterranean). Marine
Pollution Bulletin, 62(2), 377-381.
Van Cauwenberghe, L., Vanreusel, A., Mees, J., & Janssen, C. R. (2013). Microplastic
pollution in deep-sea sediments. Environmental Pollution, 182, 495-499.
Vianello, A., Boldrin, A., Guerriero, P., Moschino, V., Rella, R., Sturaro, A., & Da Ros,
L. (2013). Microplastic particles in sediments of Lagoon of Venice, Italy: First
observations on occurrence, spatial patterns and identification. Estuarine, Coastal and
Shelf Science, 130, 54-61.
Vaughan, R., Turner, S. D., & Rose, N. L. (2017). Microplastics in the sediments of a UK
urban lake. Environmental Pollution, 229, 10-18.
Veerasingam, S., Mugilarasan, M., Venkatachalapathy, R., & Vethamony, P. (2016).
Influence of 2015 flood on the distribution and occurrence of microplastic pellets along
the Chennai coast, India. Marine pollution bulletin, 109(1), 196-204.
Veerasingam, S., Saha, M., Suneel, V., Vethamony, P., Rodrigues, A. C., Bhattacharyya,
S., & Naik, B. G. (2016). Characteristics, seasonal distribution and surface degradation
features of microplastic pellets along the Goa coast, India. Chemosphere, 159, 496-505.
34
Vermaire, J. C., Pomeroy, C., Herczegh, S. M., Haggart, O., & Murphy, M. (2017).
Microplastic abundance and distribution in the open water and sediment of the Ottawa
River, Canada, and its tributaries. FACETS, 2(1), 301-314.
Wang, W., Ndungu, A. W., Li, Z., & Wang, J. (2017). Microplastics pollution in inland
freshwaters of China: a case study in urban surface waters of Wuhan, China. Science of
The Total Environment, 575, 1369-1374.
Wang, J., Peng, J., Tan, Z., Gao, Y., Zhan, Z., Chen, Q., & Cai, L. (2017). Microplastics
in the surface sediments from the Beijiang River littoral zone: Composition, abundance,
surface textures and interaction with heavy metals. Chemosphere, 171, 248-258
Wessel, C. C., Lockridge, G. R., Battiste, D., & Cebrian, J. (2016). Abundance and
characteristics of microplastics in beach sediments: Insights into microplastic
accumulation in northern Gulf of Mexico estuaries. Marine pollution bulletin, 109(1),
178-183.
Willis, K. A., Eriksen, R., Wilcox, C., & Hardesty, B. D. (2017). Microplastic
distribution at different sediment depth=s in an urban estuary. Frontiers in Marine
Science, 4, 419.
Woodall, L. C., Sanchez-Vidal, A., Canals, M., Paterson, G. L., Coppock, R., Sleight, V.,
... & Thompson, R. C. (2014). The deep sea is a major sink for microplastic debris. Royal
Society Open Science, 1(4), 140317.
Wright, S. L., & Kelly, F. J. (2017). Plastic and human health: a micro
issue?. Environmental science & technology, 51(12), 6634-6647.
Yang, D., Shi, H., Li, L., Li, J., Jabeen, K., & Kolandhasamy, P. (2015). Microplastic
pollution in table salts from China. Environmental science & technology, 49(22), 13622-
13627.
Yonkos, L. T., Friedel, E. A., Perez-Reyes, A. C., Ghosal, S., & Arthur, C. D. (2014).
Microplastics in four estuarine rivers in the Chesapeake Bay, USA. Environmental
science & technology, 48(24), 14195-14202.
Young, A. M., & Elliott, J. A. (2016). Characterization of microplastic and mesoplastic
debris in sediments from Kamilo Beach and Kahuku Beach, Hawai'i. Marine pollution
bulletin, 113(1-2), 477-482.
Yu, X., Peng, J., Wang, J., Wang, K., & Bao, S. (2016). Occurrence of microplastics in
the beach sand of the Chinese inner sea: the Bohai Sea. Environmental Pollution, 214,
722-730.

35
Zhang, K., Su, J., Xiong, X., Wu, X., Wu, C., & Liu, J. (2016). Microplastic pollution of
lakeshore sediments from remote lakes in Tibet plateau, China. Environmental
pollution, 219, 450-455.
Zhang, K., Xiong, X., Hu, H., Wu, C., Bi, Y., Wu, Y., ... & Liu, J. (2017). Occurrence
and characteristics of microplastic pollution in Xiangxi Bay of Three Gorges Reservoir,
China. Environmental Science & Technology, 51(7), 3794-3801.
Zhang, W., Zhang, S., Wang, J., Wang, Y., Mu, J., Wang, P., ... & Ma, D. (2017).
Microplastic pollution in the surface waters of the Bohai Sea, China. Environmental
Pollution, 231, 541-548.
Zhao, S., Zhu, L., Wang, T., & Li, D. (2014). Suspended microplastics in the surface
water of the Yangtze Estuary System, China: first observations on occurrence,
distribution. Marine pollution bulletin, 86(1), 562-568.
Zhao, S., Zhu, L., & Li, D. (2015). Microplastic in three urban estuaries,
China. Environmental pollution, 206, 597-604.
Ziajahromi, S., Neale, P. A., Rintoul, L., & Leusch, F. D. (2017). Wastewater treatment
plants as a pathway for microplastics: Development of a new approach to sample
wastewater-basedmicroplastics. Water Research, 112, 93-99.
Zobkov, M., & Esiukova, E. (2017). Microplastics in Baltic bottom sediments:
Quantification procedures and first results. Marine pollution bulletin, 114(2), 724-732.
36
APPENDIX A
META-ANALYSIS INVENTORY
37
Particle.
Collection
Size
Min.
Processing
Pore Size
Min.
Particle
Size
Oxidative
Solutions
Density
Separation
I.D. Type Ref
.
0.125 0.125 0.125 30% H2O2
w/Fe(II)
(WPO)
N/A Visual Only
(VO)
1
0.333 0.00022 ND 30% WPO NaCl
(r=undefine
d)
VO 2
0.125 0.125 0.125 30% WPO ND VO 3
0.02 (I)
0.045 (II)
Bulk (III)
0.02 ND N/A N/A Visual &
FTIR
(V&FTIR)
4
0.3 0.3 0.3 N/A N/A V&FTIR 5
Bulk 0.0002 0.15 30% WPO N/A µ-FTIR 6
0.01 0.0002 0.02 35% WPO
(A) NaOH,
HOCl
(37%) (B)
ZnCl (r=1.6
g/cm3) (A)
NaCl
(r=1.14
g/cm3) (B)
V&µ-FTIR 7
Bulk 0.075 ND N/A NaCl
(C=120 g/L)
Other 8
0.333 0.333 0.355 N/A ND Other 9
Bulk 0.0012 0.1 30% WPO
and 40%
HF
N/A VO 10
Bulk (I)
0.333 (II)
0.0012 < 0.5 30% WPO ND V&FTIR 11
Bulk 0.063 ND N/A NaCl
(r=ND)
VO 12
2 0.00075 < 0.05 N/A N/A µ-FTIR 13
0.153 0.063 0.063 WPO NaCl
(r=undefine
d)
VO 14
Bulk 0.0625 ND N/A N/A VO 15
Bulk 0.011 0.598 WPO N/A V&FTIR 16
Bulk (I),
0.08 (II.i)
and 0.33
(II.ii)
0.0016 0.1 (I,
II.i) and
0.5
(II.ii)
N/A N/A VO 17
0.025 0.025 0.025 WPO NaCl
(r=1.49
g/cm3)
V&FTIR 18
Bulk 0.02 0.02 N/A N/A VO 19
38
Bulk 0.035 0.044 N/A NaI (r=1.6
g/cm3)
V&µ-FTIR 20
0.333 0.355 0.355 WPO NaCl
(r=1.62
g/cm3)
VO 21
3 0.001 3 N/A N/A GC-MS&µ-
FTIR
22
< 5 0.05 ND N/A ND FTIR 23
Bulk 0.0007 <1 N/A NaCl
(C=120 g/L)
µ-FTIR 24
Bulk 1 <1 35% WPO NaCl (r=1.2
g/cm3)
V&GC-MS 25
Bulk -ND 0.781 N/A ND µ-Raman 26
Bulk 0.032 < 0.1 N/A (A) NaCl
(r=1.2
g/cm3) (B)
Ludox-TM
40 (r=1.16
g/cm3)
V&FTIR 27
<1
capture
0.00075 0.05 N/A NaCl
(r=2.16
g/cm3)
FTIR 28
Bulk -ND ND N/A NaCl
(r=ND)
µ-FTIR 29
Bulk 0.0016 <0.020 N/A NaCl
(C=1.18
g/L)
V&FTIR 30
Bulk 0.0012 < 0.1 30% WPO ZnCl (r=1.5
g/cm3)
VO 31
Bulk ND < 1 N/A NaCl
(r=ND)
FTIR 32
0.5 ND < 1 N/A N/A VO 33
Bulk ND 2 N/A NaCl (r=1.2
g/cm3)
V&FTIR 34
Bulk 0.25 < 0.25 N/A NaCl (r=1.2
g/cm3)
FTIR 35
2.5 x 3.5 0.001 m 0.05 N/A NaCl
(C=140 g/L)
V&FTIR 36
Bulk ND ~4 N/A N/A V&FTIR 37
Bulk ND 0.4 N/A N/A Other 38
1 ND 1 N/A N/A VO 39
ND ND ND N/A N/A V&FTIR 40
0.333 (A)
0.25 (B)
0.2 (A) -
(B)
0.25
(A&B)
N/A N/A V&FTIR 41

39
0.35 ND >0.3 ND ND V&FTIR 42
<2 0.0012 ND N/A N/A V&FTIR 43
0.001 N/A 0.06 N/A N/A µ-FTIR 44
0.35 0.1 >0.3 N/A N/A VO 45
Bulk 0.001 ND N/A NaCl
(C=140 g/L)
V&µ-FTIR 46
N/A N/A <5 N/A N/A VO 47
Bulk 0.315 0.315 30% WPO NaCl (r=1.6
g/cm3)
FTIR 48
0.01 0.01 0.01 N/A N/A V&µ-
Raman
49
Bulk 0.00045 ND N/A NaCl
(r=9.043
g/cm3)
V&Raman 50
Bulk 0.063 0.63 30% WPO,
H2SO4
NaCl (r=1.2
g/cm3)
V&FTIR 51
N/A N/A ND N/A N/A FTIR 52
Bulk 1 0.1 N/A NaCl (r=1.2
g/cm3 and
1.8 g/cm3)
V&GC-MS 53
Bulk 0.063 >0.063 N/A ND VO 54
Bulk 0.055 ND 30% WPO CaCl2
(r=undefine
d)
VO 55
0.355 N/A 0.41 N/A CalCl2
(r=undefine
d), SrCl2
(r=undefine
d), C2H6O
(r=undefine
d)
VO 56
Bulk N/A <1 N/A NaCl
(C=300 g/L)
V&µ-FTIR 57
Bulk (S)
(W)
0.0007 ND N/A NaCl (r=1.2
g/cm3)
VO 58
Bulk 0.0008 ND 30% WPO NaCl
(C=250 g/L)
VO 59
0.3 (W) 5
+- (S)
0.0016 ND N/A NaCl (r=1.2
g/cm3)
VO 60
Bulk 0.025 >0.063 N/A Sodium
polytungstat
e (SPT)
(r=undefine
d)
Other 61

40
Bulk 0.0012 ND N/A ZnCl2 (r=1.7
g/cm3)f
V&Raman 62
Bulk (S)
0.08 (W)
0.065 (S) ND N/A NaCl
(r=ND)
VO 63
N/A (A)
Bulk (B)
N/A (A)
(B)
<10 (A)
<0.05
(B)
N/A (A)
(B)
N/A (A)
SPT (r=1.5
g/cm3) (B)
V&Raman&
FTIR
64
Bulk (S)
0.333 m
(W, A)
bulk (W,
B)
0.1 m (W,
A) 0.005
(W, B)
0.005 (S)
0.333
(W, A)
0.005
(W, B)
(S)
30% WPO
(W, A) (W,
B) (S)
NaCl
(r=ND)
*C=360
g/L*
V&µ-
FTIR&SEM
-EDS
65
Bulk 0.0012 <0.5 N/A KHCO2
(r=1.5
g/cm3)
V&Raman 66
0.3 0.3 ND Novel
method c
NaCl
(r=1.16
g/cm3)
V&FTIR 67
Bulk 0.063 ND N/A NaCl
(r=ND)
VO 68
Bulk (All) 0.0002
(All)
<0.3 N/A NaCl (r=1.2
g/cm3)
V&FTIR 69
0.25 0.0012 <1.25 N/A N/A V&Raman 70
Bulk 5 0.1 30% WPO NaCl (r=1.3
g/cm3)
µ-Raman 71
Bulk 0.174 ND 30% WPO ZnCl (r=1.6
g/cm3)
VO 72
Individual
extraction
ND ND ND ND V&FTIR 73
Bulk 0.038 0.038 N/A NaCl
(r=ND)
V&FTIR 74
0.3 N/A 0.3 30% WPO NaCl
(C=300 g/L)
V&Raman 75
0.333 0.0007 0.5 N/A N/A V&µ-
Raman
76
Bulk 0.001 ND N/A NaCl
(r=ND)
V&µ-
FTIR&SEM
-EDS
77
Bulk 0.001 0.1 N/A NaCl
(r=1.27
g/cm3)
V&FTIR 78
Bulk 0.25 m 0.25 N/A NaCl (r=1.2
g/cm3)
VO 79

41
Bulk 0.00045 <1 N/A NaCl (r=1.2
g/cm3)
GC-
MS&SEM-
EDS
80
Bulk (S)
0.3 (W)
0.3 >0.3 35% WPO NaCl
(r=ND)
V&GC-
MS&FTIR
81
0.2 N/A 0.3 N/A N/A V&Raman 82
Bulk (A)
0.05 (B)
0.33 (C) 2
(D)
0.00075 ND 34.5%
WPO
N/A V&µ-FTIR 83
0.35 0.3 0.3 N/A N/A V&FTIR 84
2 (A) 0.02
(B) 0.33
(C)
0.00075 0.05 30% WPO
(B) (C)
N/A V&FTIR 85
0.05 0.045 0.05 30% WPO N/A V&FTIR 86
0.3 0.3 0.3 N/A NaCl
(r=ND)
VO 87
0.333 0.0007 0.33 30% WPO NaCl (C=6
mol/L)
V&GC-MS 88
0.33 (A)
0.05 (B)
0.0007 2 (A)
0.05
(B)
20% WPO N/A V&FTIR 89
0.3 ND 0.1 N/A ND V&FTIR 90
0.333 N/A 0.333 N/A N/A VO 91
Bulk 0.02 0.02 30% VIP1h ND VO 92
Core 0.00022 <0.2 N/A N/A V&FTIR 93
0.25 0.0012 <1.25 N/A N/A V&Raman 94
0.33 N/A 0.32 N/A NaCl
(r=ND)
VO 95
Bulk 0.174 0.5 N/A N/A VO 96
Bulk 0.174 0.5 30% WPO ZnCl (r=1.6
g/cm3)
VO 97
Bulk 0.00045 0.01 N/A NaCl (r=1.2
g/cm3) NaI
(r=1.8
g/cm3)
V&FTIR 98
Bulk 0.001 ND 30% WPO NaCl
(r=ND)
µ-FTIR 99
0.112 (W)
0.3 (S)
0.0012
(W) (S)
0.112 N/A KHCO2
(r=1.5
g/cm3)
V&Raman 100
Bulk 0.01 ≤ 0.011 30% WPO ZnCl
(r=1.7-1.8
g/cm3)
V&µ-
FTIR&ATR
-FTIR
101

42
Bulk 0.063 0.25 N/A SPT (r=ND) V&FTIR 102
Bulk 0.002 ≤ 0.1 N/A NaCl (r=1.2
g/cm3) NaI
(r=1.6
g/cm3)
SEM-EDS 103
Bulk 0.5 ND N/A ND VO 104
Bulk ND 0.3 N/A N/A V&FTIR 105
Bulk 0.0012 0.063 30% WPO NaI (r=1.6-
1.8 g/cm3)
VO 106
Bulk 0.0007 ND N/A NaCl
(r=ND)
V&FTIR 107
0.1 (W),
Bulk (S)
0.03 (W),
0.1 (S)
0.1
(W),
<0.005
(S)
30% WPO
(W) (S)
NaCl
(r=undefine
d)
VO 108
Bulk 0.00045 0.06 N/A NaCl (r=1.2
g/cm3) NaI
(r=1.8
g/cm3)
V&FTIR 109
Bulk 0.007 0.51 N/A NaCl
(r=ND)
VO 110
0.3 (W)
Bulk (S)
0.02 £ 0.5 N/A NaCl
(r=ND)
V&FTIR 111
Bulk 0.01 0.02 N/A NaCl
(r=ND)
VO 112
Bulk 0.063 <0.063 N/A NaCl
(r=ND)
Other 113
Bulk 0.063 0.063 N/A NaCl
(r=ND)
VO 114
0.15 0.02 0.1 30% KOH
and NaClO
N/A Other 115
0.1 ND 1 N/A N/A V&FTIR 116
0.333 0.25 0.333 30% WPO N/A V&SEM-
EDS
117
0.01 0.01 ND sodium
dodecylsulf
ate solution
N/A µ-Raman 118
0.315 N/A ND N/A N/A VO 119
0.3 0.0045 0.5 N/A N/A V&FTIR 120
0.5 N/A ND N/A ND VO 121
individual
extraction
1 2 N/A N/A V&FTIR 122
0.333 0.0007 0.24 N/A N/A V&FTIR 123
Bulk 0.47 ND N/A NaCl VO 124
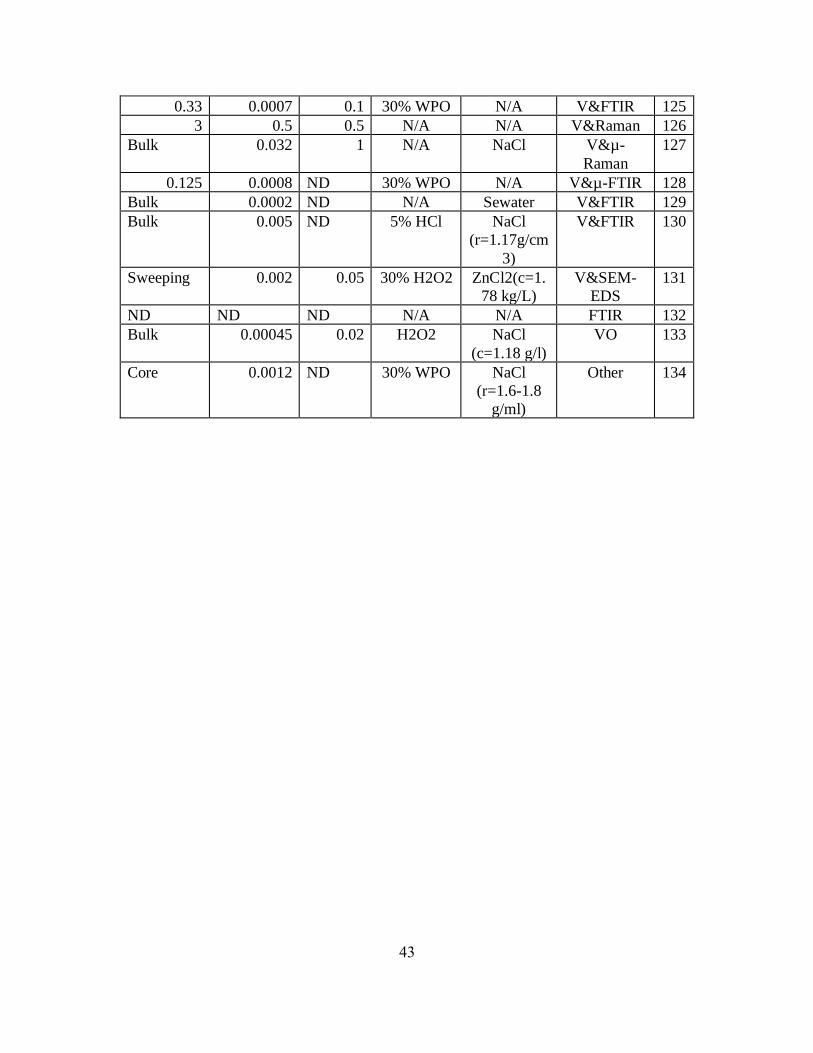
43
0.33 0.0007 0.1 30% WPO N/A V&FTIR 125
3 0.5 0.5 N/A N/A V&Raman 126
Bulk 0.032 1 N/A NaCl V&µ-
Raman
127
0.125 0.0008 ND 30% WPO N/A V&µ-FTIR 128
Bulk 0.0002 ND N/A Sewater V&FTIR 129
Bulk 0.005 ND 5% HCl NaCl
(r=1.17g/cm
3)
V&FTIR 130
Sweeping 0.002 0.05 30% H2O2 ZnCl2(c=1.
78 kg/L)
V&SEM-
EDS
131
ND ND ND N/A N/A FTIR 132
Bulk 0.00045 0.02 H2O2 NaCl
(c=1.18 g/l)
VO 133
Core 0.0012 ND 30% WPO NaCl
(r=1.6-1.8
g/ml)
Other 134
44
APPENDIX B
VISUAL IDENTIFICATION ERROR ESTIMATION

45
Error (%) n=particle
count
Over or
underestimate
Reference
Misidentification <50 micrometer 37.0 637 Overestimate 118
Misidentification 50-100
micrometer
33.0 155 Overestimate 118
Misidentification >100
micrometer
17.0 35 Overestimate 118
Degradation or misidentification 82.5 177 Overestimate 101
Misidentification 20.0 20 Overestimate 19
Misidentification 47.0 32 Overestimate 53
Fragment error SML 38.3 206 Underestimate 131
Fragment error beach 87.2 1192 Underestimate 131
Fiber SML 65.4 13 Overestimate 131
Fiber beach 72.4 29 Overestimate 131
Misidentified as plastic 39.0 674 Overestimate 129
Microplastics identified as ash,
GL21
27.0 57 Overestimate 9
Microplastics identified as ash,
GL20
28.0 1101 Overestimate 9
Microplastics identified as ash,
GL19
11.0 21 Overestimate 9
Microplastics identified as ash,
GL14
31.0 26 Overestimate 9
Microplastics identified as ash,
GL10
18.0 15 Overestimate 9
Microplastics identified as ash,
GL9
25.0 5 Overestimate 9
Microplastics identified as ash,
GL7
4.0 3 Overestimate 9

46
APPENDIX C
DENSITY SEPARATION MISMATCH
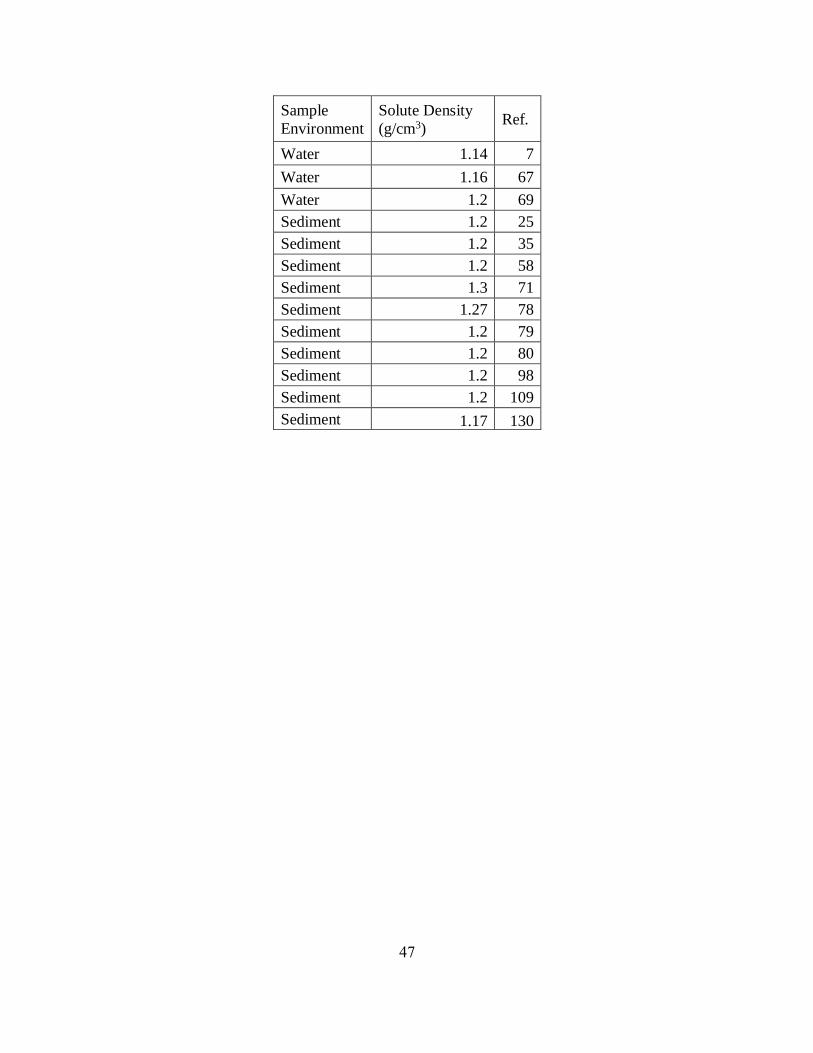
47
Sample
Environment
Solute Density
(g/cm3) Ref.
Water 1.14 7
Water 1.16 67
Water 1.2 69
Sediment 1.2 25
Sediment 1.2 35
Sediment 1.2 58
Sediment 1.3 71
Sediment 1.27 78
Sediment 1.2 79
Sediment 1.2 80
Sediment 1.2 98
Sediment 1.2 109
Sediment 1.17 130

48
APPENDIX D
MATERIAL AND VISUAL CHARACTERIZATION SIZE LIMITATIONS

49
Characterization
Type Instrument
Minimum
Effective Size Limitations
Spectroscopy
ATR-Fourier
Transform Infrared
Spectroscopy (FTIR)
1 mm -
Spectroscopy Raman Spectroscopy 1 mm -
Micro-
Spectroscopy
Microscope attached to
FTIR 15 mm -
Micro-
Spectroscopy
Microscope attached to
Raman 0.5 mm
Pigmentation causes
interference
Spectroscopy-
Microscopy
Scanning Electron
Microscope with
Energy Dispersive X-
ray Spectroscopy
(SEM-EDS)
0.001 mm Possibly destructive
Microscopy Atomic Force
Microscope (AFM) 0.01 mm
Only exterior
interrogation
Microscopy Light Microscope 0.5 mm Only exterior
interrogation
Microscopy Stereo or Dissecting
Microscope 1 mm
Only exterior
interrogation
Spectrometry Pyrolysis GC-MS 0.001 mm
Physically placing
particle with tweezers
Destructive
Top Related