


Languages
Pages
Legal


International Journal of Computer Applications (0975 – 8887)
Volume 121 – No.11, July 2015
26
Merging Balanced Scorecards and Business
Intelligence Techniques: An Applied case on the IT
Subsidiary Company in the Egyptian Civil Aviation
Ayman E.Khedr
Assoc. Prof., Information system department
Helwan University
Cairo, Egypt
Manal A. Abdel-Fattah, PhD Ass. Information Systems
Department Faculty of Computers and
Information Helwan University
Marwa M.Solayman Information system department
Helwan University Cairo, Egypt
ABSTRACT
A very important challenge for organizations is to have an
integrated measurement framework that effectively defines
the performance measures and connect them with the
organizations’ strategies, then to analyze and report the results
efficiently. Here comes the role of the Business Intelligence
(BI) as an essential key factor that presents and translates the
measurement results, for the performance measurement is one
of the BI techniques. This paper focuses on adopting the
Balanced Scorecard (BSC) as a key framework for
performance measurement to manage and measure the
organizations’ businesses. Merging both BI and BSC
approaches gives a very strong roadmap to identify strategic
goals, measures and take the right actions according to the
measurement results. In this paper, the BSC model was
applied along with some BI tools such as dashboards,
analytical charts and performance measures on the IT arm for
the civil aviation in Egypt to define clear connections between
strategic objectives, the business processes by which the
strategies are executed, and the Key Performance Indicators
(KPIs) that measure business performance. Moreover, the
current system was fully evaluated, and suggested corrective
actions were reported to the strategic management, and a
quick look is provided for how the BSC results can be
presented using the BI techniques.
General Terms
BI Tools, SPM, Performance measurement results
interpretation, performance patterns.
Keywords
Business Intelligence; Strategic Performance; Balanced
scorecard; Performance measurement; KPI Dashboards,
Strategic Objectives.
1. INTRODUCTION “How can we best measure the strategic performance by
defining the most indicative performance indicators and
translate strategies into action, applying the BI’s most
appropriate tools in the performance measurement process?”
In short, this is the central question addressed in this paper.
All leading organizations look for new innovative methods
that would increase revenue, improve performance and create
better relationships with their clients. [23] Such results can be
accomplished through using Business intelligence (BI), for it
supports decision making at every level, enables all staff
members to act effectively upon any given situation. BI tools
facilitate defining the appropriate strategies as well as
associating them with the right performance measurement
frameworks.
In performance measurement, using BI tools has become
crucial in order to extract, integrate and report the
organizations’ performance measurements metrics. Thus they
enable decision makers to take corrective actions, adopt new
management initiatives and new strategies. The key BI
approaches are the performance management and dashboard,
and this paper mainly focuses on adopting the Balanced
Scorecard (BSC) as a performance management and
measurement tool that represent data effectively by aligning
BI with the applied BSC model.
Not only does Performance measurement provide a clear
picture of the organization’s progress in accomplishing its
goals. But also it offers a different learning culture among the
entire staff in decision making, and helps realizing
improvement opportunities for the organization, and finally
accelerates the organization’s progress and targets
accomplishments. [16] Performance measurement framework
works in methodical steps; it defines metrics, collects and
analyzes data, then rearranges them to take improvement and
corrective actions. This paper focuses on representing results
with the BI tools, thus, it uses BSC framework to focus on all
perspectives rather than just the financial perspective in order
to achieve balance in performance measurement.
As one of the main components used in Performance
Management, BI is a technology-driven process used to
analyze data to help both corporate staff and end users take
more informed business decisions. With its various tools,
applications and methodologies, BI helps organizations
collect data from internal systems and external sources,
prepare it for analysis, develop and run queries against the
data. As one of the main components used in Performance
Management, BI is a technology-driven process used to
analyze data to help both corporate staff and end users take
more informed business decisions. With its various tools,
applications and methodologies, BI helps organizations
collecting data, preparing its analysis, creating visual demos
and reports to finally receive analytical results that would help
both the organization decision makers and operational staff.
Among the benefits of BI systems is help organizations
identify market trends and recognize problems. Furthermore,
it enhances the decision making capability, enhances internal

International Journal of Computer Applications (0975 – 8887)
Volume 121 – No.11, July 2015
27
processes, optimizes operational efficiency, adds new revenue
sources, and obtains advantages over business competitors.
BI data analysis supports both strategic and tactical decision-
making processes. Initially, BI tools were primarily used by
data analysts and other IT professionals who ran analyses and
produced reports with query results for business users.
Increasingly, however, business executives and workers are
using BI tools, and reports to discover results and re-define
the data inputs.
Additionally, BI technology comprises visualized data tools
that can create charts and graphical data presentations, and
uses tools that can build BI dashboards and performance
scorecards to show business metrics and key performance
indicators data in an easy visual way, and thus, enable
decision makers and strategic management quickly understand
how the performance of the organization’s processes and
operations going through these visual outputs. [11]
Over the past decade, BSC has been increasingly
implemented by more companies as a key framework to
manage their businesses. On top of being an effective
communication tool of key strategies, the BSC provides clear
connection between strategies, the business processes
executed by strategies, and the Key Performance Indicators
(KPIs) that measure business performance. [1]
From a performance management perspective, BSC provides
the baseline for performance measurement, and based on
industry research, many companies that use the BSC are
satisfied with the method and plan to keep on using it.
Therefore, it cannot be denied that it is valuable to be able to
measure performance from financial, customer, operational,
and learning perspectives. [1]
2. RELATION BETWEEN BI AND BSC “If companies align balanced scorecards and business
intelligence they can achieve a performance management
system that delivers superior results.” [1].
As one of the business performance management (BPM)
frameworks, BSC has been adopted by many major
organizations over the past decade. A 1999 Bain & Company
survey regarding management tools adoption showed that
44% of surveyed organizations used BSC with a satisfaction
score of 3.85, with 5 being the highest. Although other
management tools scored higher adoption and satisfaction
rates, BSC will be considered the key BPM framework tool
within organizations in the near future to improve business
results. [1]
Strategic Performance Measurement means to make a
business successful as the budget process. Just as with setting
short-term direction for the company with a budget,
management is responsible for setting long-term strategic
direction and goals for the company. Some instances for
strategic management activities are choosing which markets
does the company target? What are the requirements for the
market competition? Which products or services to be offered
for clients, and why? How to achieve and sustain a
competitive advantage using these products and services?
How to train employees effectively to handle customers’
needs? What are the most critical internal processes that need
improvement to cut cost or increase the service level?
Simply put, using Strategic Performance Measurement keeps
the organization focused on goals and activities that would
make a difference in the near future. Since the lead-lag
relationship among strategic activities is immense, it is critical
to make decisions regarding the organization’s direction that
would lead for its long-term success.
It is even more important to ensure achieving strategic success
drivers, thus, Strategic Performance Measurement sets both
managers and employees to focus on their day-to-day jobs,
since they should be aware of how they play a big role in
strategic activities. [8]
After defining all strategic objectives, KPIs and initiatives,
and connecting them with the target values upon which they
are measured, it is very important to present the measurements
results.
For a better understanding and analysis of business parts and
measurement results, it is tended to use BI techniques to
define BSC parts and represent its results, which eventually
defines the necessary actions to be taken.
To provide business strategies with the correct directions, it is
vital to show the BSC structure in a clear, comprehensible
way. Therefore, BI is used not only to present the BSC
structure, but also the output values using graphical
demonstrations, such as charts, dashboards, strategy maps –
showing cascading relations among objectives. These output
values are stored in a knowledgebase, and data mining
techniques can be used for future analysis. BSC data –
connections among perspectives, objectives, KPIs, initiatives
and actions – can be presented through different delivery
channels like Excel formatted KPIs, Mobile and Desktop
applications, and Web based solutions.
Using BI solution as a tool for supporting corporate strategy,
can improve how performance management programs work to
elevate the organization’s value. Businesses that seek BSC
strategy would use BI solutions for trend analysis, predictive
analysis, customer data integration, scorecards and
dashboards, and data mining. Studies have proven that it is the
most successful performance management methodology to
present a measure and follow using BSC and strategy maps,
then select metrics based on strategic objectives set, and then
finally deploy BS solutions to collect the necessary data for
performance optimization.
The obstacle facing many organizations is that they operate in
reverse. They use the easily collected information to
determine how to manage their business and strategies.
Rather, what these organizations should do is deciding what
are their strategies and then align the available information to
support these strategies. [4]
The BI BSC is designed in a manner that makes results easy
to understand and use. What makes it unique is its ability to
assess how the BI system of an organization competes with
the best in the field. It allows creating IT standards, defines
what type of data is needed for the business, and evaluates the
organization’s BI history.
To make strategic performance results more readable and help
decision makers take consistent trends to achieve their targets,
BI helps providing trend analysis, predictive analytics,
integrated customer views, scorecards and dashboards.
As seen below in Table 1, an illustrated comparison between
the BSC and BI as management tools.

International Journal of Computer Applications (0975 – 8887)
Volume 121 – No.11, July 2015
28
Table 1. Comparison of Balanced Scorecard and Business Intelligence as Management Tools
Source: [1]
Points of Comparison Balanced Scorecard Business Intelligence (BI)
Vintage and
Central Objectives
Circa 1996. Communicate business strategies and
align organization. Manage strategy execution.
Measure organizational performance. Align goals,
compensation, skills, resources, budgets, and plans.
Circa 1994. Leverage business information,
analytical tools, and decision support techniques
to enhance core business processes that improve
business performance and profits.
Organizational Scope
Mainly enterprise, with cascading performance
measures to SBUs, divisions, departments, and so
forth. Can be applied at SBU and lower levels
independently of whether or not there is a higher-level.
Enterprise, SBU, division, function, departments,
and so forth. Can be – and often is - applied at
any of these organizational levels independently,
though that may not be ideal.
Customer Focus Mainly internal for all levels of executives, managers,
and analysts.
Mainly internal for all levels of executives,
managers, and analysts. Can also be used to boost
product and/or service offerings to external
customers.
Key Management
Linkages
Links business strategies to key business processes
and initiatives that drive strategy execution and
business performance. Links strategies to goals,
compensation, skill development, resources, budgets,
and plans.
Links business strategies, core business processes
and initiatives, and business information,
analytical tools, and decision support techniques
that can be used to improve those core business
processes and achieve strategic goals.
Information Strategy
and Focus
Primarily ad hoc, manual reporting of performance
measures from financial, customer, operational, and
learning perspectives. Some multi-dimensional
analysis using BI tools, often using stove-piped
approach to data acquisition
Integrate multi-dimensional business information
to support use of wide range of automated
analytical tools and decision support techniques
to improve the efficiency of core business
processes that drive business results.
Performance
Management Focus
Measure performance of strategically important
business processes and take action to improve as
required. Use performance measures to guide strategic
investments and plans.
Use well-managed enterprise business
information, automated analytical tools, and
modern decision support techniques to manage
and enhance core business processes that control
overall business performance and profitability.
As illustrated in the above table, there are common focus
points between BSC and BI. While the BSC is crucial to
measure and present the strategy, the BI, on the other hand, is
necessary to interpret the measurement results.
Although BSC deals with business performance, but BI
mainly generates data-driven insights on business
performance. Even though both BI and BSC work in the same
field, yet there is very little information on integrating one of
them into the other. Generally, BI is represented by set of
process steps, they are as follows:
1. Collecting data.
2. Using analysis tools to process the data.
3. Making decisions based on data insights.
Next, collected data should be properly converted into a data
source for the KPIs of the BSC. Consequently, BI data
insights might be used for action plans aligned to the BSC
KPIs. Normally BI is what helps to generate actionable KPIs.
2.1 Integration between classical BI and
classical BSC BSC and BI interconnection can be summarized as follows:
BSC focuses BI data collection and analytic on what matters by providing strategic objectives.
BI feeds KPIs of Balanced Scorecard with insightful data.
BI can be a source for action plans aligned with strategic goals and KPIs.
BSC-BI integration is recommended when there is a base
for a solid business-centric BI architecture.
BSC is used in the BI architectures as a valuable ad-on to
explore more business opportunities since BSC’s focus is
to collect the data that matters and categorize it according to its connections.
As presented in figure 1, there is a common set of correlation
between BI and BSC, BSC is providing the necessary
basement represented in the data collection, strategic
objectives alignment, and KPIs as this alignment will be
translated and interpreted by the BI tools in performance
measurement output and action plans.
Presenting Strategies and measuring the performance using
the BI is an essential part in the performance output
translation; in order to use the BI in an efficient presentation
and consolidation of the performance measurement; major
steps are followed in order to prepare for the performance
measurement presentation by BI , this involves data
collection, data consolidation and internal and external
reporting.

International Journal of Computer Applications (0975 – 8887)
Volume 121 – No.11, July 2015
29
Fig 1: Integrating BSC with Business Intelligence [17]
The first step to understand BI is to understand the BSC as a
performance management methodology. BSC is a
performance management tool, while BI is a tool that
examines strategy and manages performance as well. [9] The
reason why for involving performance management is
because BI provides the data that helps organizations create
plans to improve / update their processes, and finally achieve
the required results.
The main target is to create a detailed vision for defining the
organization’s strategic goals and objectives, and setting
measures for these objectives. This paper focuses on the BSC
as an applied BI tool and a measurement framework to help
an organization associate its vision to its strategies in order to
achieve current goals and enhance its plans according to the
performance measurement results. This is achieved through
creating strategic objectives, key performance indicators,
management initiatives and actions to lead the business
performance measurement.
Further target is to automate BSC reports using new defined
techniques and BI dashboards to deliver a full performance
analysis, integrated customer views and dashboards. Also, to
create a consistent framework to monitor the organization’s
performance trends and define the most appropriate required
actions. [2]
A final important target is to represent strategic performance
results. Thus, it is an essential part in this paper to adopt BI in
representing these results, since BI systems are known to be
responsible for transforming data into information, and they
create a healthier environment in organizations for effective
decision making as well as strategic thinking. [10]
3. CASE STUDY SETUP Here is the chronological order for adopting the BSC
framework setup. After a short preface to the study design and
methods, a general discussion of the synopsis case of the
performance measurement process, which is applied on the
civil aviation IT arm, is described, with throwing lights on the
intended impact of applying the BI-based performance
indicators The Description of the Civil Aviation, case unit:
Civil Aviation IT Company, this section is about the BSC
implementation steps on one of the Egyptian Civil Aviation
companies, which represents the technology arm for the
Egyptian ministry of civil aviation. The reasons for selecting
this company as the candidate enterprise for applying the
strategic performance evaluation will be presented in details.
Also, the steps followed to implement the BSC will be
detailed.
3.1 The design and methods of data
gathering Simply, a research design is the framework for a study, as it
gives the wide guidelines to walk one through in data
collection and analysis. Depending on the research nature,
many research design frameworks can be found. For example,
descriptive research designs are used to determine the
relationship among the variables, while exploratory research
is used to understand the challenging problem in the research,
provide insights into it, and form specific hypotheses. [21]
Both exploratory and descriptive research contribute to theory
development, however, seeking such development is
definitely present in causal research. (Saunders et al., 2000)
Nevertheless, the theoretical development in the multiple
constituency approach is considered imprecise in making this
study part of a testing research, and therefore, the basic form
of this research study is both descriptive and explanatory.
In this paper, a mixed method approach has been adopted
where both techniques – exploratory and descriptive - are
used. Known as the ‘triangular’ research design, it improves
the data quality, and thus, the precision of the findings,
leading to a better understanding or questions that can be
answered in later researches. [21]

International Journal of Computer Applications (0975 – 8887)
Volume 121 – No.11, July 2015
30
3.1.1 Data gathering methods Data collection methods are generally based on the research
design, research questions, and other different issues. Owing
to specific technical and practical problems in each of these
methods, the survey and empirical evidence for this part of
study is collected at different organizational levels and
through various methods, such as semi-structured personal
interviews (face-to-face interviews with a well-prepared
questionnaire, reviews of presentations, process
documentations, and direct observations).
Using the triangular technique enables researchers to see the
issue under study from several perspectives and also allows
validating both existing and emerging concepts. (Khedr,
2008) For a six-month field visit in 2014, the researchers
interviewed the heads of departments, QA manager, project
managers, operations managers and department members. The
visit was to observe the adoption processes and interaction
effects among the context elements of uncertainty factors. The
triangular interview was able to observe behavior / processes
steps through the constant access to corporate documentation.
3.2 Case Overview Civil aviation in Egypt is a very important sector where large
sets of knowledge, operations, processes and data are being
executed, and the focus of applying strategic performance
measurement was one of the major subsidiaries in the civil
aviation sector. The company under focus was the IT arm of
the civil aviation. Being a study subject, the subsidiary
company was a target to start applying a full assessment for
its vision, mission, processes, performance measurements and
management initiatives procedures.
Sequential steps were followed to implement the strategic
performance measurement using the BSC and its applied case
study. The first step of applying a BI-BSC framework was to
draw the management attention to the importance of having a
consistent framework that aligns the strategic goals and
objectives with the performance management in order to best
achieve the intended targets and spot the strength and
weakness points. Thus, presentation sessions were held to
strategic management and board members to have a mature
understanding level and a majority agreement for the
emerging need to apply a strategic performance measurement
system in the civil aviation, taking the information technology
subsidiary company as a starting point from which a success
story will result in applying the performance measurement on
all the Civil Aviation companies.
The Motivation of using BSC as a performance measurement
framework was communicated to the top management in the
Civil Aviation was focusing on specific points:
From a performance management perspective, the BSC
provides the baseline for performance measurement, and
according to industry research, many companies are satisfied
with their BSC method and plan to continue its use.
Therefore, it cannot be denied that the way of measuring
performance from financial, customers, operational, and
learning perspectives is valuable.
The BSC is a strategy performance management tool - a semi-
standard structured report, supported by design methods and
automation tools that can managers can use to track and
monitor their staff’s activities accomplishments.
In the 2010 Annual survey of management tools by Bain &
Company, it was reported that BSC, probably the best known
of several frameworks, was the most used performance
management framework. It was originated in the early 1990s.
Later on, the BSC has evolved to become an effective strategy
execution framework.
Seeing it as a critical foundation in a holistic strategy
execution process, the BSC helps organizations formulate
strategy and turn it into actionable terms. Moreover, it
provides a road map for executing this strategy to continually
align it with all the organization’s staff. The BSC helps
leaders to move from reactive decision mode to proactive
mode.
Given that the main value of BSC is the balance itself, the
BSC does not focus on one performance area; it allows
business managers to view all perspectives of a business
rather than just the financial measures. BSC draws attention to
customers, employees, internal processes and the growth and
potential strengths for the organization.
A good BSC framework provides an insight vision for how
the organization should handle its processes and get results.
To sum up, the BSC can be seen as:
A multi focused framework,
A goals achievement measurement tool,
A motivation and rewarding system,
An intellectual capital performance tool,
A benchmarking tool,
A linking tool connecting business processes and
objectives with strategic perspectives and objective. Onset meetings were held with the top management to give
them an initial view about the impact of applying the
performance management/measurement system on the Civil
Aviation companies. Generally, the proposed model discussed
with the Civil Aviation management was promoted to focus
on:
1. Measuring organizational, business unit or departments success, thus, balancing both long and short term actions.
2. Identifying the diverse measures of success from
different business perspectives that are: financial,
customers, internal operations, human resource systems and development, learning and growth perspectives.
3. Using the BSC as the way of connecting the strategic objectives and their related measures to actions.
4. Providing consistent, clear yet accurate reporting for the
performance measurement results to the top management that aims to help them in the decision making.
One of the main questions that were asked was: Why we
should adapt the BSC model? So, the purpose of using the
BSC was discussed. Hence, the following points are to sum up
what the proposed Civil Aviation IT company strategic
performance model aims to:
1. Defining the Civil Aviation business processes and activities.
2. Providing simple, accurate and consistent definitions of Civil Aviation vision, mission, values, and goals.
3. Identifying the key strategic objectives all over the Civil
Aviation as an organization and the main objectives and targets for each department.
4. Building a consistent well defined strategy map for the
strategic objectives with clear cause and effect relations
between them, and communicating the strategy map to
the top management to take their initiatives regarding the defined strategic objectives and their relations.

International Journal of Computer Applications (0975 – 8887)
Volume 121 – No.11, July 2015
31
5. Identifying the measurements or the KPIs that are
considered the basic elements to define the targets to be
achieved, the performance current status, and the actions
and management initiatives required from the
management in order to achieve the strategic objectives
In order to have a consistent view of the current and future
strategy, all the above key elements for the case unit SPM
must be aligned together and well defined. Company’s
mission, vision, values, current status, success stories, long
term strategies, plans and goals were required to be
documented, and then the BSC framework is implemented to
measure the Civil Aviation strategic performance, Figure 2
shows a description of the steps to create a BSC with all its
components mapped together. Each perspective may have one
or more objective, then for each objective there is a set of
identified measures, and the main property that will be a
reference measurement value is target value assigned for each
KPI.
Many current performance measurements system use some
variant of the BSC. An illustration is made for the selected
subsidiary company for the SPM project. The basic BSC
components are defined and appropriately connected before
moving forward in the measurement process. Successful
definition of strategic objectives, KPIs and targets is the key
to have both complete and accurate performance system. The
main objective then from having the main BSC elements
connected together is the key for a successful future planning.
A successful performance measurement system must be able
to identify opportunities and problems rapidly, allocate
resources after stating priorities, track any strategy change,
define responsibilities and reward accomplishments, improve
processes, and promptly generate plan and prediction. [14]
The first step for an appropriate performance measurement is
aligning BSC components and mapping them accurately as
presented in figure 2
Fig 2: BSC Framework [5]
3.3 Case unit The candidate company is a subsidiary of the Egyptian
Holding Company for Airports and Air Navigation
(EHCAAN), affiliated to the Egyptian Ministry of Civil
Aviation.
This subsidiary company has been established since
November 2002 under the Egyptian law 203 for the year 1991
to provide ICT products, services and solutions that are
customized to serve the Civil Aviation in Egypt. Moreover,
the company contributed in major and critical projects for
governmental entities as well as major private companies. It
succeeded to acquire a huge customer base of more than 70
Clients and over 200 contracted projects.

International Journal of Computer Applications (0975 – 8887)
Volume 121 – No.11, July 2015
32
3.4 Motivation and criteria of choosing the
case unit (civil aviation IT Services
Company) Before deciding to use the scorecards and dashboards in or
even enforcing a performance measurement framework, there
are some criteria and elements should be considered when
choosing the organization’s units for which the BSC is
implemented, such elements contribute to the selection of an
appropriate organization unit. [9]
1. Strategy: BSC is a methodology designed to help
transforming the strategy into objectives and measures,
so the most important criterion is whether the unit has a
coherent strategy.
2. Sponsorship: It is vital that the executives sponsor the
performance measurement and BSC concept, they have
to see the need for having a measurement system, if the
leaders are not aligned with the BSC goals and
objectives, and they don’t believe in the BSC metrics and
needs, then the efforts to build it will be severely
compromised.
3. The need for BSC: This must be cleared, and the main
question that identifies this need is that whether the
business unit needs to revamp its performance
measurement system or not. There are seven signs that
can indicate that a new system is needed.
4. Support of key managers and supervisors: It is for sure
that executive support is critically required to implement
a BSC. Yet, while executives may use BSC data to make
strategic decisions, top management will have to use the
tool in their jobs. When the BSC is cascaded to all
management levels, the alignment and focus derived
across the organization can lead to a real performance
development.
5. Organizational Scope: The selected unit should have a
strategy, defined customers, specific processes,
operations and administrations. This wide function focus
enables the BSC to cover all performance aspects, and
thus, affect the overall performance.
6. Data: This includes supporting the measurement culture
in the organization, and enabling all data to be visible
and chosen by the BSC. In addition, new data sources
have to be communicated to the BSC context as well to
be used if they are potential measurement sources.
7. Resources: A measurement system can’t be built by
individuals efforts, the best BSCs are created through
team efforts that are committed to a common
management goal.
The chosen unit should be able to supply resources for the
implementation. In the selected case unit, there is a defined
strategy for the whole organization, although it was needed to
define a new strategy, new objectives and targets for the IT
arm in the Egyptian civil aviation, but at least a strategy is
defined. The support from the executives after cycles of
consistent meetings and discussions additionally focal points
had been addressed to be the change champions for the BSC
implementation.
The organizational scope is wide in the case unit, for in the IT
services company, there are customer base, training
department, marketing department, project management
processes, quality assurance processes and a variety of
functions that are considered a rich environment for applying
the BSC and translating the measurement results in a BI
reporting dashboards.
Fig 3: Signs for the need of performance measurement revamping [9]
Customers don’t buy even when the prices are competitive. The problem may lie in the
benchmarking to the competitors
Performance is acceptable on all dimensions except profit. A focus on quality and other
measures has led to improvements in isolated areas but not in profits
Business unit needs to revamp its performance measurement system: the objectives from
having a performance measurement system are clear and accurately defined
Managers spend significant time debating in the meaning of the measurements; this means
that the measures are not clearly linked to the strategic objectives.
Share price is lethargic despite solid financial performance. No long term value creating
activities.
Performance measures haven’t been changes in a long time. Performance measures should
be dynamic based on the organization’s strategic direction
The corporate strategy is changed recently, since all measures should be linked back to the
strategy, any change in the strategy is reflected on the measurements
International Journal of Computer Applications (0975 – 8887)
Volume 121 – No.11, July 2015
33
Being the Civil Aviation technology arm, this candidate
company has technology core competencies which are lying
in:
Full solution Provider: System Integration, and consultation center.
Reliability: Having a Solid Financial Foundation.
Trustability: A governmental entity under the supervision of the Civil Aviation Ministry.
Profound knowledge in understanding the Aviation Sector’s unique requirements.
A Lead provider of technical support & SLAs.
A Complete services’ portfolio provider
Each one of the above competencies is by itself a motivation
point to start a complete strategic measurement system and
evaluate to which degree these competencies are taken into
consideration in the AVIT strategic objectives, processes,
evaluation systems.
AVIT is a rich environment for applying a performance
measurement framework lead by a BSC and BI dashboards
implementations, the company’s scope of work, the clients
base, the projects base are main factors of choosing it as this
paper’s case unit.
Build, operate and maintain an IT Network Infrastructure in the civil aviation sector.
Standardize and apply core supporting business applications needed mainly for the civil aviation sector.
Provide consulting services for Organization
restructuring process, Operations Control Center, Crisis & Security Center.
3.5 The required input data sets and
resources 1. Proper strategic management points of contacts to
identify the current situation, processes and the overall
objectives to be achieved for Civil Aviation.
2. Reliable references to describe the main key processes and activities involved in Civil Aviation.
3. Main key departments for which the performance must
be identified and that their overall performance affects both current and planned objectives achievement.
4. Full details on the current reporting system, who is
reporting and what is being reported, how are they
identified and structured and whether they are useful.
5. The currently followed performance evaluation system
and measurements for both personnel and organizational performance.
3.6 The output of applying the SPM using
BSC for the implemented case 1. Full assessment for the current organization structure,
strategies, services and projects evaluation and internal processes.
2. Full strategic performance model with all the objectives,
KPIs and strategy map defined.
3. Set of corrective actions, and recommendation for
performance enhancement.
4. Consistent periodical performance report for the top management
5. Predictive and trend analysis for the upcoming plans and strategies
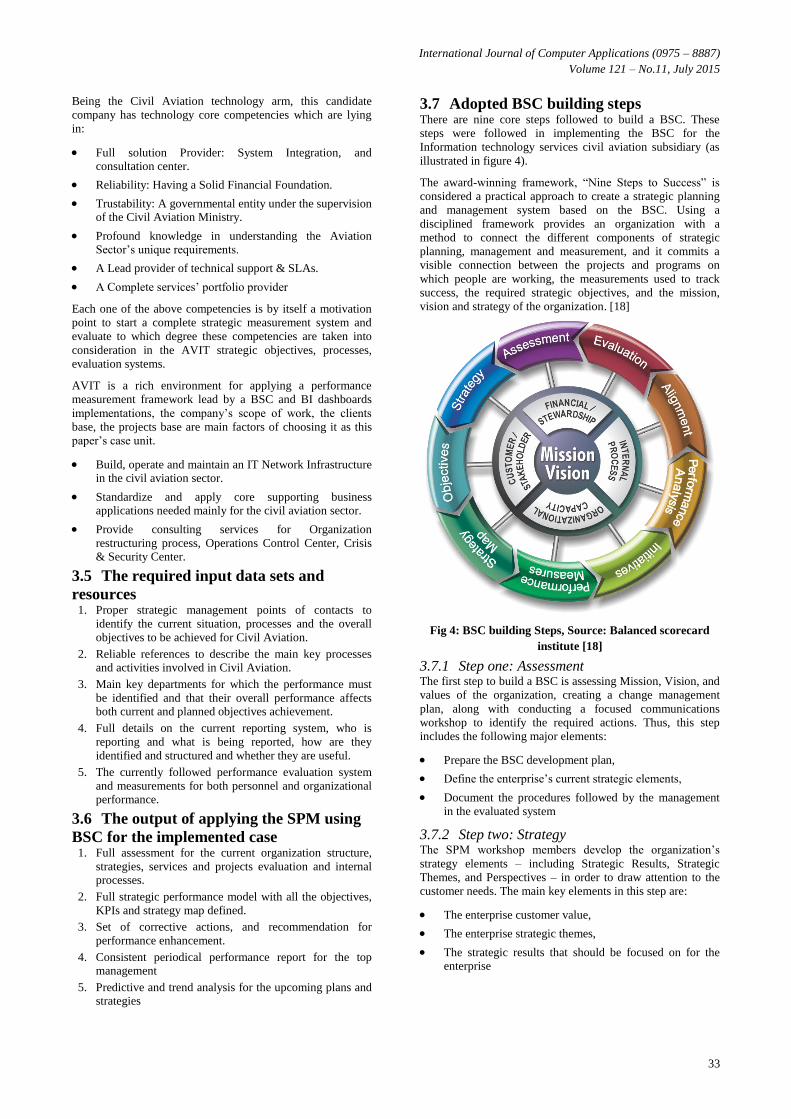
3.7 Adopted BSC building steps There are nine core steps followed to build a BSC. These
steps were followed in implementing the BSC for the
Information technology services civil aviation subsidiary (as
illustrated in figure 4).
The award-winning framework, “Nine Steps to Success” is
considered a practical approach to create a strategic planning
and management system based on the BSC. Using a
disciplined framework provides an organization with a
method to connect the different components of strategic
planning, management and measurement, and it commits a
visible connection between the projects and programs on
which people are working, the measurements used to track
success, the required strategic objectives, and the mission,
vision and strategy of the organization. [18]
Fig 4: BSC building Steps, Source: Balanced scorecard
institute [18]
3.7.1 Step one: Assessment The first step to build a BSC is assessing Mission, Vision, and
values of the organization, creating a change management
plan, along with conducting a focused communications
workshop to identify the required actions. Thus, this step
includes the following major elements:
Prepare the BSC development plan,
Define the enterprise’s current strategic elements,
Document the procedures followed by the management
in the evaluated system
3.7.2 Step two: Strategy The SPM workshop members develop the organization’s
strategy elements – including Strategic Results, Strategic
Themes, and Perspectives – in order to draw attention to the
customer needs. The main key elements in this step are:
The enterprise customer value,
The enterprise strategic themes,
The strategic results that should be focused on for the enterprise
International Journal of Computer Applications (0975 – 8887)
Volume 121 – No.11, July 2015
34
3.7.3 Step three: Objectives After developing the strategic elements to form Strategic
Objectives –the basic building blocks of strategy – they are
categorized based on the Strategic Theme level by
Perspective, then connected in a Strategy Map using cause-
effect connections, and finally formed in a consistent output
for the whole organization.
3.7.4 Step four: Strategy Map (Cause & Effect
Connections) The Cause & Effect connections among strategic objectives
are created. Strategy Map is important as it defines how an
organization creates value for its customers and stakeholders,
and the dependencies between achieving objectives targets on
other objectives in the map.
3.7.5 Step five: Performance Measures Step five is creating Measures for each Strategic Objective
and identifying lead and lag measures, targets and thresholds,
and finally, baseline and benchmarking data are developed.
3.7.6 Step six: Initiatives Step Six is to develop Initiatives that support the Strategic
Objectives. Forming accountability in the organization is
created by assigning ownership of Performance Measures and
Strategic Initiatives to the appropriate staff, and documenting
this in data definition tables.
3.7.7 Step seven: Performance Analysis
(Evaluation Interpretation and Intelligence) The implementation process starts by applying performance
measurement software in order to get everything in its right
place and correct order. Implementing BSC using Automation
helps transform corporate data into information and
knowledge, and offers instant access to real performance data
leading to making better decisions.
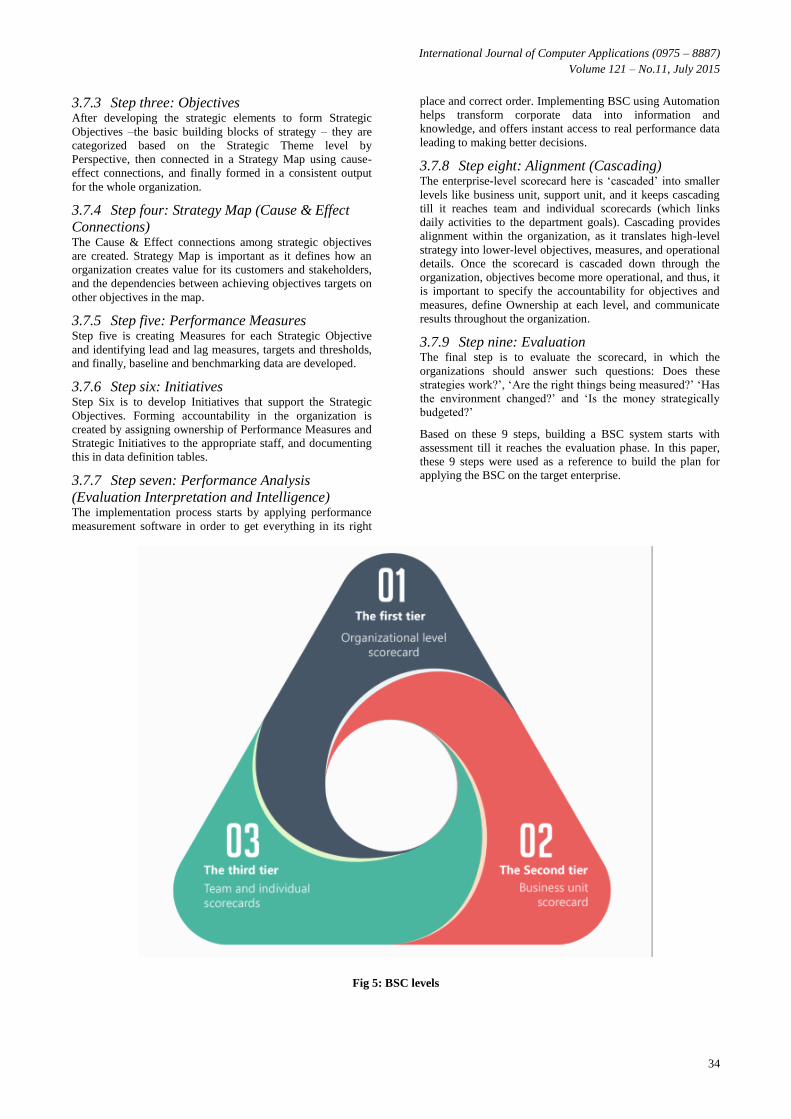
3.7.8 Step eight: Alignment (Cascading) The enterprise-level scorecard here is ‘cascaded’ into smaller
levels like business unit, support unit, and it keeps cascading
till it reaches team and individual scorecards (which links
daily activities to the department goals). Cascading provides
alignment within the organization, as it translates high-level
strategy into lower-level objectives, measures, and operational
details. Once the scorecard is cascaded down through the
organization, objectives become more operational, and thus, it
is important to specify the accountability for objectives and
measures, define Ownership at each level, and communicate
results throughout the organization.
3.7.9 Step nine: Evaluation The final step is to evaluate the scorecard, in which the
organizations should answer such questions: Does these
strategies work?’, ‘Are the right things being measured?’ ‘Has
the environment changed?’ and ‘Is the money strategically
budgeted?’
Based on these 9 steps, building a BSC system starts with
assessment till it reaches the evaluation phase. In this paper,
these 9 steps were used as a reference to build the plan for
applying the BSC on the target enterprise.
Fig 5: BSC levels

International Journal of Computer Applications (0975 – 8887)
Volume 121 – No.11, July 2015
35
4. BSC PLAN PHASES After the preliminary discussions with the top management, a
full plan for implementing the BS was submitted. The plan
included the stages of implementing the civil aviation
information and technology enterprise performance
measurement system using BSC measurement tool.
The plan lists all the followed phases and activities to achieve
actual results that will help in the decision making, bearing in
mind the results presentation and the output dashboards that
represent the objectives achievements percentages, and thus,
allow taking new initiatives by the strategic management after
evaluating the current performance for the enterprise. The
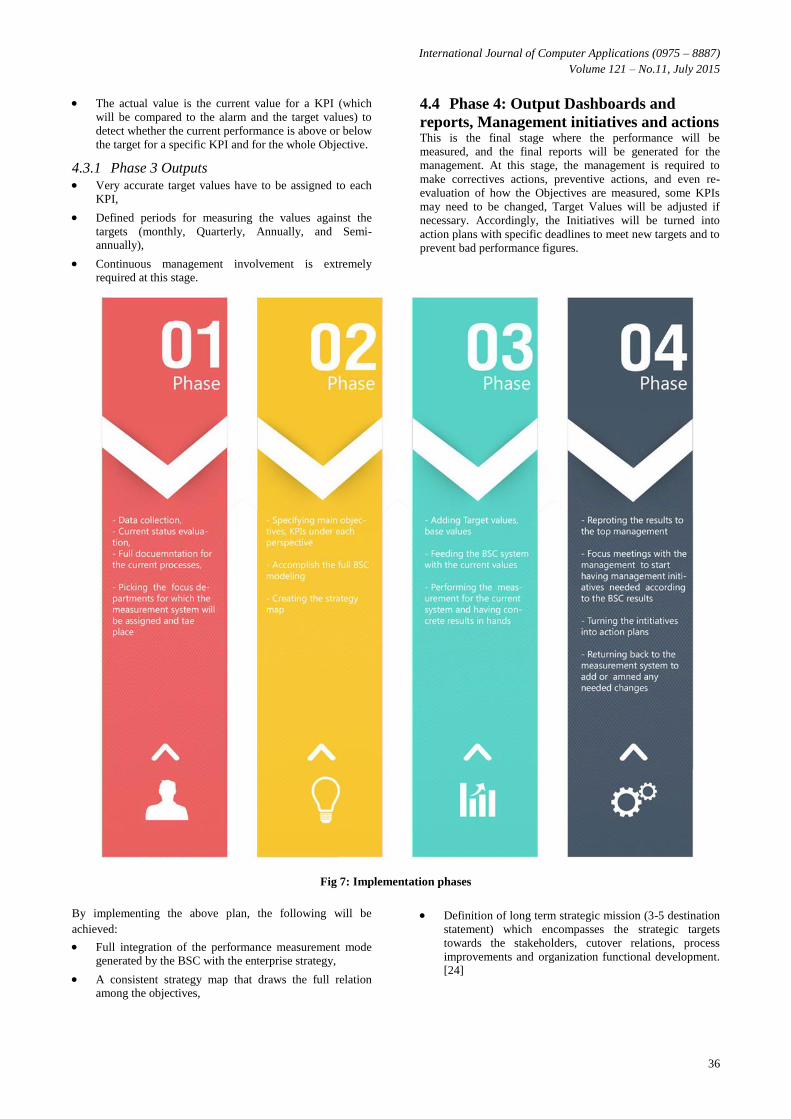
suggested plan consists of four main stages as illustrated in
figure 7.
4.1 Phase 1: Current system data collection
and documentation In this phase, a there will be tracking to all the selected
departments processes and workflows in order to document
what’s in hands right now. This includes, but is not limited to:
1. List the vision, mission, goals, values, who we are statements, .etc.
2. Organization structure (departments, and their relations and work flows).
3. List of all inputs, deliverables and needed output for each department.
4. Document success stories, best practices, and most
effective corrective actions.
5. Evaluate the current system (to specify the weaknesses
and current constraints).
6. Specify the main departments to implement the strategic performance measurement and management system
In order to make the measurement process efficient, there are
sets of supporting activities that will take place, for example:
Distributing a survey among the departments’ employees
to learn how well do the employees adapt to the strategy
and how can they be incorporated into the measurement
system.
Documenting action items for the evaluation
measurements on a frequent basis in order to have an
effective and accurate BSC measurement system.
Including the relevant stakeholders in all steps over and
over in order to have their hands in while documenting the system.
Documenting strength and weakness points continuously.
4.1.1 Phase 1Outputs Understanding and documenting full Processes,
Defining the Strategic objectives to be measured by the current and the suggested KPIs,
Collecting all available KPIs,
Defining the connections among the objectives,
Aligning the objectives to the perspectives,
Aligning KPIs to the strategic objectives,
Preparing survey to measure the strategic alignment and
performance results interpretations by top and mid management.
4.2 Phase 2: BSC Modeling After collecting all required data and specifying the main
departments, stakeholders, strengths and weaknesses, an
interpretation of all the gathered data into the BSC model will
be started at this stage.
Here, the exact Objectives under each perspective will be
specified, and for each objective all the related key
performance indicators will be assigned as well. This phase
will include the following in order:
1. Define and list the four Perspectives for AVIT (in order
to accurately link the related objectives that serve each perspective).
2. Define the strategic objectives under each perspective.
3. Define the measurement (Key Performance Indicators) for measuring the performance of each Objective.
4. Define the initial management initiatives and actions
needed at the current stage.
Key Performance Indicators (KPI), also known Key Success
Indicators (KSI), helps organizations define and measure
progress and ability to achieve their goals. KPIs are countable
measurements that depend on the nature and requirements of
the business. [15]
KPIs make the complicated nature of organizational
performance easy to understand by using a small number of
key indicators, which is basically the same approach people
use in their daily lives. KPIs do the same as what a doctor
does when a patient goes to him. He measures blood pressure,
cholesterol levels, heart rate and your body mass index as
health key indicators.
4.2.1 Phase 2 Outputs Full BSC model with all perspectives, objectives and
KPIs aligned and validated,
Full Strategy map with the cause and effect relations among KPIs.
4.3 Phase 3: Defining and inserting
measurement values For each KPI, the following values should be defined:
Fig 6: KPI properties / values
Defining the alarm and target values is crucial to guarantee an accurate and realistic measurement.
The base value is the initial value or the average value for a specific KPI in the organization.
The benchmark value is the value that the companies are achieving as a standard value.
International Journal of Computer Applications (0975 – 8887)
Volume 121 – No.11, July 2015
36
The actual value is the current value for a KPI (which
will be compared to the alarm and the target values) to
detect whether the current performance is above or below
the target for a specific KPI and for the whole Objective.
4.3.1 Phase 3 Outputs Very accurate target values have to be assigned to each
KPI,
Defined periods for measuring the values against the
targets (monthly, Quarterly, Annually, and Semi-annually),
Continuous management involvement is extremely required at this stage.
4.4 Phase 4: Output Dashboards and
reports, Management initiatives and actions This is the final stage where the performance will be
measured, and the final reports will be generated for the
management. At this stage, the management is required to
make correctives actions, preventive actions, and even re-
evaluation of how the Objectives are measured, some KPIs
may need to be changed, Target Values will be adjusted if
necessary. Accordingly, the Initiatives will be turned into
action plans with specific deadlines to meet new targets and to
prevent bad performance figures.
Fig 7: Implementation phases
By implementing the above plan, the following will be
achieved:
Full integration of the performance measurement mode generated by the BSC with the enterprise strategy,
A consistent strategy map that draws the full relation among the objectives,
Definition of long term strategic mission (3-5 destination
statement) which encompasses the strategic targets
towards the stakeholders, cutover relations, process
improvements and organization functional development. [24]

International Journal of Computer Applications (0975 – 8887)
Volume 121 – No.11, July 2015
37
Phase 1: Data collection and evaluation for the current
status
After conducting the meetings with the strategic management
in the IT arm in the civil aviation, the first step followed was
the full documentation for the current status and its
evaluation. The organization had the following mission and
vision statements:
MISSION “as stated in the organization profile”
"Offer our customers the most innovative and competitive
ICT products, services, and solutions, especially designed to
serve their sophisticated needs and business requirements"
VISION “as stated in the organization profile”
AVIT (Aviation Information Technology) subsidiary has been
established to provide such technological solutions with a
broad wide vision to be: A leading IT Company in the
aviation field, providing High Quality State-of-the-Art
technology to Local, Regional and Global Market.”
The key competencies for the organization:
Full Solution Provider: System Integration, and consultation.
Reliable: having a Solid Financial Foundation.
Trustable: Being a governmental entity under the supervision of the Ministry of Civil Aviation.
Profound knowledge in understanding the Aviation Sector’s unique requirements.
A Leading Provider of technical support & SLAs.
A Complete Services’ portfolio.
The above key competencies will be used in the measurement
system to verify if they are really measured or not, and if they
are measured what are the measurement KPIs, and if they are
best selected and defined to measure the competencies for the
company
5. CASE UNIT STATUS EVALUATION The company profile was very specific, short, and doesn’t
have any clear strategy, strategic objectives, or goals.
After conducting many interviews on the operational and
strategic levels, many problems were clear and could be
defined, such as:
The implemented projects have no references for
customer satisfactions, process flows for the customers feedbacks handling.
There are no performance indicators assigned to strategic
objectives, thus, no corrective actions are assigned to the
performance measurement followed in some departments.
There is no reporting system for the high level managers,
so the performance is not communicated properly to the
management, and accordingly no decisions are taken to enhance the performance.
There is no basis for target settings, the target values are preset and are not changed annually based on the results.
There is no mapping framework assigned to define the
relations among the business processes, performance
measurements, and performance results. Hence, no
causes and effect relations are specified to identify the
root cause for the problems, weakness point in the
system, and/or critical success factors.
Employees are unaware of the organization’s visions or strategic direction.
The project management process is not well defined or
communicated with the other processes, such as maintenance, marketing, and customer support.
There are no preset targets for the individuals
performances, in addition, employees are unaware of the
followed process to evaluate them, which encompasses
the job descriptions definitions, and tasks being assigned to them.
The KPIs reporters are not fully aware of how to measure
the performance, causing incomplete and inaccurate
performance reporting.
Since it was difficult to get the history data of the currently
defined KPIs as well as the suggested KPIs to be used to
enhance the performance in this phase, it was necessary to
specify the relations between the internal processes and
departments. Figure 8 specifies the connectors among the
departments, which leads accordingly to specify the strategy
map that displays all strategic objectives and the cause and effect relations among them.
Figure 8 presents a high level perspective for the interaction
between the processes and the interaction code for each of the
quality models followed in the company. In spite of having
such types of interactions and modeling, no further
documentation was available for a deeper view of the internal
process flow in the organization, and there was a difficulty
getting such details due to its confidentiality.

International Journal of Computer Applications (0975 – 8887)
Volume 121 – No.11, July 2015
38
Fig 8: Example of the output processes
5.1 Performance Measurement current
status Performance measurement all over the organization depended
on some metrics that have the same calculation pattern,
without defined relations or weights for each one, and no
defined plans if they did not achieve their targets.
Measurements were added and calculated in excel sheets, and
no output charts to show the measurement status. The table
below represents an example of the currently used
performance measurement. It was noticed that the KPIs are
measured on a monthly basis, yet the performance sheets
included the YTD KPIs, which should be the cumulative
value or average values from the 4 quarters. Additionally, no
sheets were available for the quarterly performance values. It
was also observed that some departments have measurement
metric defined (without reference or basis of how they were
chosen) and some departments did not have any reference
measurements metrics or KPIs.
5.2 Perspectives-Objectives mapping As a very important part of phase 1, it is necessary to define
the best fit strategic objective that will be considered the road
map for the company’s strategy, performance management,
and defined relationships between relevant performance
drivers.
The following objectives were suggested to the management,
after looking at the same ones in the best IT arms companies
in the civil aviation sector, the basic strategic objectives could
be defined to be used in the BSC development process and in
the relevant results reporting using the BI techniques. Below
are all objectives assigned to their relevant perspective
Table 2: Defined Objectives for AVIT
Serial # Strategic Objective
AV-01 Ensuring the existence of appropriate operations and procedures needed to perform quality
projects.
AV-02 Improve strategic alignment and awareness and increase accountability.
AV-03 Delivering cost-benefits and revenue based projects.
AV-04 Accommodate consistent marketing materials and pricing policies (adopting effective
marketing activities).
AV-05 Expanding the projects base being developed for the Civil Aviation.
AV-06 Enhancing the quality of the delivered projects.
AV-07 Assessing and identifying recruitment needs for the department and facilitating the required

International Journal of Computer Applications (0975 – 8887)
Volume 121 – No.11, July 2015
39
training.
AV-08 Obtaining fully fledged training plans.
AV-09 Providing ongoing alternative solutions for achieving the AVIT plans.
AV-10 Providing an effective recruitment process.
AV-11 Developing and applying evaluation systems for all levels in AVIT.
AV-12 Enhancing current procedures that affect the overall targets achievements
AV-13 Providing opportunities to achieve a maximum level of competency in technology
AV-14 Creating a framework to evaluate the services provided by AVIT.
AV-15 Facilitating and providing a persistent way for communicating information (information
flow) among AVIT departments.
AV-16 Providing timely accurate information of products and services for all stakeholders.
AV-17 Expanding sales by getting adequate sales procedures and following innovative techniques.
AV-18 Providing optimum maintenance solutions for the internal and external projects.
AV-19 Increasing the customer base for AVIT in 2015 while providing best ways for maintaining the
existent customers.
AV-20 Having long term ideas/levels for AVIT to move forward (on timely basis).
AV-21
Increasing the contribution to and advice on the development, revision and amendments
related to air traffic control and all sister companies’ activities in order to ensure adherence to
international standards.
AV-22 Increasing Customer engagement and satisfaction.
Aligning the defined objectives to the relevant perspectives
What comes after defining the strategic objectives is aligning
each one to its relevant. At this stage, it is necessary that each
perspective is well defined and set by its measuring
objectives. Then comes another validation dimension, which
is finding if the balance is achieved, if any perspective isn’t
mapped to a set of objectives, then the objectives setting has
to be reconsidered to add more relevant –balanced- set of
objectives.
Table 3: Objectives-Perspectives Mapping
Perspective Related Objectives
Financial Providing opportunities to achieve a maximum level of competency in technology
Delivering cost-benefits and revenue based projects
Customer Enhancing the quality of the delivered projects.
Providing timely accurate information of products and services for all stakeholders.
Providing optimum maintenance solutions for the internal and external projects.
Developing new business channels with internal and external customers.
Increasing Customer engagement and satisfaction.
Internal
Processes
Ongoing enhancements for the procedures that affect the overall targets achievements.
Providing an effective recruitment process.
Developing and applying evaluation systems for all levels.
Ensuring the existence of appropriate operations and procedures needed to perform quality projects.

International Journal of Computer Applications (0975 – 8887)
Volume 121 – No.11, July 2015
40
Learning and
Growth
(Innovation)
Improve strategic alignment and awareness and increase accountability.
Assessing and identifying recruitment needs for the department and facilitating the required training.
Obtaining fully fledged training plans.
Increasing the contribution to and advice on the development, revision and amendments
related to air traffic control and all sister companies’ activities in order to ensure
adherence to international standards.
Assessing and identifying the department recruitment needs, and facilitating the required training.
Having long term ideas for AVIT to move forward.
5.3 KPIs Mapping At this stage, KPIs used all over the organization were
gathered, translated into measurement formulas, and mapped
to the related objectives. For example, the objective
“Delivering cost-benefits and revenue based projects” was
assigned to the following KPIs:
% Department's Manpower Utilization
% Exceeding set durations (Actual versus Planned) (Implementation Phase)
% of executed preventive maintenance
% Developed Software Engineering Revenue / Costs
For each objective, all related KPIs are assigned, and each
KPI formula is then developed to later calculate the
performance (which will be mainly a ration of two values
P1/P2). The below table represents a snapshot of the data
representation for the KPIs and their relevancy to the
corresponding objectives.
Table 4: Examples of current KPIs
KPI KPI Owning
Department Measured Objective
Actual
P1
Actual
P2
% signed
Contracts,
Letters of
Award,
Purchase Orders
compared to
Offered
Business
Development –
Sales
Expanding the projects base
being developed for the Civil
Aviation
Number of Signed
Contracts, Letters of
Award, Purchase Orders
Number of Offered
Proposals
% Number of
New Contracts
(Y/Y-1)
AVIT General
Expanding the projects base
being developed for the Civil
Aviation
Number of New Contracts
(Y)
Number of Contracts (Y-
1)
% of
Employees
receiving
training (Actual
/ Planned) YTD
Staff Training
Assessing and identifying
recruitment needs for the
department, and facilitating the
required training
Number of Employees
trained YTD
Planned Number of
Employees for training
YTD
% Absenteeism AVIT General
Assessing and identifying
recruitment needs for the
department, and facilitating the
required training
Total Absence Days
(Excluding Vacations)
Head Count Working
Days
% of Customer
letters closed >
Target (by
Department /
Person)
Planning &
Follow Up
Providing optimum maintenance
solutions for the internal and
external projects
Number of Letters closed
late exceeding Target
Total No of Customers
Letters received during
the period
% of Customer
letters closed >
Target (by
Department /
Person)
Procurements
Providing optimum maintenance
solutions for the internal and
external projects
Number of Letters closed
late exceeding Target
Total No of Customers
Letters received during
the period
International Journal of Computer Applications (0975 – 8887)
Volume 121 – No.11, July 2015
41
Revenue /
Employee
(Actual /
Planned)
AVIT General Providing an effective
recruitment process
Revenue / Employee
(Actual)
Revenue / Employee
(Planned)
% Attrition
Rate
"voluntary"
Human
Resources
Providing an effective
recruitment process
Number of Voluntary Head
Count Separated Total Head Count
% discipline
Control
violations
AVIT General Providing an effective
recruitment process
Numbers of discipline
violations Headcount
% Customer
Training Plan
Realization
Training Center
Providing timely accurate
information for products and
services for all stakeholders
Number of realized
Training Courses
Total Planned Training
Courses during the
period
6. CASE STUDY RESULTS &
DISCUSSION
After discussing the case study setup, case unit, and gathering
the necessary data form all stakeholders to build a
performance BI measurement system, this chapter discusses
the processing for this data. The goals of this study are to
build a balanced performance measurement system with BI
techniques to find out the performance gaps, and to detect the
improvements possibilities. Moreover, the researcher will be
monitoring and analyzing the historical values, and comparing
the performance values and predicting the performance trends.
The major focus is to link BSC to BI to maximize the
performance output and data presentations in order to build a
coherent roadmap and achieve more success in the future. The
main output from this study is to have an innovative
performance measurement system which is value based,
focusing on the future by considering improvement
opportunities, and its scope is not only evaluating but also
motivating all organizational levels to be aligned to the
strategic goals and enhance the productivity on all levels.
Thus, the output PMS will encompass and refer to the entire
system of performance indicators, starting with elementary
indicators which are then summarized into intelligent
dashboards. [24]
6.1 General description and analysis The main goal of this study is to build a BI based performance
measurement framework with a target of not only to increase
the organization’s overall performance, but also to predict
what are the coming opportunities and threats, and to take
corrective actions and actual effective management initiatives.
After having the data organized in the BSC context, high
profile analysis for this data should be created in order to get
the proper KPIs values, and additionally to present the
performance status in the most proper way. Accordingly, the
researched evaluated the current KPIs and assessed their
historical values to conclude the results, then a re-evaluation
and validation for the results had to be done.
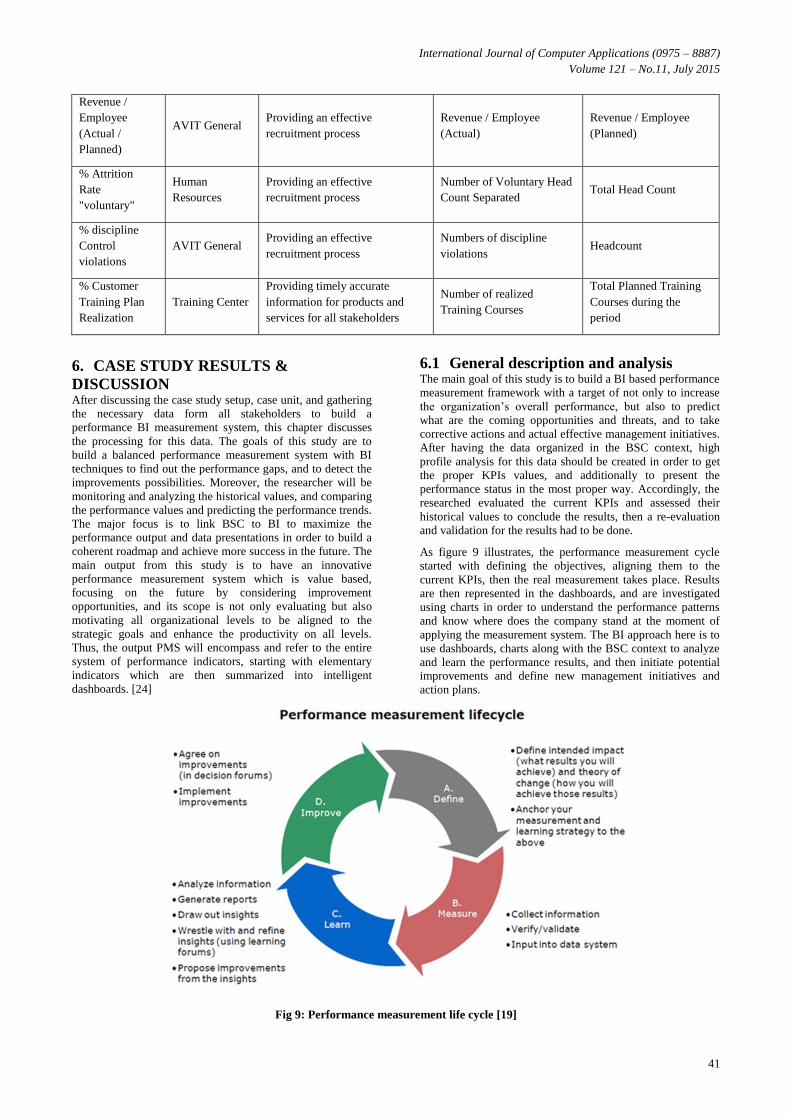
As figure 9 illustrates, the performance measurement cycle
started with defining the objectives, aligning them to the
current KPIs, then the real measurement takes place. Results
are then represented in the dashboards, and are investigated
using charts in order to understand the performance patterns
and know where does the company stand at the moment of
applying the measurement system. The BI approach here is to
use dashboards, charts along with the BSC context to analyze
and learn the performance results, and then initiate potential
improvements and define new management initiatives and
action plans.
Fig 9: Performance measurement life cycle [19]
International Journal of Computer Applications (0975 – 8887)
Volume 121 – No.11, July 2015
42
6.2 Building Strategy Maps “Strategy Maps Capture your Strategy and Set the Agenda”.
[22]
Strategy map is designed mainly to portray the management’s
thoughts, choices and goals. In only a single page, a well-
designed strategy map can demonstrate these thoughts and
choices, and how will the strategy make the changes to reach
these goals. Strategy maps focuses on the little things that will
create the bigger change in an organization.
For the case unit, a key goal of the BSC is to have a supported
measurement framework for the next five years. Thus, a good
implemented BSC would be cascaded to all other units, which
will affect the overall civil aviation performance. To have a
long term built BSC, the organization must define its vision,
strategy map, its “tangible future” with all its strategy, risks,
and decisions to change in the same timeframe. It must
describe through strategy map how to achieve this change.
Consequently, the strategy map frames its BSC to support the
strategy.
Strategy maps describe how organizations create value by
building on strategic themes such as “growth” or
“productivity”. Such themes define what strategies the
organizations will implement at the levels of process,
customer, and learning and growth. A well-built map defines
how an organization plans to reach the goals set for its
customers, using a mixture of connections between the
strategic objectives.
Strategy map-based BSC focuses on how the strategy will
improve and change the organization’s performance. It not
only captures the operational detail as part of the approach,
but also it draws the organization’s attention to the
management and implementation of the strategy. [22]
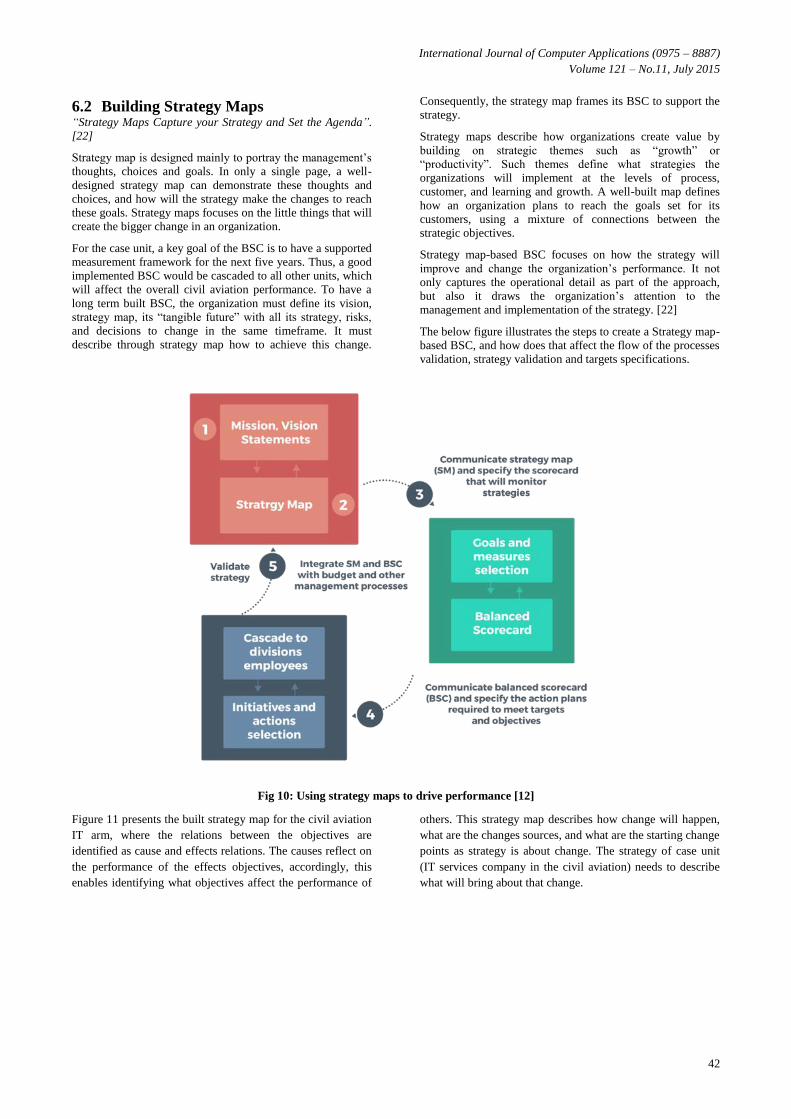
The below figure illustrates the steps to create a Strategy map-
based BSC, and how does that affect the flow of the processes
validation, strategy validation and targets specifications.
Fig 10: Using strategy maps to drive performance [12]
Figure 11 presents the built strategy map for the civil aviation
IT arm, where the relations between the objectives are
identified as cause and effects relations. The causes reflect on
the performance of the effects objectives, accordingly, this
enables identifying what objectives affect the performance of
others. This strategy map describes how change will happen,
what are the changes sources, and what are the starting change
points as strategy is about change. The strategy of case unit
(IT services company in the civil aviation) needs to describe
what will bring about that change.

International Journal of Computer Applications (0975 – 8887)
Volume 121 – No.11, July 2015
43
Fig 11: IT services company Strategy Map
6.3 KPIs Evaluation Spreadsheet is one of the basic BI tools used to study the
behavior of the KPIs defined in the case unit. The main
objective of the KPI evaluation is to:
Ensure that the KPIs are eligible for the specified objectives,
Study the behavior of the KPIs values, and draw their
trends for at least one year to have a clear indicative view for the targets achievements or status,
Have an outlined status for the objectives achievements,
Find and replace the non-fitting KPIs in the performance framework with new more efficiently defined KPIs,
Define new management initiatives and action plans according to the KPIs evaluated performance.
After having all KPIs data gathered, the target values were
plotted after calculating each KPI’s performance according to
a preset formula for the target calculation in each department.
For each KPI, a set of values were gathered from each
department and the properties that were aligned for each KPI
as presented in table 5.
Table 5: Case unit adopted KPI Properties
KPI Data Field Description
Source
Department/Function/ line
of business
The department or business line for which the KPI will be assigned and calculated.
Department Code A unique code by which the department’s data and performance results will be
queried.

International Journal of Computer Applications (0975 – 8887)
Volume 121 – No.11, July 2015
44
'KPI Owning Department The department responsible for achieving the KPIs targets
Actual P1 The number for the left hand number value for the KPI (knowing that the final
performance is calculated as P1/ P2)
Actual P2 The number for the right hand number for the evaluation formula (knowing that the
final performance is calculated as P1/ P2)
KPI Type The frequency period where the KPI actual data is gathered and calculated, then
referenced to the target (it is either Monthly, Quarterly, semi Annually or Annually).
KPI Target = T The current needed achieved value, the target value for each KPI.
Actual P1 value The actual collected P1 value for each KPI.
Actual P2 value The actual collected P2 value for each KPI.
Actual Result R= P1/P2 The actual resulted ratio for each KPI.
Achieved Ratio = R/T The Actual achieved ratio (the Actual result / Target)
Achieved Normalized
Ratio (if Type = -ve = 1-
(R/T))
The ratio if the KPI’s polarity is negative, which means that the more the actual
value gets low, the more it gets closer to the target for example the %
Each KPI has four values that were collected in the period of
full year, which is 2013. Therefore, the evaluation would take
a full year, which is the least time period that can be taken as
an evaluation period.
6.3.1 KPI evaluation patterns For all departments, there were around 150 KPIs. Although
this was a large number of KPIs, but many of them were
following the same trend, for the evaluation to be accurate and
to the point a set of patterns were assigned to each KPI group.
6.3.1.1 Large gaps between Targets and Actuals In figure 12, the target is too far from the actual results, which
means that the target setting was not efficiently specified or
was not realistic or the performance was very bad. Another
observation is that the value for the complaints is almost
constant, and the same is for the value of the service calls,
which is an indicator that the collected values are not realistic,
thus, corrective actions are correspondingly suggested.
Fig 12: Gaps between Target values and actual values

International Journal of Computer Applications (0975 – 8887)
Volume 121 – No.11, July 2015
45
Suggested corrective actions:
All calls must be tracked and recorded to reach the actual numbers.
A new target must be specified, and a new complaints
criterion must be added (new numbers must be defined
for the actual number of complaints per project).
6.3.1.2 Actual = Target For many KPIs, the actual value is the same as the target
value in quarters. It is not logical to have the target value
equal to the actual all the time although the overall
performance is not really good (according to the management
feedback). In figures 13, 14 and 15 indicate that the actual
values for the four quarters are always equal to the target
value – the line of the actual result is placed over the target
line. This is not always an indicator that the organization is
achieving the targets. Therefore, such KPIs performance value
should be checked and reviewed, since this performance
behavior may be an indicator for an under estimation of the
target values, and a more difficult target value should be set,
or this might indicate that this type of KPIs is not important in
the context of the performance system, and more convenient
KPIs must be defined to achieve a better performance level.
Fig 13: Actual values are the same as target values
Fig 14: Actual values = target values-continued

International Journal of Computer Applications (0975 – 8887)
Volume 121 – No.11, July 2015
46
Fig 15: Actual values = target values-continued
6.3.1.3 Illogical achievement ratios Moreover, some KPIs had illogical achievement ratios. When
all values for the targets, actuals and achievement ratio were
plotted, the chart line representing the achievement ratios over
four quarters was too far from the target and actual values.
This indicates that something is wrong in the target setting. A
very good achievement doesn’t always mean that the
organization is on the right track, hence, some additional
values must be tracked, or the formula for calculating the KPI
must be re-considered, or the KPI itself can be reformulated.
Fig 16: Illogical achievement ratios
6.3.1.4 Inconsistent performance Performance trends should have consistent behavior in order
to be tracked correctly. For example, for a KPI that measures
the staff training plan realization, it is important that the actual
results almost have a consistent trend. When this KPI’s values
were plotted, the actual values were inconsistent as in figure
17. The values are either too low or beyond the targets. So,
the needed management initiatives need to evaluate the
training department performance and give ad-hoc advices and
corrective actions.

International Journal of Computer Applications (0975 – 8887)
Volume 121 – No.11, July 2015
47
Fig 17: Inconsistent performance
7. COMPLETING THE FINAL
FRAMEWORK1
The final framework with the BSC interpretation is presented
along with the output dashboards resulted from the calculation
of the objectives’ KPIs. BSC Dashboards can be designed to
filter out unwanted information to ensure appropriate KPIs are
front of mind and relevant to their intended audience. The
outcome of a Dashboard application is compelling and can be
used to connect to multiple data sources and present the
information in a format that is timely, meaningful and
actionable. Dashboards also allow users to search, drill down
and even update the presented information, as they save time,
help reconstruct workflows, maintain the records accuracy,
and let users focus their actions on the positive outcome of
key metrics. [19]
The goal of this study is to present the performance
measurement using the dashboards in the BI context. In this
section, the main result is presented. In section 4.3 the
spreadsheets chart were used as a BI tool to help study the
KPIs performance behavior and to plot the main values for
each KPI’s main descriptive property. The full BI-BSC output
is presented here using the dashboards and KPIs, objective,
perspectives performance generators. The full BSC
framework is implemented as indicated in figure 18 where the
perspectives are aligned to the related objectives, and then
aligned to the related KPIs as well, and the KPIs performance
was generated. Each one of the generated dashboards for each
KPI, objective and perspective was given the performance
colors, minimum and maximum values, and the actual results
were plotted, the weights for each KPI were assigned equally,
and the same goes for both objectives and perspectives.
1 Final Dashboards for the overall performance measurement
are presented in this section
For each perspective, all objectives are measured. The
following snapshots show generated results for each
perspective at different dates including 4 historical values,
applying BI techniques, and reporting results comes at this
stage. In the previous section, the excel charts were generated
to manipulate and study the performance trends. The resulted
dashboards that were generated from the used software, data
for 4 quarters along with the last quarter in 2014 “for the
financial perspective” were added to the system. The data
representation was in dashboards with tabular formats, and the
results were meaningful diagrams that enabled the decision
makers to have full vision of the business. Figure 19 presents
the final results for the financial perspective that indicated that
performance is in the alarm zone, and corrective actions need
to be taken to open new business channels. As indicated in
figure 20, this perspective data was periodically reported and
evaluated, and in December 2014, the performance was
tracked and enhanced to reach the pre-green zone as a direct
impact of the periodical performance measurement.

International Journal of Computer Applications (0975 – 8887)
Volume 121 – No.11, July 2015
48
Fig 18: BSC Perspectives and Objectives
Fig 19: BSC Perspectives and Objectives
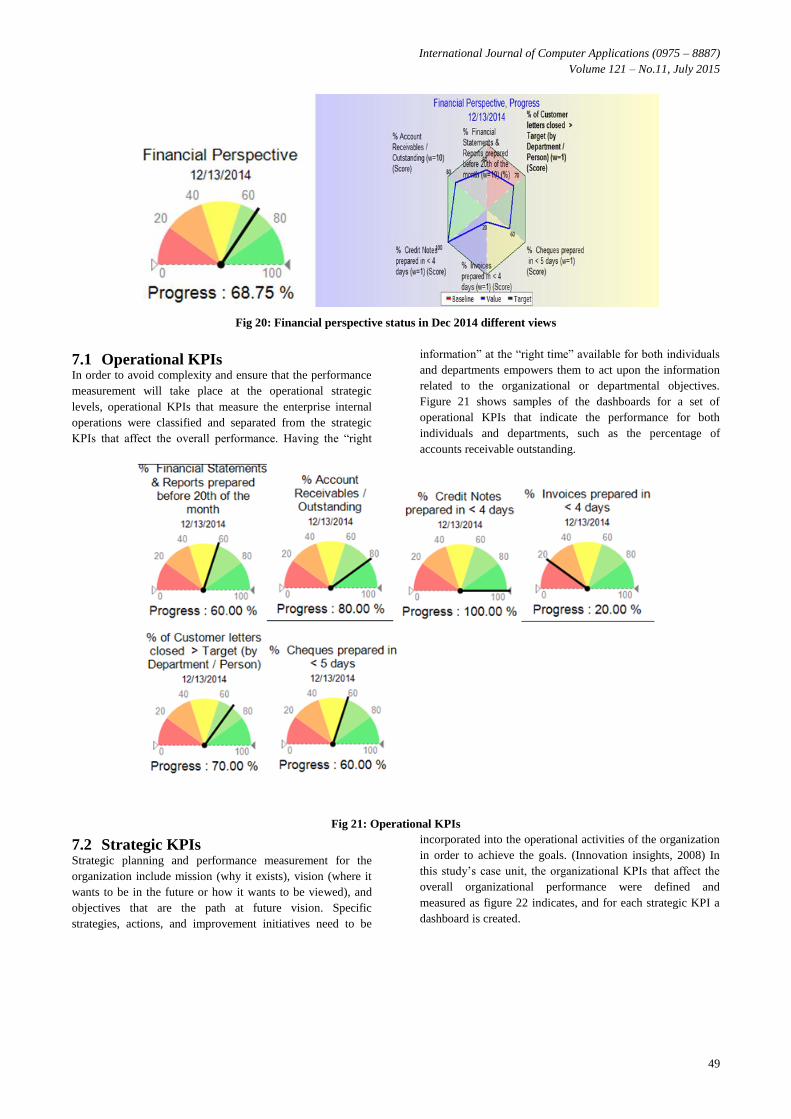
International Journal of Computer Applications (0975 – 8887)
Volume 121 – No.11, July 2015
49
Fig 20: Financial perspective status in Dec 2014 different views
7.1 Operational KPIs In order to avoid complexity and ensure that the performance
measurement will take place at the operational strategic
levels, operational KPIs that measure the enterprise internal
operations were classified and separated from the strategic
KPIs that affect the overall performance. Having the “right
information” at the “right time” available for both individuals
and departments empowers them to act upon the information
related to the organizational or departmental objectives.
Figure 21 shows samples of the dashboards for a set of
operational KPIs that indicate the performance for both
individuals and departments, such as the percentage of
accounts receivable outstanding.
Fig 21: Operational KPIs
7.2 Strategic KPIs Strategic planning and performance measurement for the
organization include mission (why it exists), vision (where it
wants to be in the future or how it wants to be viewed), and
objectives that are the path at future vision. Specific
strategies, actions, and improvement initiatives need to be
incorporated into the operational activities of the organization
in order to achieve the goals. (Innovation insights, 2008) In
this study’s case unit, the organizational KPIs that affect the
overall organizational performance were defined and
measured as figure 22 indicates, and for each strategic KPI a
dashboard is created.
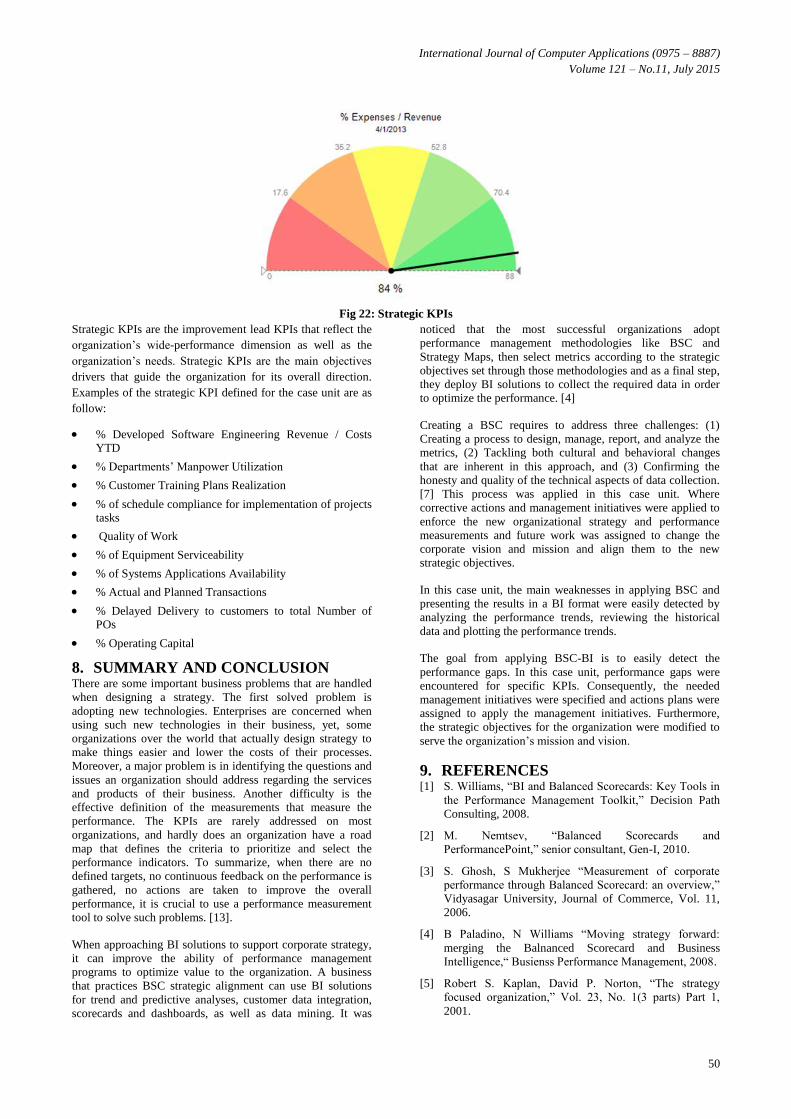
International Journal of Computer Applications (0975 – 8887)
Volume 121 – No.11, July 2015
50
Fig 22: Strategic KPIs
Strategic KPIs are the improvement lead KPIs that reflect the
organization’s wide-performance dimension as well as the
organization’s needs. Strategic KPIs are the main objectives
drivers that guide the organization for its overall direction.
Examples of the strategic KPI defined for the case unit are as
follow:
% Developed Software Engineering Revenue / Costs YTD
% Departments’ Manpower Utilization
% Customer Training Plans Realization
% of schedule compliance for implementation of projects tasks
Quality of Work
% of Equipment Serviceability
% of Systems Applications Availability
% Actual and Planned Transactions
% Delayed Delivery to customers to total Number of POs
% Operating Capital
8. SUMMARY AND CONCLUSION There are some important business problems that are handled
when designing a strategy. The first solved problem is
adopting new technologies. Enterprises are concerned when
using such new technologies in their business, yet, some
organizations over the world that actually design strategy to
make things easier and lower the costs of their processes.
Moreover, a major problem is in identifying the questions and
issues an organization should address regarding the services
and products of their business. Another difficulty is the
effective definition of the measurements that measure the
performance. The KPIs are rarely addressed on most
organizations, and hardly does an organization have a road
map that defines the criteria to prioritize and select the
performance indicators. To summarize, when there are no
defined targets, no continuous feedback on the performance is
gathered, no actions are taken to improve the overall
performance, it is crucial to use a performance measurement
tool to solve such problems. [13].
When approaching BI solutions to support corporate strategy,
it can improve the ability of performance management
programs to optimize value to the organization. A business
that practices BSC strategic alignment can use BI solutions
for trend and predictive analyses, customer data integration,
scorecards and dashboards, as well as data mining. It was
noticed that the most successful organizations adopt
performance management methodologies like BSC and
Strategy Maps, then select metrics according to the strategic
objectives set through those methodologies and as a final step,
they deploy BI solutions to collect the required data in order
to optimize the performance. [4]
Creating a BSC requires to address three challenges: (1)
Creating a process to design, manage, report, and analyze the
metrics, (2) Tackling both cultural and behavioral changes
that are inherent in this approach, and (3) Confirming the
honesty and quality of the technical aspects of data collection.
[7] This process was applied in this case unit. Where
corrective actions and management initiatives were applied to
enforce the new organizational strategy and performance
measurements and future work was assigned to change the
corporate vision and mission and align them to the new
strategic objectives.
In this case unit, the main weaknesses in applying BSC and
presenting the results in a BI format were easily detected by
analyzing the performance trends, reviewing the historical
data and plotting the performance trends.
The goal from applying BSC-BI is to easily detect the
performance gaps. In this case unit, performance gaps were
encountered for specific KPIs. Consequently, the needed
management initiatives were specified and actions plans were
assigned to apply the management initiatives. Furthermore,
the strategic objectives for the organization were modified to
serve the organization’s mission and vision.
9. REFERENCES [1] S. Williams, “BI and Balanced Scorecards: Key Tools in
the Performance Management Toolkit,” Decision Path
Consulting, 2008.
[2] M. Nemtsev, “Balanced Scorecards and
PerformancePoint,” senior consultant, Gen-I, 2010.
[3] S. Ghosh, S Mukherjee “Measurement of corporate
performance through Balanced Scorecard: an overview,”
Vidyasagar University, Journal of Commerce, Vol. 11,
2006.
[4] B Paladino, N Williams “Moving strategy forward:
merging the Balnanced Scorecard and Business
Intelligence,“ Busienss Performance Management, 2008.
[5] Robert S. Kaplan, David P. Norton, “The strategy
focused organization,” Vol. 23, No. 1(3 parts) Part 1,
2001.

International Journal of Computer Applications (0975 – 8887)
Volume 121 – No.11, July 2015
51
[6] Robert S. Kaplan, David P. Norton, “The Balanced
Scorecard – measure the drive performance,” Harvard
business review, 1992.
[7] John M. Kamensky, “Top ten list: key factors that make
a Balanced Scorecard successful,” IBM center for the
business of government, 2005.
[8] B Kali, “Strategic performance measurement,” RK
Business Development LLC, 2003.
[9] Paul R. Niven R l,”Balanced Scorecard step-by-step:
maximizing performance and maintaining results,”
ISBN-10: 0471780499, ISBN-13: 978-0471780496,
Edition: 2, 2006.
[10] C Olszak, E Ziemba, Approach to Building and
Implementing Business Intelligence Systems,
Interdisciplinary Journal of Information, knowledge, and
Management, Volume 2, 2007.
[11] Rouse, Business Intelligence (BI),
searchdatamanagement.techtarget.com, (2014).
[12] Armitage and Scholey, Using Strategy Maps to Drive
Performance, ISBN 15302-193-2, 2006.
[13] Hopf, Litman and others, Guide to a Balanced Scorecard
Performance Management Methodology, Procurement
Executives’ Association, 2002.
[14] Tounsi, application and survey of business intelligence
(bi) tools within the context of military decision making,
Monterey, California. Naval Postgraduate School, 2012.
[15] Chandi, R., "Key Performance Indicators Measuring
Performance in the Oil & Gas EPC Industry", 2009.
[16] Wolk and others, “Building a performance measurement
system- using data to accelerate social impact”, Root
cause Cambrige, 2009.
[17] Savkin, Integrating Balanced Scorecard and Business
Intelligence (BI), bscdesigner.com, 2015
[18] BSC Institute, Building & Implementing a Balanced
Scorecard:
Nine Steps to Success, balancedscorecard.org, 2015.
[19] Queenan and Forti, Measurement as Learning: What
Nonprofit CEOs, Board Members, and Philanthropists
Need to Know to Keep Improving, bridgespan.org, 2011.
[20] Klipfolio, KPI-Dashboard operational metrics top 10
guidelines, klipfolio.com, 2014.
[21] Yin, R., Case study research: design and methods, 5th
ed., Thousand Oaks: Sage Publications, ISBN-10:
1452242569 , 2013
[22] Jones,.P, Strategy Mapping for Learning Organizations,
ISBN: 978-0-566-08811-7, Short ISBN:
9780566088117, 1st ed., 2011
[23] IBM Gartner, “A step-by-step approach to successful
Business Intelligence”, featuring research from Gartner,
2011.
[24] Quagini,L,Tonchia,S, Performance Measurement
Linking Balanced Scorecard to Business Intelligence, 1st
ed., 2010.
IJCATM : www.ijcaonline.org
Top Related