


![Ill] · Ill]](https://static.fdocuments.us/doc/165x107/5f1dea4dfd32f01ae52b75ed/ill-ill.jpg)

![Untitled-1 [] · 2020. 10. 9. · Thi Ill I Il Ill Olli Ill Ill 1 Ill ill Ill Il Ill ill Ill 11 Ill](https://static.fdocuments.us/doc/165x107/60d272307160da1c310a85a5/untitled-1-2020-10-9-thi-ill-i-il-ill-olli-ill-ill-1-ill-ill-ill-il-ill.jpg)
Languages
Pages
Legal

Men and their ill-health
Professor Alan WhiteCentre for Men’s Health
Institute for Health & WellbeingLeeds Beckett University
Centre for Men’s Health
The work of the Centre covers three main areas:
- Gendered health epidemiology
- Men and Health Promotion
- Men’s experiences of illness and diagnosis
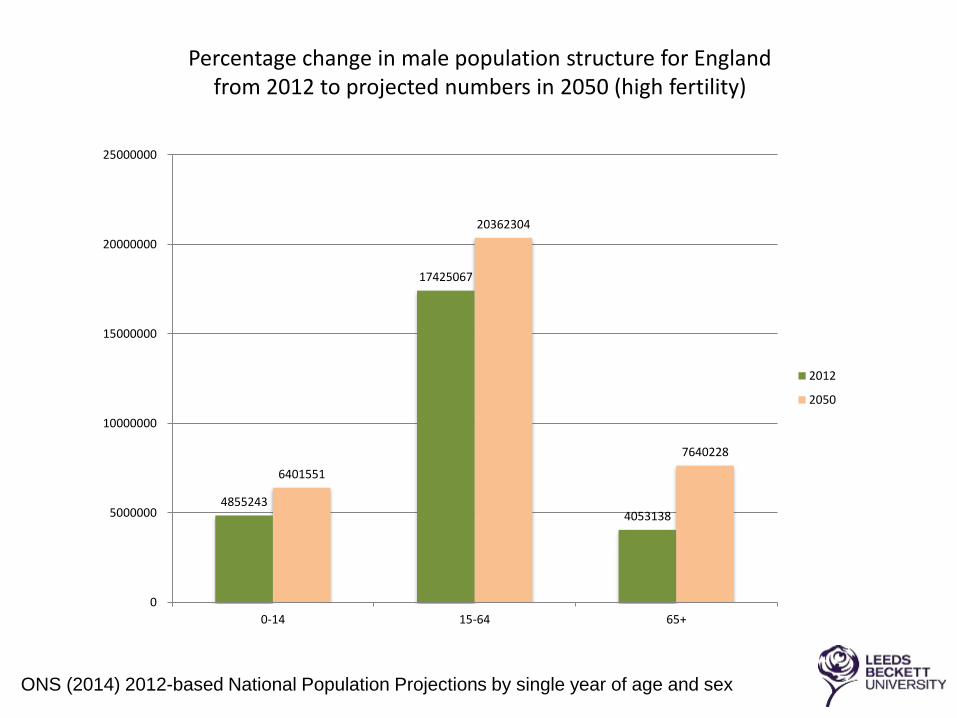
Percentage change in male population structure for Englandfrom 2012 to projected numbers in 2050 (high fertility)
4855243
17425067
4053138
6401551
20362304
7640228
0
5000000
10000000
15000000
20000000
25000000
0-14 15-64 65+
2012
2050
ONS (2014) 2012-based National Population Projections by single year of age and sex

Life expectancy at birth, 1991-93 to 2010-12
73.69 74.02 74.18 74.44 74.61 74.84 75.09 75.38 75.71 76.00 76.22 76.5276.87
77.28 77.60 77.87 78.18 78.5078.91 79.2179.12 79.37 79.44 79.64 79.69 79.84 79.97 80.19 80.42 80.66 80.72 80.90 81.13
81.53 81.78 81.98 82.26 82.5182.89 83.01
68.00
70.00
72.00
74.00
76.00
78.00
80.00
82.00
84.00
Males
Females
ONS(2014) Life expectancy at birth and at age 65, England and Wales, 1991-93 to 2010-12

Life expectancy by social class
73.8
76.077.1
78.379.2
79.980.8 81.4 81.8
82.979.0
80.681.4
82.383.1 83.4
84.1 84.485.0
85.9
66.0
68.0
70.0
72.0
74.0
76.0
78.0
80.0
82.0
84.0
86.0
88.0
1 2 3 4 5 6 7 8 9 10
Life Expectancy
Male Female
Source: ONS, Inequality in Healthy Life Expectancy at Birth by National Deciles of Area Deprivation: England, 2010-12
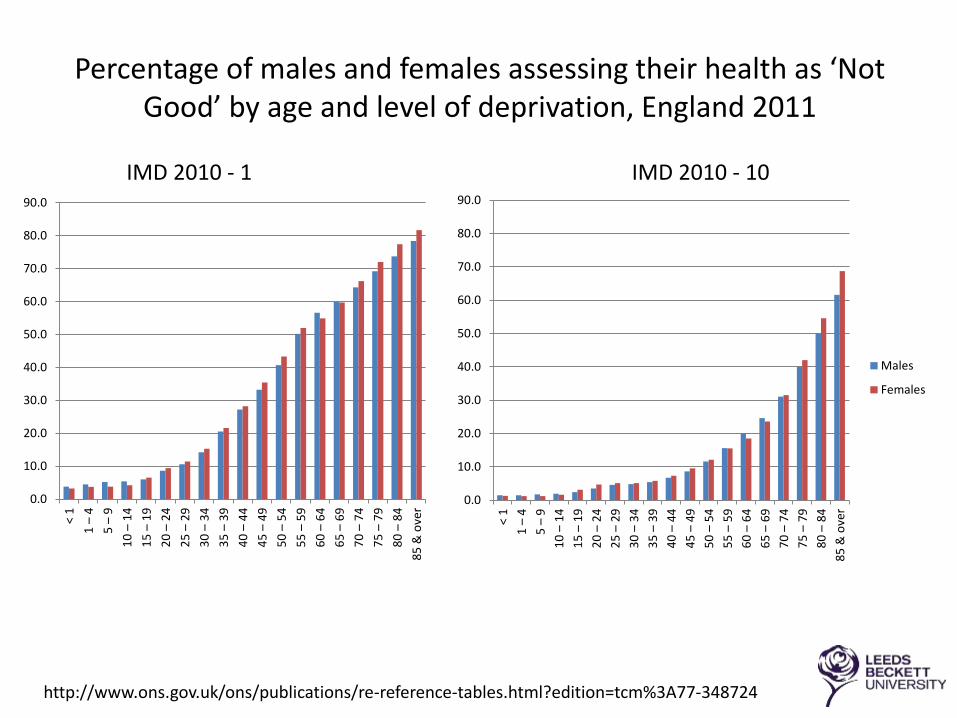
Percentage of males and females assessing their health as ‘Not Good’ by age and level of deprivation, England 2011
0.0
10.0
20.0
30.0
40.0
50.0
60.0
70.0
80.0
90.0
< 1
1 –
4
5 –
9
10
–1
4
15
–1
9
20
–2
4
25
–2
9
30
–3
4
35
–3
9
40
–4
4
45
–4
9
50
–5
4
55
–5
9
60
–6
4
65
–6
9
70
–7
4
75
–7
9
80
–8
4
85
& o
ver
0.0
10.0
20.0
30.0
40.0
50.0
60.0
70.0
80.0
90.0
< 1
1 –
4
5 –
9
10
–1
4
15
–1
9
20
–2
4
25
–2
9
30
–3
4
35
–3
9
40
–4
4
45
–4
9
50
–5
4
55
–5
9
60
–6
4
65
–6
9
70
–7
4
75
–7
9
80
–8
4
85
& o
ver
Males
Females
IMD 2010 - 1 IMD 2010 - 10
http://www.ons.gov.uk/ons/publications/re-reference-tables.html?edition=tcm%3A77-348724

Deaths, all causes, 0 - 64 years, by sex in England and Wales, 2013
ONS (2014) Mortality Statistics: Deaths registered in England and Wales, 2013
0
2,000
4,000
6,000
8,000
10,000
12,000
14,000
16,000
Under 1 14 59 1014 15-19 20-24 25-29 30-34 35-39 40-44 45-49 50-54 55-59 60-64
Male
Female
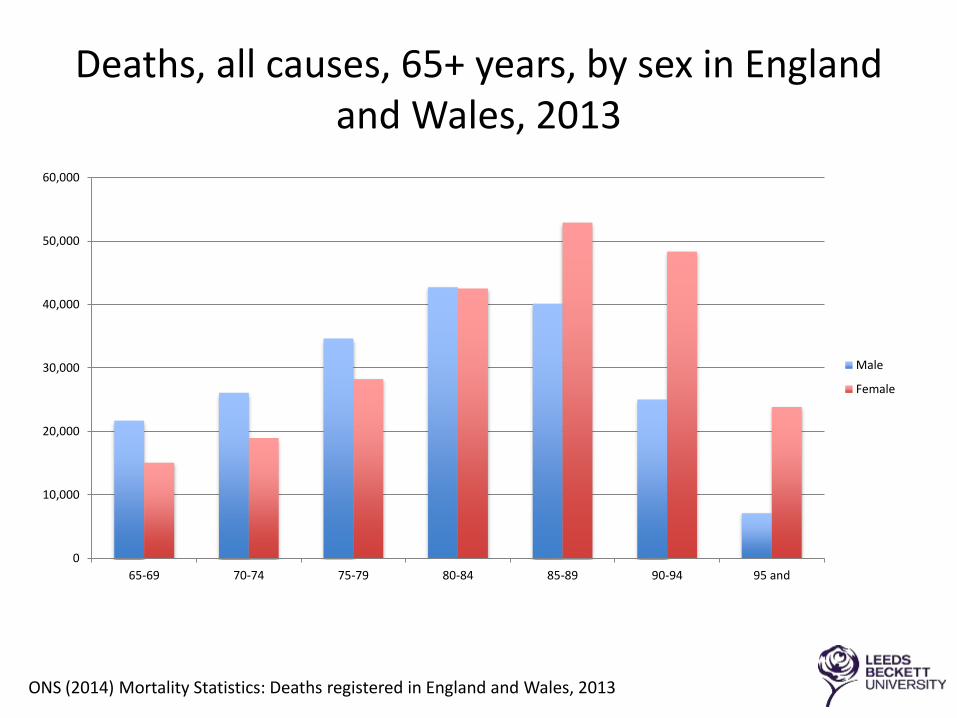
Deaths, all causes, 65+ years, by sex in England and Wales, 2013
ONS (2014) Mortality Statistics: Deaths registered in England and Wales, 2013
0
10,000
20,000
30,000
40,000
50,000
60,000
65-69 70-74 75-79 80-84 85-89 90-94 95 and
Male
Female

Proportion of male deaths under 65
18.7%
Proportion of female deaths under 65
11.4%
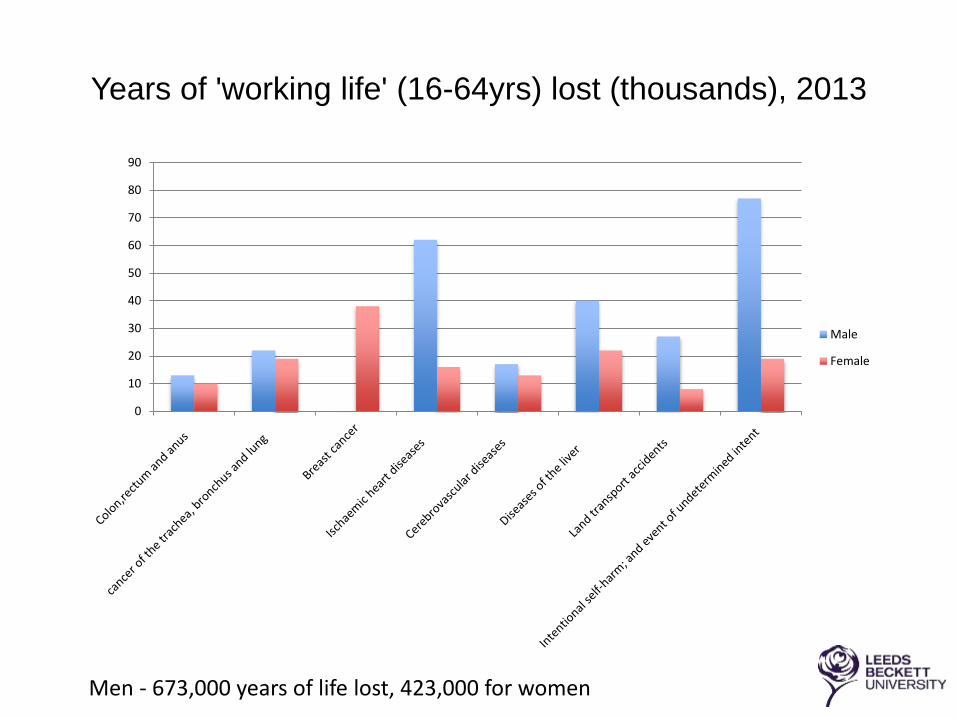
Years of 'working life' (16-64yrs) lost (thousands), 2013
0
10
20
30
40
50
60
70
80
90
Male
Female
Men - 673,000 years of life lost, 423,000 for women

Reduction in major causes of death 2002-2012
3,130
2,335
981
1,746
2,004
804
0
500
1,000
1,500
2,000
2,500
3,000
3,500
Circulatory diseases Cancer Respiratory diseases
Male
1,945
1,635
675
1,118
1,471
581
0
500
1,000
1,500
2,000
2,500
3,000
3,500
Circulatory diseases Cancer Respiratory diseases
Female
2002
2012
Source: ONS Age-standardised mortality rates (ASMRs) per million population

Change in death rates per million, 1994-2013
0
50
100
150
200
250
19
94
19
95
19
96
19
97
19
98
19
99
20
00
20
01
20
02
20
03
20
04
20
05
20
06
20
07
20
08
20
09
20
10
20
11
20
12
20
13
Liver disease
Land transport accidents
Self harm and underminedevent
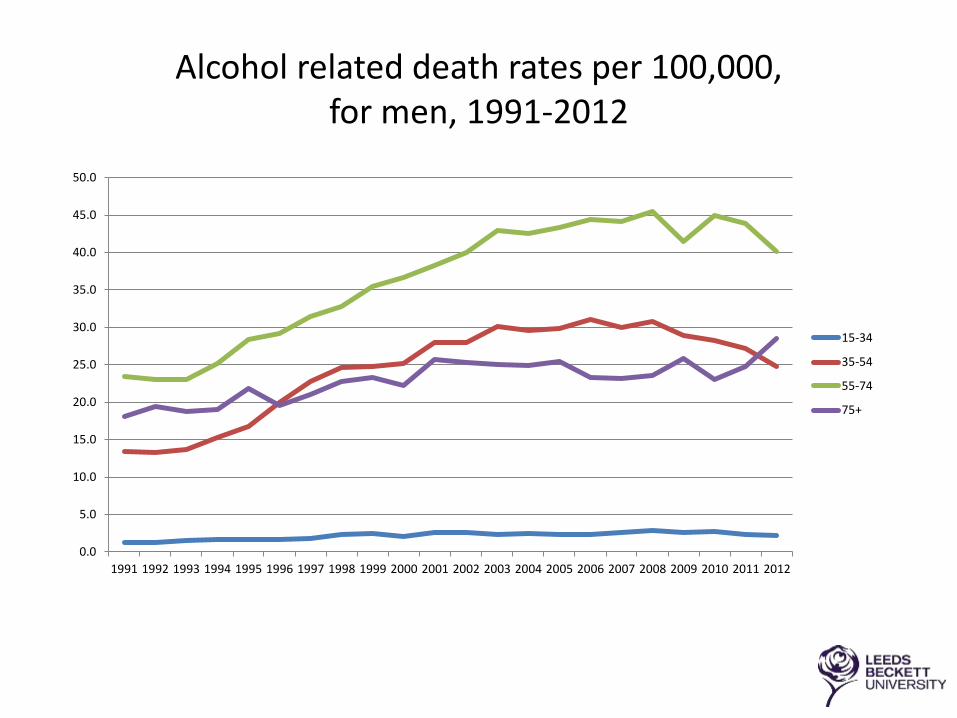
Alcohol related death rates per 100,000, for men, 1991-2012
0.0
5.0
10.0
15.0
20.0
25.0
30.0
35.0
40.0
45.0
50.0
1991 1992 1993 1994 1995 1996 1997 1998 1999 2000 2001 2002 2003 2004 2005 2006 2007 2008 2009 2010 2011 2012
15-34
35-54
55-74
75+

Avoidable mortality, Age standardised rate per 100,000 population, England & Wales 2001-2012
0.0
50.0
100.0
150.0
200.0
250.0
300.0
350.0
2001 2002 2003 2004 2005 2006 2007 2008 2009 2010 2011 2012
Male
Female
ONS (2014)
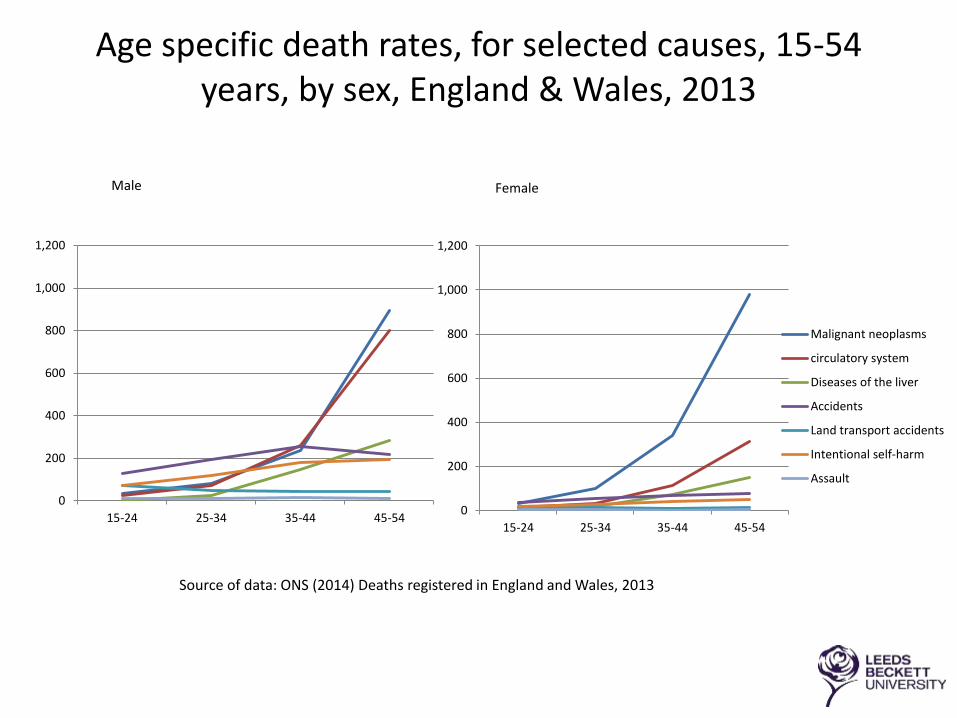
Age specific death rates, for selected causes, 15-54 years, by sex, England & Wales, 2013
Male Female
Source of data: ONS (2014) Deaths registered in England and Wales, 2013
0
200
400
600
800
1,000
1,200
15-24 25-34 35-44 45-540
200
400
600
800
1,000
1,200
15-24 25-34 35-44 45-54
Malignant neoplasms
circulatory system
Diseases of the liver
Accidents
Land transport accidents
Intentional self-harm
Assault
0
5,000
10,000
15,000
20,000
25,000
30,000
35,000
40,000
45,000
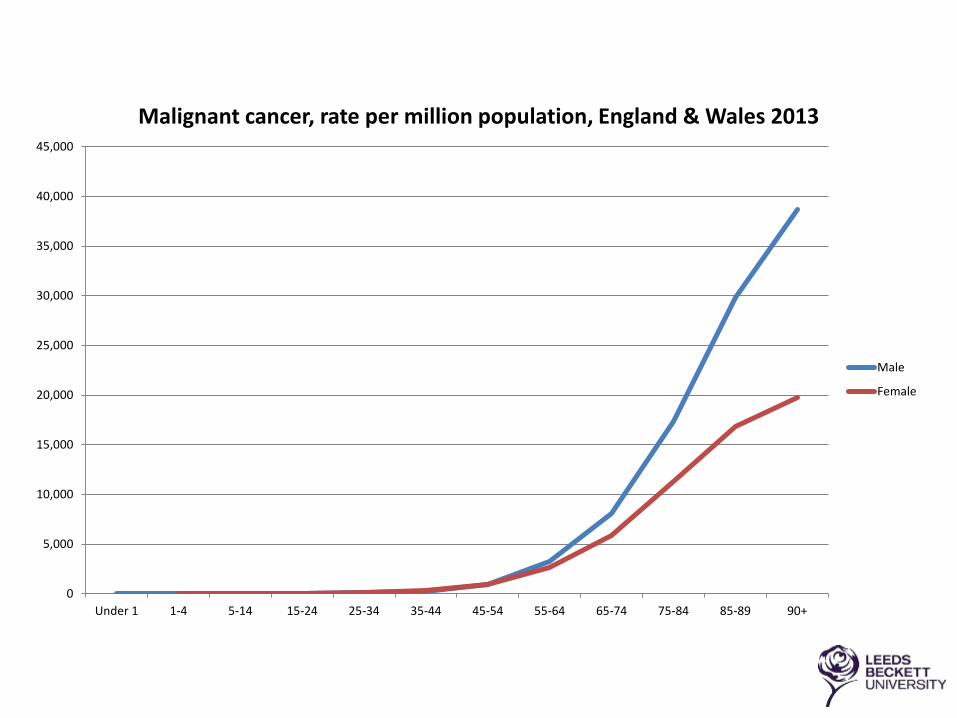
Under 1 1-4 5-14 15-24 25-34 35-44 45-54 55-64 65-74 75-84 85-89 90+
Malignant cancer, rate per million population, England & Wales 2013
Male
Female
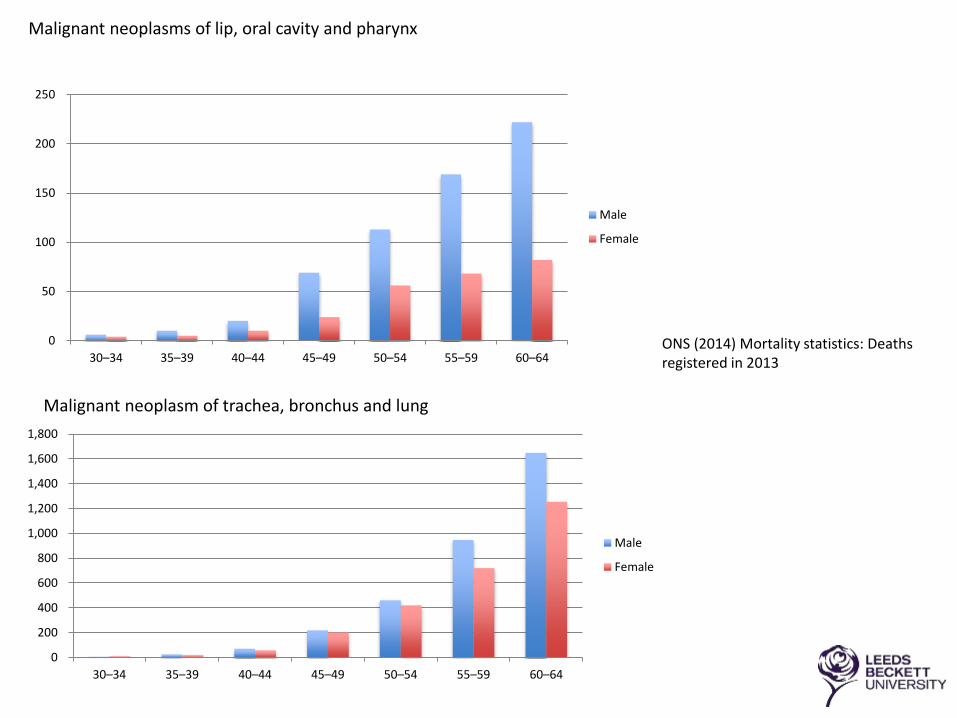
Malignant neoplasms of lip, oral cavity and pharynx
Malignant neoplasm of trachea, bronchus and lung
ONS (2014) Mortality statistics: Deaths registered in 2013
0
50
100
150
200
250
30–34 35–39 40–44 45–49 50–54 55–59 60–64
Male
Female
0
200
400
600
800
1,000
1,200
1,400
1,600
1,800
30–34 35–39 40–44 45–49 50–54 55–59 60–64
Male
Female

Malignant neoplasm of oesophagus
Malignant neoplasm of stomach ONS (2014) Mortality statistics: Deaths registered in 2013
0
100
200
300
400
500
600
30–34 35–39 40–44 45–49 50–54 55–59 60–64
Male
Female
0
50
100
150
200
250
30–34 35–39 40–44 45–49 50–54 55–59 60–64
Male
Female

Malignant neoplasm of pancreas
Malignant neoplasm of colon, rectosigmoid junction, rectum and anus
ONS (2014) Mortality statistics: Deaths registered in 2013
0
100
200
300
400
500
600
700
25–29 30–34 35–39 40–44 45–49 50–54 55–59 60–64
Male
Female
0
50
100
150
200
250
300
350
400
450
35–39 40–44 45–49 50–54 55–59 60–64
Male
Female

Malignant neoplasm of liver and intrahepatic bile ducts
ONS (2012) Mortality statistics: Deaths registered in 2011 (Series DR) Table 5
Malignant neoplasm of kidney, except renal pelvis
0
50
100
150
200
250
300
30–34 35–39 40–44 45–49 50–54 55–59 60–64
Male
Female
0
50
100
150
200
250
300
35–39 40–44 45–49 50–54 55–59 60–64
Male
Female
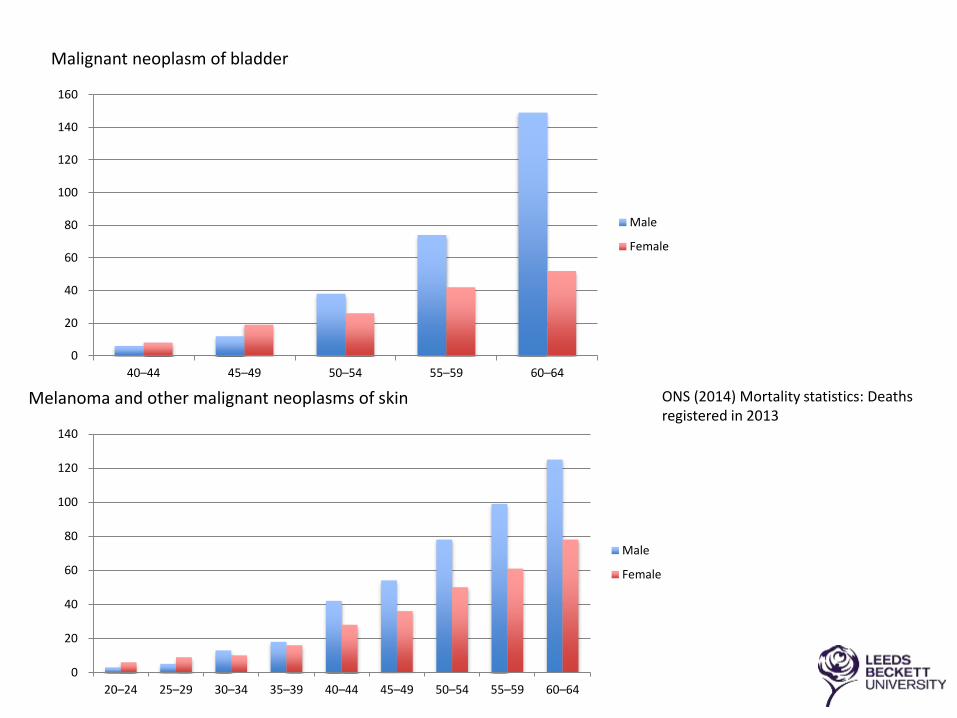
Malignant neoplasm of bladder
Melanoma and other malignant neoplasms of skin ONS (2014) Mortality statistics: Deaths registered in 2013
0
20
40
60
80
100
120
140
160
40–44 45–49 50–54 55–59 60–64
Male
Female
0
20
40
60
80
100
120
140
20–24 25–29 30–34 35–39 40–44 45–49 50–54 55–59 60–64
Male
Female

Malignant neoplasms of eye, brain and other parts of central nervous system
ONS (2014) Mortality statistics: Deaths registered in 2013 (Series DR) Table 5
Leukaemia
0
50
100
150
200
250
300
15–19 20–24 25–29 30–34 35–39 40–44 45–49 50–54 55–59 60–64
Male
Female
0
20
40
60
80
100
120
140
160
180
15
–19
20
–24
25
–29
30
–34
35
–39
40
–44
45
–49
50
–54
55
–59
60
–64
Male
Female

Non-Hodgkin's lymphoma
Malignant neoplasms of mesothelial and soft tissue ONS (2014) Mortality statistics: Deaths registered in 2013
0
50
100
150
200
250
15–19 20–24 25–29 30–34 35–39 40–44 45–49 50–54 55–59 60–64
Male
Female
0
50
100
150
200
250
15–19 20–24 25–29 30–34 35–39 40–44 45–49 50–54 55–59 60–64
Male
Female

Deaths, malignant neoplasm of testis, by age, England & Wales 2013
Source of data ONS 2014
0
2
4
6
8
10
12
10–14 15–19 20–24 25–29 30–34 35–39 40–44 45–49 50–54 55–59 60–64 65–69 70–74 75–79 80–84 85–89

Follow on analysis from CRUK (2013) Excess cancer burden in men.
Ratios of male:female European age-standardised incidence rates


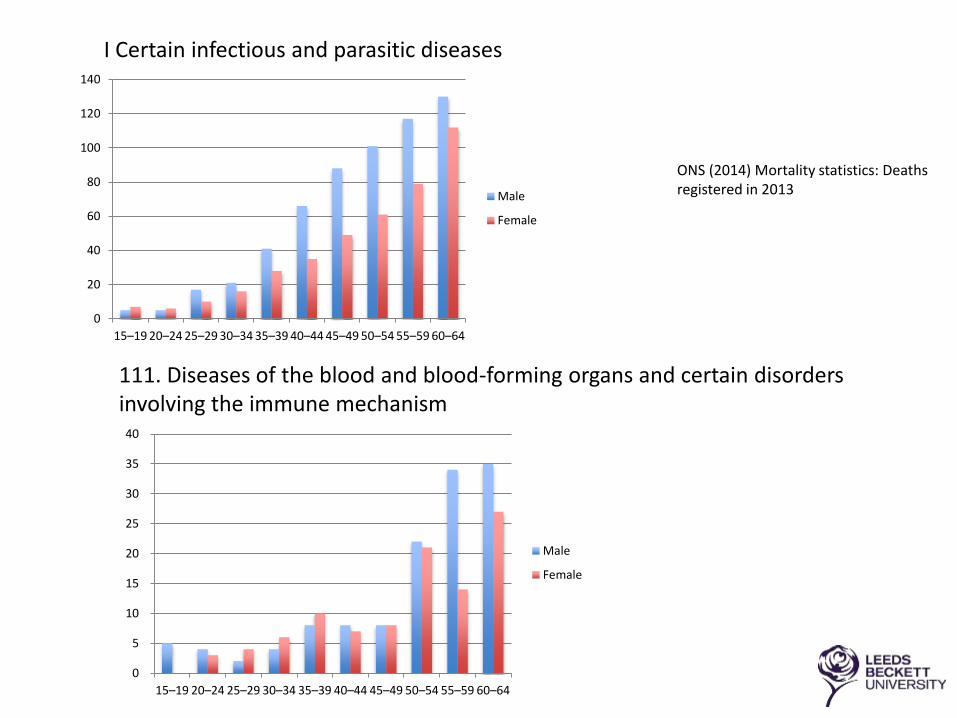
I Certain infectious and parasitic diseases
111. Diseases of the blood and blood-forming organs and certain disorders involving the immune mechanism
ONS (2014) Mortality statistics: Deaths registered in 2013
0
20
40
60
80
100
120
140
15–19 20–24 25–29 30–34 35–39 40–44 45–49 50–54 55–59 60–64
Male
Female
0
5
10
15
20
25
30
35
40
15–19 20–24 25–29 30–34 35–39 40–44 45–49 50–54 55–59 60–64
Male
Female
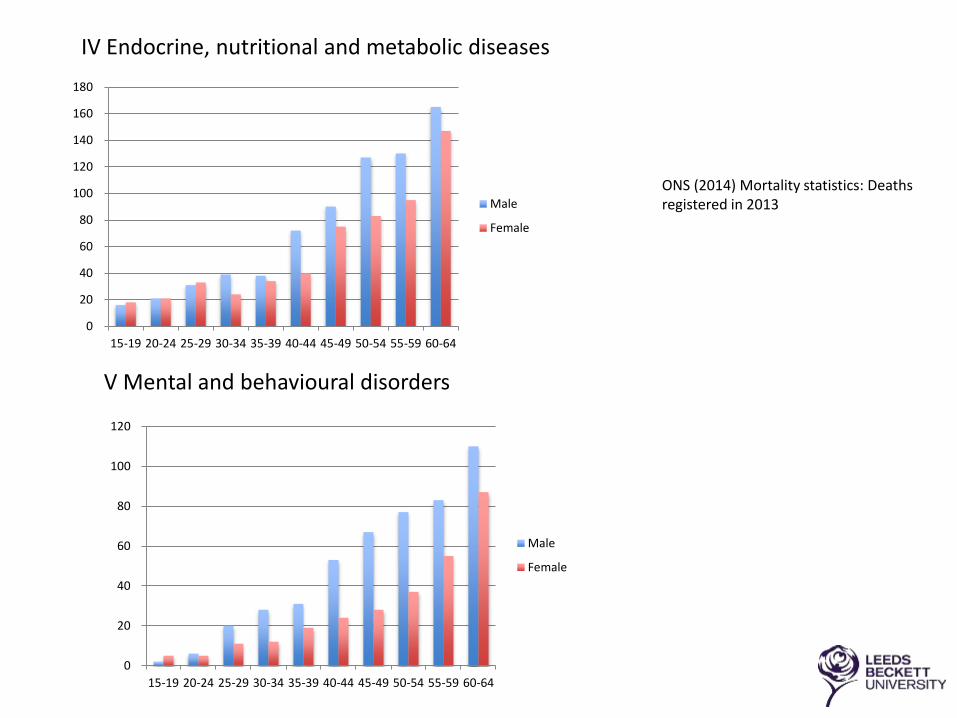
IV Endocrine, nutritional and metabolic diseases
V Mental and behavioural disorders
ONS (2014) Mortality statistics: Deaths registered in 2013
0
20
40
60
80
100
120
140
160
180
15-19 20-24 25-29 30-34 35-39 40-44 45-49 50-54 55-59 60-64
Male
Female
0
20
40
60
80
100
120
15-19 20-24 25-29 30-34 35-39 40-44 45-49 50-54 55-59 60-64
Male
Female
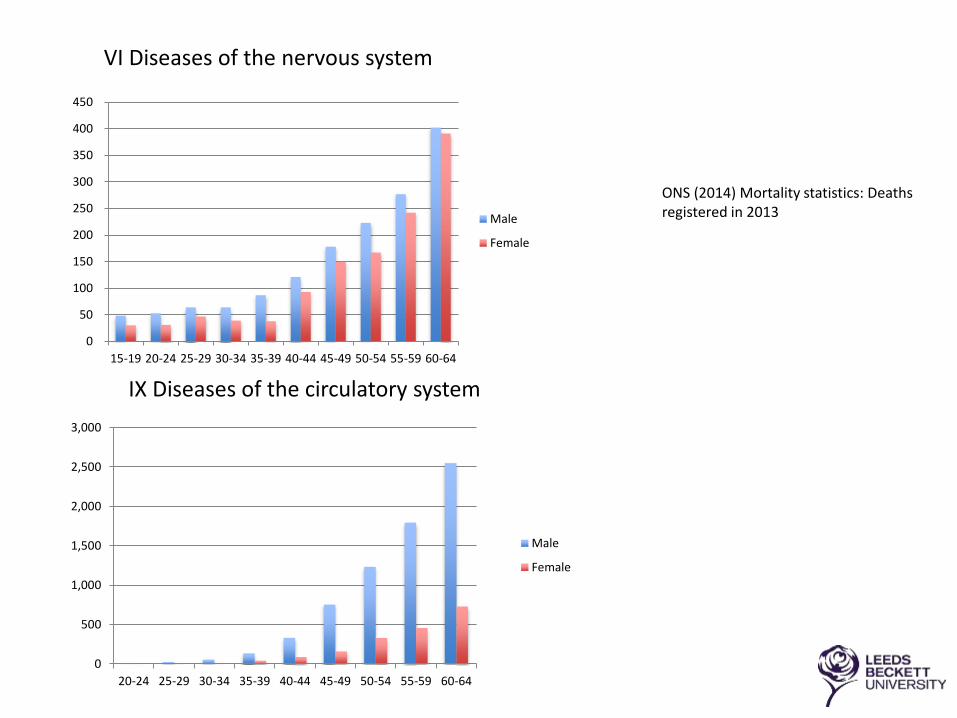
VI Diseases of the nervous system
IX Diseases of the circulatory system
ONS (2014) Mortality statistics: Deaths registered in 2013
0
50
100
150
200
250
300
350
400
450
15-19 20-24 25-29 30-34 35-39 40-44 45-49 50-54 55-59 60-64
Male
Female
0
500
1,000
1,500
2,000
2,500
3,000
20-24 25-29 30-34 35-39 40-44 45-49 50-54 55-59 60-64
Male
Female

X Diseases of the respiratory system
XI Diseases of the digestive system
ONS (2014) Mortality statistics: Deaths registered in 2013
0
200
400
600
800
1,000
1,200
1,400
1,600
15-19 20-24 25-29 30-34 35-39 40-44 45-49 50-54 55-59 60-64
Male
Female
0
200
400
600
800
1,000
1,200
15-19 20-24 25-29 30-34 35-39 40-44 45-49 50-54 55-59 60-64
Male
Female
0
20
40
60
80
100
120
15-19 20-24 25-29 30-34 35-39 40-44 45-49 50-54 55-59 60-64
Male
Female
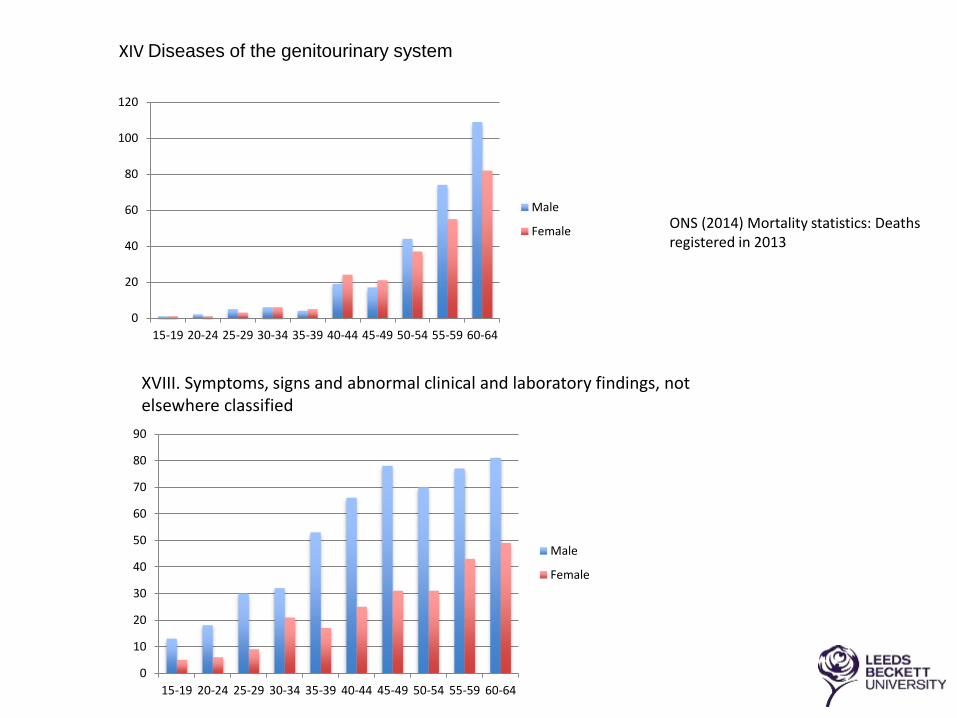
XIV Diseases of the genitourinary system
0
10
20
30
40
50
60
70
80
90
15-19 20-24 25-29 30-34 35-39 40-44 45-49 50-54 55-59 60-64
Male
Female
XVIII. Symptoms, signs and abnormal clinical and laboratory findings, not elsewhere classified
ONS (2014) Mortality statistics: Deaths registered in 2013

XX External causes of morbidity and mortality
ONS (2014) Mortality statistics: Deaths registered in 2013
Intentional self-harm and Event of undetermined intent
0
200
400
600
800
1,000
1,200
15-19 20-24 25-29 30-34 35-39 40-44 45-49 50-54 55-59 60-64
Male
Female
-
100
200
300
400
500
600
15-19 20-24 25-29 30-34 35-39 40-44 45-49 50-54 55-59 60-64
Male
Female
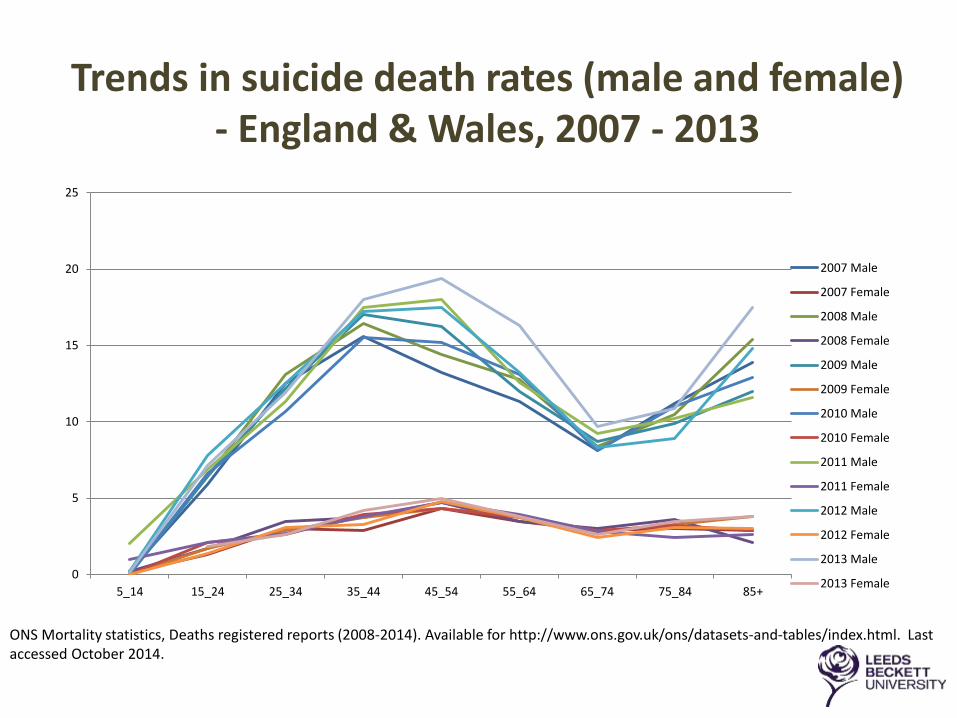
Trends in suicide death rates (male and female) - England & Wales, 2007 - 2013
ONS Mortality statistics, Deaths registered reports (2008-2014). Available for http://www.ons.gov.uk/ons/datasets-and-tables/index.html. Last accessed October 2014.
0
5
10
15
20
25
5_14 15_24 25_34 35_44 45_54 55_64 65_74 75_84 85+
2007 Male
2007 Female
2008 Male
2008 Female
2009 Male
2009 Female
2010 Male
2010 Female
2011 Male
2011 Female
2012 Male
2012 Female
2013 Male
2013 Female
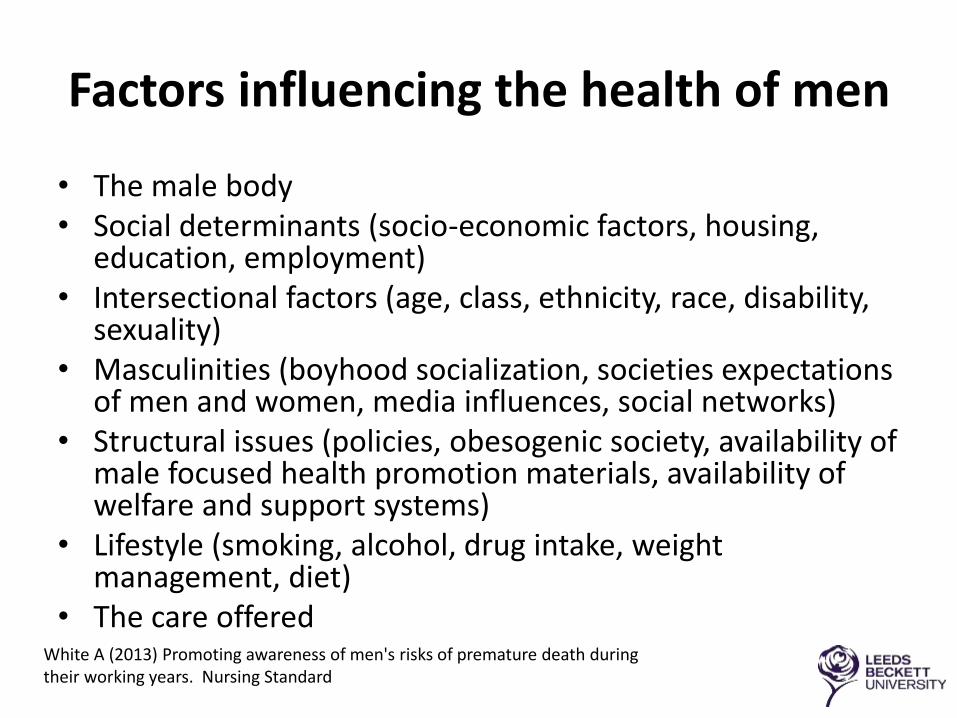
Factors influencing the health of men
• The male body• Social determinants (socio-economic factors, housing,
education, employment)• Intersectional factors (age, class, ethnicity, race, disability,
sexuality)• Masculinities (boyhood socialization, societies expectations
of men and women, media influences, social networks)• Structural issues (policies, obesogenic society, availability of
male focused health promotion materials, availability of welfare and support systems)
• Lifestyle (smoking, alcohol, drug intake, weight management, diet)
• The care offeredWhite A (2013) Promoting awareness of men's risks of premature death during their working years. Nursing Standard

Overweight and obesity in men and women, 1993-2012
24.4
66.6
25.1
57.2
0.0
10.0
20.0
30.0
40.0
50.0
60.0
70.0
80.0
1993 1994 1995 1996 1997 1998 1999 2000 2001 2002 2003 2004 2005 2006 2007 2008 2009 2010 2011 2012
Men - Obese Men - Overweight including obese
Women - Obese Women - Overweight including obese
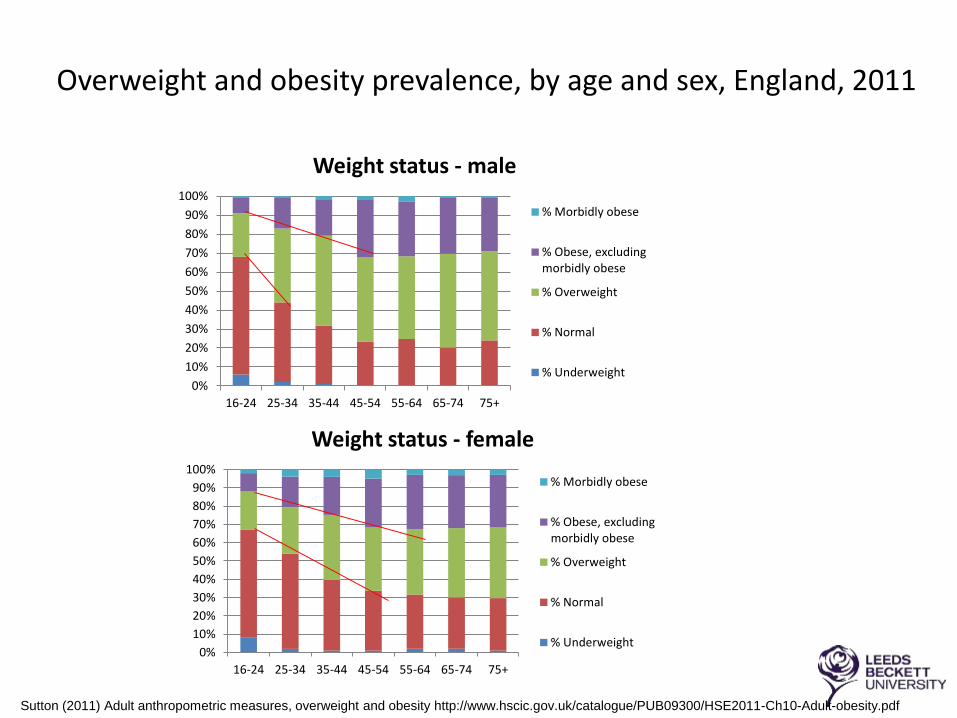
Overweight and obesity prevalence, by age and sex, England, 2011
Sutton (2011) Adult anthropometric measures, overweight and obesity http://www.hscic.gov.uk/catalogue/PUB09300/HSE2011-Ch10-Adult-obesity.pdf
0%
10%
20%
30%
40%
50%
60%
70%
80%
90%
100%
16-24 25-34 35-44 45-54 55-64 65-74 75+
Weight status - male
% Morbidly obese
% Obese, excludingmorbidly obese
% Overweight
% Normal
% Underweight
0%
10%
20%
30%
40%
50%
60%
70%
80%
90%
100%
16-24 25-34 35-44 45-54 55-64 65-74 75+
Weight status - female
% Morbidly obese
% Obese, excludingmorbidly obese
% Overweight
% Normal
% Underweight
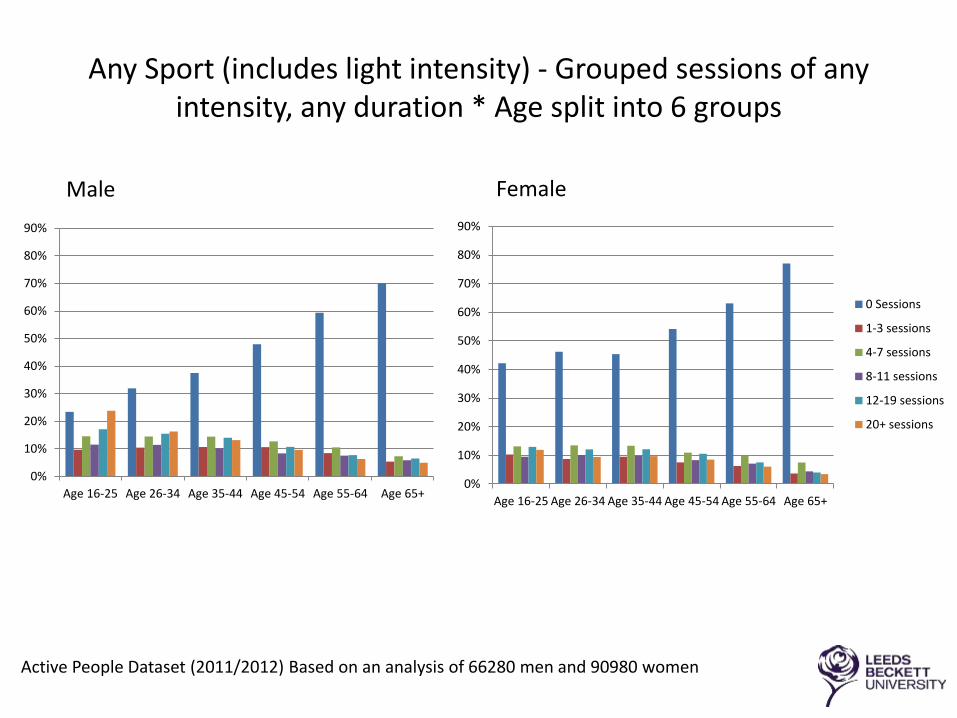
Any Sport (includes light intensity) - Grouped sessions of any intensity, any duration * Age split into 6 groups
0%
10%
20%
30%
40%
50%
60%
70%
80%
90%
Age 16-25 Age 26-34 Age 35-44 Age 45-54 Age 55-64 Age 65+
Male Female
0%
10%
20%
30%
40%
50%
60%
70%
80%
90%
Age 16-25 Age 26-34 Age 35-44 Age 45-54 Age 55-64 Age 65+
0 Sessions
1-3 sessions
4-7 sessions
8-11 sessions
12-19 sessions
20+ sessions
Active People Dataset (2011/2012) Based on an analysis of 66280 men and 90980 women
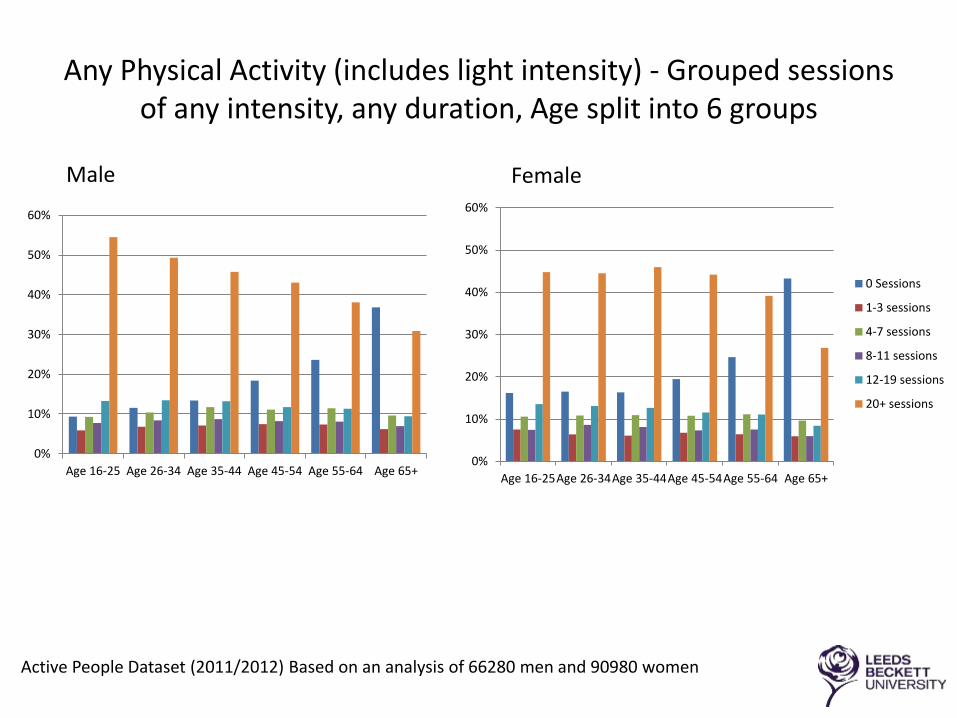
Any Physical Activity (includes light intensity) - Grouped sessions of any intensity, any duration, Age split into 6 groups
0%
10%
20%
30%
40%
50%
60%
Age 16-25 Age 26-34 Age 35-44 Age 45-54 Age 55-64 Age 65+0%
10%
20%
30%
40%
50%
60%
Age 16-25Age 26-34Age 35-44Age 45-54Age 55-64 Age 65+
0 Sessions
1-3 sessions
4-7 sessions
8-11 sessions
12-19 sessions
20+ sessions
Male Female
Active People Dataset (2011/2012) Based on an analysis of 66280 men and 90980 women
So what are the gender inequalities relating to men’s health?
• General invisibility of men’s health as an issue at the political level
• Lack of health strategy targeting men and their health concerns
• Lack of service provision for key men’s health issues i.e. weight loss, mental health services, cancer risk, preventive care / health promotion
Top Related