


Languages
Pages
Legal


Mechanical & Aerospace Engineering
West Virginia University
Phase Diagram (1)

Mechanical & Aerospace Engineering
West Virginia University
Pearlite in a plain-carbon steel, 0.05mm

Mechanical & Aerospace Engineering
West Virginia University
Phase Diagrams
Phase: A region of material that has uniform physical and chemical properties and the same composition.
Represents phases present in metal at different conditions (Temperature, pressure and composition).
Indicates equilibrium solid solubility of one element in another.
Indicates temperature range under which solidification occurs.
Indicates temperature at which different phases start to melt.

Mechanical & Aerospace Engineering
West Virginia University
Phase Diagram of Pure Substances
• Pure substance exist as solid, liquid and vapor.
• Phases are separated by phase boundaries.
• Example : Water, Pure Iron.
• Different phases coexist at triple point.
After W. G. Moffatt, et al., “The Structure and Properties of Materials,” vol I: “Structure,” Wiley, 1965, p.151

Mechanical & Aerospace Engineering
West Virginia University
Gibbs Phase Rule
• P+F = C+2
• For pure water, at triple point, 3 phases coexist.
• There is one component (water) in the system.
• Therefore 3 + F = 1 + 2 F = 0.• Degrees of freedom indicate number of variables that can
be changed without changing number of phases.
P = number of phases that coexist in a systemC = Number of componentsF = Degrees of freedom
Mechanical & Aerospace Engineering
West Virginia University
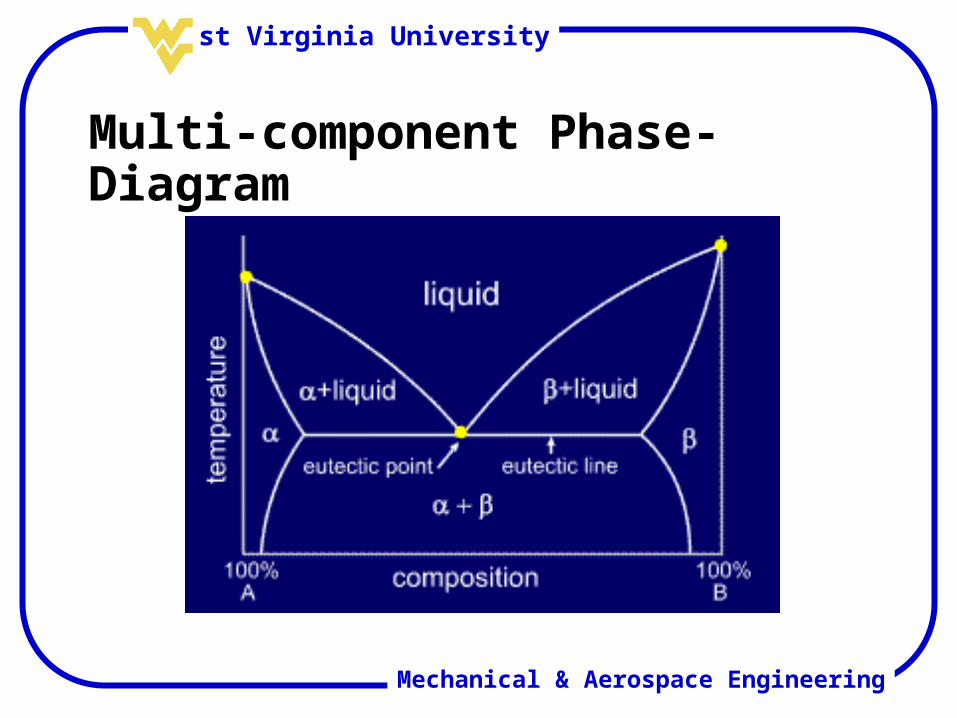
Multi-component Phase-Diagram

Mechanical & Aerospace Engineering
West Virginia University
Alloy: A mixture of a metal with other metals or non-metals (the “alloying elements”). Ceramics, too, can be mixed to form alloys.
Alloy System: All the alloys you can make with a given set of components.
Components: The chemical elements which make up the alloy.
Concentrations: Weight ( or atom, or mol) % of component in an alloy
WA = [( weight of component A)/( weights of all components)] 100%
XA = [( number of atoms of component A)/(number of atoms of all components)] 100%
Terminologies

Mechanical & Aerospace Engineering
West Virginia University
Equilibrium Constitution of an Alloy: At a given, constant temperature T and pressure P, there is no further tendency for the constitution to change with time. This constitution is the stable one.
State Variables (or independent constitution variables): T, P, and composition.

Mechanical & Aerospace Engineering
West Virginia University
Constitution of an Alloy: 1) The overall composition2) The number of phases3) The composition of each phase4) The proportion by weight of each phase
Phase Diagram ( or Equilibrium Diagram, or Equilibrium-Constitution Diagram): Diagram that summarizes the equilibrium constitution of the alloy system.
Terminologies

Mechanical & Aerospace Engineering
West Virginia University
Constitution Point: A point defined by the state variables. If this point is given, then the equilibrium number of phases can be read off. So, too, can their composition and the quantity of each phase. (The diagram tells you the entire constitution of any given alloy, at equilibrium.)
Fields: Regions in which the number of phases is constant.
Phase Boundaries: The Boundaries between fields. When a phase boundary is crossed, a phase change starts, or finishes, or both.

Mechanical & Aerospace Engineering
West Virginia University
Phase Analysis in Lead-Tin System
Pb + 50at%Sn • Liquid• Reaction: Liquid Liquid + Pb(3) Liquid+ Pb(4) Reaction: Liquid Sn + Pb
(5) Sn + Pb

Mechanical & Aerospace Engineering
West Virginia University
Composition of the Phases
Rule 1: When the constitution point lies in a single-phase region, the alloy consists of a single, homogeneous, phase. Its composition must be that of the alloy. The phase composition and the alloy composition coincide in single-phase fields.

Mechanical & Aerospace Engineering
West Virginia University
Composition of the Phases
Rule 2:When the constitution point for an alloy lies in the two-phase field the alloy breaks up into a mixture of two phases. The composition of each phase is obtained by constructing the tie line (the isotherm spanning the two-phase region, terminating at the nearest phase boundary on either side). The composition of each phase is defined by the end of the tie line.

Mechanical & Aerospace Engineering
West Virginia University
Lever Rule
Wt fraction of solid phase= Xs = w0 – w1
ws – w1
Wt fraction of liquid phase= Xl = ws – w0
ws – w1W0 is the weight percentage of the alloy.
Ws is the weight percentage within the solid phase
Wl is the weight percentage in the liquid phase

Mechanical & Aerospace Engineering
West Virginia University
Example
Pb-20Sn
At 150C
•Phase 1: Sn-2Pb;
•Phase 2: Pb–10Sn
•Wphase1 = 11%;
•Wphase2 = 89%

Mechanical & Aerospace Engineering
West Virginia University
Phase Diagram Measurements
1. Cooling Curves

Mechanical & Aerospace Engineering
West Virginia University
Phase Diagram Measurements
1. Cooling Curves (Cont’d.)

Mechanical & Aerospace Engineering
West Virginia University
Cooling Curves• Used to determine phase transition temperature.
• Temperature and time data of cooling molten metal is recorded and plotted.
• Thermal arrest : heat lost = heat supplied by solidifying metal
• Alloys solidify over a range of temperature (no thermal arrest)
Pure Metal
Iron

Mechanical & Aerospace Engineering
West Virginia University
Phase Diagram Measurements
2. DTA (Differential Thermal Analysis)
A sample with the same thermal mass as the test sample, but showing no phase transformation, is cooled (or heated) side-by-side with the test sample, and the difference T between the cooling (or heating) curves is plotted.

Mechanical & Aerospace Engineering
West Virginia University
Summary
1. Terminologies – Alloy, Component, Concentrations, Phase, Constitution of the Alloy, Equilibrium Constitution of the Alloy, State Variables, Alloy System, Phase Diagram, Constitution Points, Fields, Phase Boundaries, etc.
2. Nature of Phase Diagrams, Fields in Phase Diagrams, Single-phase field, two-phase field, etc.

Mechanical & Aerospace Engineering
West Virginia University
Summary
3. Composition of Phases(1) Rule 1: Single-phase fields: Composition of alloy is the same as Composition of the phase(2) Rule 2: Tie line decide the composition of each phase in two-phase field(3) Lever Rule
4. Gibbs’ Phase RuleF = C – P + 2If pressure keep constantF = C – P + 1
5. Measurement of Phase Diagram: Cooling Curve, DTA
Top Related