


Languages
Pages
Legal

International Journal of Social Science and Economic Research
ISSN: 2455-8834
Volume:02, Issue:05 "May 2017"
www.ijsser.org Copyright © IJSSER 2017, All right reserved Page 3530
MEASURING INTRA-REGIONAL INCOME INEQUALITY OF GDP PER
CAPITA DURING 1970-2011: A STUDY ON SOUTH ASIA
1*Shabari Paul Dey, 2Dr. Debasis Neogi
1Doctoral Research Scholar, Department of Humanities and Social Sciences,
National Institute of Technology Agartala, Tripura, India.
2Associate Professor, Department of Humanities and Social Sciences,
National Institute Of Technology Agartala, Tripura, India.
*Corresponding Author
ABSTRACT
The present paper has looked into the disparities in GDP per capita of SAARC (South Asian
Association for Regional Cooperation) nations using alternative measures of income inequalities.
The formation of SAARC as a regional bloc in December 1985 consisting India, Bangladesh,
Pakistan, Bhutan, Srilanka, Maldives and Nepal had the basic objective of enhancing economic
growth of the member countries by encouraging intra-regional trade. Over three decades later,
today, when we evaluate the progress of such regional arrangement, it is not found satisfactory.
Comparison of intra-regional trade in SAARC with that in other regional trading blocks across
the world reveal the same. Under such circumstances, effort to find out the possibilities for
consolidation of the integration process in near future becomes imperative. One possible way to
judge it is to check the trend of economic inequality existing among these nations over the years.
In relation to that different measures of economic inequality viz. co-efficient of variation, gini
index, Atkinson index, Williamson index, coulter coefficient, hoover index and theil index have
been estimated for the years 1970 to 2011 which confirms declining trend in inequality among
these nations. The results of the inequality measures support the declining disproportions among
SAARC and advocate for utilizing the potential scope for further consolidation of the region.
JEL Classification: F15
Keywords: GDP Per Capita, Gini Index, Inequality, Regional Bloc, SAARC, Williamson Index.

International Journal of Social Science and Economic Research
ISSN: 2455-8834
Volume:02, Issue:05 "May 2017"
www.ijsser.org Copyright © IJSSER 2017, All right reserved Page 3531
1. INTRODUCTION
The South Asian Association for Regional Cooperation (SAARC) has been formed to felicitate
the economic development of the member countries and to take away the internal gaps in the
growth of per capita income among these countries. India, Nepal, Bhutan, Pakistan, Srilanka,
Maldives and Bangladesh are the seven countries which made the association on 8th December
1985. Afghanistan has joined these countries later in 2008, making it a collaboration of eight
countries now. The key goal of this economic integration was to lessen the disproportions in the
level of development of these member countries. The success of economic integration of
SAARC was low in its early period but in the post liberalisation era, the rate of convergence of
SAARC countries has been reasonable. Regional economic integration with trade liberalisation
can help a region to grow by enhancing intra-regional trade. The member countries in the region
can bring benefits to each other and can ensure economies of scale which will further lead to a
shift in their production function. The sole objective behind the formation of regional bloc is not
only to heighten intra-regional trade but to upsurge economic growth among member countries
and also to strengthen their international competitiveness. So, the broader objective of formation
of SAARC was to accelerate economic growth, cultural growth, to promote peace and harmony
among the member countries and to ensure a minimum standard of living.
Review of the existing literatures on SAARC cooperation and various reports on the same raise
the necessity of performing wide-ranging research on the usefulness of the cooperation. So now
the question will be: is SAARC still relevant today? SAARC, as a regional bloc, has huge
potentials. But these potentials have been hindered even after 30 years of its inception due to the
lack of strong bilateral relations in the areas of geographical, economic, and strategic dimensions
among eight member countries of SAARC. One major issue contributed to the failure of SAARC
is the rising political conflicts between India and Pakistan. Another important reason can be the
size of the economies forming the regional integration. Unlike other such groupings namely
European Union (EU) or the Association of South East Asian Nations (ASEAN) which consists
of similar economies, in SAARC India is the dominant economy which consists nearly 60 per
cent of the total population, area, and GDP of SAARC. So, there have been huge differences in
GDP per capita of these member countries of SAARC. In this regard, India can play a vital role
in facilitating intra-regional trade which can prompt the process of development of each member
country of SAARC as it is the only member which shares border with all member countries
except Afghanistan. Again, no other country shares a border with any other SAARC countries
except India. In both the way it shows the sole importance of India among all the SAARC
members. The success of SAARC depends on the willingness of member countries to eliminate
their bilateral differences and move forward to implement all the policy initiatives that were
there in their summit proposals which also included the abolition of all the trade barriers and to
International Journal of Social Science and Economic Research
ISSN: 2455-8834
Volume:02, Issue:05 "May 2017"
www.ijsser.org Copyright © IJSSER 2017, All right reserved Page 3532
increase the competitiveness of the member countries to the world economy. The question
whether SAARC is a failure or not cannot be answered simply with respect to the overall success
of SAARC in its cooperation initiatives. The objective behind the formation of SAARC was not
only to be successful as a regional bloc but also to ensure similar level of economic growth for
each member. Though it started with unequal size of economies it can be argued from the
literature that countries have been converging over the years in terms of GDP per capita. This
fact also manifests the continuing consolidation of these economies. In this context, the present
paper efforts to investigate the scenario of income inequalities in terms of GDP per capita
between these member countries – whether the inequality has reduced over time or not. The
declining trend in inequalities will assure the possibility of further consolidation of these
economies which can in turn add to the success of forming the economic integration of SAARC.
Many studies have also been conducted on different issues related to SAARC which also ensures
further the importance of SAARC as a regional cooperation. In their paper (Ratna and Sharma,
2016, pp. 181-199) they examined the possible effects of regional integration between ASEAN
and SAARC on various sectors as well as on macroeconomic and trade areas. Again, both the
authors (Ekanayake and Perera, 2015, pp.75S-101S), in their article, have found that the regional
investment framework is the only useful determinant in attracting FDI for member countries of
SAARC. In a paper by (Chary and Bohara, 2010, pp.21-30), the causal relationships between
income, energy consumption and carbon emission has been evaluated in major SAARC countries
and it has been found that the cause of the emissions are income along with energy consumption.
Different techniques of measuring income inequalities have been applied in the literature to
measure the inequality in GDP per capita. In their paper, (Mansoor Mushtaq et al., 2014, pp.1-
10) have applied Gini coefficient to measure income inequality. Both Atkinson index and Theil
index have been mentioned as a measure of income inequality by Frank Cowell in his discussion
paper ‘Measurement of Inequality’. (Lusambo L P, 2016, pp. 1-15), in his work, has used
Hoover coefficient and Theil index for measuring inequalities. Theil’s index has been considered
as one of the popular generalised entropy measures. Other common Generalised Entropy (GE)
measures are the mean logarithmic deviation, half the square of the coefficient of variation and
Atkinson’s measure of inequality. Theil’s measure is the most popular of the class of GE
measures. It is applied in several studies on global income distributions including the recent
works of (Milanovic and Yitzhaki, 2002, pp. 155-178); (Barro and Sala-i-Martin, 2003, p. 672)
and (Chotikapanich et al., 2006, pp. 127-147). In their paper, (Choudhury and Haldar, 2009, pp.
258-263) examined regional disparities among Indian states using different income inequality
measures like Gini coefficient, coefficient of variation, coulter coefficient, Hoover index, Theil
index, Atkinson index and Williamson index. The present paper has considered these measures
to get an estimate of inequalities in GDP per capita for SAARC countries over specified period.
International Journal of Social Science and Economic Research
ISSN: 2455-8834
Volume:02, Issue:05 "May 2017"
www.ijsser.org Copyright © IJSSER 2017, All right reserved Page 3533
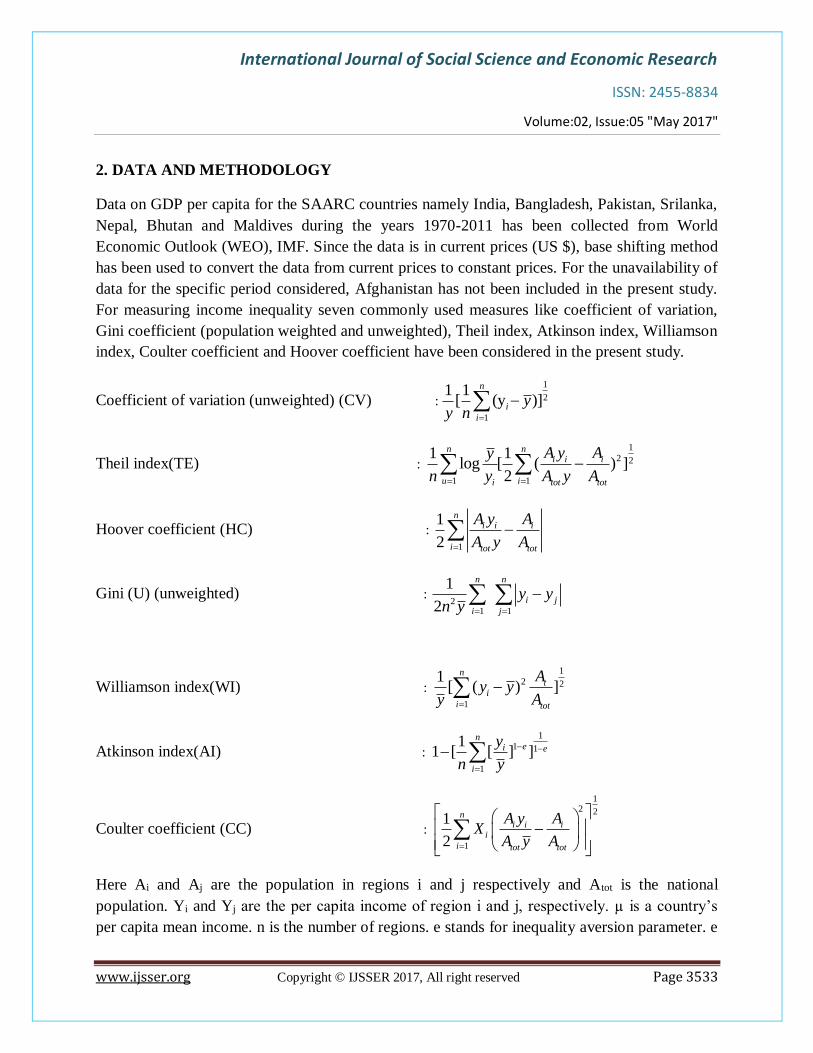
2. DATA AND METHODOLOGY
Data on GDP per capita for the SAARC countries namely India, Bangladesh, Pakistan, Srilanka,
Nepal, Bhutan and Maldives during the years 1970-2011 has been collected from World
Economic Outlook (WEO), IMF. Since the data is in current prices (US $), base shifting method
has been used to convert the data from current prices to constant prices. For the unavailability of
data for the specific period considered, Afghanistan has not been included in the present study.
For measuring income inequality seven commonly used measures like coefficient of variation,
Gini coefficient (population weighted and unweighted), Theil index, Atkinson index, Williamson
index, Coulter coefficient and Hoover coefficient have been considered in the present study.
Coefficient of variation (unweighted) (CV) :
Theil index(TE) :
Hoover coefficient (HC) :
Gini (U) (unweighted) :
Williamson index(WI) :
Atkinson index(AI) :
Coulter coefficient (CC) :
Here Ai and Aj are the population in regions i and j respectively and Atot is the national
population. Yi and Yj are the per capita income of region i and j, respectively. µ is a country’s
per capita mean income. n is the number of regions. e stands for inequality aversion parameter. e
1
2
1
1 1[ (y )]
n
i
i
yy n
1
2 2
1 1
1 1log [ ( ) ]
2
n ni i i
u ii tot tot
A y Ay
n y A y A
1
1
2
ni i i
i tot tot
A y A
A y A
21 1
1
2
n n
i j
i j
y yn y
1
2 2
1
1[ ( ) ]
nt
i
i tot
Ay y
y A
1
1 1
1
11 [ [ ] ]
nei e
i
y
n y
12 2
1
1
2
ni i i
i
i tot tot
A y AX
A y A
International Journal of Social Science and Economic Research
ISSN: 2455-8834
Volume:02, Issue:05 "May 2017"
www.ijsser.org Copyright © IJSSER 2017, All right reserved Page 3534
is the standard Atkinson’s preference for equality parameter whose value is taken to be 0.5 for
our calculation.
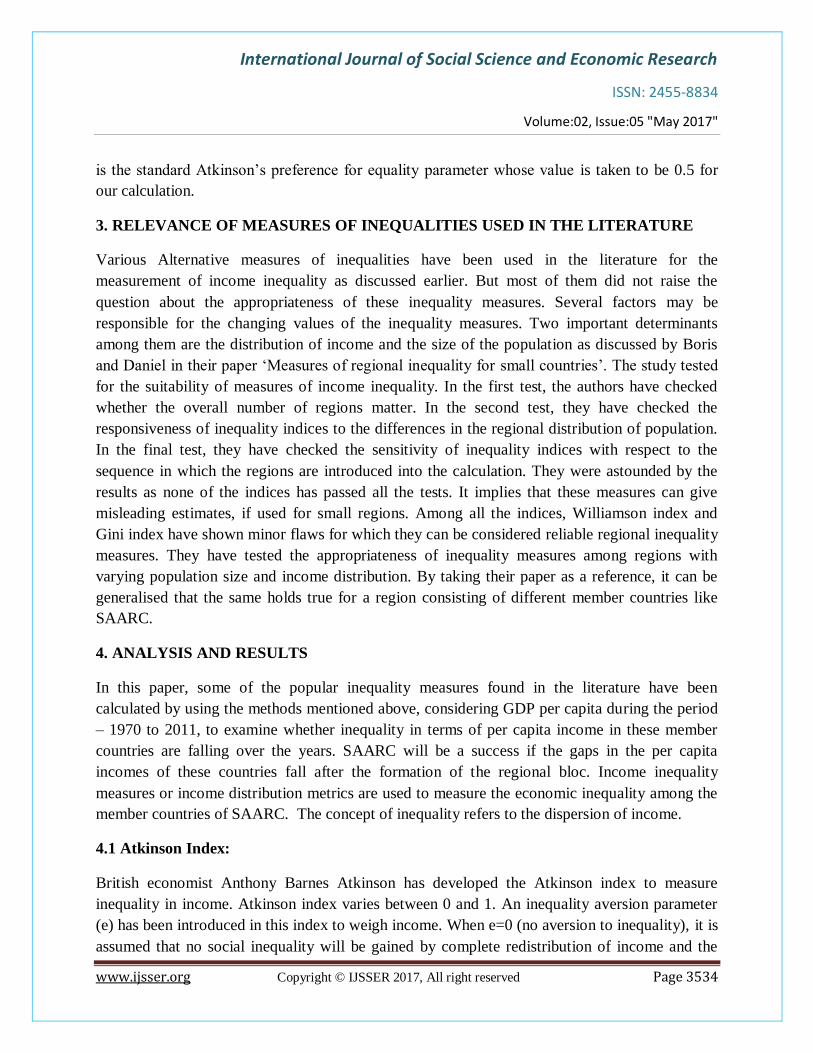
3. RELEVANCE OF MEASURES OF INEQUALITIES USED IN THE LITERATURE
Various Alternative measures of inequalities have been used in the literature for the
measurement of income inequality as discussed earlier. But most of them did not raise the
question about the appropriateness of these inequality measures. Several factors may be
responsible for the changing values of the inequality measures. Two important determinants
among them are the distribution of income and the size of the population as discussed by Boris
and Daniel in their paper ‘Measures of regional inequality for small countries’. The study tested
for the suitability of measures of income inequality. In the first test, the authors have checked
whether the overall number of regions matter. In the second test, they have checked the
responsiveness of inequality indices to the differences in the regional distribution of population.
In the final test, they have checked the sensitivity of inequality indices with respect to the
sequence in which the regions are introduced into the calculation. They were astounded by the
results as none of the indices has passed all the tests. It implies that these measures can give
misleading estimates, if used for small regions. Among all the indices, Williamson index and
Gini index have shown minor flaws for which they can be considered reliable regional inequality
measures. They have tested the appropriateness of inequality measures among regions with
varying population size and income distribution. By taking their paper as a reference, it can be
generalised that the same holds true for a region consisting of different member countries like
SAARC.
4. ANALYSIS AND RESULTS
In this paper, some of the popular inequality measures found in the literature have been
calculated by using the methods mentioned above, considering GDP per capita during the period
– 1970 to 2011, to examine whether inequality in terms of per capita income in these member
countries are falling over the years. SAARC will be a success if the gaps in the per capita
incomes of these countries fall after the formation of the regional bloc. Income inequality
measures or income distribution metrics are used to measure the economic inequality among the
member countries of SAARC. The concept of inequality refers to the dispersion of income.
4.1 Atkinson Index:
British economist Anthony Barnes Atkinson has developed the Atkinson index to measure
inequality in income. Atkinson index varies between 0 and 1. An inequality aversion parameter
(e) has been introduced in this index to weigh income. When e=0 (no aversion to inequality), it is
assumed that no social inequality will be gained by complete redistribution of income and the

International Journal of Social Science and Economic Research
ISSN: 2455-8834
Volume:02, Issue:05 "May 2017"
www.ijsser.org Copyright © IJSSER 2017, All right reserved Page 3535
value for the Atkinson index will be zero. When e=∞ (infinite aversion to inequality), it is
assumed that infinite social utility is gained by complete redistribution where Atkinson index
will be 1.
Table 1: Atkinson Index:
Year Atkinson Index Year Atkinson Index
1970 0.056454 1991 0.030131
1971 0.049442 1992 0.022894
1972 0.030228 1993 0.022654
1973 0.031511 1994 0.016312
1974 0.043779 1995 0.016003
1975 0.09967 1996 0.014107
1976 0.054208 1997 0.236057
1977 0.052216 1998 0.009743
1978 0.075937 1999 0.008349
1979 0.062015 2000 0.008155
1980 0.060243 2001 0.005237
1981 0.078903 2002 0.003479
1982 0.073835 2003 0.002486
1983 0.060687 2004 0.002282
1984 0.041045 2005 0.002767
1985 0.039782 2006 0.000654
1986 0.03367 2007 0.001816
1987 0.035792 2008 0
1988 0.034831 2009 0.000532
1989 0.033324 2010 0.001685
1990 0.029811 2011 0.002739
Source: Computed from the data collected from (http://databank.worldbank.org/data/reports.aspx?Code=NY.GDP.PCAP.CD&id=af3ce82b&report_name=Popular_i
ndicators&populartype=series&ispopular=y)
In table 1 the values of Atkinson index show quite fluctuating movement over the years with a
declining trend both in the pre-and post-liberalisation periods. However, the value reached a high
of 0.236057 in 1997. This rise in value may be due to the long run impact of liberalisation.
Another important observation is that after 1997 the value showed continuous decline. The index
has reduced from 0.009743 in 1998 to 0.002739 in 2011. This shows that the gap among
SAARC countries is on the decline.
4.2 Theil inequality measure:
Theil index is a statistic used to measure income inequality. In Table 2, Theil index has been
calculated to measure income inequalities among the signatories of SAARC.
International Journal of Social Science and Economic Research
ISSN: 2455-8834
Volume:02, Issue:05 "May 2017"
www.ijsser.org Copyright © IJSSER 2017, All right reserved Page 3536
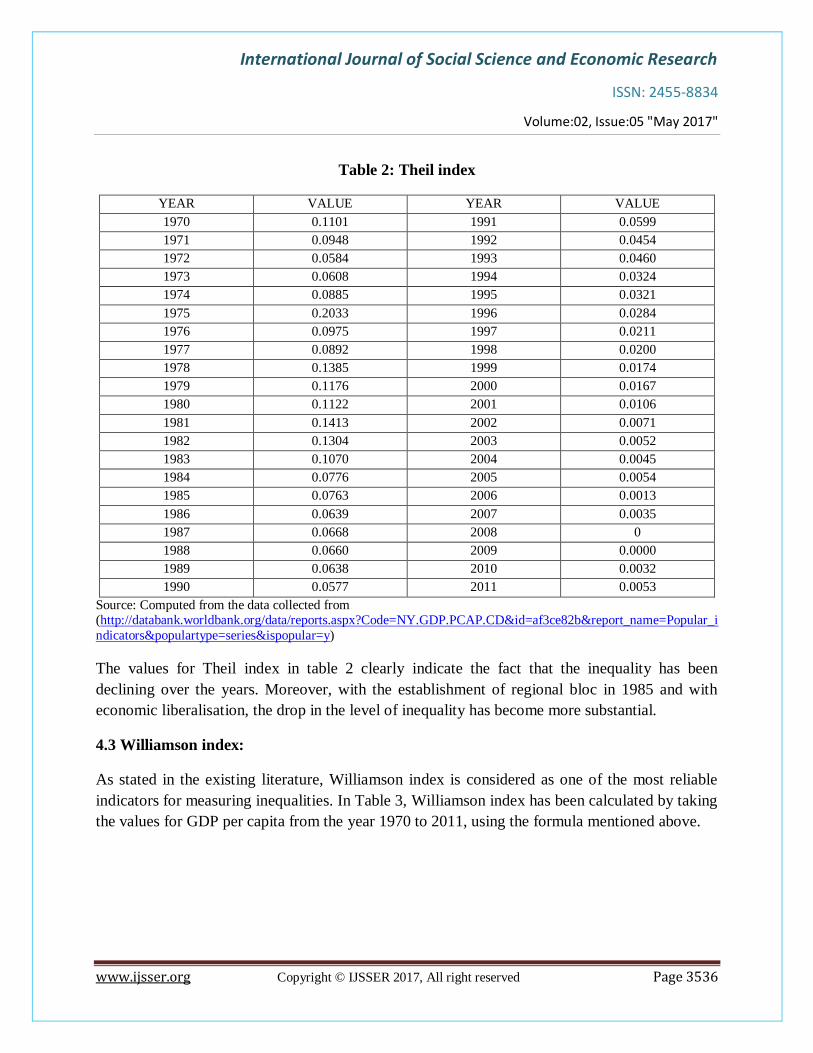
Table 2: Theil index
YEAR VALUE YEAR VALUE
1970 0.1101 1991 0.0599
1971 0.0948 1992 0.0454
1972 0.0584 1993 0.0460
1973 0.0608 1994 0.0324
1974 0.0885 1995 0.0321
1975 0.2033 1996 0.0284
1976 0.0975 1997 0.0211
1977 0.0892 1998 0.0200
1978 0.1385 1999 0.0174
1979 0.1176 2000 0.0167
1980 0.1122 2001 0.0106
1981 0.1413 2002 0.0071
1982 0.1304 2003 0.0052
1983 0.1070 2004 0.0045
1984 0.0776 2005 0.0054
1985 0.0763 2006 0.0013
1986 0.0639 2007 0.0035
1987 0.0668 2008 0
1988 0.0660 2009 0.0000
1989 0.0638 2010 0.0032
1990 0.0577 2011 0.0053
Source: Computed from the data collected from (http://databank.worldbank.org/data/reports.aspx?Code=NY.GDP.PCAP.CD&id=af3ce82b&report_name=Popular_i
ndicators&populartype=series&ispopular=y)
The values for Theil index in table 2 clearly indicate the fact that the inequality has been
declining over the years. Moreover, with the establishment of regional bloc in 1985 and with
economic liberalisation, the drop in the level of inequality has become more substantial.
4.3 Williamson index:
As stated in the existing literature, Williamson index is considered as one of the most reliable
indicators for measuring inequalities. In Table 3, Williamson index has been calculated by taking
the values for GDP per capita from the year 1970 to 2011, using the formula mentioned above.

International Journal of Social Science and Economic Research
ISSN: 2455-8834
Volume:02, Issue:05 "May 2017"
www.ijsser.org Copyright © IJSSER 2017, All right reserved Page 3537
Table 3: Williamson index
YEAR VALUE YEAR VALUE
1970 0.3264 1991 0.1906
1971 0.2964 1992 0.219
1972 0.1403 1993 0.2049
1973 0.2272 1994 0.2321
1974 0.3068 1995 0.1679
1975 0.5186 1996 0.1779
1976 0.1987 1997 0.1677
1977 0.1745 1998 0.1521
1978 0.2787 1999 0.1604
1979 0.2649 2000 0.1448
1980 0.2762 2001 0.1483
1981 0.2761 2002 0.1348
1982 0.249 2003 0.11488
1983 0.2326 2004 0.0824
1984 0.197 2005 0.0646
1985 0.2164 2006 0.0689
1986 0.1874 2007 0.0535
1987 0.2056 2008 0.1368
1988 0.2056 2009 0
1989 0.1791 2010 0.0648
1990 0.1819 2011 0.0933
Source: Computed from the data collected from (http://databank.worldbank.org/data/reports.aspx?Code=NY.GDP.PCAP.CD&id=af3ce82b&report_name=Popular_i
ndicators&populartype=series&ispopular=y)
The values of Williamson index calculated for the year 1970 to 2011 in Table 3 depicts declining
proportions of per capita GDP among member countries of SAARC, which is further noticeable
after the formation of economic cooperation in 1985. Value drops from a remarkable 0.3264 in
1970 to 0.0933 in 2011. It can, therefore, be inferred that there is a drop in income inequality
among SAARC member countries.
4.4 Coefficient of variation:
In probability theory and statistics, the coefficient of variation (CV) is a standardized measure of
dispersion of a probability distribution or frequency distribution. It is defined as the ratio of the
standard deviation to the mean.

International Journal of Social Science and Economic Research
ISSN: 2455-8834
Volume:02, Issue:05 "May 2017"
www.ijsser.org Copyright © IJSSER 2017, All right reserved Page 3538
Table 4. Co-efficient of variations of GDP per capita (1970-2011)
YEAR CO-EFFICIENT OF
VARIATIONS YEAR CO-EFFICIENT OF VARIATIONS
1970 50.16 1991 37.28
1971 46.31 1992 32.86
1972 35.44 1993 33.16
1973 37.61 1994 27.64
1974 47.20 1995 27.49
1975 72.92 1996 26.08
1976 44.59 1997 22.57
1977 40.65 1998 22.24
1978 53.31 1999 20.80
1979 50.47 2000 20.19
1980 49.00 2001 16.12
1981 53.39 2002 13.26
1982 50.68 2003 11.28
1983 45.53 2004 10.36
1984 40.78 2005 11.18
1985 40.98 2006 5.59
1986 37.22 2007 9.24
1987 37.61 2008 0
1988 37.50 2009 5.21
1989 37.33 2010 8.68
1990 35.92 2011 10.98
Source: Computed from the data collected from
(http://databank.worldbank.org/data/reports.aspx?Code=NY.GDP.PCAP.CD&id=af3ce82b&report_name=Popular_indicators&populartype=series&ispopular=y)

International Journal of Social Science and Economic Research
ISSN: 2455-8834
Volume:02, Issue:05 "May 2017"
www.ijsser.org Copyright © IJSSER 2017, All right reserved Page 3539
The CV values in table 4 are quite high in the pre-economic cooperation periods with a peak of
72.92 percent in 1975. But after the creation of SAARC (7) in 1985, the Co-efficient of Variation
of GDP per capita among SAARC countries has been steadily decreasing and has even come to
the lowest of 10.98 in 2011.
4.5 Gini index:
Gini index is the most common of all the matrices for measuring income inequality. Gini index
has been calculated for the study period from the year 1970 to 2011, by taking GDP per capita as
an indicator. The Gini index ranges between 0 and 1 where 0 indicates perfect equality and 1
indicates maximum inequality. Table 5 shows the value of Gini index for the time span
mentioned.
Table 5. Gini Values of GDP per capita during (1970-2011)
YEAR GINI CO-EFFICIENT YEAR GINI CO-EFFICIENT
1970 0.26 1991 0.19
1971 0.24 1992 0.17
1972 0.18 1993 0.17
1973 0.20 1994 0.14
1974 0.23 1995 0.14
1975 0.34 1996 0.13
1976 0.23 1997 0.11
1977 0.20 1998 0.11
1978 0.28 1999 0.10
1979 0.27 2000 0.10
1980 0.25 2001 0.08
1981 0.28 2002 0.06
1982 0.26 2003 0.05
1983 0.23 2004 0.05
1984 0.21 2005 0.06

International Journal of Social Science and Economic Research
ISSN: 2455-8834
Volume:02, Issue:05 "May 2017"
www.ijsser.org Copyright © IJSSER 2017, All right reserved Page 3540
Source: Computed from the data collected from
(http://databank.worldbank.org/data/reports.aspx?Code=NY.GDP.PCAP.CD&id=af3ce82b&report_name=Popular_i
ndicators&populartype=series&ispopular=y)
It can be observed from table 5 that the value of the Gini co-efficient has been falling over the
years. The value has dropped from the highest 0.34 in 1975 to a substantial low of 0.03 in 2006
and 2009. Steady fall in the values of Gini coefficient has been depicted after 1985 which is the
year of economic integration among SAARC nations.
4.6 Coulter Coefficient:
Another frequently used measure of income inequality is coulter coefficient which has been
calculated in Table 6.
1985 0.21 2006 0.03
1986 0.19 2007 0.05
1987 0.19 2008 0.00
1988 0.20 2009 0.03
1989 0.20 2010 0.04
1990 0.19 2011 0.05
International Journal of Social Science and Economic Research
ISSN: 2455-8834
Volume:02, Issue:05 "May 2017"
www.ijsser.org Copyright © IJSSER 2017, All right reserved Page 3541
Table 6: Coulter Coefficient
YEAR VALUE YEAR VALUE
1970 0.80562 1991 0.07546
1971 0.09227 1992 0.06065
1972 0.03506 1993 0.08886
1973 0.06468 1994 0.05434
1974 0.07240 1995 0.06173
1975 0.16307 1996 0.05189
1976 0.04696 1997 0.05199
1977 0.05567 1998 0.05597
1978 0.07813 1999 0.04160
1979 0.06458 2000 0.05558
1980 0.08306 2001 0.05946
1981 0.06806 2002 0.04913
1982 0.06756 2003 0.02472
1983 0.09335 2004 0.01409
1984 0.04517 2005 0.02954
1985 0.06153 2006 0.02889
1986 0.06286 2007 0.08365
1987 0.07882 2008 0
1988 0.05600 2009 0.03542
1989 0.04904 2010 0.06818
1990 0.05367 2011 0.05456
Source: Computed from the data collected from (http://databank.worldbank.org/data/reports.aspx?Code=NY.GDP.PCAP.CD&id=af3ce82b&report_name=Popular_i
ndicators&populartype=series&ispopular=y)
It can be observed from the values of Coulter coefficient in Table 6 that there has been a drop in
inequality among SAARC nations from 0.80562 in 1970 to 0.05456 in 2011 which goes in
favour of success of SAARC as a regional trading bloc. Whether the establishment of economic
cooperation goes in favour of SAARC nations – cannot be concluded from the results above,
because no significant change in the values has taken place after 1985; though the values have
steadily been falling, which advocates the positive outcome.
4.7 Hoover index:
Among all inequality matrices, Hoover index is the simplest to calculate. It refers to the
proportion of all income, which needs to be redistributed to reach perfect equality. ‘Hoover index
0’ refers to the state where no resources need to be redistributed, meaning there is perfect
equality. ‘Hoover index 1’ means all the resources must have to be redistributed from an entity to

International Journal of Social Science and Economic Research
ISSN: 2455-8834
Volume:02, Issue:05 "May 2017"
www.ijsser.org Copyright © IJSSER 2017, All right reserved Page 3542
all the sections, which refers to the state of perfect or maximum inequality. Hoover index has
been calculated for the present study in Table 7 using the formula stated above.
Table 7: Hoover Index
YEAR VALUE YEAR VALUE
1970 0.86608 1991 0.087376
1971 0.109526 1992 0.073320
1972 0.047382 1993 0.098804
1973 0.079329 1994 0.063371
1974 0.079339 1995 0.071161
1975 0.176396 1996 0.060753
1976 0.057845 1997 0.056241
1977 0.068668 1998 0.057773
1978 0.097813 1999 0.043350
1979 0.079094 2000 0.059485
1980 0.100069 2001 0.056962
1981 0.086017 2002 0.049007
1982 0.088381 2003 0.026241
1983 0.105271 2004 0.012526
1984 0.056693 2005 0.030126
1985 0.076097 2006 0.026510
1986 0.074632 2007 0.061542
1987 0.085757 2008 0.000000
1988 0.067859 2009 0.031993
1989 0.061791 2010 0.056872
1990 0.061912 2011 0.045431
Source: Computed from the data collected from
(http://databank.worldbank.org/data/reports.aspx?Code=NY.GDP.PCAP.CD&id=af3ce82b&report_name=Popular_i
ndicators&populartype=series&ispopular=y)
Like the values of Coulter coefficient, similar trend can be noticed for the values of Hoover
index. The overall variation has been falling as the value of the index falls from 0.86608 in 1970
to 0.045431 in 2011. But no prominent change has occurred after 1985 that can strongly support
the accomplishment of SAARC as an economic cooperation.
5. TREND IN INEQUALITIES OF GDP PER CAPITA FROM THE YEAR 1970 TO
2011:
In the present paper, the values of different inequality measures of GDP per capita have been
calculated for the study period (1970 to 2011). A trend line gives a clear idea about the trend in
values of different inequality measures over the years.

International Journal of Social Science and Economic Research
ISSN: 2455-8834
Volume:02, Issue:05 "May 2017"
www.ijsser.org Copyright © IJSSER 2017, All right reserved Page 3543
Figure 1: Trend line of GDP per capita for the Inequality Indices from (1970-2011)
Figure 2: Trend line of GDP per capita for Coefficient of Variation from (1970-2011)
It can be readily assured from the trend lines in Figure 1 and Figure 2 that the inequalities of
GDP per capita among SAARC nations have been declining over the years, which further

International Journal of Social Science and Economic Research
ISSN: 2455-8834
Volume:02, Issue:05 "May 2017"
www.ijsser.org Copyright © IJSSER 2017, All right reserved Page 3544
strengthen the possibility of consolidation among SAARC member countries. Because of the
large variation in the values of coefficient of variation (CV) from the values of other inequality
indices, a separate trend line has been drawn for the values of CVs in Figure 2.
6. CONCLUSION
This paper estimates variation or disparity among seven SAARC countries namely India, Nepal,
Bhutan, Pakistan, Srilanka, Maldives and Bangladesh using per capita GDP as the indicator from
the year 1970 to 2011. The paper investigates whether income inequality declines overtime
within SAARC member countries, which can be attributed as the significant result of economic
cooperation. The present study has not considered the factors responsible for such trends of
inequality/ equality of GDP per capita among member nations overtime. However, the inequality
measures considered here show steady decline in inequality in terms of per capita GDP. As none
of the disparity measures included in the present paper showed any positive trend, it can,
therefore, be asserted that there has been falling disparity or inequality among SAARC member
countries over the years. Whether the establishment of economic cooperation in 1985 contributes
in the favour of falling disparity, is still a debatable issue but the results of the inequality
measures confirms the declining inequality among SAARC.
REFERENCES
1. Barro, R.J. and Sala-i-Martin, X.(ed.) (2003), Economic Growth. MIT Press
2. Bhattacharya, B and S Sakthivel (2004), Regional growth and Disparity in India:
Comparison of Pre- and Post-Reform Decades. Economic and Political Weekly, Vol.39,
No.10, pp.1071-1077.
3. C. Duangkamon, Rao. D. S. and Tang, K. K. (2006), Estimating Income Inequality in
China Using Grouped Data and The Generalised Beta Distribution. Review of Income
and Wealth, International Association for Research in Income and Wealth, Vol.53(1),
Pages (127-147)
4. Chary, S. R. and Bohara A. K. (2010), Carbon emissions, Energy Consumption and
Income in SAARC Countries. South Asian Economic Journal, pp. 21-30
5. Dadibhavi, R V and S T Bagalkoti(2006), Reforms and Regional Inequalities in India.
Indian Economic Journal, Vol.54 (2), July-Sept
6. Dasgupta, D; P Maiti; R Mukherjee; S Sarkar and S Chakraborty (2000), Growth and
Interstate disparities in India. Economic and Political Weekly, Vol.35, No.27, pp.2413-
2422
International Journal of Social Science and Economic Research
ISSN: 2455-8834
Volume:02, Issue:05 "May 2017"
www.ijsser.org Copyright © IJSSER 2017, All right reserved Page 3545
7. Dey, S P and Neogi, D. (2015), Testing Sigma and Unconditional Beta Convergence of
GDP for SAARC Countries: Can inclusion of China further consolidate the convergence?
Global Business Review, Vol.16, No.5, October2015, pp. (845-855)
8. Ekanayake R. and Perera N. (2015), Stimulating Intra-regional Investment in SAARC: Is
a Regional Investment Agreement the way Forward?South Asian Economic Journal,
Vol.16, pp. 75S-101S.
9. Global Economic Data. GDP per capita, current prices,
(http://databank.worldbank.org/data/reports.aspx?Code=NY.GDP.PCAP.CD&id=af3ce8
2b&report_name=Popular_indicators&populartype=series&ispopular=y) Retrieved on
6th March 2013.
10. L P, Lusambo (2016), Household’s Income Poverty and Inequalities in Tanzania:
Analysis of Empirical Evidence Methodological Changes. Journal of Ecosystem and
Ecography, 6:2. http://dx.doi.org/10.4172/2157-7625.1000183, pp. (1-15)
11. M. Branko and Y. Shlomo (2002), Decomposing World Income Distribution: Does the
World Have A Middle Class?. Review of Income and Wealth, Vol-48, Issue 2, pp. (155-
178)
12. Mushtaq, M.; Ahmad, K.; Ahmed, S. and Nadeem, M. (2014), Impact of FDI on Income
Distribution in Selected SAARC Countries. Journal of Applied Environmental and
Biological Sciences, 4(7S)1-10
13. R, A. and H, S.(2009), An investigation into the inter- district disparity in West Bengal,
1991-2005. Economic and Political Weekly, Vol.44, issue no. 26-27, pp. 258-263
14. Ratna R. S. and Sharma S. K. (2016), Mega Trading Blocks: Is Time Ripe for ASEAN-
SAARC FTA? . South Asian Economic Journal, Vol.17, pp. 181-199
Top Related