


Languages
Pages
Legal

Albuquerque, New Mexico, August 2004
Measurement and Mobilization: Mapping the Institutional and Legal Spaces of
Subprime Mortgage Capital
Elvin K. Wyly
Tyler Pearce
Markus Moos
Holly Foxcroft
The University of British Columbia
April, 2007

Measurement and Mobilization: Mapping the Institutional and Legal Spaces of
Subprime Mortgage Capital
Abstract: Recent turbulence in U.S. financial markets has been explained partly in terms of
mortgage lending, with front-page news coverage of the esoteric securitization and
underwriting details of the high-risk, high-profit “subprime” market that primarily deals with
borrowers constrained by blemished credit. Yet the dynamics of subprime lending, and its role
in predatory financial exploitation of racially and ethnically marginalized peoples, have been
understood for many years among researchers, attorneys, and organizers in a movement that
has been growing since the 1970s -- the Community Reinvestment Movement. Unfortunately,
most of this knowledge comes either from rich local case studies of particular communities
(offering few comparative insights) or from detailed economic and regulatory studies at the
national level (ignoring regional and local variations). Little is known about the meso-scale: the
systematic penetration of subprime mortgage capital into the multiplicity of different cities and
neighborhoods across the United States.
In this paper, we map the American urban system in terms of the proliferation of subprime
mortgage lending. We use Brian J.L. Berry’s (1972) City Classification Handbook to inspire
contemporary questions of analysis and activism: how can we classify the different social and
institutional settings in which subprime and predatory lending take place? How can we
classify the new system of regulation created by long-term organizing to demand action from
state legislatures? We analyze the new loan-pricing data in the Home Mortgage Disclosure Act
files to produce geographical “thick descriptions” of lending regimes that remain local and
contextual even in the face of integration into transnational capital markets. We find that places
marginalized by older types of denial-based credit exclusion are also woven into newer
processes of stratified, exploitative credit inclusion -- whether measured at the metropolitan or
neighborhood scale. We also find evidence, via multivariate analysis of loan-level credit
decisions, that the evolving landscape of state legislation has significantly altered the
geographical contours of discriminatory segmentation into high-cost subprime lending.
1
K Street, Wall Street, Main Street
Three weeks after the U.S. Presidential election of 2004, a prominent group of bankers,
lobbyists, and public-relations consultants gathered in Washington, DC. The meeting
agenda centered on a series of esoteric changes to the rules implementing the Home
Mortgage Disclosure Act (HMDA) of 1975. After several years of regulatory delay in
the face of competing demands from the lending industry and community
organizations, the Federal Reserve Board had finally mandated the addition of a few
data fields in the annual HMDA submissions required of most of the nation’s mortgage
lenders. For the first time, the disclosures for applications received in 2004 would
specifically identify many of the high-cost loans that had proliferated in the risky
market for “subprime” or “B-and-C” credit, so named because of the low incomes and
poor credit of many borrowers unable to qualify for competitively-priced prime, A-
rated loans. By November, 2004, the impending public release of preliminary data was
adding new fuel to the fire of long-running public controversy over lenders’ treatment
of racial and ethnic minorities. For more than twenty years it has been widely
recognized that African Americans (and, to a lesser extent, Latinas and Latinos) have
much higher denial rates for most conventional loans, and with the growth in the
subprime market it was also clear that minorities who did succeed in getting loans were
much more likely than non-Hispanic Whites to receive high-cost loans, and to be targets
of exploitative, “predatory” lending schemes. A growing body of research at the nexus
of economics, law, and public policy also explains the paradox of lucrative profits
extracted from low-income, risky borrowers: many lenders and brokers earn their
revenue from immediate up-front fees, while longer-term risks are distributed through
complex securities pathways when the loans are packaged and sold to investors in
varied risk “tranches”; in a climate of low interest rates and rising home prices,
repeated refinancing with the same borrower to pull out multiple rounds of fees --

2
equity stripping -- is just one of the many ways that profits can continue to flow even as
borrowers sink further into debt until eventual foreclosure (see Calem et al., 2004; Engel
and McCoy, 2002, 2004; Howell, 2006; Immergluck, 2004; and Renuart’s [2004]
frightening chart, “How to Eliminate Home Equity in Four Easy Steps,” p. 486).
Nevertheless, despite this growing body of knowledge, until the release of the 2004
HMDA there were few consistent ways to track racial inequalities in high-cost loans; the
industry’s partisans disputed all definitions of predatory and dismissed the multitude
of documented cases of abuse and deceptive practices as anecdotal. The new data
promised to alter this debate. To be sure, the new data had significant limitations.
Loans are reported as high-cost only if they meet specified “rate-spread” triggers (total
interest and finance charges three percentage points above comparable Treasury yields
for first-lien loans, five points for subordinate liens); moreover, lenders had successfully
fought community organizations’ demands to report applicant credit scores, a factor
that lenders and conservative analysts never fail to cite to justify minorities’ greater
denial rates and segmentation into high-cost credit. Now the industry lobbyists in
Washington were hard at work formulating media strategies to challenge the new
HMDA data precisely because it did not include credit scores (see also Immergluck,
2004, pp. 218-219). One of the trade group presidents complained to a reporter for the
American Banker that the absence of credit history data meant that “People are going to
take this data and draw alarmist and incorrect conclusions with this without complete
information.” (Paletta, 2004). Regulatory counsel for another trade group described the
strategy: “What we don’t want is one group that is saying something that is slightly
different from what another group says.” (Paletta, 2004).
The fears of the lobbyists meeting in Washington in November, 2004 were justified. The
next few years brought a growing wave of intense press coverage, fair-housing
litigation, well-orchestrated activist protest, and high-impact scholarly research on

3
subprime lending, racial credit discrimination, and predatory financial practices (Avery
et al., 2005; Engel and McCoy, 2004; Immergluck, 2004). Even in the prevailing pro-
industry climate of Bush’s Washington, there were signs of belated regulatory wake-up
calls. Based on the 2004 HMDA data, the Federal Reserve Board found sufficient
statistical significance in the lending patterns of 200 institutions to undertake referrals
for further regulatory examination. The 2005 data posted a 70 percent jump in the
number of subprime originations, and showed that 54.7 percent of African American
homebuyers received high-cost loans, compared to 17.2 percent of Non-Hispanic
Whites; analysis of the 2005 HMDA led the Federal Reserve to refer 270 lenders for
investigation. (Origination News, 2006, p. 81).1
The ideological factories built to manufacture consent along K Street, Washington’s
famous lobbyist corridor, worked to insulate the home finance industry from the
increased political and regulatory fallout at the federal level. But the financial politics
of state legislatures and Wall Street presented different challenges. In early 2005, then
New York Attorney General Eliot Spitzer began an investigation into the severe racial
disparities apparent from the HMDA reported by several large national lenders under
his jurisdiction: Citigroup, JP Morgan Chase, Wells Fargo, and HSBC (Parker, 2005).
Spitzer’s request was narrowly tailored to obtain exactly that kind of internal
underwriting data (including applicant credit history) that lenders always cite as
justification for the severe racial inequalities visible in their public HMDA disclosures;
Spitzer was, in other words, asking the banks to share the information that would
exonerate them on charges of discrimination if (as they claimed) their business practices
1 Researchers also noted that “piggyback” loans -- first- and second-lien originations made
simultaneously to help a borrower qualify for an expensive purchase while avoiding mortgage insurance
-- were increasing particularly fast for higher-income borrowers seeking loans for properties in lower-
income neighborhoods: “...HMDA appears to show that investors as well as homebueyers are taking out
piggyback loans to purchase homes in neighborhoods going through the gentrification process.”
(Origination News, 2006, p. 81).

4
had no disparate racial impacts. After several weeks of stonewalling, the four lenders
had their trade group (the Clearing House Association) file suit against Spitzer. The
federal Office of the Comptroller of the Currency filed a separate complaint against
Spitzer’s investigation. Eventually, the two complaints were consolidated, and in a pair
of opinions issued by the U.S. District Court in Manhattan, Spitzer was ordered to
abandon his pursuit of the lenders’ internal data. Such information-gathering was
defined as regulatory “visitation” and thus an exclusively federal prerogative under the
National Bank Act of 1864 (Stein, 2005).
But one of the protagonists escaping from Spitzer’s HMDA investigation would
eventually confront the much more powerful discipline of the global financial markets.
HSBC, the upscale British banking empire, had only appeared on Spitzer’s radar screen
because of its acquisition of Household International, the notorious and single largest
subprime originator in the U.S. When announced in late 2002, the $14.2 billion deal
shocked analysts who had not fully grasped the appeal of subprime profits for even the
most elite, gold-plated bank emblems: “I think of HSBC as a very Presbyterian
company -- squeaky clean,” quipped one surprised analyst, while another explained
that “Basically, this is all about capital.” (Sorkin, 2002, p. C10). Wall Street’s romance
with the high profits of subprime lending flowered through the housing boom, as long
as steadily rising home prices masked the deteriorating finances of maxed-out
homeowners. But in 2006 the market turned as hundreds of thousands of adjustable-
rate teaser loans re-set to higher payments just as home prices stagnated and fell in
many markets. By the third quarter, 12.6 percent of all subprime loans were more than
30 days delinquent, and a barrage of negative earnings reports hammered the stock
prices of major subprime lenders (Twiddy, 2007). By one estimate, foreclosures jumped
42 percent between 2005 and 2006 (data cited by Sen. Christopher Dodd, CBC News,
2007). In early February, 2007, HSBC became the latest and most prominent company

5
to warn investors about its subprime romance gone sour, signaling that it was boosting
its loan-loss reserves by 20 percent, to $1.76 billion. HSBC officials tried to calm
investors unnerved by the “unprecedented profit warning” (Tam, 2007) by emphasizing
that the earnings risks were confined to U.S. operations -- and more specifically, to the
sooner-than-expected defaults of subprime notes originated in 2006. London analysts
were unconvinced, and Wall Street pundits grew even more suspicious. HSBC
announced a management shakeup, and in a departure from its usual practice of
declaring earnings separately in London and Hong Kong, the Chairman and Chief
Executive planned to meet in London for the high-stakes earnings announcement (Tam,
2007). HSBC is Europe’s largest bank, but suddenly its position as the second-largest
U.S. subprime lender made it the poster child for the financial press chronicles of
irresponsible lending. And so when rumors of a Chinese government crackdown on
debt-financed stock purchases spurred a nine percent nosedive on the Shanghai index
on February 27, a day after former Federal Reserve Chair Alan Greenspan uttered the
word “recession” in a private chat by satellite with an investor group in Hong Kong
(Andrews, 2007a), analysts cited the spreading risks of the subprime market to explain
Wall Street’s 415 point slide in the Dow (Andrews, 2007b). The New York Times’
breathless lead -- “Stock markets around the world plummeted yesterday in a wave of
selling ...” was followed only a few paragraphs later by the diagnosis that “In America,
the selling seemed to add to worries that a decline in the housing market, and problems
in particular with loans to risky borrowers, could spill over.” (Norris and Peters, 2007,
p. A1). The same day, Freddie Mac announced a further tightening of its criteria for
purchasing bonds backed by subprime loans (Bajaj, 2007). Lukewarm results the next
day calmed fears of a wholesale transnational market meltdown, but unease persisted:
“One important concern -- that Wall Street’s bet on home loans to people with weak, or
subprime, credit is souring quickly as defaults rise and home prices weaken -- has not
gone away.” (Anderson and Bajaj, 2007, p. C1).

6
Remarkably, in a very few years, “subprime” and “predatory” mortgage lending had
moved from the specialized domain of housing research, banking regulation, and the
marginalized voices of civil rights activism to front-page, above-the-fold coverage of the
fears of millions of investors. Federal Reserve Chairman Ben Bernanke had to reassure
members of the House Budget Committee that problems in the subprime sector gave no
sign of bleeding into the broader housing and financial markets (Andrews, 2007a). But
other observers were more troubled by the volume of subprime credit ($600 billion in
new loans in 2006, a quarter of all mortgages issued that year) and the exposure of
deep-pocket investment banks to the dangers of rising delinquency, default, and
foreclosure. One analyst told the Times, “It is impossible to get a number” to gauge the
investment banks’ subprime vulnerability. “...And I don’t think they even know.”
(quoted in Anderson and Bajaj, 2007, p. C1).
London. Washington. New York. Wall Street. Hong Kong. The bylines read like the
roster of globalization and world-cities research, an area of inquiry that has burgeoned
over the last two decades to transform our understanding of urbanization, transnational
relations, and geographical scale (Cox, 1993, 1998; Friedmann, 1982; Knox and Taylor,
1995; Sassen, 2001, 2002; Smith, 1998, 2001; Taylor, 2003; and hundreds of publications
produced through the GAWC network, GAWC, 2007). But if the business-press
narratives of predatory lending suggest a global-city hierarchy -- centered, perhaps, on
New York as the capital of capital and Washington, DC as the pre-eminent political
“metropolitan talk machine” (cf. Thrift, 2004) -- then we should be wary of the
dangerous top-down bias of the world-cities literature, with its obsessive and often
misleading fascination over New York, London, Tokyo, and other cities aspiring to join
the triad.
7
What about the “black holes” -- the cities bypassed by the familiar indicators of global
capital investment, or simply overlooked, ignored, and relegated to invisibility when
trends are summarized at the regional or national level (Short, 2004)? What about the
mundane, ordinary places that shoot to the top of the rankings when we choose
indicators of the worst kinds of things? Because if we simply tabulate the incidence of
rate-spread loans reported in the HMDA data that so concerned those lobbyists meeting
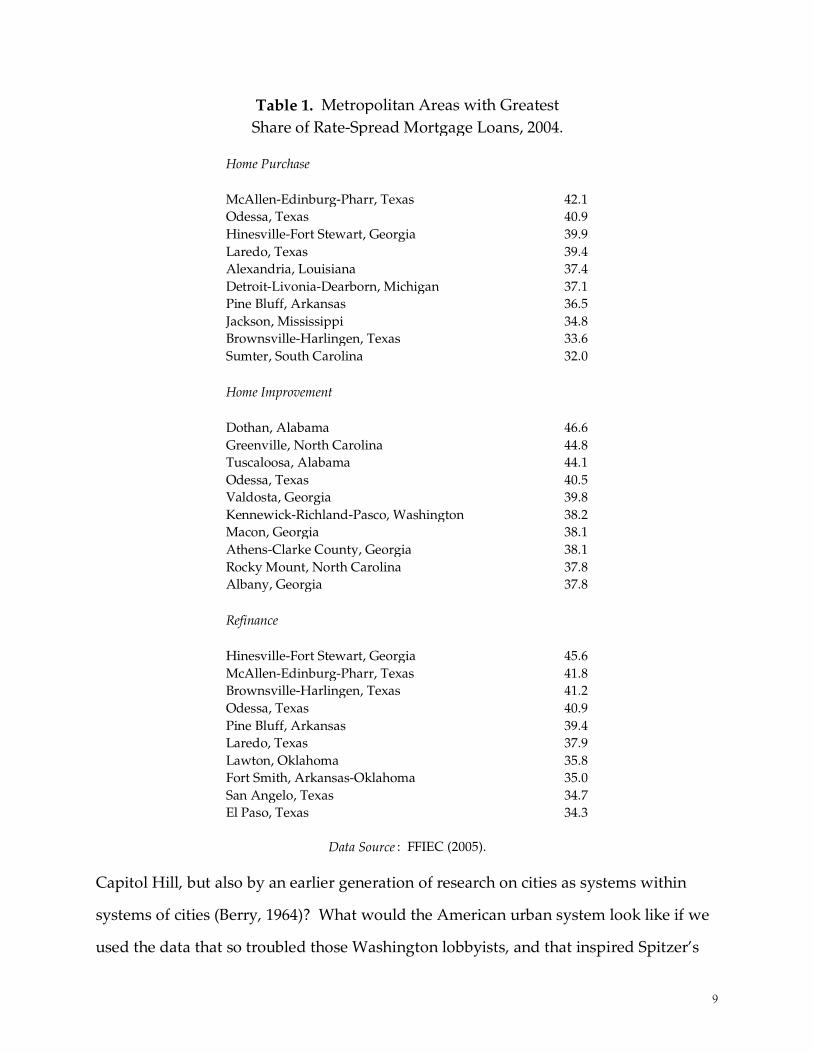
in Washington, we see a striking and unfamiliar urban hierarchy (Table 1). In the home
purchase market, the nation’s capital for subprime capital is McAllen, Texas, where 42.1
percent of all homebuyers received rate-spread loans. “Many areas of the United States
look for distinctiveness in ways that portray them as ‘Number One,’” begins a report
from researchers at the University of Texas-Pan American, but this region earns first-
class status on a troubling suite of benchmarks -- highest unemployment, lowest per
capita income, highest volume of border drug seizures, greatest concentration of low-
income enclaves (colonias) housing the nation’s largest population of migrant farm
workers (Richarson and Pagan, 2002, p. 2). In the home improvement market, the peak
of the subprime hierarchy is Dothan, Alabama, once cited in passing by Reynolds Farley
as a place so poor (with such a low cost of living) that anyone living there who was
fortunate enough to have an income at the federal poverty line could actually expect a
reasonable standard of living (cited in Jennings, 1994, p. 12). In the refinance market,
subprime lenders’ global city is Hinesville-Fort Stewart, Georgia, a town half an hour
southwest of Savannah that is home to the Army’s largest installation east of the
Mississippi; service members and their families account for about two-thirds of
Hinesville’s population (Surran, 2007).
In this paper, we seek to explore these oft-overlooked cities and regions -- the ordinary
places where the experiences of millions of homeowners and homebuyers are at least
partly shaped by the decisions of investment bankers and securitization consultants on

8
Wall Street, by the strategies of the lobbyists who met in Washington to plan their
response to the anticipated bad news from the new HMDA, and by legislators
negotiating the multiplicity of competing interests in the politics of profit, regulation,
disclosure, and equity. Our empirical analysis centers directly on the 2004 HMDA
records themselves. HMDA plays a central role in a vast, interdisciplinary literature on
mortgage market inequalities, and hundreds of researchers have analyzed these data for
various years and at different scales (e.g., Calem et al., 2004; Dymski, 1999; Holloway,
1998; Immergluck, 2004; Ross and Yinger, 2002; Williams et al., 2005). With few
exceptions, though, either ignore geography by casual aggregation (or through the
dismissive use of dummies or “fixed effects” to control for -- i.e., suppress --
geographical variation) or opt for in-depth studies of individual states, cities, or
neighborhoods. Relatively little is known about the meso-scale, middle-ground -- about
the overall prevalence of mortgage market inequalities throughout the national urban
system, in which hundreds of metropolitan areas, and many thousands of
neighborhood housing markets, are integrated into the economics and politics of capital
investment and regulation at the state, national, and transnational scales. And so our
exploration of the 2004 HMDA, with its new loan-pricing information, is motivated by
these kinds of questions: What does the landscape of subprime and predatory lending2
look like if the view is shaped not only by the global-cities view of Wall Street and
2 Although we use both “subprime” and “predatory” throughout this paper, we do recognize that
subprime credit does serve a legitimate need for many borrowers unable to meet the underwriting
requirements of mainstream, prime lenders. In previous years these borrowers were excluded from
formal credit markets, whereas today they can obtain loans if they are willing to pay higher borrowing
costs. Yet the subprime sector provides fertile ground for a wide range of undisputably abusive and
deceptive practices, and industry partisans often defend predatory practices simply by sowing
terminological confusion and rejecting all attempts to define predatory. The task of empirically
separating legitimate subprime and predatory loans in the HMDA is beyond the scope of our analysis in
this paper, but we do maintain that high market shares for rate-spread products do suggest problems.
For a clear, rigorous set of criteria to define predatory market relations, see Engel and McCoy (2002).
9
Table 1. Metropolitan Areas with Greatest
Share of Rate-Spread Mortgage Loans, 2004.
Home Purchase
McAllen-Edinburg-Pharr, Texas 42.1
Odessa, Texas 40.9
Hinesville-Fort Stewart, Georgia 39.9
Laredo, Texas 39.4
Alexandria, Louisiana 37.4
Detroit-Livonia-Dearborn, Michigan 37.1
Pine Bluff, Arkansas 36.5
Jackson, Mississippi 34.8
Brownsville-Harlingen, Texas 33.6
Sumter, South Carolina 32.0
Home Improvement
Dothan, Alabama 46.6
Greenville, North Carolina 44.8
Tuscaloosa, Alabama 44.1
Odessa, Texas 40.5
Valdosta, Georgia 39.8
Kennewick-Richland-Pasco, Washington 38.2
Macon, Georgia 38.1
Athens-Clarke County, Georgia 38.1
Rocky Mount, North Carolina 37.8
Albany, Georgia 37.8
Refinance
Hinesville-Fort Stewart, Georgia 45.6
McAllen-Edinburg-Pharr, Texas 41.8
Brownsville-Harlingen, Texas 41.2
Odessa, Texas 40.9
Pine Bluff, Arkansas 39.4
Laredo, Texas 37.9
Lawton, Oklahoma 35.8
Fort Smith, Arkansas-Oklahoma 35.0
San Angelo, Texas 34.7
El Paso, Texas 34.3
Data Source : FFIEC (2005).
Capitol Hill, but also by an earlier generation of research on cities as systems within
systems of cities (Berry, 1964)? What would the American urban system look like if we
used the data that so troubled those Washington lobbyists, and that inspired Spitzer’s

10
failed attempt to hold banking empires accountable, to produce a contemporary version
of Brian J.L. Berry’s (1972) City Classification Handbook? And what are the results of a
large, diverse Community Reinvestment Movement, with activists and attorneys
working at different scales to challenge the scourge of predatory lending? Have their
efforts led to any successes in changing the nation’s urban system of financial
exploitation?
The rest of our analytical narrative proceeds in five sections. First, given the central,
controversial role of classification and related statistical techniques in the classical urban
systems literature, we explain why we believe these modes of analysis hold promise as
strategic tools for mapping and mobilization. Next, we use a few of the standard
urban-systems techniques (augmented with short interpretive vignettes) to classify all
of the nation’s metropolitan areas according to their penetration by subprime mortgage
capital. Next, we replicate this analysis at the census tract scale. We then analyze the
interplay between these neighborhood and metropolitan geographies and legal
developments in state legislatures, where most of the recent efforts to fight predatory
exploitation have achieved success; we use a blend of multivariate taxonomy and logit
regression to measure the results of the Community Reinvestment Movement’s work on
the likelihood that borrowers will be saddled with high-cost subprime loans. In the
final section we summarize our findings and the implications for analysis and activism.
Linnaeus to Lunatics: Classification, Cities, and Communities
“At that time, all computations had to be done by hand; Tryon was later to
speak of his mis-spent youth, because too much of his time had been spent
with a desk calculator. In the 1950s the practice of cluster analysis was
restated in computer terms to enable the investigator to escape from hand
11
calculations. Tryon and Bailey therefore planned this book to be the
definitive account of postcomputer cluster analysis. The manuscript was
almost finished when Tryon died suddenly in 1967.” Charles Wrigley
(1970, p. v.)
Our goals in this paper are to explore the landscapes of subprime and predatory home
lending in the American urban system, to classify the different kinds of local credit
regimes created by the dynamics of mortgage capital, and to develop a series of
taxonomies that have some relevance to researchers, regulators, and organizers
working in the Community Reinvestment and Fair Lending movements (AFFIL, 2007;
Squires, 2003, 2004). But classification and taxonomy have become quite controversial --
even as these practices have become so pervasive that they are almost hidden in plain
sight, practiced not by scholars laboring with “desk calculators” but by automated
software bots sifting through streams of data on the lives of consumers, workers, voters,
patients, donors, children, families, travelers, and so many other fragmented shards of
the “digital individuals” (Curry, 1997) created by the information society. Before we go
any further, therefore, we wish to explain why we are willing to accept the risks of this
approach.
The essence of classification -- separating things into different categories based on
various characteristics of those things -- changed little from the time of Aristotle
through the eras of Carolus Linnaeus and Charles Darwin; what made the work of
Linnaeus and Darwin revolutionary was not the principle, but its application to new
kinds of questions and processes. The work of Karl Pearson and Charles Spearman in
the early twentieth century, though, created a formal mathematics of classification,
allowing the practice to proliferate with the development of factor analysis and other
permutations of correlation analysis in the 1930s. The approach spread rapidly in
12
psychology and other fields with an interest in individual-level behavioral themes, but
it also played a prominent role in the portrayal of places as objects ready to be
categorized: Robert C. Tryon, a psychologist at Berkeley and one of the leading figures
in the development of the methodology, deployed it to make sense of the new census
data for more than three hundred neighborhood areas (census “tracts”) in the San
Francisco Bay Area (compare Tryon, 1955, with Shevky and Bell, 1954). The impulse to
classify regions, cities, and neighborhoods swept through vast areas of geography,
sociology, and planning in the 1960s, as formalized statistical frameworks and the
development of the digital computer allowed analysts to provide new kinds of
engagements between abstract-deductive theory, empirical hypothesis-testing, and
inductive exploration (Abler, Adams, and Gould, 1971; Berry, 1964; Berry and Kasarda,
1977). Indeed, much of the urban literature of that era could be understood as a
computer-assisted, statistical-intensive reworking of a previous generation of
interpretive, qualitative ways of classifying cities and urban processes (see Harris, 1943,
and Nelson, 1955). Yet automation in these years was itself a vocation of highly skilled
craft labor, and Tryon’s mis-spent youth led to late-middle-age frustrations with the
destabilizing creative destruction wrought by advances in computer hardware and
software. Daniel Bailey, one of Tryon’s students and collaborators, reflected that
“All of these changes have been painful to a certain extent .... We went
from the IBM 701 to the IBM 704, to the IBM 7090, the IBM 7094, to the
CDC 6400 and at Colorado from the 7090 to the IMB 709. ... changes in
computer operating systems and programming languages have been more
frequent than changes in computer. As a consequence, the productive
work is somewhat less than half of what would have been accomplished
under stable computer conditions. Perhaps that is progress, but it
reminds one of the pioneers who struck out due west only to have to keep
13
changing their route because of impassable mountain ranges and deserts.”
(Bailey, 1970, p. xiii.)
For those willing to endure the logistical and administrative challenges, though,
classification-oriented cluster analysis soon became an indispensable instrument in the
toolbox of general linear model statistical inference, and helped analysts organize a
growing volume of governmental information about industries, regions, cities, and
neighborhoods. The movement attained its pinnacle with the 1972 publication of the
City Classification Handbook, a collected edited by Brian J.L. Berry and featuring
contributions by Terry Nichols Clark, Leslie King, Robert Murdie, Leo Schnore, and
several other urbanists of past or future fame and fortune (Berry, 1972). But even at this
watershed moment, much of the analytical optimism was tempered by a realization that
classification might never deliver the Kuhnian paradigm shifts sought by so many in
the new generation of geographers. The first lines of Berry’s introductory essay were
uncharacteristically cautious and modest:
“Why should anyone be interested in classifying cities? To those of an
unremittingly scientific frame of mind classificatory exercises are at best
limited, a primitive beginning beyond which, they feel, social science has
developed. Yet it is equally true that we would never have learned
anything if we had never thought how objects resemble each other, and
whether they manifest the same properties. If every object in the world
were taken as distinct and unique, our perception of the world would
disintegrate into complete meaninglessness. The purpose of classification
is to give order to the things we experience. We classify things so that we
may learn more about them.” (Berry, 1972, p. 1).

14
Three decades before Berry found himself irretrievably under siege from a generation
influenced by poststructuralism (which he certainly did regard as disintegration “into
complete meaninglessness”), he felt the need to defend inductive statistical techniques,
and even a certain amount of good old-fashioned urban-regional description -- to those
hardcore scientists concerned with the urban only insofar as it reflected one
“universally true typology.” (Berry, 1972, p. 2). “If such a true typology existed,” Berry
pointed out, “there has surely been enough urban research in the past century for it to
have revealed itself by now.” (Berry, 1972, p.2).
Still, even the best contextualized descriptive research became more difficult and
unpopular in the years after the City Classification Handbook. Methodological innovation
in the mathematics and inferential statistical aspects of cluster analysis led to a dizzying
array of new clustering algorithms. Each produced a different clustering solution,
seemingly valid according to its own particular routines of hierarchical agglomeration
(putting similar things together in progressively larger groups) or non-hierarchical
partitioning (dividing an entire set of observations into a specified number of groups).
Which algorithm do we use? Why? How can we determine the correct or optimal
classification for complex human creations like cities, which have no clear a priori
criteria to tell us how many “real” categories to look for in the messy confusion of
imperfect, limited empirical measures we have available?
These troubling foundational questions could not be ignored. Even as the pragmatic
utility of cluster analysis made it increasingly popular in geo-demographic analysis,
marketing, and a wide range of other applied industry studies, it acquired pariah status
in social-science fields concerned with positivist explanation and then non-positivist
epistemological commitments. The most devastating critique came not from post-
positivist critical social theory, however, but from Peter R. Gould, a geographer with

15
considerable mathematical expertise. In an essay first published in a 1981 collection
titled Future Trends in Geomathematics and revised for a more biographical volume
published shortly before his death (Becoming a Geographer), Gould dismantled the
analytical and interpretive illusions created by the mechanical procedures of
“partitional thinking.” Gould charged that cluster analysis severed the connections
between things, that it obscured underlying relations of context, spatial location, and
process, and that the first steps of choosing variables had the effect of defining and
creating the space of observation and interpretations. All the reams of numerical
output produced by the mindless iteration of whatever algorithm was chosen had no
real meaning, then, but helped to sustain a dangerous tautology.
Gould developed a pedagogical example from the work of geologists studying the
distribution of foraminifera, tiny organisms with skeletons of calcium carbonate that
accumulate in sedimentary rock sea-beds. Gould scrutinized the categories produced
by Graeme Bonham-Carter in the 1960s, who had adapted data from samples taken by
another geologist, Jacob Houbolt, in the Persian Gulf during the 1950s; Bonham-Carter’s
concern was to sift through Houbolt’s field observations “as a concrete example of how
to use the new computerized clustering algorithm that was then all the rage.” (Gould,
1999, p. 295). Gould explained the multiple biases that crept into Bonham-Carter’s
selective, flawed analysis of the original data, and the ultimate verdict on the clustering
approach is unequivocal and unforgiving:
“...what we have here is a piece of algorithmic partitional nonsense. The
process reminds one of a lunatic hacking apart a pumpkin with a
broadaxe, and notice how intellectually seductive the results are. Points
that are close together in the pieces hacked apart were definitely close
together in the pumpkin, no matter where the cuts where made. Because

16
one fact is tautologically indisputable, given our original, tightly
connected ‘foraminifera pumpkin’: No matter what clustering routine is
applied, points close together in the space (pumpkin) will often appear in
the same groups (pieces hacked apart). But the real question is whether
we should be hacking around with pumpkins in the first place.” (Gould,
1999, p. 298).
Gould’s image of the lunatic and the pumpkin offer a sobering reminder of the dangers
of automated statistical algorithms. Yet there are at least four reasons to reconsider the
harsh verdict on classification-oriented cluster analysis. First, the weaknesses of
multivariate numerical taxonomy for causal explanation are precisely those features
most investigators consider crucial for rigorous description: the approach is flexible and
versatile, and is readily suited to messy, confusing jumbles of information about new
things or relationships that may not conform to any neatly-packaged conventional
wisdom. In other words, classification and cluster analysis can still provide
considerable insight with samples that depart from multivariate normality, and in
situations where it is not entirely clear whether the underlying causal relations involve
(non)linear or (non)recursive linkages. Taxonomic procedures simply divide the
observations in a dataset according to any number of variables describing each
phenomenon (Q mode) or distinguish variables on the basis of the observations they
measure (R mode). Second, no particular classification method is inherently superior or
correct: there are only different methods and solutions, and it is the investigator’s
choice which one to use in a given situation. Although there are multiple statistical
benchmarks to measure different cluster solutions from separate algorithms, in the end,
any use of the method is inescapably qualitative -- and thus requires and allows care,
subjectivity, and judgment. Amidst the pitched battles of geography’s quantitative
revolution thirty years ago, the objectivity/subjectivity divide marked out the trenches

17
of hostile territory among influential, interdisciplinary paradigms. But if we are
prepared to accept the interplay and interdependence of subjective interpretation
tempered by formalized hypothesis testing, then the variety of clustering algorithms
developed over the last forty years replaces bewildering confusion with a menu of
possibility and creativity. In this sense, the enterprise of taxonomy neatly encapsulates
a broader shift in the conditions of possibility for quantitative spatial analysis in general
-- from an assumed position of privilege in the 1960s search for universal laws of spatial
relations, to a more pluralist regime today marked by what Jessie Poon (2003, 2004,
2005) aptly describes as “methodological legislation.” The inescapably subjective
contingencies of this legislative process are quite clear to many of the specialists (mostly
outside the social sciences) who continue work refining various clustering
methodologies (e.g., Tibshirani and Walther, 2005; Tibshirani et al., 2001; Finch, 2005).
Third, cluster analysis is especially well suited to viewing observations from different
perspectives. The connections severed by Gould’s pumpkin-hacking lunatic are indeed
troubling if they distract us from underlying processes, causal interdependencies, or
genealogical ties among various phenomena. But the brilliance of Gould’s narrative
emerges through his juxtaposition of a superficial taxonomic exercise alongside a
contextual, geographical analysis of where things happened -- explaining the processes
that produced the connections between seemingly separate observations. But in many
circumstances, we do want to sever connections for a moment, to see how McAllen,
Texas is connected to Dothan, Alabama, and Hinesville, Georgia. We’ll miss these
connections if we focus solely on proximity and regional setting. Classification and
cluster analysis allow us to define these connections in new and different ways.
Finally, a fourth reason to consider the approach involves questions of meaning and
epistemology. The choice of variables defines the multiple-dimensional space of
18
observation and measurement -- creating the bounds of statistical meaning that frame
every subsequent step of whatever clustering algorithm we might consider. Since
social-science data are always partial, imperfect, and contested creations that falsely
claim to reflect an objective reality, the argument goes, the space within which the
analysis take place is automatically and epistemologically suspect: neutral, objective,
value-free statements about the external world are utterly impossible in a space created
by the investigator’s construction of the dimensional axes of two, three, four ... however
many dimensions (s)he decides. But who wants to analyze anything stripped of all
values, meaning, and human significance? Despite repeated caricatures of “positivist”
geography (see especially Rob Kitchin’s 2006 re-run of the tired old debates, and his
assessment that “unreconstructed positivist geography is secure” thanks to the market
demand for GIS) many scientific geographers have been deeply influenced by non-
positivist epistemologies (see Poon, 2005 for a review). But to say that science is
constructed, contested, and negotiated is not particularly helpful if that’s where the
critique ends; some constructions are more useful and appropriate than others, and
some constructions are unquestionably dangerous (see Latour’s 2004 reaction to the
manufactured uncertainty of the Republican operative Frank Luntz). And so the
inescapable construction of the spaces defining cluster analysis -- and indeed all general
linear model inferential statistical procedures -- does not automatically invalidate the
approach. Instead, critical constructivist insights force us to accept responsibility for
defining and creating certain spaces, observing and measuring some things and not
others, and drawing particular connections that we judge to be important. In this
paper, such epistemological considerations are especially important. The notion of
“laws” in positivistic geography (Kitchin, 2006) suddenly imply different things if we
consider Poon’s (2003, 2004, 2005) formulation of methodological legislation. We are
not in search of physics-like laws of economics or space; but we do care very much
about the legal work done by those lobbyists in Washington, DC, as well as by
19
progressive attorneys pursuing discriminatory and predatory lenders (Relman, 2004),
and by all the groups and individuals involved in the passage of legislation to protect
consumers from this new breed of “Loan Sharks in Pinstripes” (Page, 2004).
Cooperation, competition, and conflict among all of these different actors helps to
define the spaces in which mortgage lending takes place: indeed, the organization and
activism of the Community Reinvestment Movement created HMDA in the 1970s,
making it possible to use statistical methods to describe, analyze, and mobilize against
interests who could previously hide behind the cloak of (statistical) invisibility. And, as
we will see, recent progressive moves to challenge the rules of the game have begun to
have measurable effects on the unequal segmentation of some borrowers into the
higher-cost, higher-risk subprime loan channel.
Mobilizing Mesos
Choosing a scale of analysis is a crucial first commitment in the design of any kind of
social research. Confronted with this important initial decision, most investigators
choose one of two very different paths: studying a few things in great detail at close
range and perhaps over a long period of time, or studying many things (either
qualitatively or quantitatively) in ways that allow broad generalizations and
abstractions. These two paths roughly correspond to Massey and Meegan’s (1985)
distinction between extensive and intensive research, although we would dispute the
way they intertwined dichotomies of scale and method (extensive=quantitative,
intensive=qualitative). Unfortunately, regardless of method, scale choices often obscure
the middle-range realm of analysis, where the challenge is to pay careful attention to a
few things while placing them in the context of many large-scale events or processes
that we must summarize. Mesos matters, and nowhere is this more important than in
the realm of American housing finance, where trading in mortgage-backed securities
20
now exceeds that of the U.S. Treasury securities market. It is easy to see what is
happening in the local housing market in our neighborhood or city, and it is not too
difficult to keep up with the streaming headlines from Wall Street or the seemingly
abstract space of flows (Castells, 1997) of the global stock exchanges. But hidden in
plain sight is the mesos of many specific places that are systematically linked together in
large-scale economic and political processes that stretch far beyond the capacity for
direct engagement in Massey and Meegan’s (1985) vision for ‘intensive’ research. As a
consequence, research and policy in the Community Reinvestment Movement has (with
a few exceptions, especially Li and Ernst, 2006) split into separate narratives: one
describes particular places; the other describes detailed processes (financial, political,
regulatory) at the broad, national level. But subprime and predatory lending are
quintessentially meso-scale processes, in which the intimate, intensive local knowledge
of loan officers and brokers is bound up with the higher-scale, extensive abstract views
of regional lending managers, national-bank strategists and portfolio analysts, and Wall
Street mortgage-backed securities advisors, attorneys, and traders. Together, all of
these actors work to create and profit from a metropolitan urban system of subprime
and predatory mortgage capital.
To map this evolving metropolitan system, we draw on the approaches used so widely
in the urban systems and factorial ecology literatures of the 1960s and 1970s (see Berry
and Kasarda, 1977). We aggregated all of the single-family application records in the
2004 HMDA (approximately twenty million observations) to the metropolitan level,
before calculating a handful of simple measures of regional mortgage outcomes --
denial rate, FHA market share, racial/ethnic composition of lending flows, and of course
the newly-available information on high-cost, rate-spread loans. Our list of variables is
deliberately short for this part of the analysis: we want to know if the mortgage market
itself hints at deeper, structured regional geographies -- even if we ignore measures of

21
industrial structure, immigration, and all the other processes that create and reproduce
housing and credit markets. The eigenvalues from a simple principal components
analysis suggest retaining four leading axes, which account for a cumulative 73.2
percent of the variance of all thirteen measures across 387 metropolitan areas (Table 2).
The intercorrelations among these factors and the original measures highlight several
interesting aspects of regional mortgage dynamics. First, note that all of the rate-spread
indicators load strongly onto the first component, with high-cost lending more
prevalent in areas with greater market share for FHA-insured loans, higher
conventional denial rates, and higher shares of African Americans and mobile homes.
In other words, the new inequalities of subprime credit captured in the
Table 2. Ecology of Mortgage Lending in the U.S. Metropolitan System, 2004.
Unweighted, unrotated principal components
Variable I II III IV Communality
FHA share of all applications 0.572 -0.119 0.009 0.217 0.388
Denial rate, conventional applications 0.841 -0.227 -0.052 -0.019 0.761
Home improvement share of all conventional applications 0.102 -0.777 -0.324 -0.002 0.718
Refinance share of all conventional applications -0.086 0.622 0.110 -0.503 0.659
Mobile home share of all applications 0.555 0.238 -0.045 0.594 0.720
Non-Hispanic Black share of all applications 0.615 0.152 0.311 -0.356 0.625
Hispanic share of all applications 0.000 -0.928 0.063 -0.051 0.868
Non-Hispanic White share of all applications -0.185 0.771 -0.477 0.247 0.917
Non-Hispanic Asian share of all applications -0.446 -0.049 0.801 -0.005 0.844
Native American share of all applications -0.178 0.033 0.733 0.488 0.808
Rate-spread home purchase loans, as share of all conventional home purchase originations 0.768 0.135 0.263 -0.200 0.718
Rate-spread home improvement loans, as share of all conventional home improvement originations 0.734 0.270 0.146 0.067 0.638
Rate-spread refinance loans, as share of all conventional refinance originations 0.925 -0.010 0.005 -0.029 0.856
Eigenvalue proportion 0.3068 0.2066 0.1323 0.0868
Cumulative 0.3068 0.5133 0.6456 0.7324
Note: Number of observations, 387; all data exclude records collateralized for multi-family units (more than 4 dwelling units). Loadings >0.40 shown in boldface.
enhanced disclosure data largely mirror the old inequalities of exclusion that were
typically manifest in high denial rates; if we focus only on aggregate trends at the
metropolitan scale, exclusionary denial by prime, conventional lenders and inclusionary
exploitation by subprime and predatory lenders are two sides of the same coin. This
result echoes the work of Williams et al. (2005), who found that from 1993 to 2000, up to
half of the gains for minority homeownership came from the new, stratified subprime
22
system (see also Howell, 2006).3 Second, racial and ethnic inequality cannot be
collapsed into a simple white/other binary. The metropolitan geography of African
Americans is most tightly bound up with mortgage market stratification (the first
component) and highlights a pronounced contrast to the distribution of non-Hispanic
Asians and Whites. Increasing White/Latino divisions, however, appear on a separate,
second principal component (which also highlights a greater prevalence of home
improvement in Latino metros); a third component distinguishes White/Native
American regional patterns. The fourth component suggests an aggregate correlation in
the regional geographies of Native Americans and the prevalence of mobile homes.
A first-cut summary of the regional geography of mortgage capital, then, might be
crudely summarized in four dimensions: Black/White credit segmentation, housing-
stock reinvestment and Latino growth, Asian and Native American diversity, and rural-
metropolitan housing (think of the prevalence of exurban mobile homes and
Reservations in and around many cities across the Plains and the Southwest). These
four dimensions provide a ready starting point to suggest a classification of
metropolitan mortgage markets. Right away, we encounter the enduring problem of
taxonomy -- how and where to stop agglomerating (or partitioning) the observations in
the vast continuum between 387 unique metropoli and one huge mega-metro cluster?
The diagnostics for several different hierarchical agglomerative techniques, however,
do provide some helpful guidance. Pseudo t-squared and F statistics and cubic
clustering criteria (Sarle, 1983) identify locally optimal solutions at approximately ten,
fifteen, and twenty categories (for average linkage, centroid, and density [3 nearest
neighbor] methods) and also at 29 clusters (for the median-linkage method). Judging by
3 As with most HMDA research up through 2004, Williams et al. (2005) proxy subprime credit by
identifying loans made by institutions known to specialized in the B-and-C business (see Scheessele,
2002).

23
the r-squared estimate of the proportion of total variance captured within clusters (and
adjusting for the number of clusters) the most efficient solutions distinguish ten
separate types of metropolitan areas; unfortunately, Sarle’s (1983) metric also hints at a
certain degree of outlier bias as the number of clusters decreases (less than 20 for
median and centroid, less than 30 for density). Nevertheless, “all the hierarchical
procedures are sensitive to outliers,” (Lorr, 1983, p. 120), and the statisticians’ advice
achieves mathematical purity only by means of geographical violence -- remove the
outliers. Outlier is just another word for unique, and removing these cases is only
logical if the observations represent aberrant samples or repeated measures of the same
kind of phenomenon. Accordingly, we avoid removing outliers; instead, we embrace
their relevance by turning to another classification procedure (nearest-centroid sorting)
with a sensitivity to outliers that tends to yield single-member categories when the data
justify such an outcome (SAS Institute, 1999, pp. 1195-1197).
Metropolitan Clusters
If we want to summarize about seven-tenths of the variance in our composite measures
of mortgage market outcomes, then, we can do so by grouping the nation’s 387
metropolitan areas into ten categories. Clearly, our choice of variables establishes the
space of observation, and so it should not be surprising that the analysis captures the
broad regional divisions of race and ethnicity. Summary measures are presented
alongside our interpretive labels in Table 4. The most striking initial impressions
highlight several groups of unusual or exceptional cases -- cities rarely mentioned in the
predatory lending debates, or so statistically unique that they stand alone. Honolulu is
separated out by the clustering procedure on the basis of the high share of applicants
identifying themselves as Asian or Pacific Islander; but rate-spread lending does not
appear to be a problem here at the metropolitan scale. Farmington, New Mexico is
24
another matter: a tenth of all applicants identify themselves as Native American (far
beyond the share in any other metropolitan area), thanks to Farmington’s situation on
the eastern edge of the 17-million acre Navajo Nation. Unfortunately, high-cost lending
is pervasive in the Farmington area (a fifth of home purchase loans, more than a quarter
of renovations and refinances). In 1995 the Navajo Nation passed legislation to allow
off-reservation banks to foreclose on delinquent mortgagors, and a few years later the
First National Bank of Farmington became the first conventional lender to establish a
bank branch on the reservation and to close a HUD Section 184 loan (see Listokin et al.,
2000, pp. 179-192). In the case of Puerto Rico -- clearly picked out by the clustering
routine on the basis of the dominance of Hispanic borrowers -- rate-spread lending is
surprisingly rare (less than 4 percent of home purchase loans, about 15 percent of
refinance loans). Indeed, it is a striking paradox that Puerto Rico has been covered by
HMDA for years, but the place is always ignored except for studies of Hispanic lending
in U.S. cities with large communities of Puerto Ricans (e.g., McConnell et al., 2005).
Although some large U.S. lenders (notably Wells Fargo) have been involved in usurious
practices on the island (see Lee, 2007) the overall figures for 2004 suggest few market-
wide problems. Remarkably, the largest bank on the island (Banco Popular)
encountered its greatest risks not in Puerto Rico but in its acquisition of subprime
originators on the mainland (Reuters, 2007; cf. Cervantes and Shimkus, 2007). The final
small, exceptional cluster includes McAllen, Texas, that border metropolis of colonias
and migrant farm workers that suffers from the nation’s highest subprime market
penetration in the home purchase sector; this group of Border Latino Exclusion cities is
dominated by Texas metropoli -- Houston, San Antonio, El Paso, Dallas, Laredo -- but
also includes Miami, Yuma, Arizona, El Centro, California, and Bakersfield, California.

25
Tab
le 4
. A
Tax
on
om
y o
f th
e U
.S. S
ub
pri
me
Mo
rtg
age
Urb
an S
yst
em.
Clu
ster
In
terp
reta
tio
nN
o. o
fF
HA
Den
ial
Ho
me
Mo
bil
eR
ace/
eth
nic
ity
, of
all
con
ven
tio
nal
ap
pli
can
tsR
ate-
spre
ad
sh
are
Met
ros
Ra
teR
ate
imp
rov
emen
tR
efin
ance
Ho
me
Bla
ckH
isp
an
icW
hit
eA
sian
Na
tiv
e A
mer
ican
Pu
rch
ase
Imp
rov
emen
tR
efin
an
ce
1B
ord
er c
itie
s o
f L
atin
o E
xplo
itat
ion
Ho
ust
on
, M
iam
i, E
l C
entr
o, S
an
An
ton
io, E
l P
aso
…L
ared
o, M
cAll
en,
Tex
as1
40.
080
0.2
91
0.1
07
0.54
70
.026
0.03
80.
449
0.2
94
0.0
150.
006
0.2
45
0.21
10.
286
2P
uer
to R
ico
San
Ger
ma
in,
Ma
ya
gu
ez,
Po
nce
, Ag
uad
illa
, F
ajar
do
, G
uay
ama
, Y
auco
, S
an J
ua
n,
PR
80.
065
0.2
87
0.3
83
0.35
50
.003
0.00
00.
937
0.0
06
0.0
010.
000
0.0
37
0.08
30.
152
3W
hit
e M
etro
s o
f P
rim
e C
apit
al (
I)
Lex
ing
on
, K
Y,
Yo
rk,
PA
, S
pri
ng
fiel
d,
IL, P
eori
a, I
L …
. Uti
ca,
NY
, S
anta
Ro
sa,
CA
, C
amb
rid
ge,
MA
110
0.0
380
.20
90
.10
40.
605
0.0
220.
030
0.0
400
.71
80.
015
0.00
50
.12
60.
136
0.1
54
4M
etro
s o
f A
ver
age
Wh
ite/
Bla
ck I
neq
ual
ity
In
dia
nap
oli
s, S
ou
th B
end
, K
ank
akee
, Ga
, Ro
me,
GA
, T
ole
do
, O
H …
New
Orl
ean
s, T
aco
ma,
WA
73
0.0
560
.25
40
.09
10.
614
0.0
270.
102
0.0
400
.63
90.
011
0.00
50
.18
20.
222
0.2
18
5W
hit
e M
etro
s o
f P
rim
e C
apit
al (
II)
Bo
ise,
ID
, W
ilm
ing
ton
, N
C,
Ft.
Wa
lto
n B
each
, F
L,
Co
lum
bia
, M
D …
Fla
gst
aff,
AZ
, An
cho
rag
e, A
K7
00.
056
0.2
13
0.0
77
0.54
20
.058
0.01
80.
045
0.7
37
0.0
110.
009
0.1
26
0.18
30.
160
6F
arm
ing
ton
, NM
10.
069
0.3
24
0.1
00
0.54
40
.236
0.00
60.
139
0.5
42
0.0
030.
099
0.1
98
0.27
50.
251
7B
lack
Bel
t F
inan
cial
Ex
plo
itat
ion
30
0.0
920
.30
10
.09
10.
597
0.0
740.
241
0.0
220
.50
80.
008
0.00
60
.25
50.
314
0.3
05
Mo
ntg
om
ery
, S
hre
vep
ort
, L
A,
Mo
nro
e, L
A,
Ale
xa
nd
ria,
LA
…H
ines
vil
le,
GA
, D
etro
it, M
I
8L
arg
e M
ult
irac
ial
Ho
usi
ng
Mar
ket
s2
80.
016
0.1
90
0.0
75
0.60
10
.008
0.05
90.
198
0.4
07
0.0
750.
014
0.1
52
0.12
60.
116
Sal
inas
, C
A, N
ew Y
ork
, NY
, Sa
cram
ento
, C
A,
Mo
des
to,
CA
… S
an F
ran
cisc
o,
San
Jo
se
9H
on
olu
lu, H
aw
aii
10.
023
0.1
33
0.0
51
0.56
80
.000
0.01
40.
033
0.2
71
0.3
580.
132
0.1
13
0.12
20.
077
10W
ork
ing
-Cla
ss F
inan
cial
Seg
men
tati
on
Sh
erm
an,
TX
, L
ittl
e R
ock
, O
cala
, F
L,
Lak
elan
d,
FL
, Laf
ay
ette
, L
A …
Mo
rris
tow
n, T
N, O
de
ssa
, T
X5
20.
087
0.2
74
0.1
04
0.54
00
.079
0.08
40.
081
0.6
22
0.0
100.
008
0.2
02
0.23
80.
262
26
The vast majority of the nation’s metropolitan areas fall into one of the remaining six
categories (Table 4). Numerically, the most prevalent category consists of
predominantly White metropolitan areas where mainstream mortgage capital prevails,
and where FHA-insured and high-cost conventional loans are both equally rare.
Although this cluster does include several populous metropolitan areas, it is most
clearly exemplified by the observations nearest the cluster centroid -- smallish cities in
the Midwest and the East, including Lexington, Kentucky, York, Pennsylvania,
Springfield, Illinois, and Peoria, Illinois. A similar category of White metropolitan areas
(distinguished primarily by higher yet still very low shares of Native American
applicants and mobile home loans) includes middle-sized cities like Boise, Idaho,
Wilmington, North Carolina, Columbia, Missouri, and more than five dozen others.
Here, too, rate-spread lending has little market penetration, accounting for only 13
percent of home purchase originations and 16 percent of refinance originations.
Similarly, rate-spread loans make up a modest share in another category, multiracial
housing markets -- mostly big cities in the nation’s coastal megalopoli, including New
York, San Diego and Los Angeles, Washington, DC, and two dozen others. With the
exception of Seattle and Las Vegas, non-Hispanic Whites constitute a minority of all
home-loan applicants in every metropolitan area in this multiracial cluster -- and in the
aggregate, rate-spread loans account for only 15 percent of home purchase loans, and 12
percent of refinance originations.
Subprime lending is somewhat more pervasive, however, in a group of seventy
metropolitan areas marked by stark White/Black racial/ethnic divisions; rate-spread
loans account for about one-fifth of all originations in these cities, and conventional
denial rates top one-quarter. The roster of cities highlights scores of de-industrializing
centers across the Midwest: Indianapolis, Toledo, Akron, Kansas City, Gary, Indiana,
and Youngstown, Ohio. But we also find small cities across the South: Rome, Georgia,

27
Winston-Salem, North Carolina, Florence-Muscle Shoals, Alabama, Savannah, Georgia,
and Durham, North Carolina. And New Orleans joins this cluster near the statistical
periphery, a year before Hurricane Katrina and neo-conservative federal bulldozer
initiatives began to remake the city’s land and housing markets (Peck, 2007).
Yet the most striking result of the cluster analysis highlights the deep, sedimented
regional geography produced by the American Dilemma of racial oppression (Myrdal,
1944, especially pp. 605-638). Cluster 4 stands out as a remarkable signifier of the
persistently geographical dimensions of more than a century of segregation and
stratification. Recall that our analysis is a deliberately simple, even naive approach --
using only a dozen or so esoteric measures of mortgage outcomes, and ignoring many
other possible measures of regional housing market evolution. The analysis includes no
explicit indicators of regional location or context. And yet the simple statistical
partitioning of the cluster space immediately disentangles a regional geography with
enormous significance and meaning. Cluster 4 is, quite simply, today’s home-financing
landscapes of the Black Belt that was created in the Reconstruction era -- along with
Detroit, among the largest of the Northern industrial destinations for the Great
Migration of Southern rural African Americans between the First and Second World
Wars.4
This cluster includes thirty metropolitan areas. One of them is not too far from the
cluster centroid in statistical terms and near the middle in geographical terms -- just
4 It is also worth noting that Detroit is the farthest observation in this cluster from the centroid, and thus
not as closely representative of the group character compared with, say, Montgomery, Alabama, or
Shreveport, Louisiana. Detroit joins this cluster because of its exploitative financial indicators are, in
contrast to the multiracial metropoli of New York, Chicago, and Los Angeles, not as easily diluted by
large numbers of Whites and others getting good, A-rated loans. It may then be quite fair to consider the
housing-finance regime of Detroit as a Northern extension of tghe kinds of inequalities that persist
throughout so much of the Southern Black Belt.

28
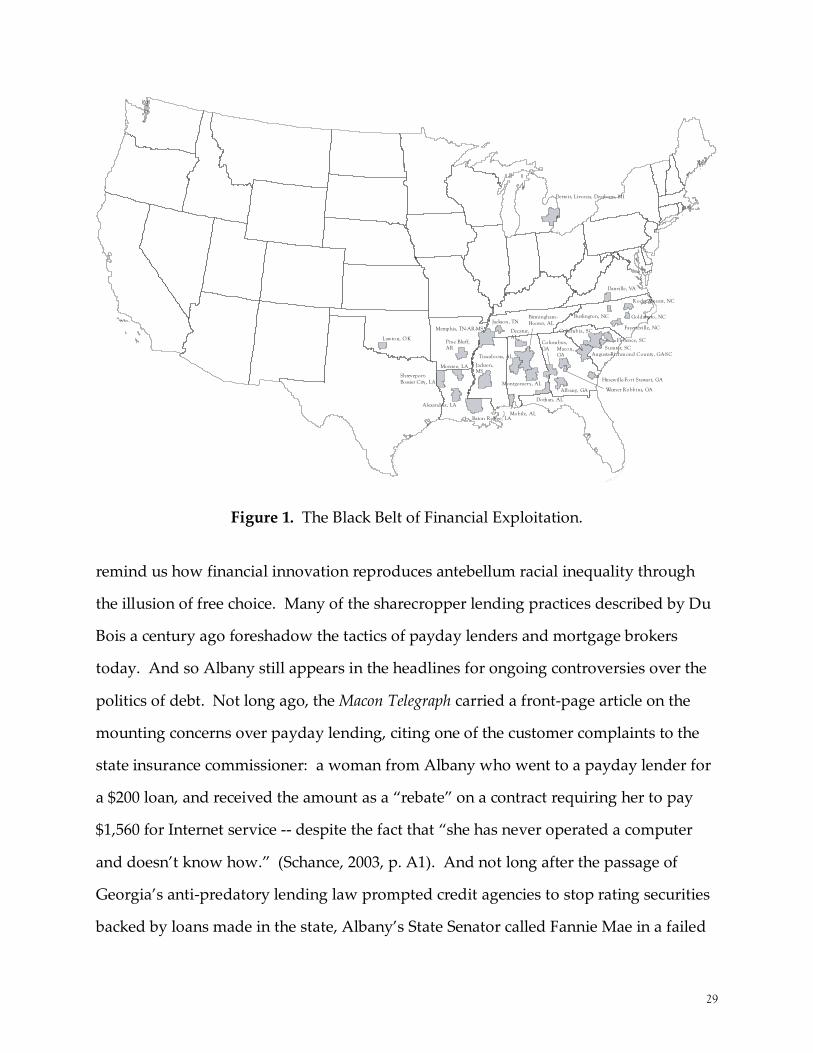
beyond the southern reach of the Appalachian piedmont, equidistant from the Virginia
and North Carolina valley and piedmont downs and the Mississippi floodplain cities to
the west (see Figure 1). Today, almost 32 percent of conventional mortgage applicants
in Albany, Georgia are rejected. Among those who do get loans, one-quarter receive
rate-spread credit for home purchases, and the high-cost share rises to 34 percent in the
refinance market and 38 percent for home improvement loans. At the heart of the
Albany metropolitan area is Dougherty County, once the Cotton Kingdom, the Egypt of
the Confederacy, where W.E.B. Du Bois undertook part of his field research for The
Souls of Black Folk. Documenting the local imprint of the failures of Reconstruction two
generations after the Civil War, and describing the precarious oppression of a
sharecropping system that would soon be plowed under by mechanization, Du Bois
(2003[1903], p. 92) wrote that “It is a beautiful land, this Dougherty County, west of the
Flint. The forests are wonderful ... this is the ‘Oakey Woods,’ with its wealth of
hickories, beeches, oaks, and palmettos. But a pall of debt hangs over the beautiful
land; the merchants are in debt to the wholesalers, the planters are in debt to the
merchants, the tenants owe the planters, and laborers bow and bend beneath the
burden of it all.” And the tentacles of extraction were indeed quite transnational. An
old cotton plantation bought after the war by an English syndicate soon succumbed to
bankruptcy; but the Black sharecropper on the edge of the estate still had to pay.
“Nobody lives in the old house now, but a man comes each winter out of the north and
collects his high rents.” (Du Bois, 2003[1903], p. 95).
The words of Du Bois might be distant in time, but the chilling narratives of debt,
usury, and hard labor in Chapter 7 of The Souls of Black Folk, “Of the Black Belt,” serve to
29
Detroit, Livonia, Dearborn, MI
Danville, VA
Burlington, NC
Rocky Mount, NC
Goldsboro, NC
Fayetteville, NC
Florence, SC
Sumter, SC
Columbia, SC
Augusta-Richmond County, GA-SC
Hinesville-Fort Stewart, GA
Albany, GA
Columbus,
GA
Warner Robbins, GA
Dothan, AL
Mobile, AL
Macon,GA
Montgomery, AL
Tuscaloosa, AL
Jackson, TN
Memphis, TN-AR -MS
Birmingham-
Hoover, AL
Decatur,ALLawton, OK
Pine Bluff,AR
Baton Rouge, LA
Alexandria, LA
Shreveport-
Bossier City, LA
Monroe, LA Jackson,MS
Figure 1. The Black Belt of Financial Exploitation.
remind us how financial innovation reproduces antebellum racial inequality through
the illusion of free choice. Many of the sharecropper lending practices described by Du
Bois a century ago foreshadow the tactics of payday lenders and mortgage brokers
today. And so Albany still appears in the headlines for ongoing controversies over the
politics of debt. Not long ago, the Macon Telegraph carried a front-page article on the
mounting concerns over payday lending, citing one of the customer complaints to the
state insurance commissioner: a woman from Albany who went to a payday lender for
a $200 loan, and received the amount as a “rebate” on a contract requiring her to pay
$1,560 for Internet service -- despite the fact that “she has never operated a computer
and doesn’t know how.” (Schance, 2003, p. A1). And not long after the passage of
Georgia’s anti-predatory lending law prompted credit agencies to stop rating securities
backed by loans made in the state, Albany’s State Senator called Fannie Mae in a failed
30
attempt to get clarification on the secondary purchaser’s stance. During the floor debate
on a measure to rewrite the law, one of the Republican Governor’s floor leaders had
declared that he was about to receive a letter from Freddie Mac threatening “real bad
consequences” if the legislature did not rework the prior law within 48 hours. The
letter never came. The Atlanta Journal-Constitution noted that “Invoking the names of
the two government-sponsored institutions was a chilling move,” (Unger, 2003, p. 1A),
and it worked, culminating in a close Senate vote to weaken the law’s provisions.
Neighborhood Dimensions of Subprime Capital
It should be clear that the metropolitan-level analysis has its limits, particularly in
relation to aggregation bias: the very severe predatory practices in the disinvested
inner cities of large cities, for example, are diluted when figures are calculated for an
entire metropolitan area with its expansive wealthy and middle-class suburbs.
Accordingly, we now turn to the neighborhood scale, using census tracts as an
admittedly problematic proxy for the complex notion of local community.
What are the nation’s worst neighborhoods for subprime lending? If we impose a
simple arbitrary cutoff (subprime share of half, a total of at least 25 high-cost
originations), we find 752 census tracts that can be considered epicenters of predatory
activity in the home purchase market, 3 in the home improvement sector, and 793 in the
refinance sector. Narrowing our focus to the very worst case of neighborhood high-cost
lending nationwide in the home purchase market takes us to a slice of northwest
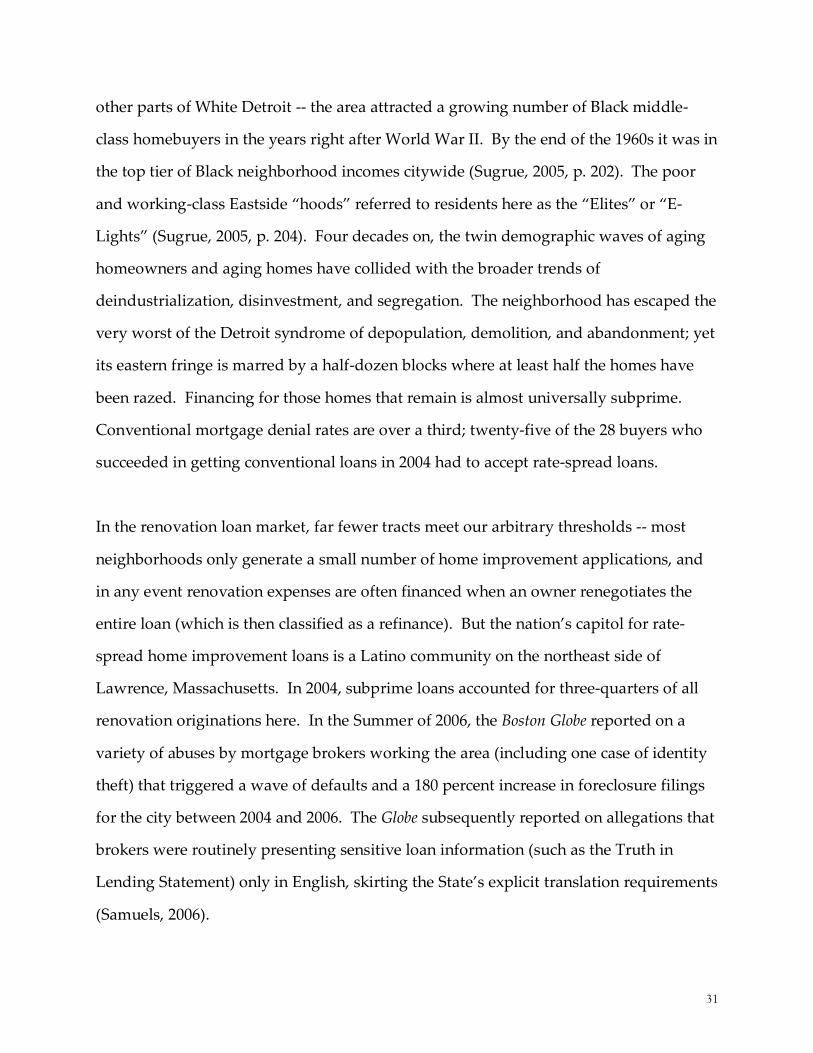
Detroit, to a tract nestled into the south side of the curve in the Jeffries Freeway. The
neighborhood appears without formal title on official maps and documents, but sits just
north of Barton-McFarland. Once a predominantly Jewish neighborhood -- and thus
free of the exclusionary racial deed restrictions that governed property transfers in
31
other parts of White Detroit -- the area attracted a growing number of Black middle-
class homebuyers in the years right after World War II. By the end of the 1960s it was in
the top tier of Black neighborhood incomes citywide (Sugrue, 2005, p. 202). The poor
and working-class Eastside “hoods” referred to residents here as the “Elites” or “E-
Lights” (Sugrue, 2005, p. 204). Four decades on, the twin demographic waves of aging
homeowners and aging homes have collided with the broader trends of
deindustrialization, disinvestment, and segregation. The neighborhood has escaped the
very worst of the Detroit syndrome of depopulation, demolition, and abandonment; yet
its eastern fringe is marred by a half-dozen blocks where at least half the homes have
been razed. Financing for those homes that remain is almost universally subprime.
Conventional mortgage denial rates are over a third; twenty-five of the 28 buyers who
succeeded in getting conventional loans in 2004 had to accept rate-spread loans.
In the renovation loan market, far fewer tracts meet our arbitrary thresholds -- most
neighborhoods only generate a small number of home improvement applications, and
in any event renovation expenses are often financed when an owner renegotiates the
entire loan (which is then classified as a refinance). But the nation’s capitol for rate-
spread home improvement loans is a Latino community on the northeast side of
Lawrence, Massachusetts. In 2004, subprime loans accounted for three-quarters of all
renovation originations here. In the Summer of 2006, the Boston Globe reported on a
variety of abuses by mortgage brokers working the area (including one case of identity
theft) that triggered a wave of defaults and a 180 percent increase in foreclosure filings
for the city between 2004 and 2006. The Globe subsequently reported on allegations that
brokers were routinely presenting sensitive loan information (such as the Truth in
Lending Statement) only in English, skirting the State’s explicit translation requirements
(Samuels, 2006).

32
The nation’s worst case for the refinance market takes us to a predominantly Black
neighborhood in East Baton Rouge, Louisiana, about a mile east of the State capitol. In
a tract adjoining Interstate 110 on the edge of the Mississippi floodplain, more than 90
percent of all refinance loans exceeded the rate-spread trigger in 2004. Conventional
denial rates topped 43 percent, while high-cost loans account for two-third of purchase
mortgages and three-fifths of renovation loans. In the Summer of 2005, two miles to the
northeast at the Living Faith Christian Center, the Louisiana Attorney General and the
Director of the Governor’s Office of Elderly Affairs gave twin keynotes at a consumer
protection workshop and credit clinic, as “one of several ‘Scam Jams’ being held across
the state to educate the public about fraud and predatory lending practices.” (The
Advocate, 2005).
These brief statistical anecdotes are quite literally the tip of a very large iceberg: if we
chose any of a dozen related but distinct alternative benchmarks, another set of
neighborhoods would shoot to the top of the rankings; and in any event, our
abbreviated narratives of small parts of Detroit, Lawrence, and Baton Rouge cry out for
much more. We need in-depth qualitative analysis of specific neighborhoods like these,
where the most obvious indicators of predatory lending are the worst. But first we
need to move beyond the single dimension of a ranked list, to undertake a
reconnaissance of the different kinds of neighborhood capital markets across the nation.
Accordingly, we replicated the metropolitan-level analysis at the census tract level.
First, we extract the four leading principal components for the matrix of lending
variables for almost 53 thousand tracts. We also repeat the metropolitan ecological
analysis to exclude what might reasonably be considered the distinctive political, legal,
and regulatory spaces of Puerto Rico’s housing markets. The resulting parallel arrays of
component scores illuminate the effects of scale on aggregate, observed lending
inequalities (Table 3). With few exceptions, the communalities are somewhat lower for

33
the tract analysis, an indication that this set of lending variables is more closely
intercorrelated at higher levels of aggregation. Yet the communalities increase for the
variables denoting Anglo Whites, Latinos, and Native Americans. Moreover, the
pattern of component loadings is just as vivid as the metropolitan analysis. So long as
we take care in the interpretation of factor structure when the configuration of variance
triggers reversals in the signs for individual loadings (see Harmon, 1967), the ecology of
mortgage capital is quite clear. A first dimension identifies mainstream exclusion and
high-cost subprime penetration; a second axis distinguishes White/Latino contrasts, and
two additional components detect other facets of the distribution of mobile homes,
Native Americans, and others.
The pattern of loadings on particular factors suggests three crucial differences when we
shift the scale from the regional to the neighborhood level. First, the relation between
traditional redlining-exclusion and contemporary subprime market penetration is
modified. The essence of the link remains the same: measured at the metro or tract
level, areas with higher conventional denial rates also have greater rate-spread
penetration, and this is precisely where African Americans comprise higher shares of
loan applicants. But shifting from the metropolitan to the tract level dramatically
reduces the first-component loadings for several other variables -- FHA share, mobile
homes, and non-Hispanic Asians. The latter two measures appear on another distinct
dimension of neighborhood segregation. This result implies, for example, that Asian
buyers are more common in racially diverse metropolitan areas with higher denial rates
and predatory penetration; but within these metropolitan areas, Asian buyers are not
concentrated in tracts with high rates of subprime lending. For FHA-insured lending,
the low communality for the tract model (0.27) and the low loadings this indicator posts
across all components suggests that the program supports buyers across a wide range
of different neighborhoods. At the regional scale, though, FHA market share goes hand
34
in hand with higher denial rates and subprime penetration. Meanwhile, the strong
loading for non-Hispanic White share attests to the fundamental role of White privilege
in structuring American urban inequalities (Jackson, 1985; Sugrue, 1985; Pulido, 2000).
Second, the market segmentation of rate-spread loans appears more sharply defined
when measured at the neighborhood scale. The rate-spread variables load solely on the
first component, reflecting the jagged inequality separating White neighborhoods with
low denial rates from Black communities with high denial rates and deep market
penetration of predatory mortgage capital. Third, racial divisions at the metropolitan
level are much more clearly tied to housing-stock variations when we examine the
neighborhood scale: note that all the racial/ethnic variables load onto Component II in
the metropolitan model, while at the tract level the proportion Native American
highlights neighborhoods with greater shares of mobile homes and fewer refinance
requests.

35
Ta
ble
3.
Met
rop
oli
tan
an
d N
eig
hb
orh
oo
d D
imen
sio
ns
of
Pre
da
tory
Len
din
g, 2
004.
Un
wei
ght
ed,
un
rota
ted
pri
nci
pal
com
pon
ents
All
MA
s, e
xcl
ud
ing
Pu
erto
Ric
oA
ll c
ensu
s tr
acts
, ex
clu
din
g P
uer
to R
ico
Var
iab
leI
IIII
IIV
Co
mm
un
ali
tyI
IIII
IIV
Co
mm
un
ali
ty
FH
A s
har
e o
f a
ll a
pp
lica
tio
ns
0.5
723
-0.0
130
-0.0
552
-0.2
411
0.3
89
0.3
580.
354
0.1
52-0
.022
0.2
77
Den
ial
rate
, co
nv
enti
on
al a
pp
lica
tio
ns
0.8
701
-0.0
356
0.2
122
-0.0
401
0.8
05
0.8
030.
113
0.1
95-0
.017
0.6
96
Ho
me
imp
rov
emen
t sh
are
of
all
co
nv
enti
on
al a
pp
lica
tio
ns
0.2
733
-0.2
748
0.6
887
-0.2
607
0.6
92
0.3
600.
238
0.2
34-0
.310
0.3
37
Ref
ina
nce
sh
are
of
all
con
ven
tio
na
l a
pp
lica
tio
ns
-0.1
430
-0.1
093
0.4
161
0.6
671
0.6
50
0.1
090.
001
-0.5
190
.235
0.3
37
Mo
bil
e h
om
e sh
are
of
all
ap
pli
cati
on
s0.
535
5-0
.208
2-0
.436
0-0
.322
40
.62
40.
189
0.3
800.
627
0.2
230.
62
3
No
n-H
isp
anic
Bla
ck s
har
e o
f al
l ap
pli
cati
on
s0.
603
80.
144
1-0
.246
00.
557
20
.75
60.
711
-0.1
15-0
.356
0.2
550.
70
9
His
pa
nic
sh
are
of
all
ap
pli
cati
on
s0.
112
20.
702
30.
390
2-0
.306
80
.75
20.
279
-0.5
500.
247
-0.6
050.
80
7
No
n-H
isp
anic
Wh
ite
shar
e o
f a
ll a
pp
lica
tio
ns
-0.2
976
-0.8
808
-0.1
396
-0.1
231
0.8
99
-0.6
380.
710
0.0
310
.080
0.9
19
No
n-H
isp
anic
Asi
an s
ha
re o
f al
l a
pp
lica
tio
ns
-0.4
294
0.6
944
-0.1
301
0.0
991
0.6
93
-0.2
63-0
.673
0.1
440
.304
0.6
36
Na
tiv
e A
mer
ican
sh
are
of
all
app
lica
tio
ns
-0.1
704
0.5
247
-0.2
855
-0.2
658
0.4
56
0.0
06-0
.339
0.5
230
.539
0.6
79
Ra
te-s
pre
ad
ho
me
pu
rch
ase
loan
s, a
s sh
are
of
all
con
ven
tio
na
l h
om
e p
urc
has
e o
rig
ina
tio
ns
0.8
038
0.2
316
0.1
738
0.0
981
0.7
39
0.8
10-0
.054
-0.0
120
.058
0.6
62
Ra
te-s
pre
ad
ho
me
imp
rov
emen
t lo
ans,
as
sha
re o
f al
l co
nv
enti
on
al
ho
me
pu
rch
ase
ori
gin
ati
on
s0.
715
00.
017
2-0
.449
10.
178
40
.74
50.
532
0.1
23-0
.129
0.1
840.
34
8
Ra
te-s
pre
ad
ref
inan
ce l
oa
ns,
as
shar
e o
f a
ll c
on
ven
tio
nal
ho
me
pu
rch
ase
ori
gin
ati
on
s0.
932
5-0
.031
70.
098
5-0
.038
30
.88
20.
836
0.1
40-0
.050
0.0
440.
72
3
Eig
env
alu
e p
rop
ort
ion
0.3
21
0.1
719
0.1
121
0.0
938
0.2
805
0.1
358
0.0
985
0.08
16
Cu
mu
lati
ve
0.3
21
0.4
929
0.6
050
0.6
988
0.2
805
0.4
168
0.5
149
0.59
66
No
te:
Nu
mb
er o
f o
bse
rva
tio
ns,
379
(M
As)
52
,80
7 (
tra
cts)
; ex
clu
des
rec
ord
s co
lla
tera
liz
ed f
or
mu
lti-
fam
ily
un
its,
ho
mes
in
Peu
rto
Ric
o,
and
rec
ord
s w
ith
mis
sin
g o
r in
va
lid
in
form
ati
on
fo
r ce
nsu
s tr
act
or
Sta
te c
od
es.
Lo
ad
ing
s >
0.4
0 s
ho
wn
in
bo
ldfa
ce.
36
Subprime Urban Hierarchies
To map the national urban systems of individual neighborhoods linked into Wall
Street’s subprime romance, we used the principal component scores as an input to a
cluster analysis of all 52,807 metropolitan census tracts. To help us decide how many
distinct categories to create as a way of summarizing the extraordinary diversity of
neighborhoods, we used centroid hierarchical agglomeration; this algorithm is more
robust to outliers than most other hierarchical approaches, and it is less sensitive to
non-normality biases than the otherwise superior Ward’s minimum variance approach.
Figure 2 show diagnostics for the last 300 steps of agglomeration, with the total amount
of variance captured within the clusters declining as we build larger clusters. The
pseudo-t-squared diagnostic is a measure of how much accuracy we lose with each step
in the summary process that happens as we create clusters with more (and different)
things. Large peaks in the pseudo-t-squared indicate steps that make a big difference in
the tradeoff between accuracy and simplicity, and in this case there are crucial decision
points at 292, 289, and 161 clusters, and then a sharp cascade beginning at 53 clusters.
Clearly, subjectivity matters here: if we wanted a taxonomy that captured almost four-
fifths of all the variance, we could get it in about 300 clusters. But in light of the small
number of original variables and considering the lessons of Tryon’s mis-spent youth,
we opted for a solution at 54 clusters, with an overall r-squared of 0.569. We then used
a non-hierarchical nearest centroid sorting algorithm, yielding an encouragingly robust
solution.5
5 The [Rsquare/(1-Rsquare)] diagnostic, which measures how well the clusters include the variance in
each of the axes defining the space of observation, is between 6.67 and 7.94 for each of the four principal
components.

37
The voluminous output from the cluster analysis is not reproduced here, but the most
obvious result is the statistical separation of more than a dozen categories -- most with
one, two, or three census tracts -- that have thin markets with few transactions (and thus
unusual combinations of extreme percentage values). But other parts of the nation’s
0
0.1
0.2
0.3
0.4
0.5
0.6
0.7
0.8
0.9
300 275 250 225 200 175 150 125 100 75 50 25
Number of clusters
Ov
era
ll R
-sq
ua
red
0
2000
4000
6000
8000
10000
12000
14000
16000
18000
20000
Pse
ud
o t
-sq
ua
red
sta
tist
ic
Pseudo t-squared
Overall cluster R-squared
Figure 2. Diagnostics for Tract Cluster Analysis.
urban system cannot be so easily dismissed as the exceptional, rare cases of market
failure in just a few neighborhoods. Consider Cluster 45, with 1,566 tracts spread across
the country. Almost 515 thousand homeowners and prospective buyers filed loan
requests in these neighborhoods. On average, three-fifths of the applicants in each of
these communities were non-Hispanic Black, and two-fifths of all loan requests were
rejected. Among those approved for home purchase loans, 56 percent received rate-
spread mortgages; high-cost products accounted for 48 percent of home improvement
loans, and 53 percent of refinance originations. These are precisely the kinds of

38
neighborhoods that are at the heart of the most serious scholarly, activist, and
regulatory concerns over predatory lending: predominantly inner-city African
American communities in cities (or parts of cities) hit hard by economic restructuring,
racial segregation, housing disinvestment and financial exploitation. If we rank this
part of the national urban system according to the number of homeowners and buyers
affected by conditions in these specific neighborhoods, it would highlighted Detroit
(83,268) and Chicago (56,274) at the peak; a string of eight cities between 10 thousand
and 50 thousand (in descending order, Atlanta, Memphis, St. Louis, Birmingham,
Alabama, Baltimore, New Orleans, Cleveland, and Milwaukee); and several dozen
smaller concentrations in Kansas City, Jacksonville, Florida, Baton Rouge, Dallas,
Washington, DC, Indianapolis, and so on.
By contrast, Cluster 14 identifies landscapes of Latina and Latino exploitation across the
Southwest. Together, the 471 tracts in this group had 101,135 single-family loan
applications in 2004. On average, two-thirds of the applicants in each neighborhood
identified themselves as Hispanic. Fully 45 percent of all requests were rejected, and
subprime loans accounted for 40 percent of purchase loans, 25 percent of renovation
mortgages, and 49 percent of refinance approvals. If we view the national urban system
from the perspectives of these communities, it is anchored in Texas, led by El Paso and
San Antonio (both with about 20 thousand affected), followed by McAllen, Laredo,
Brownsville, Houston, and Corpus Christi. These Texas cities account for 85 percent of
the applicants in this cluster of neighborhoods. Yet small concentrations in
communities elsewhere reflect the widely-discussed new regional geography of
Hispanic population growth in the United States, with notable populations in northern
cities like Philadelphia, Pittsburgh, and Reading, Pennsylvania, New York, Camden,
New Jersey, Springfield, Massachusetts, and Gary, Indiana.
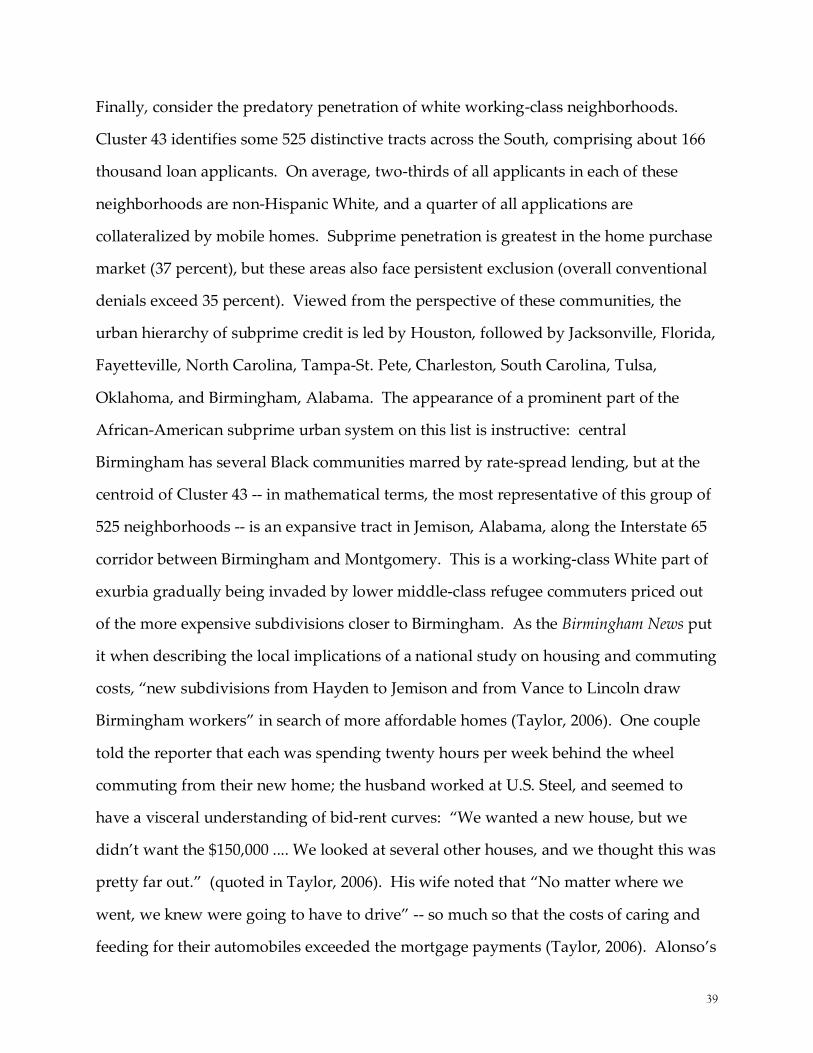
39
Finally, consider the predatory penetration of white working-class neighborhoods.
Cluster 43 identifies some 525 distinctive tracts across the South, comprising about 166
thousand loan applicants. On average, two-thirds of all applicants in each of these
neighborhoods are non-Hispanic White, and a quarter of all applications are
collateralized by mobile homes. Subprime penetration is greatest in the home purchase
market (37 percent), but these areas also face persistent exclusion (overall conventional
denials exceed 35 percent). Viewed from the perspective of these communities, the
urban hierarchy of subprime credit is led by Houston, followed by Jacksonville, Florida,
Fayetteville, North Carolina, Tampa-St. Pete, Charleston, South Carolina, Tulsa,
Oklahoma, and Birmingham, Alabama. The appearance of a prominent part of the
African-American subprime urban system on this list is instructive: central
Birmingham has several Black communities marred by rate-spread lending, but at the
centroid of Cluster 43 -- in mathematical terms, the most representative of this group of
525 neighborhoods -- is an expansive tract in Jemison, Alabama, along the Interstate 65
corridor between Birmingham and Montgomery. This is a working-class White part of
exurbia gradually being invaded by lower middle-class refugee commuters priced out
of the more expensive subdivisions closer to Birmingham. As the Birmingham News put
it when describing the local implications of a national study on housing and commuting
costs, “new subdivisions from Hayden to Jemison and from Vance to Lincoln draw
Birmingham workers” in search of more affordable homes (Taylor, 2006). One couple
told the reporter that each was spending twenty hours per week behind the wheel
commuting from their new home; the husband worked at U.S. Steel, and seemed to
have a visceral understanding of bid-rent curves: “We wanted a new house, but we
didn’t want the $150,000 .... We looked at several other houses, and we thought this was
pretty far out.” (quoted in Taylor, 2006). His wife noted that “No matter where we
went, we knew were going to have to drive” -- so much so that the costs of caring and
feeding for their automobiles exceeded the mortgage payments (Taylor, 2006). Alonso’s
40
(1964) indifference curves are marching ever farther outward amidst new subdivisions
and old trailer parks on the Southern urban fringe, but the subprime lenders are not far
behind. More than a third of all mortgage applicants were denied here in 2004. More
than two-thirds of all applicants are non-Hispanic White, and 26 percent were backed
by mobile homes. More than half of all home purchase originations here exceeded the
rate-spread trigger.
Legislation and Mobilization: Mapping the State of Play
Exploring the local, neighborhood imprint of subprime and predatory lending can only
take us so far. We must also consider legal developments at the scale of the states.
From an organizer’s perspective, the evolving constitutional and regulatory dimensions
of the American federal system force a choice: between long-term organizing to combat
predatory lending with comprehensive national, federal legislation, and more
immediate, urgent efforts to pass bills at the state level to deal with the worst problems
happening right now. Choosing one of these paths does not always and inevitably
undermine the prospects for the other, but there are certain inescapable tradeoffs
between short-run tactical moves and long-term strategic investment, and between the
scope and strength of coverage. The community reinvestment movement has been
confronted with a powerful credit and banking lobby in Washington that has stymied
nearly all meaningful reform efforts over the last decade, however, and many
organizers saw little choice but to concentrate their efforts at the state and local levels.
Advocates have found receptive audiences in a growing number of state legislatures.
North Carolina’s 1999 legislation marked the first law designed to reduce predatory
lending practices, and it quickly inspired legislative and regulatory struggles in other
states. The noted civil rights litigator John Relman observes that state legislative actions

41
“reflect both frustration and dissatisfaction with the current federal and state
enforcement schemes,” and “have thrust state legislatures back into their traditional
role as local laboratories for the development of new, experimental remedies and causes
of action.” (Relman at el., 2004, p. 168). More than two dozen states have passed some
kind of legislation to combat predatory home lending (Li and Ernst, 2006), and the
result has created a complex topography etched by quite different operational
definitions of “predatory” or “high-cost” loans, varied restrictions on permissible
underwriting practices and terms of credit, and diverse configurations of enforcement
and penalties for violations. The increasing complexity of the post-North Carolina
legislative landscape has prompted considerable anxiety for the larger mortgage
industry players. One of the industry’s prominent lobbyists compiles a monthly
worksheet tracking every relevant detail of the status, content, sponsorship, and
ultimate disposition of every single predatory lending bill introduced in any state
legislature nationwide; the most recent summary “scorecard” in our possession6 lists
fifty-two distinct bills that were pending in twenty state legislatures as of late January,
2004 (Butera & Andrews, 2004a, 2004b).
Until recently, it has been virtually impossible to map this complex legal and regulatory
landscape -- a confusing patchwork that “subjects a lender with offices around the
country to a Byzantine and inconsistent set of requirements in different states and
localities” (Relman et al., 2004, p. 155). Yet several recent advances now make it
possible to see what the years of organizing, research, and policy development have
6 For a few years, Butera & Andrews distributed these worksheets -- along with a rich stream of almost
daily news clippings, bill drafts, and other materials -- to anyone who signed up on the firm’s “interested
parties” list. Access was restricted in early 2004, however, presumably because the firm discovered that
the audience had expanded beyond clients and industry supporters to include a more critical cadre of
anti-predatory lending researchers and activists. Butera & Andrews still distributes some materials on its
public website, however, including an updated roster of laws that have taken effect in 28 states and a
number of counties and cities (Butera & Andrews, 2007).
42
produced. As part of research designed to measure how state laws affect borrowers’
choices between conventional and FHA-insured credit, Ambrose and Pennington-Cross
(2000) developed a taxonomy of state laws on foreclosure and the permissibility of
deficiency judgments (see also Pence, 2003). States with the greatest protection for
delinquent borrowers mandate a judicial foreclosure process and bar lenders from
deficiency judgments (i.e., taking a debtor’s non-housing assets to satisfy foreclosure
losses); the most creditor-friendly state laws allow lenders to pursue expedited non-
judicial foreclosures and to receive deficiency judgments. Two additional, intermediate
groups of states have only one of the judicial and deficiency judgment provisions, but
not both.
Even more important for our purposes, however, is the work of Li and Ernst (2006). Li
and Ernst (2006) undertook a detailed examination of how a “typical” subprime loan
will be regulated (if at all) under the many state laws that took effect between 2000 and
2005. They define a typical subprime loan as an owner-occupied first-lien conventional
refinance with a cash-out option, made by a non-depository lender for an amount at the
statewide median for subprime loans granted in the year when the respective state law
took effect. Their analysis also classifies state laws according to their interactions with
various provisions of federal law, and captures specific loan features and underwriting
practices that have transformed so many parts of low-income homeownership over the
last decade. For each specific term and practice, Li and Ernst (2006) code states to a
three-level ordinal scheme: 1 denotes states where the only protection, such as it is,
relies on the weak and easily-skirted federal Home Ownership Equity Protection Act
(HOEPA); 2 denotes some additional regulation mandated by state law; and 3
represents a distinct, higher level of borrower protection. These ordinal variables are
defined to measure the net results of tradeoffs and compromises in different states’
regulation of many separate facets of the mortgage-lending transaction: maximum
43
allowable points and fees, the inclusion of yield spread premiums in the calculation of
fees, the duration and amount of prepayment penalties, the quick repetition of
transactions with the same borrower (loan flipping), pre-loan counseling provisions and
fee limits for high-cost products, legal remedies for lender violations, and overall
coverage (e.g., whether the law covers open-ended home equity loans). Taken together,
the information compiled by Ambrose and Pennington-Cross (2000), Li and Ernst
(2006), and Pence (2003) allow us to distill the extraordinary complexity of state legal
and regulatory regimes into seven clear and consistent measures of the degree of
protection against predatory abuses. This was never before possible.
We constructed a matrix comparing each of the fifty states and the District of Columbia
according to these regulatory measures. We calculated the inverse of Gower’s
similarity coefficient, a metric specifically designed to correlate variables coded on
nominal and/or ordinal scales so that numerical operations requiring a positive semi-
definite correlation matrix can be used in subsequent analytical procedures (Gower,
1971, p. 865). Taking the Gower inverse creates a lower-triangular distance matrix:
each cell denotes the distance separating two states in the politically and legally
constructed space of regulation in the mortgage market. We then use a close relative of
cluster analysis to visualize and map this newly-created space (Kruskal and Wish,
1978). Multidimensional scaling was always an implicit possibility within the Euclidian
spaces constructed by cluster analysis, but in the 1960s and 1970s the formalized
development of the necessary algorithms (Kruskal, 1964) finally allowed us to tell the
computer how to create the same sort of cognitive spatial representations that always
seem so prominent in the geographical imagination. As Gould quipped, “space is not a
wastepaper basket that sits there waiting for us to fill it with things, but something we
define to suit our needs.” (Gould, 1986, p. 202).

44
In this case, we need to map the spaces created by years of hard work and organizing
by many different professionals in the Community Reinvestment movement; creating
such a map involves an iterative series of matrix-algebraic operations to create a two-
dimensional, simplified representation (something like a conventional map) distilled
from the distances separating the states in the seven-dimensional space of mortgage
market regulation. As with all map projections, the operation involves some degree of
unavoidable distortion; but in this case, the un-transformed, raw data converge quite
quickly, yielding a quite robust badness-of-fit criterion of only 0.117, and an
encouragingly tight correlation (0.98) between the mathematically calculated and
mapped distances between all possible 1,275 state-pairs. If we adopt a generous
threshold of 0.20 as a problematic residual, only eleven state pairs cannot accurately be
captured in a two-dimensional map. Just as Greenland appears distorted in a Mercator
map projection, so Connecticut seems distorted when its lending legislation is
compared with that of Virginia, Arkansas, Michigan, Maryland, Iowa, and Missouri.7
In all of these cases, Connecticut is actually farther away from these states in regulation
space than it is possible to show on the two dimensional map: envision Connecticut
springing out of the page (like Joe Lieberman?) along a third dimension, to reflect its
distinctive regime of moderate coverage of points and fees, its requirement for judicial
foreclosure, and its provisions for a private cause of action for violations, with damages
equivalent to those available under HOEPA. Beyond this, however, Connecticut
provides few borrower protections; by contrast, Virginia (close by and similar in some
respects) has no restrictions on points and fees, but does regulate flipping, and does
have some high-cost protections; but Virginia state law permits lenders to pursue non-
7 Of the eleven significant residuals, Connecticut is involved in six, while Minnesota appears in three and
Illinois in two.

45
Figure 3. The Legal Space of State Anti-Predatory
Lending Laws and Foreclosure Regulations.
States with similar regulatory regimes are shown close together on the “map”
represented in the panel above; borrower protections are greater on the west side (left) of this
map. This map is, however, a two-dimensional representation derived from a matrix of
similarities between states measured on several regulatory variables (loan flipping, prepayment
penalties, points and fees, foreclosure rules, etc.). Simplifying this matrix in two dimensions does
introduce some error or ‘stress’ in the fabric of the map. The panel in the lower right shows residuals
between the raw data and the distances between pairs of states as shown in the map above; all
points would cluster on the diagonal if the model fit the data perfectly. In our analysis, the largest
residuals separate Virginia (from Connecticut and Georgia) and Connecticut (from not only
Virginia, but also Arkansas, Michigan, Maryland, and Iowa). Data Sources: Li and Ernst (2006),
Ambrose and Pennington-Cross (2000), Pence (2003).

46
judicial foreclosure along with deficiency judgments. These combinations of different
terms and regulations, in relation to the configuration of all the different regulations
among all the other states, are very hard to summarize in a two-dimensional space.
But for the vast majority of state comparisons the map is quite accurate, with few
distortions. Eleven states in the east-north-central section of this transformed map had,
as of 2004, absolutely no additional state protection beyond the weak Federal
regulations on high-cost lending: Alabama, Mississippi, Colorado, Nebraska, Nevada,
Wyoming, Utah, Tennessee, New Hampshire, Rhode Island, and Hawaii; these states
also allow lenders to use non-judicial foreclosures with deficiency judgments. As we
move farther from this cluster of unregulated state spaces, borrowers receive greater
protections against various types of predatory practices.8 But recall that state
legislatures must engage in a variety of trade-offs and compromises, yielding many
different kinds of interventions in the mortgage transaction. As of 2004, Illinois
intervened in loan flipping, requiring lenders to consider the net benefit of a loan for
certain refinance loans that otherwise fall below high-cost thresholds, and also has high-
cost loan protections such as counseling requirements. By contrast, Georgia’s
regulations focus on restricting points, fees, and prepayment penalties. The central area
of the map includes states with strong protections against flipping, but with moderate
or weak provisions for other terms. And finally, a group of states on the western fringe
of the map have passed legislation that regulates most or all of the terms identified by
Li and Ernst (2006) -- North Carolina, Massachusetts, West Virginia, and New Mexico.
New Mexico stands out as the gold standard as of 2004, thanks to SB 0449, the Home
Loan Protection Act, passed in April, 2003. New Mexico’s regulations cap points and
fees to two percent of the total loan amount, prohibit flipping “when the new loan does
not have reasonable, tangible net benefit to the borrower considering all of the
8 Note, however, that our portrayal of state regulatory space makes the rather problematic assumption
that all regulations are enforced by supervisory agencies with sufficient staff and budget resources.

47
circumstances,” restricts balloon provisions, bans negative amortization, asset-based
lending, prepayment penalties, credit-life insurance sales, and penalty interest rates,
and mandates counseling for high-cost loans. And the legislation also permits assignee
liability, a controversial issue that has led bond-rating agencies to refuse to grade
securities backed by loans made in certain states; New Mexico’s law caps damages in an
attempt to provide greater certainty for investors. In sum, New Mexico’s regulatory
environment in 2004 represented the culmination of more than a decade of research,
organizing, and strategic mobilization -- the best achievement of the Community
Reinvestment Movement so far. Has all of this work changed the experiences of
homeowners and home buyers? If so, how?
Modeling Subprime Segmentation
This is what is known from the work of Li and Ernst (2006), who negotiated access to a
proprietary subprime industry database of loans made between 1998 and 2004. Their
analyses indicate that the proportion of loans carrying abusive terms was 38 percent
lower in New Mexico compared with states that had no meaningful legislative reform;
they also found no significant difference in loan volume compared with unregulated
state, and they found no evidence to confirm fears that the market would respond to
restrictions on points and fees by charging higher interest rates. Our analysis evaluates
questions that are complementary to, but distinct from, Li and Ernst’s (2006) analysis of
the proprietary industry dataset. Specifically: has the achievement of legislative
victories like that in New Mexico altered the national landscape of subprime lending for
all institutions covered under HMDA? Have these regulations altered the chance that a
borrower will be slotted into the high-cost subprime market?
48
These are crucial questions. One skeptical reading of all the classifications presented
thus far -- the prevalence of subprime lending in McAllen, Texas, the array of Black-Belt
cities from the Carolina piedmont to the Mississippi Delta, the neighborhoods in Detroit
and East Baton Rouge -- is that we have only mapped the underlying variations in
creditworthiness of homeowners and home buyers. This is the conservative and
industry mantra: the subprime sector provides credit to those unworthy of prime, A-
rated loans, the argument goes, and the credit’s higher price is justified by the greater
risks of the borrowers. Unregulated competition, the argument continues, will ensure
that risk-based prices are driven down as far as possible while still encouraging lenders
to remain in business. This conservative perspective has been thoroughly discredited
(see Engel and McCoy, 2002, 2004; Howell, 2006; Immergluck, 2004; Squires, 2004). Yet
it remains pervasive and influential, and challenges us to refine our classification of the
urban system of subprime mortgage capital to account for the characteristics of
borrowers.
We calibrated a suite of models predicting the likelihood that an approved borrower
receives a rate-spread loan, as a function of applicant financial characteristics, lender
type, and racial/gender divisions. We also include an instrumental variable for a key
factor cited as justification for slotting certain individuals into the subprime sector:
credit history. For certain types of lenders, underwriters who deny an application are
required to report the reasons for their decision.9 Credit history is the single most
common reason cited, and many years ago these denial codes inspired Abariotes et al.
(1993) to devise an instrumental variable that would identify the distinctive profile of
9 Denial code reporting is mandatory for lending institutions regulated by the Office of the Comptroller of
the Currency, the Office of Thrift Supervision, and the National Credit Union Administration; the codes
are optional for lenders supervised by the Federal Reserve Board, the Federal Deposit Insurance
Corporation, and the U.S. Department of Housing and Urban Development (see OCC, 2004, p. 4).
Lenders can report up to three reasons from a list of nine alternatives, including an expansive, residual
“other” category.

49
applicants likely to raise red flags for underwriters (see also Holloway, 1998; Holloway
and Wyly, 2001; Myers and Chan, 1995). The approach involves estimating a logistic
regression model predicting the likelihood of an application being rejected specifically
for reasons of bad credit, as a function of the necessarily limited financial information in
the HMDA files. Estimating this bad credit denial model on a random sample of all
applications (including approvals) helps to avoid problems of circularity when the
instrument is subsequently used as a credit proxy in an accept/reject model; here, we
use the random sample simply for computational convenience in the lengthy
maximum-likelihood estimation.10 Our bad-credit model includes income and loan
amount, as well as loan purpose and other plausible correlates of differences in
applicant credit, and we also include gender and race/ethnicity. Gender and
race/ethnicity are certainly not permissible underwriting criteria like income and loan
amount. But including them in this model helps to give the benefit of the doubt to
underwriters and lenders: if women and/or racial/ethnic minorities have weaker credit
profiles even after accounting for income, including variables for different identities
will help to capture those weaker credit histories and create a bias against finding
evidence of racial discrimination. The credit instrument, that is, will err on the side of
treating gender and racial/ethnic inequalities as legitimate, credit-related underwriting
considerations, ensuring that any findings of remaining disparities will be conservative
under-estimates of the true degree of bias.
10 Altering the sample size has negligible effects on the parameters of the model.

50
Table 5. Logistic Regression Model of Bad-Credit Denials.
Parameter
Variable Estimate Odds Ratioa
Intercept -3.501 ***
Applicant income -0.00000643 *** 0.53
Income to loan ratio 0.1828 *** 1.77
Loan ratio squared -0.00007 0.95
Owner-occupied 0.3193 *** 1.38
Subordinate lien 0.3587 *** 1.43
No lien 1.2814 *** 3.60
Pre-approval requested -0.8372 *** 0.43
OTS regulated lenderb -0.0331 0.97
NCUA regulated lender -1.4243 *** 0.24
Home improvement 1.6149 *** 5.03
Refinance 0.8124 *** 2.25
Loan ratio * improvement -0.1254 *** 0.88
Loan ratio * refinance -0.0724 *** 0.93
Loan ratio * owner occupied -0.0252 ** 0.98
Demographic information missing 0.4055 *** 1.50
Female primary applicant 0.1141 *** 1.12
Hispanic 0.8116 *** 2.25
Native American 0.722 *** 2.06
Asian 0.0131 1.01
Black 1.1351 *** 3.11
Number of observations 123,370
Nagelkerke max R-squared 0.1551
Percent concordant 75.2
a For continuous variables, odds ratios are reported as the effect of a one-
standard deviation increase in the predictor.b Reference categories are: for regulator, OCC; for loan purpose, purchase;
for demographic category, Non-Hispanic White males.
*Parameter significant at P<0.05; **P<0.01; ***P<0.001.
Our model indicates that bad-credit denials are more likely for lower-income
applicants, but after controlling for income, higher income to loan ratios are more likely
to be turned down for reasons of credit (Table 5). Lower-income borrowers applying
for relatively small loans, that is, appear to present the worst credit risks to
underwriters. All else constant, bad-credit denials are much more likely for refinance

51
and home improvement applications. Female primary applicants are slightly more
likely to be rejected for bad credit, but African Americans are more than three times as
likely to be denied, even after controlling for income and all other factors in the model.
Latinos and Native Americans are more than twice as likely as Anglo Whites to
encounter bad-credit rejections.
We used the parameters from the bad-credit model to calculate a continuous probability
estimate for every applicant in the dataset. This measure represents each individual
applicant’s statistical similarity to those borrowers eventually rejected by underwriters
who specifically cite credit history as a justification. This approach allows us to assess
the effect of borrower risk factors when we estimate a broader model of the division
between prime and subprime loans among borrowers who are approved for loans
(Table 6).11 Without controlling for credit (Model 1), key determinants of whether a
borrower will get a rate-spread loan include loan purpose, and whether the mortgage is
a first or second lien; increasing applicant income by one standard deviation reduces
subprime likelihood by a factor of 0.41. Controlling for credit history (Model 2),
however, suggests that most of the differences between purchase, renovation, and
refinance applicants stem from lenders’ assessments of borrower credit risk: comparing
those of similar credit quality, renovation and refinance loans are actually less likely to
be subprime.
Controlling for demand-side factors such as applicant income and credit risk allows us
to provide a rigorous focus on the dynamics of capital in driving subprime
segmentation (Table 6, Model 3). Three findings stand out. First, note that racial/ethnic
and gender disparities cannot be explained solely in terms of borrower deficiencies.
11 Once again, we estimated this model on a random sample of all approved applications, with the smaller
number of observations mitigating the inflation of spurious signifance tests for parameters.

52
Female primary applicants are, all else constant, 1.32 times more likely to end up with
subprime credit. Racial/ethnic inequalities are even more pronounced. African
Table 6. Model of Subprime Mortgage Segmentation, 2004.
Parameter Odds Parameter Odds Parameter Odds
Parameter Estimate Ratioa Estimate Ratioa Estimate Ratioa
Intercept -0.8637 *** -1.8247 *** -4.0743 ***
Applicant income -0.00000965 *** 0.411 -0.00000501 *** 0.630 -0.00000852 *** 0.457
Income squared 0.00000000000501 *** 1.622 0.00000000000279 *** 1.309 0.00000000000437 *** 1.524
Income to loan ratio 0.1477 *** 1.357 0.1453 *** 1.350 0.1837 *** 1.462
Loan ratio squared -0.00487 ** 0.651 -0.00265 * 0.791 -0.00317 * 0.756
Owner-occupied -0.3391 *** 0.712 -0.4549 *** 0.635 -0.2892 ** 0.749
Subordinate lien 0.9395 *** 2.559 0.4765 *** 1.610 0.502 *** 1.652
Pre-approval requested -0.3027 * 0.739 0.1489 1.161 -0.3586 * 0.699
OCC-regulated lender -1.6043 *** 0.201 -1.6057 *** 0.201 -1.787 *** 0.167
OTS-regulated lender -1.7107 *** 0.181 -1.7106 *** 0.181 -2.1983 *** 0.111
FDIC-regulated lender -0.6514 *** 0.521 -0.6047 *** 0.546 -1.1414 *** 0.319
NCUA-regulated lender -1.8569 *** 0.156 -0.9454 *** 0.389 -2.4496 *** 0.086
HUD-regulated lender 0.6679 *** 1.950 0.6184 *** 1.856 0.1767 * 1.193
Home improvement -0.1541 0.857 -1.1074 *** 0.330 -0.1827 0.833
Refinance 0.1328 * 1.142 -0.4527 *** 0.636 -0.00716 0.993
Credit history instrument 20.3851 *** 3.699 5.2483 1.400
Credit instrument squared -42.8336 *** 0.299 -21.4294 *** 0.547
Demographic information missing 0.285 *** 1.330
Female primary applicant 0.2759 *** 1.318
Hispanic 0.3805 ** 1.463
Native American 0.1567 1.170
Asian -0.5719 *** 0.564
Black 1.0607 *** 2.889
Loan not sold in same year as origination 3.3116 *** 27.429
Loan sold through private securitization 2.8268 *** 16.892
Loan sold to bank or savings institution 2.7575 *** 15.760
Loan sold to life insurance company or finance company 2.5683 *** 13.044
Loan sold to affiliate institution 2.8811 *** 17.834
Loan sold to other purchaser 3.1341 *** 22.967
Distance from New Mexico in state regulatory space 1.2509 ** 1.394
Distance squared -1.0328 ** 0.729
Number of observations 14,390 14,390 14,390
Nagelkerke max R-squared 0.2133 0.2409 0.3276
Percent concordant 77.4 78.8 83.2
a For continuous variables, odds ratios are reported as the effect of a one-standard deviation increase in the predictor.
b Reference categories are: for regulator, FRB-regulated; for loan purpose, purchase; for demographic information, non-Hispanic White male
primary applicants; for loan sales, to Fannie Mae, Freddie Mac, Ginnie Mae, or Farmer Mac.
*Parameter significant at P<0.05; **P<0.01; ***P<0.001.
Americans are almost three times more likely to wind up with subprime credit
compared with otherwise identical non-Latino Whites. Given that racial/ethnic

53
differences in credit are already included in the credit instrument, the disparities
reported here must be regarded as conservative underestimates. Second, securitization
networks differ sharply between the prime and subprime segments. Thanks to a series
of policy reforms at the giant Government Sponsored Enterprises, Fannie Mae and
Freddie Mac avoid direct purchases of subprime originations (although they do hold
some subprime positions through bond pools). Originators who sell their loans into the
secondary market in the same year sell prime notes to the GSEs, while subprime paper
is either held in portfolio or sold to other types of purchasers.
Our third and final finding concerns the new space created by years of work in the
Community Reinvestment Movement. We calculated the statistical distance between
each state and New Mexico, measured in the seven-dimensional space of the varied
predatory loan regulations. Adding this variable to the loan segmentation models
provides a unique, direct way of assessing the legal and regulatory frontier: do
borrowers in state legal environments that are far away from the achievements of New
Mexico face any different likelihood of winding up with subprime credit? Our analysis
suggests that the answer is unequivocally yes. The distance measure is positive and
statistically significant. All else constant, going ‘away’ from New Mexico in state
regulatory space by one standard deviation -- in the units of the map of Figure 3, going
from New Mexico to a bit beyond New Jersey -- increases the odds of segmentation by a
factor of 1.4. This effect is robust to other model specifications: the distance measure is
positive and significant when the model is estimated without the credit instrument and
secondary market variables, and also in models excluding gender and race/ethnicity.
But the effect is clearly non-linear. Borrowers in states close to New Mexico’s
progressive regulatory climate have lower chances of winding up with a subprime loan;
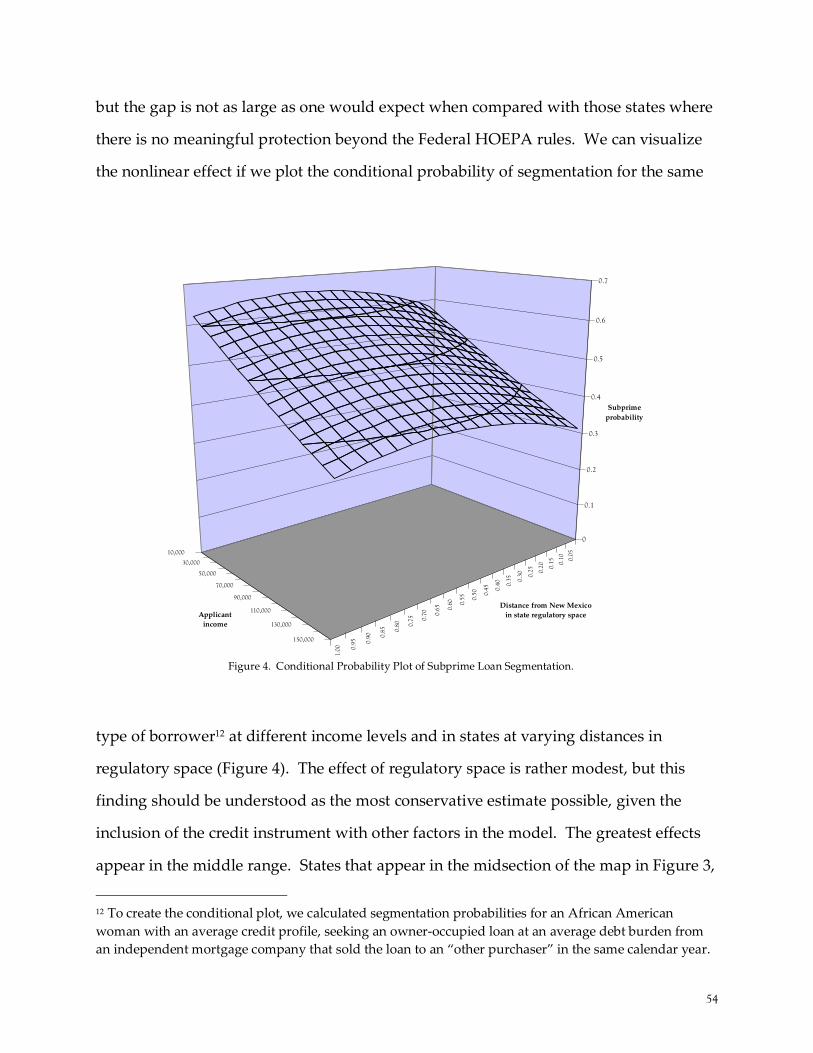
54
but the gap is not as large as one would expect when compared with those states where
there is no meaningful protection beyond the Federal HOEPA rules. We can visualize
the nonlinear effect if we plot the conditional probability of segmentation for the same
0.05
0.10
0.15
0.20
0.25
0.30
0.35
0.40
0.45
0.50
0.55
0.60
0.65
0.70
0.75
0.80
0.85
0.90
0.95
1.00
10,000
30,000
50,000
70,000
90,000
110,000
130,000
150,000
0
0.1
0.2
0.3
0.4
0.5
0.6
0.7
Subprime
probability
Distance from New Mexico
in state regulatory spaceApplicant
income
Figure 4. Conditional Probability Plot of Subprime Loan Segmentation.
type of borrower12 at different income levels and in states at varying distances in
regulatory space (Figure 4). The effect of regulatory space is rather modest, but this
finding should be understood as the most conservative estimate possible, given the
inclusion of the credit instrument with other factors in the model. The greatest effects
appear in the middle range. States that appear in the midsection of the map in Figure 3,
12 To create the conditional plot, we calculated segmentation probabilities for an African American
woman with an average credit profile, seeking an owner-occupied loan at an average debt burden from
an independent mortgage company that sold the loan to an “other purchaser” in the same calendar year.

55
such as Georgia, Arkansas, Washington, DC, Minnesota, Texas, Illinois, and almost all
the way over to Ohio, Missouri, Michigan, Iowa, Alaska, and Vermont. In this middle
ground, after controlling for all other factors in the model, a borrower is between seven
and eight percentage points more likely to end up in the subprime market compared
with an otherwise identical borrower in the most comprehensive regulatory
environment. This finding suggests that the net effects of subprime market dynamics
and legislative reforms are most turbulent in the battlegrounds where states have
imposed only a few specific limitations on certain types of market behaviors (thus
permitting predators to pursue innovative exploitation strategies through the
loopholes). For more distant, less regulated states, subprime and predatory market
penetration are certainly major problems. But when we control for a measure of
creditworthiness that may itself mask a certain amount of discriminatory steering,
much of the prevalence of subprime lending in these states can be explained in terms of
applicant characteristics.
These results offer robust evidence that complements other empirical studies of
racialized and gendered market segmentation (Calem et al., 2004; Immergluck, 2004)
and of the success of state-level reforms in reducing predatory practices while not
shutting off legitimate market activity (Quercia et al., 2004; Li and Ernst, 2006). But our
use of a measure that collapses the multiple dimensions of state regulation into a single
variable certainly does gloss over important contingencies in various state-level battles
over permissible market practices. It is also important to recognize that many of the
relations included in our segmentation model (debt burden, credit history, etc.) have
different effects by gender and race/ethnicity.13 Each of these issues merits further
13 To test whether the state regulatory distance variable has disparate effects, we re-estimated the
segmentation model with interaction terms for all demographic identifiers. Results indicate that the
56
investigation. But the evidence thus far confirms that the culmination of more than a
decade of research and policy advocacy at the state level has led to measurable shifts in
the geography of subprime segmentation.
Conclusions
Not long ago, changes to Federal financial institution disclosure rules provided new,
loan-level information on high-cost subprime mortgages. In this paper, we explored the
first full year of loan records made available under the new rules, as a way of mapping
the penetration of subprime mortgage capital into various parts of the American urban
system. Some of our analysis has been methodologically illustrative, demonstrating the
value of classification techniques for identifying distinctive credit environments in
certain types of cities and suburbs. Subprime market penetration clearly distinguishes
metropolitan areas that embody the interplay between today’s exploitative inclusion
and earlier eras of racialized exclusion, illustrated most clearly in a broad swathe of
metropolitan areas in a Black Belt of financial exploitation, from the Carolina piedmont
to the Mississippi Delta. But part of our narrative has followed a more traditional
analytical path, testing the hypothesis that the topography of subprime lending across
different metropolitan areas is more than just a reflection of the geography of high-risk,
poor-credit borrowers. Even after accounting for income, loan amount, and an estimate
of credit risk that may itself incorporate racial discrimination, we still find that African
Americans are almost three times more likely than Anglo Whites to end up with
subprime credit. But part of our analysis has also sought to revive an old, often-
overlooked way of mapping the spaces created by human struggles in the dynamic
environment of regulations and markets in American housing policy. Fusing
effects of regulatory distance are significantly greater for female primary applicants, and significantly
reduced for Hispanic borrowers.

57
multidimensional scaling techniques with logit regression, we find compelling evidence
that the state-level reforms pursued by the Community Reinvestment Movement over
the past decade have significantly altered the spatiality of subprime credit
segmentation. Still, our multidimensional scaling analysis captures the state of struggle
at a single point in time -- 2004 -- and there is little doubt that subsequent developments
have etched new geographies, some of them quite controversial. Illinois, a state in the
contested middle ground with a few targeted regulations in 2004, passed legislation the
next year requiring counseling for borrowers with low credit scores seeking high-cost
loans in certain parts of Chicago’s South Side, prompting not only an industry backlash
but also a few charges of racism from civil rights and community organizations.
Moreover, the dynamic patchwork of state and local regulations presents difficult long-
term strategic choices: if indeed the industry partisans are correct in their assertions
that tight rules will encourage lenders to withdraw and shut off legitimate credit to
some states, how should advocates divide resources between achievable state-level
reforms and more difficult campaigns at the federal level? The Senate Banking
Committee is set to convene hearings on predatory lending under the new Democratic
leadership in Congress, but the politics of federalism present serious challenges to
meaningful, strong regulation at the national scale.
As we write the first draft of this paper, the financial pages are filled with sordid
chronicles of the irrational exuberance of subprime lending. Two weeks after American
financial analysts laid blame for a 416-point slide in the Dow on a previous day’s slide
on the Shanghai exchange, Asian and European stock markets repaid the favor with a
hemorrhage “as concerns spread about the consequences of loose lending practices in
the American housing market” (Timmons and Werdigier, 2007, p. C1). The Mortgage
Bankers Association disclosed that the percentage of homes entering the foreclosure
process reached the highest figure in the 37-year history of the statistic, and journalists
58
began to draw vivid parallels to the collapse of Enron, WorldCom, and other mirages of
yesterday’s new economy. Perhaps the most colorful illustration was the red
convertible Ferrari driven by an executive at the notorious, imploded New Century
Financial (Creswell and Bajaj, 2007). The obscure terminology of the subprime sector is
now appearing on prime-time exposes of “liar’s loans” (loans with no income
verification), teaser-rate ARMS (adjustable-rate mortgages that re-set to higher rates
after two or three years), hybrid ARMS (suitably dubbed “HARMS”), and at least one
creative lender’s advertisements for NINJA loans: No Income, No Job, no Assets
(Pearlstein, 2007, p. D1). Unfortunately, a market catastrophe produced by the
irresponsible behavior of capital has ushered in a new round of conservative attempts
to shift the blame to consumers. Despite mounting evidence that the riskiest subprime
loans have involved products pushed on consumers, and exotic instruments designed
to help higher-income and speculative buyers qualify for larger loans in overheated
housing markets, the Wall Street Journal took the opportunity to suggest that the
spreading insolvency of subprime lenders simply proves that they were charging too
little to compensate for the credit risks of their clientele (Wall Street Journal, 2007).
Amidst this flood of press coverage of subprime, of what the Economist dubbed
“Subterranean Homesick Blues,” our analysis might appear somewhat dated. But
looking back on the urban system of subprime lending in 2004 offers valuable insights:
the first year of enhanced HMDA data coincided with the first years of growth in the
now ill-fated subprime boom. In other words, our evidence for 2004 is something of a
best-case scenario, and almost certainly yields less damning evidence compared with
the industry excesses of 2005 and 2006. In the end, however, the most hopeful result of
our analysis is that we find clear and compelling evidence that strategic research,
targeted activism, and judicious legislation can be successful in reducing the
stratification and exploitation of segmented mortgage markets.
59
References
Abariotes, Andrianna, Sarita Ahuja, Helen Feldman, Carol Johnson, Lekha Subaiya, Nathan Tiller, Julie
Urban, and Samuel L. Myers, Jr. 1993. Disparities in Mortgage Lending in the Upper Midwest: Summary
Results Using 1992 Home Mortgage Disclosure Act Data. Paper presented at the Fannie Mae University
Colloquium on Race, Poverty, and Housing Policy. Minneapolis, MN, December 3.
Abler, Ronald, John S. Adams, and Peter R. Gould. 1971. Spatial Organization: The Geographer’s View of the
World. Englewood Cliffs, NJ: Prentice-Hall.
Ambrose, Brent W., and Anthony Pennington-Cross. 2000. “Local Economic Risk Factors and the
Primary and Secondary Mortgage Markets.” Regional Science and Urban Economics 30, 683-701.
Americans For Fairness In Lending (AFFIL). 2007. Press Release, AFFIL Launch in New York City.
Circulated by National Consumer Law Center to Predatory Lending Research listserv,
[email protected], February 27. http://www.affil.org
Anderson, Jenny, and Vikas Bajaj. 2007. “Calm Returns to Market, but Worries Persist Over Subprime
Loans.” New York Times, March 1, p. C1, C4.
Andrews, Edmund L. 2007a. “Bernanke Not Worried About Market Drop.” New York Times, March 1, p.
C5.
Andrews, Edmund L. 2007b. “Ex-Fed Chief May be Gone, but Not Forgotten.” New York Times, March 2,
p. C1, C7.
Bailey, Daniel E. 1970. “Preface.” In Robert C. Tryon and Daniel E. Bailey, Cluster Analysis. New York:
McGraw-Hill, xi-xiv.
Berry, Brian J.L., ed. 1972. City Classification Handbook: Methods and Applications. New York: Wiley-
Interscience.
Berry, Brian J.L. 1964. “Cities as Systems within Systems of Cities.” Papers of the Regional Science
Assocation 13, 147-163.
Berry, Brian J.L., and John D. Kasarda. 1977. Contemporary Urban Ecology. New York: Macmillan.
Butera & Andrews. 2007. State and Local Predatory Lending Laws, as of January 22, 2007.
http://www.butera-andrews.com. Washington, DC: Butera & Andrews, Attorneys at Law.
Butera & Andrews. 2004a. 2004 Detailed Status Summary Chart of State and Local Predatory Lending
Legislation, as of January 23, 2004. Electronic document distributed by listserv. Washington, DC: Butera &
Andrews, Attorneys at Law.
Butera & Andrews. 2004b. 2004 State and Local Predatory Lending Bill Scorecard, as of January 23, 2004.
Electronic document distributed by listserv. Washington, DC: Butera & Andrews, Attorneys at Law.
Calem, Paul S., Jonathan E. Hershaff, and Susan M. Wachter. 2004. “Neighborhood Patterns of Subprime
Lending: Evidence from Disparate Cities.” Housing Policy Debate 15(3), 603-622.
CBC News. 2007. “HSBC Warning Focuses Attention on U.S. Mortgage Sector.” CBC News Transcript,
February 9.
Cervantes, Ileana, and Peter J. Shimkus. 2004. USA Credit Analysis: Popular, Inc. Chicago: Fitch Ratings.
Cox, Kevin R. 1998. “Spaces of Dependence, Spaces of Engagement, and the Politics of Scale.” Political
Geography 17, 1-23.
60
Cox, Kevin R. 1993. “The Local and the Global in the New Urban Politics: A Critical View.”
Environment and Planning D, Society and Space 11, 433-448.
Creswell, Julie, and Vikas Bajaj. 2007. “Mortgage Crisis Begins to Spiral, and the Casualties Mount.”
New York Times, March 5, C1, C4.
Curry, Michael R. 1997. “The Digital Individual and the Private Realm.” Annals of the Association of
American Geographers 87(4), 681-699.
Du Bois, W.E.B. 2003 [1903]. The Souls of Black Folk. New York: Barnes & Nobles Classics.
Dymski, Gary. 1999. The Bank Merger Wave: The Economic Causes and Social Consequences of Financial
Consolidation. Armonk, NY: M.E. Sharpe.
Engel, Kathleen C., and Patricia A. McCoy. 2002. “A Tale of Three Markets: The Law and Economics of
Predatory Lending.” Texas Law Review 80(6), 1255-1381.
Federal Financial Institutions Examination Council (FFIEC). Annual. Home Mortgage Disclosure Act, Raw
Loan Application Register Data, CD ROM. Washington, DC: Federal Reserve Board.
Finch, Holmes. 2005. “Comparison of Distance Measures in Cluster Analysis with Dichotomous Data.”
Journal of Data Science 3, 85-100.
Friedmann, John C. 1982. “The World City Hypothesis.” Development and Change 17(1), 69-83.
GAWC. 2007. Globalization and World Cities Research Group. Loughborough: Department of Geography,
Loughborough University. http://www.lboro.ac.uk/gawc, last accessed March 3.
Gower, J.C. 1971. “A General Coefficient of Similarity and Some of its Properties.” Biometrics 27(4), 857-
871.
Gould, Peter R. 1986. The Geographer at Work. London: Routledge and Kegan Paul.
Gould, Peter R. 1999. “Do Foraminifera Assemblages Exist -- at Least in the Persian Gulf?” In Becoming a
Geographer, 289-299. Syracuse: Syracuse University Press.
Harmon, Harry H. 1967. Modern Factor Analysis. Chicago: University of Chicago Press.
Harris, Chauncy D. 1943. “A Functional Classification of Cities in the United States.” Geographical
Review 33(1), 86-99.
Holloway, Steven R. 1998. “Exploring the Neighborhood Contingency of Race Discrimination in
Mortgage Lending in Columbus, Ohio.” Annals of the Association of American Geographers 88(2), 252-276.
Holloway, Steven R., and Elvin Wyly. 2001. “The Color of Money Expanded: Geographically
Contingent Mortgage Lending in Atlanta, Georgia.” Journal of Housing Research 12(1), 55-90.
Howell, Benjamin. 2006. “Exploiting Race and Space: Concentrated Subprime Lending as Housing
Discrimination.” California Law Review 94, 101-147.
Immergluck, Dan. 2004. Credit to the Community: Community Reinvestment and Fair Lending Policy in the
United States. Armonk, NY: M.E. Sharpe.
Jackson, Kenneth T. 1985. Crabgrass Frontier: The Suburbanization of the United States. New York: Oxford
University Press.
Jennings, James. 1994. Understanding the Nature of Poverty in Urban America. Westport, CT: Praeger.
61
Kitchin, Rob. 2006. “Positivistic Geographies and Spatial Science.” In Stuart Aitken and Gill Valentine,
eds., Approaches to Human Geography. Thousand Oaks, CA: Sage Publications, 20-29.
Knox, Paul L., and Peter J. Taylor, eds. 1995. World Cities in a World-System. Cambridge: Cambridge
University Press.
Kruskal, J.B. 1964. “Nonmetric Multidimensional Scaling.” Psychometrika 29, 115-129.
Kruska, J.B., and M. Wish. 1978. Multidimensional Scaling. QASS No. 07-011. Thousand Oaks, CA: Sage
Publications.
Latour, Bruno. 2004. “Why Has Critique Run Out of Steam? From Matters of Fact to Matters of
Concern.” Critical Inquiry 30, 225-248.
Lee, Matthew. 2007. “The Wells Fargo Watch.” Inner City Press,
http://www.innercitypress.org/wells.html, last accessed March 14.
Li, Wei S., and Keith Ernst. 2006. The Best Value in the Subprime Market: State Predatory Lending Reforms.
Durham, NC: Center for Responsible Lending. Paper also presented at the American Real Estate and
Urban Economics Association Conference, January 2006.
Listokin, David, Elvin Wyly, Larry Keating, Kristopher Rengert, and Barbara Listokin. 2000. Making New
Mortgage Markets. Washington, DC: Fannie Mae Foundation.
Lorr, Maurice. 1983. Cluster Analysis for Social Scientists. San Francisco: Jossey-Bass.
Massey, Doreen, and Richard Meegan, eds. 1985. Politics and Method: Contrasting Studies in Industrial
Geography. London: Routledge.
McConnell, Eileen Diaz, and Timothy Ready. 2005. The Roof Over Our Heads: Hispanic Housing in the
United States. South Bend, IN: Institute for Latino Studies, University of Notre Dame.
Myers, Samuel, L., Jr., and Tsze Chan. 1995. “Racial Discrimination in Housing Markets: Accounting for
Credit Risk.” Social Science Quarterly 76, 543-561.
Myrdal, Gunnar. 1944. An American Dilemma: The Negro Problem and American Democracy. New York:
Harper and Row.
Nelson, Howard J. 1955. “A Service Classification of American Cities.” Economic Geography 31(3), 189-
210.
Norris, Floyd, and Jeremy W. Peters. 2007. “Slide on Wall Street Adds to Worries about Economy: Dow
Tumbles 416 Points.” New York Times, February 28, p. A1, C16.
Office of the Comptroller of the Currency. 2004. Home Mortgage Disclosure Act Examination Procedures.
Advisory Letter OCC 2004-15. Washington, DC: OCC.
Origination News. 2006. “HMDA Lender Reports Show Subprime Up 70%.” Origination News
(Nonprime News section), 16(1), October, p. 81.
Page, Clarence. 2004. “Preface: Loan Sharks in Pinstripes.” In Gregory D. Squires, ed., Why the Poor Pay
More. Westport, CT: Praeger, vii-ix.
Paletta, Damian. 2004. “Bracing for Upcoming Release of HMDA Data.” American Banker, November 30.
Parker, Dennis D. 2005. Letter to Richard M. Kovacevich, Presidenti and CEO, and James M. Strother,
Executive Vice President and General Counsel, Wells Fargo & Company. April 19. Albany and New York City:
New York Department of Law.

62
Pearlstein, Steven. 2007. “No Money Down Falls Flat.” Washington Post, March 14, D1.
Peck, Jamie. 2007. “Liberating the City: Between New York and New Orleans.” forthcoming, Urban
Geography.
Pence, Karen M. 2003. Foreclosing on Opportunity: State Laws and Mortgage Credit. Washington, DC:
Board of Governors of the Federal Reserve system.
Poon, Jessie P.H. (2005). “Quantitative Methods: Not Positively Positivist.” Progress in Human Geography
29(6), 766-772.
Poon, Jessie P.H. (2004). “Quantitative Methods: Past and Present.” Progress in Human Geography 28(6),
807-814.
Poon, Jessie P.H. (2003). “Quantitative Methods: Producing Quantitative Methods Narratives.” Progress
in Human Geography 27(6), 753-762.
Pulido, Laura (2000). “Rethinking Environmental Racism: White Privilege and Urban Development in
Southern California.” Annals of the Association of American Geographers 90(1), 12-40.
Quercia, Roberto G., Michael A. Stegman, and Walter R. Davis. 2004. “Assessing the Impacts of North
Carolina’s Predatory Lending Law.” Housing Policy Debate 15(3), 573-601.
Relman, John P., Fred Rivera, Meera Trehan, and Shilpa S. Satoskar. 2004. “Designing Federal
Legislation that Works: Legal Remedies for Predatory Lending.” In Gregory D.
Renuart, Elizabeth. 2004. “An Overview of the Predatory Lending Process.” Housing Policy Debate 15(3),
467-502.
Ross, Stephen L., and John Yinger. 2002. The Color of Credit: Mortgage Discrimination, Research
Methodology, and Fair-Lending Enforcement. Cambridge, MA: MIT Press.
Squires, ed., Why the Poor Pay More: How to Stop Predatory Lending. Westport, CT: Praeger, 153-184.
Richardson, Chad, and Jose A. Pagan. 2002. Human and Social Aspects of Cross-Border Development in the
McAllen/Reynosa Area. Working Paper No. 2002-9. Edinburg, Texas: Center for Border Economic Studies,
University of Texas-Pan American.
Reuters. 2007. “Puerto Rico’s Popular Quits U.S. Subprime Business.” Reuters Business wire, January 9.
Samuels, Adrienne P. 2006. “Scrutiny on Loan Officers Urged.” The Boston Globe, August 28.
Sarle, W.S. 1983. SAS Technical Report A-108, Cubic Clustering Criterion. Cary, NC: SAS Institute, Inc.
SAS Institute. 2003. The Distance Macro, SAS Release 8.2. Cary, NC: SAS Institute, Inc.
Sassen, Saskia, ed. 2002. Global Networks, Linked Cities. New York: Routledge.
Sassen, Saskia. 2001. The Global City: New York, London, Tokyo. Second Edition. Princeton: Princeton
University Press.
Schanche, Don Jr. 2003. “Pricey Paydays: Critics Say Georgia’s Payday-Loan Industry is Growing Fast
by Targeting the Desperate.” Macon Telegraph, June 22, A1.
Scheessele, Randall M. 2002. Black and White Disparities in Subprime Mortgage Refinance Lending. Housing
Finance Working Paper Series. Office of Policy Development and Research. Washington, DC: U.S.
Department of Housing and Urban Development.
63
Shevky, E., and W. Bell. 1954. Social Area Analysis: Theory, Illustrative Application, and Computational
Procedures. Stanford: Stanford University Press.
Short, John Rennie. 2004. “Black Holes and Loose Connections in a Global Urban Network.” Professional
Geographer 56(2), 295-302.
Smith, Michael Peter. 2001. Transnational Urbanism: Locating Globalization. Oxford: Blackwell.
Sorkin, Andrew Ross. 2002. “HSBC to Buy a U.S. Lender for $14.2 Billion.” New York Times, November
15, p. C1, C10.
Stein, Sydney H. 2005. Office of the Comptroller of the Currencey v. Eliot Spitzer, Opinion and Order; The
Clearing House Association v. Eliot Spitzer, Opinion and Order. 05-Civ-5636, 05-Civ-5629. New York: U.S.
District Court.
Sugrue, Thomas J. 2005. The Origins of the Urban Crisis: Race and Inequality in Postwar Detroit. Second
Edition. Princeton: Princeton University Press.
Surran, Carl. 2007. “On Base: Fort Stewart.” Military Money. http://www.militarymoney.com, last
accessed March 7, originally published Spring, 2004.
Tam, Jeffrey. 2007. “Rare HSBC Warning Spawns Fear.” The Standard (Financial Times, London),
February 26.
Timmons, Heather, and Julia Werdigier. 2007. “Asian Stocks Plunge on Fears over U.S. Economy.” New
York Times, March 15, C1.
Taylor, Kelly Hewitt. 2006. “Driven to Save on Housing Costs; For Some, Commuting to Suburbs Costs
More than Monthly Mortgage.” The Birmingham News, November 20, p. 1A.
Taylor, Peter J. 2004. World City Network: A Global Urban Analysis. London and New York: Routledge.
Thrift, Nigel. 2004. “Transurbanism.” Urban Geography 25(8), 724-734.
Tibshirani, Robert, and Guenther Walther. 2005. “Cluster Validation by Prediction Strength.” Stanford:
Department of Health Research and Policy, Stanford University.
Tibshirani, Robert, Guenther Walther, and Trevor Hastie. 2001. “Estimating the Number of Clusters in a
Data Set via the Gap Statistic.” Journal of the Royal Statistical Society B 63, 411-423.
Tryon, Robert C., and Daniel E. Bailey. 1970. Cluster Analysis. New York: McGraw-Hill.
Tryon, Robert C. 1955. “Identification of Social Areas by Cluster Analysis.” University of California
Publications in Psychology 8(1), 1-100.
Twiddy, David. 2007. “Financial Shakeups Throw Future of Subprime Lending into Limbo.” Associated
Press State and Local Newswire, February 24.
Unger, Henry. 2003. “Predatory Lending Bill Sent to Perdue: Consumer Groups Angry Most Parties in
Mortgage Financing Chain Won’t be Liable.” Atlanta Journal-Constitution, March 7, p. 1A.
Wall Street Journal Editorial Page. 2007. “Subprime Politics: The Housing Boom is Over; Time to
Whoop on the Bankers.” Wall Street Journal, February 7.
Williams, Richard, Reynolds Nesiba, and Eileen Diaz McConnel. 2005. “The Changing Face of Inequality
in Home Mortgage Lending.” Social Problems 52(2), 181-208.
Wrigley, Charles. 1970. “Preface.” In Robert C. Tryon and Daniel E. Bailey, Cluster Analysis. New York:
McGraw-Hill, v-x.
Top Related