


Languages
Pages
Legal


ME 388 – Applied Instrumentation Laboratory
Fatigue Lab
Objectives
• Learn fatigue testing procedures– Wohler machine (Rotating cantilever beam
machine)– R.R. Moore (Rotating beam machine)
• Evaluate fatigue behavior of AA 6061-T6– Generate S-N diagram– Determine endurance limit
• Observe surface characteristics of fatigue failure
References
• Shigley and Mischke, Mechanical Engineering Design, 6th edition
• Metals Handbook, Vol.2, 10th edition, ASM International
• Holmon, Experimental Methods for Engineers, 6th edition
• www.matls.com
AA 6061 – T6
• Most common structural AlMgSi alloy
• Temper designation indicates thermal solutionizing and aging treatment to achieve strength
• See www.matls.com for properties

Properties (from www.matls.com)
• Density = 2700 kg/m3
• Yield strength = 275 MPa
• Tensile strength = 310 MPa
• Elongation = 12%
• Young’s Modulus = 69 GPa
• Poisson’s ratio = 0.33
• Fatigue strength = 95 MPa @ N = 5 108
Fatigue failure
• Fracture by cyclic stressing or straining
• The amplitude of or for fatigue failure may be well below those for static failures
• Fatigue process – Initiation of small cracks during “early” cycles– Propagation of cracks during subsequent
cycles – Fracture
Factors affecting fatigue
• Surface finish (amount and direction)
• Stress concentration or raisers
• Internal metal defects (voids, cracks, inclusions)
• Temperature
• Size
• Miscellaneous

Effect of Geometry
• Effect of geometry (i.e., a notch) is a “constraint” that favors higher stresses
• Small cracks reduce area producing a higher stress
• Stress concentration at the tip of small fissures provides a much greater influence
• Actual stress can be several orders of magnitude larger than the applied stress
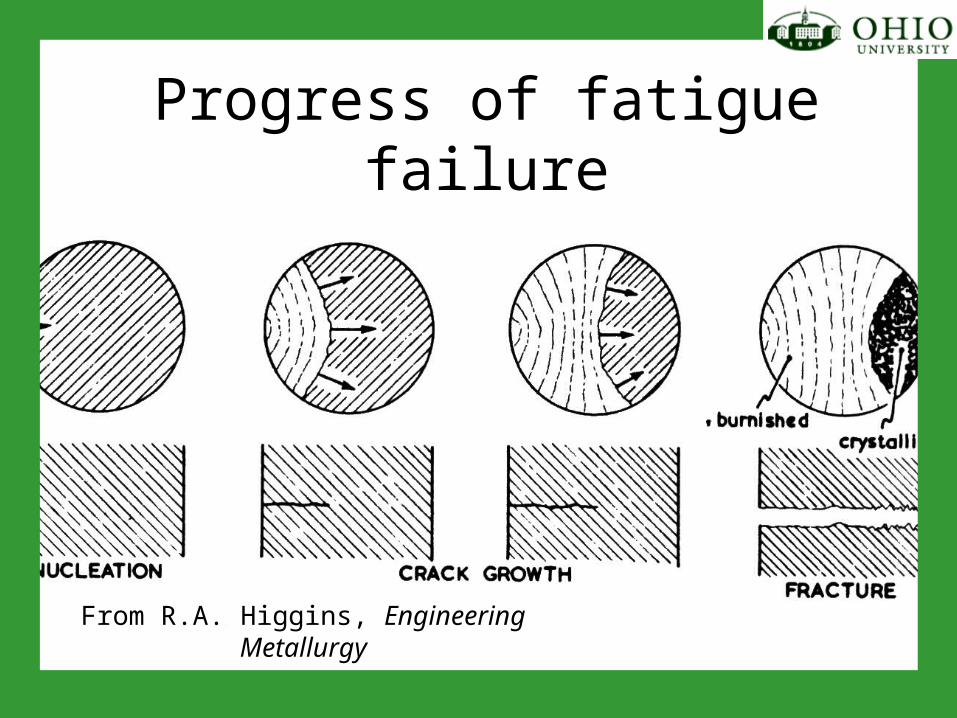
Progress of fatigue failure
From R.A. Higgins, Engineering Metallurgy
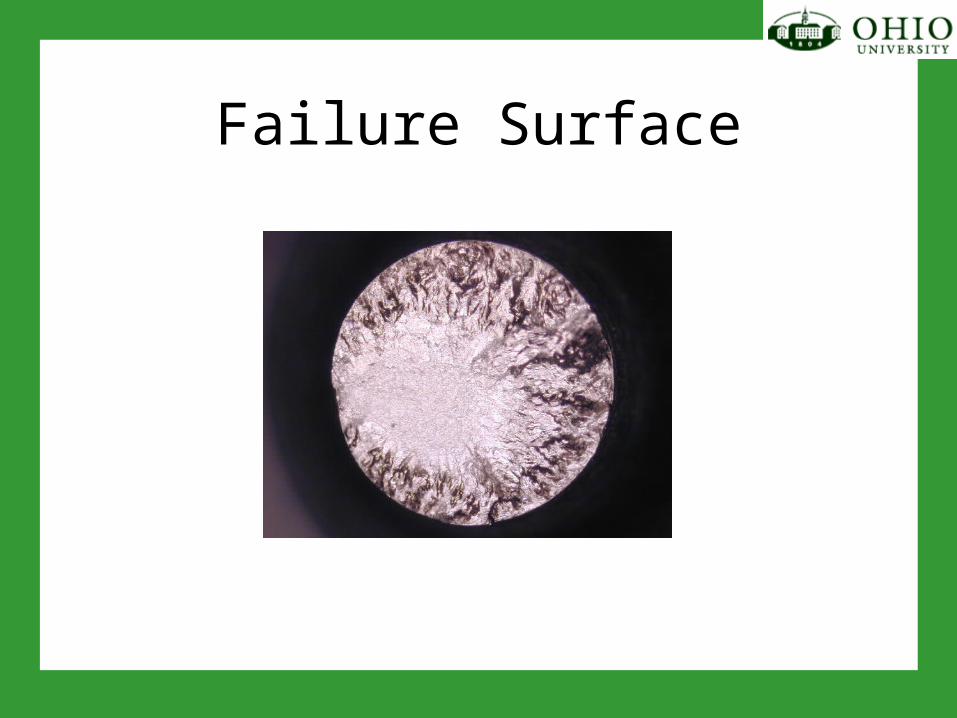
Failure Surface
Fatigue data• Plotted on S-N diagram
S = stress or strainN = number of cycles
• Fatigue is a statistical phenomenon with significant scatter
• Ferrous alloys typically show a distinct fatigue limit, below which failure does not occur (roughly UTS/2)
• Many non-ferrous alloys do not have a distinct fatigue limit
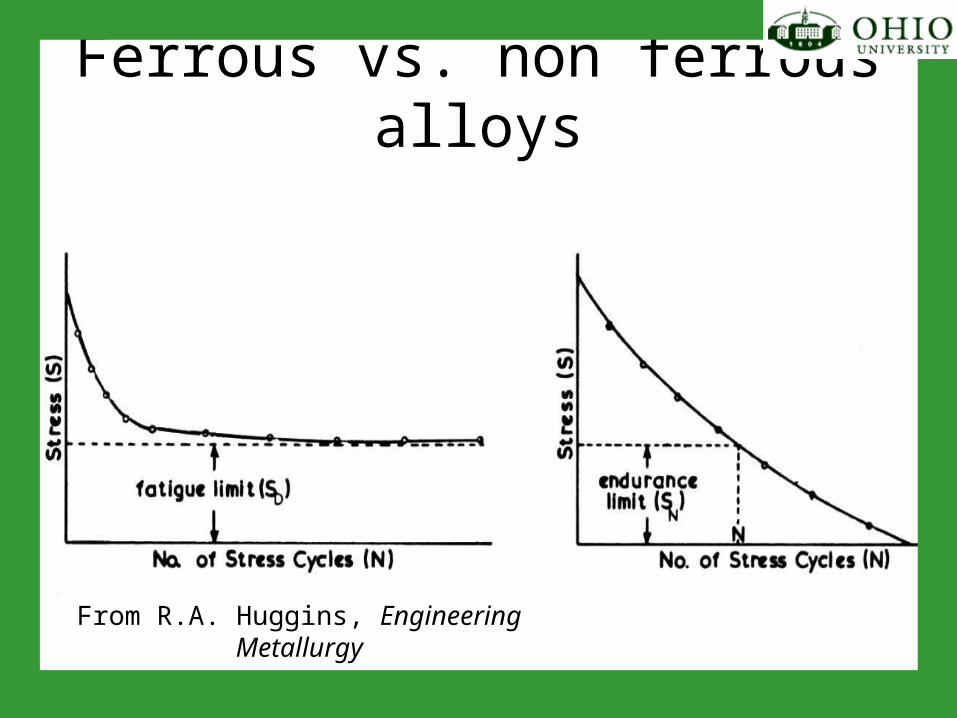
Ferrous vs. non ferrous alloys
From R.A. Huggins, Engineering Metallurgy
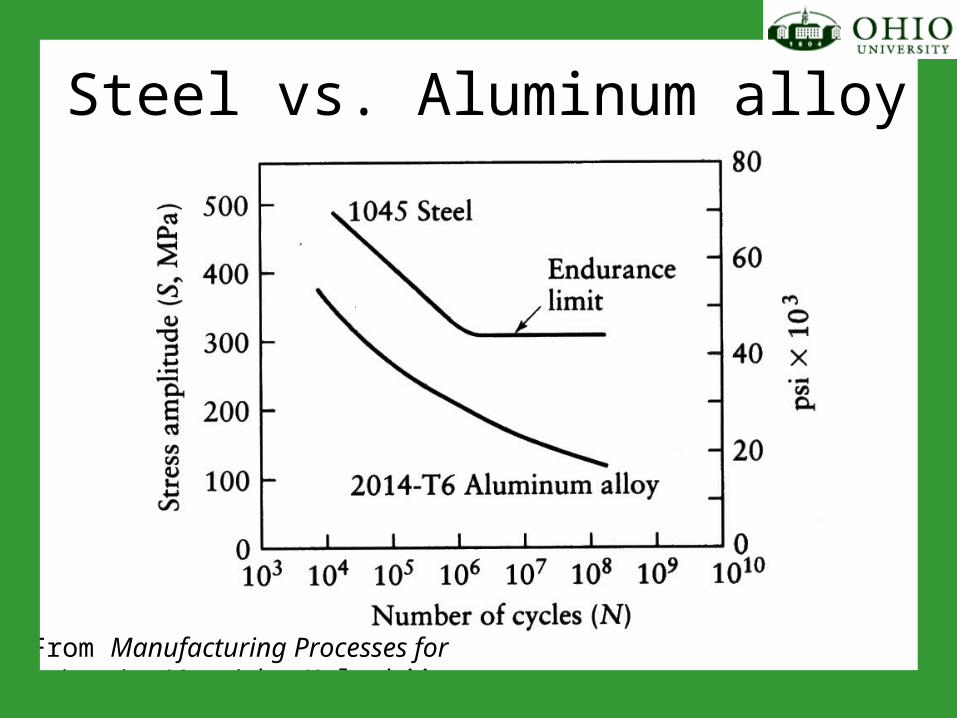
Steel vs. Aluminum alloy
From Manufacturing Processes for Engineering Materials, Kalpakjian
High cycle fatigue
• Greater than 103 cycles or more
• Sensitive to surface quality
• May involve little large scale plastic flow, characteristic of brittle fracture
• Local crack propagation may involve a wide variety of ductile and brittle phenomena
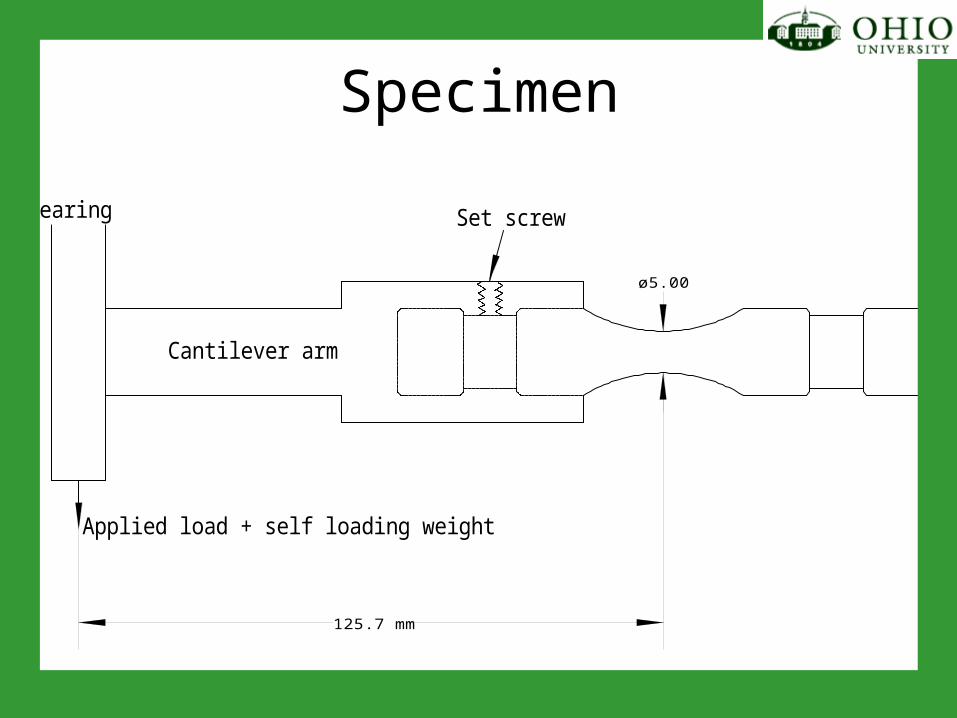
Specimen
125.7 mm
Applied load + self loading weight
Bearing
Cantilever arm
ø5.00
Set screw

Experimental Apparatus
1
2
3
4
DC
B A

Calculations
b = 1257. P r
I (N/mm2)
I = d4
64
N
aapplied b
1
a ultimate
endurance
0 81 2.
endurance
ultimate9.0log
X
1b
]Nlog[2
1X reference
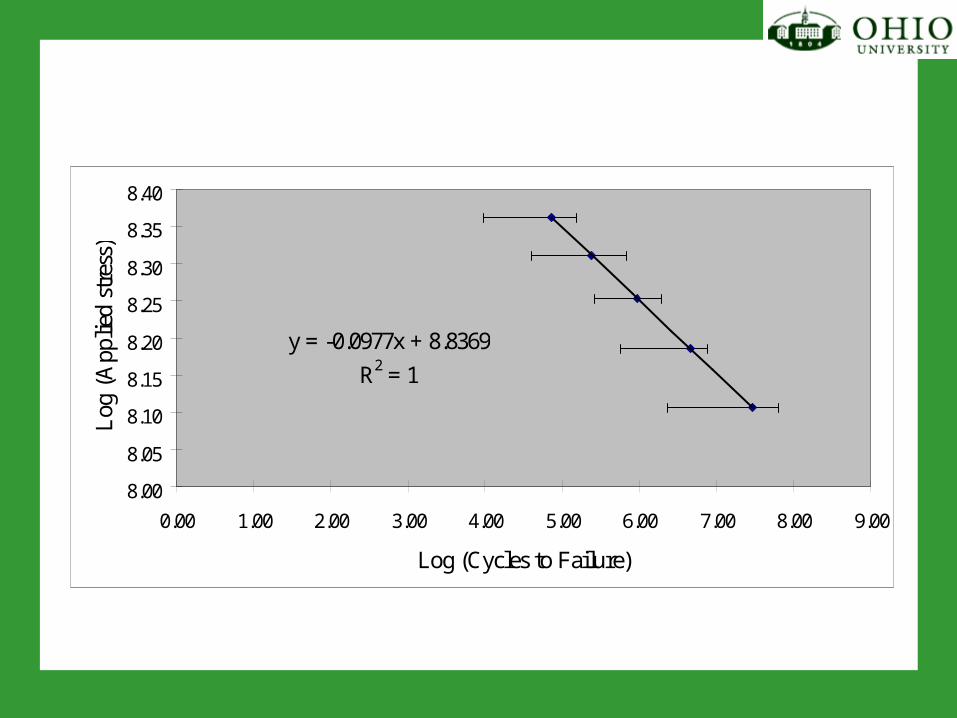
y = -0.0977x + 8.8369
R2 = 1
8.00
8.05
8.10
8.15
8.20
8.25
8.30
8.35
8.40
0.00 1.00 2.00 3.00 4.00 5.00 6.00 7.00 8.00 9.00
Log (Cycles to Failure)
Log
(A
pplie
d st
ress
)

Lab Analysis and Report• Determine weight for each stress level• Predict N for each trial • Calculate mean and standard deviation for
each data set• Perform Chauvenet’s criteria analyses• Plot bending stress vs. mean cycles to
failure showing one standard deviation• Extrapolate endurance limit for N = 5 108
• Redo for r = 2.45 mm
Top Related