


Languages
Pages
Legal

1
Simple MaxEnt Models for Food Web Degree Distributions
Richard J. Williams
Microsoft Research, 7 J J Thomson Ave, Cambridge CB3 0FB, UK
E-mail: [email protected]
Abstract
Degree distributions have been widely used to characterize biological networks
including food webs, and play a vital role in recent models of food web structure.
While food webs degree distributions have been suggested to follow various functional
forms, to date there has been no mechanistic or statistical explanation for these forms.
Here I introduce models for the degree distributions of food webs based on the principle
of maximum entropy (MaxEnt) constrained by the number of species, number of links
and the number of top or basal species. The MaxEnt predictions are compared to
observed distributions in 51 food webs. The distributions of the number of consumers
and resources in 23 (45%) and 35 (69%) of the food webs respectively are not
significantly different at a 95% confidence level from the MaxEnt distribution. While
the resource distributions of niche model webs are well-described by the MaxEnt
model, the consumer distributions are more narrowly distributed than predicted by the
MaxEnt model. These findings offer a new null model for the most probable degree
distributions in food webs. Having an appropriate null hypothesis in place allows
informative study of the deviations from it; for example these results suggest that there
is relatively little pressure favoring generalist versus specialist consumption strategies
2
but that there is more pressure driving the consumer distribution away from the MaxEnt
form. Given the methodological idiosyncrasies of current food web data, further study
of such deviations will need to consider both biological drivers and methodological
bias.
Introduction
An enormous variety of strategies have evolved by which organisms capture the
resources necessary for life, and by which organisms avoid being consumed as a
resource. These strategies range from organisms that are specialized on a single
resource species to ones that consume a wide range of resources at multiple trophic
levels. Similarly, some organisms have evolved elaborate defensive strategies and are
consumed by few species while others are vulnerable to a much wider range of
consumers. The nature of the balance between specialization and generality in
consumers, the range of vulnerability of resources, and the determination of the
biological processes that drive these interrelationships are central problems in food web
ecology (Dunne 2006).
Food web degree distributions, or the distribution of the fraction of nodes in a
network with a particular number of links, provide a description of this balance. Degree
distributions play a central role in the description and interpretation of the structure of
complex networks (Strogatz 2001; Albert & Barabasi 2002) and have been widely used
to characterize biological networks (Jordano et al. 2003; Barabasi & Oltvai 2004; May
2006) including food webs. They also play a vital role in recent models of food web
structure (Stouffer et al. 2005). Despite their importance, to date there has been no
3
mechanistic or statistical explanation for this vitally important aspect of food web
structure.
A food web is a directed network of S nodes connected by L links, with links
indicating the flow of biomass between nodes, which typically represent species or
more coarsely resolved aggregations of species. Previous work on degree distributions
in food webs has described their functional form. An early study of three food webs
considered the undirected degree distribution, combining incoming and outgoing links,
and suggested that degree distributions followed a power law and so are scale-free
(Montoya & Sole 2002). This was disputed by a study of seven food webs, which
considered the consumer and resource distributions separately and argued that both
followed a single-scale functional form (Camacho et al. 2002). A study of 16 food
webs found that the form of the undirected degree distributions varied with network
connectance (C = L/S2), with power law distributions at low values of connectance
(Dunne et al. 2002). None of these studies provide any explanation as to why these
distributions should occur.
In addition to their use in the description of complex networks, degree
distributions play an important role in the performance of models of food web structure.
Recently, it has been shown that the success of various structural models of complex
food webs (the niche model (Williams & Martinez 2000) and its variants (Cattin et al.
2004; Stouffer et al. 2005; Stouffer et al. 2006; Williams & Martinez 2008)) depends in
large part on the form of the resource distribution (Stouffer et al. 2005). While the other
components of the niche model, ordering of species in a feeding hierarchy and
constraining diets to contiguous niches, are grounded in well-established ecological
ideas (Hutchinson 1959; Cohen 1978; Cohen et al. 1990), no justification was given for
4
the resource distribution in the niche model, and this centrally important choice has
simply been copied in more recent models.
Here I propose simple null models for the consumer, resource and undirected
degree distributions of food webs which help fill this important gap in our
understanding of food web structure. It has often been argued (Albert & Barabasi
2002; Montoya & Sole 2002; May 2006) that a random network (Erdős & Rényi 1959)
where any link is equally probable is a suitable null model, with deviations in the degree
distributions from the sharply-peaked binomial distribution of this model requiring
explanation. This model assumes that all links occur with equal probability and
therefore when considering the nodes in the network, it assumes that every node
behaves identically; this assumption imposes biologically unlikely constraints on the
degree distributions.
According to the principle of maximum entropy (MaxEnt) (Jaynes 1957), the
probability distribution with the maximum information entropy is the least biased
probability distribution which satisfies a set of information containing constraints.
Here, I compare observed food web degree distributions to MaxEnt models constrained
only by the numbers of species, top or basal species and links in the food webs. I also
tested whether the degree distributions of niche model food webs (Williams & Martinez
2000) followed the MaxEnt models and whether deviations from the MaxEnt models
were similar in the niche model and the empirical data.
Materials and Methods.
The consumer and resource distributions of the trophic species (Cohen et al. 1990)
in 51 food webs were analyzed. The data are all the webs with 25 or more trophically
5
distinct taxa (Cohen et al. 1990) from two recent studies (Stouffer et al. 2007;
Thompson et al. 2007); details of the data are given in the supplementary information
tables S1 and S2. These are among the largest and best resolved data available, and
while still subject to the many criticisms that food web data have received (Cohen et al.
1993), the many robust patterns found in these methodologically heterogeneous data
(Stouffer et al. 2007; Thompson et al. 2007; Williams & Martinez 2008) give
confidence that these findings are not the result of consistent bias in the data.
Two resource distributions were considered, termed the “all-species resource
distribution” and the “restricted resource distribution”. The “all-species resource
distribution” is defined as the distribution of the number of resources of each species,
including the basal species, which consume no resources. This model is constrained
only by knowledge of S and L. The “restricted resource distribution” is defined as the
distribution of the number of resources of only the consumer species. As such, it
includes prior knowledge of the number of basal species B and does not attempt to
predict the fraction of basal species. Similarly, two consumer distributions are
considered, the “all-species consumer distribution” and the “restricted consumer
distribution”. The “all-species consumer distribution” is defined as the distribution of
the number of consumers of each species, including the top species, which have no
consumers. This model is constrained only by knowledge of S and L. The “restricted
consumer distribution” is defined as the distribution of the number of consumers of the
resource species, includes prior knowledge of the number of top species T and does not
attempt to predict the fraction of top species.
In the “all species” distributions, the number of consumers or resources of each
species can range from 0 to S and the mean number of links per species is L/S. In the
6
“restricted” resource distribution, the number of links to each consumer can potentially
range from 1 to S and the mean number of links to each consumer is L/(S – B). In the
“restricted” consumer distribution, the number of links from each resource can
potentially range from 1 to S and the mean number of links from each resource is L/(S –
T). For a discrete distribution on the set of values {x1,…,xn} with mean , the MaxEnt
distribution is (Cover & Thomas 2006) pi = P(X = xi) = 𝐶𝑒𝜆𝑥𝑖 for i = 1,…,n. The
constants C and are determined by the requirements that the probabilities sum to 1 and
have mean i
ip 1 and i
ii px .
Finally, I developed a simple model of the undirected (sum of consumer and
resource link) distributions by assuming that the number of consumers and resources of
each node are independent. Top species have no consumers, so for T species the
number of links is drawn from the MaxEnt resource distribution. Similarly, for B
species the number of links is drawn from the MaxEnt consumer distribution. For the
remaining S – B – T intermediate species, the number of links is the sum of numbers
drawn from the consumer and resource distributions.
The consumer, resource and undirected distributions of the 51 empirical food
webs were compared to the maximum entropy distributions derived using the empirical
values of S, L, B and T. Two tests of the fit of the MaxEnt models to the empirical data
were used. In the first, the likelihood ratio (G) statistic (Sokal & Rohlf 1995) is used to
compare an observed distribution to some expected (model) distribution. G is defined
as i
iii EOOG )/ln(2 where Oi is the observed frequency, Ei the expected frequency
and i indexes through all values in the discrete distribution with non-zero expected
value. A randomization procedure is used; for each of the 10,000 trials a sample is
7
drawn from the maximum entropy distribution and its G value is compared to the G
value of the empirical distribution, where in both cases the expected distribution is the
maximum entropy distribution. The goodness of fit fG, is measured by the fraction of
trials in which the G value of the empirical distribution is greater than the G value of the
distribution drawn from the maximum entropy distribution. The empirical distribution
is considered to be significantly different from the maximum entropy distribution if fG >
0.95.
The goodness of fit fG does not differentiate between webs with overly broad or
narrow degree distributions, a range of variation found in an earlier study of food web
degree distributions (Dunne et al. 2002). To measure whether the empirical webs were
more broadly or narrowly distributed than the model distributions, I measured the
relative width of a distribution W = log(O/M) where O is the standard deviation of the
observed distribution and M is the standard deviation of the model distribution. For
each empirical web, the distribution of W for 10,000 webs drawn from the model
distribution was computed. The quantity W95 is defined as the deviation of the
empirical value of W from the model median normalized by the width of the upper or
lower half of the central interval of the model distribution of W at the 95% significance
level. This gives the normalized difference in standard deviations of the empirical
distribution relative to the median standard deviation of a set of samples drawn from the
model distribution and so measures the relative width of the empirical distribution.
Webs with W95 < -1 have distributions that are significantly narrower than the model
distributions; W95 > 1 occurs for distributions significantly broader than the model
distributions.
8
Results
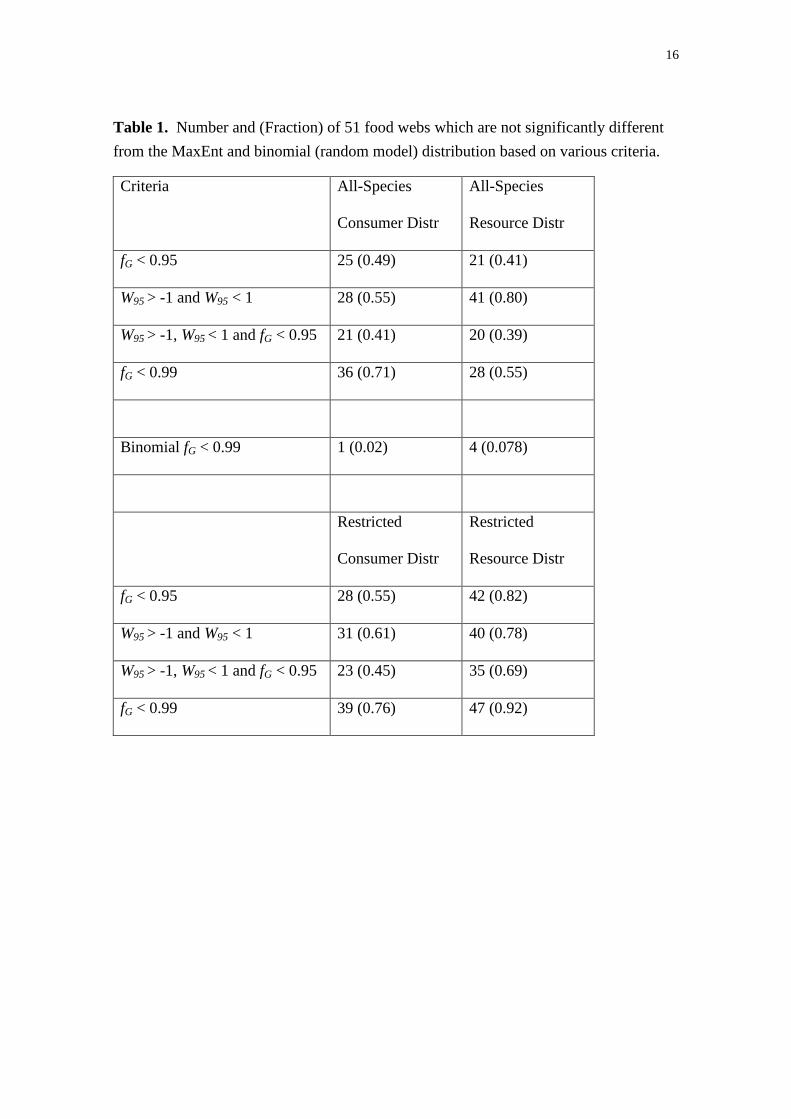
Table 1 summarizes the fit of the MaxEnt models to the empirical data using the
two tests of model fit. An empirical distribution is significantly different from the
model distribution at the 95% confidence level if fG > 0.95. Webs with W95 < -1 or W95
> 1 are significantly narrower or broader than the model distributions respectively. The
“all-species” models perform consistently worse than the models which are restricted to
exclude nodes with zero links. The differences are much larger for resource
distributions than for consumer distributions. This suggests that the number of basal
species is particularly different from the number predicted by the all-species MaxEnt
model, and a biological or methodological basis for their abundance should be sought.
All subsequent results will be for the better performing “restricted” models which
incorporate prior knowledge of the number of top or basal species.
In the most conservative evaluation, the restricted consumer and resource
distributions are not significantly different from the model distribution at a 95%
confidence level if both fG < 0.95 and -1 < W95 < 1. These conditions are satisfied for
23 and 35 (45% and 69%) of the webs respectively. Thus there is some asymmetry
between the fit of the consumer and resource distributions to their respective MaxEnt
distributions (p = 0.027, Fisher’s Exact Test). Many of the poorly fit degree
distributions are only marginally significantly different from the MaxEnt model. Of the
distributions with with fG > 0.95, 12 of 23 consumer distributions and 4 of 9 resource
distributions’ fG fall between 0.95 and 0.99. The table also shows that the random
model (Erdős & Rényi 1959) is a very poor predictor of the empirical degree
distributions.
9
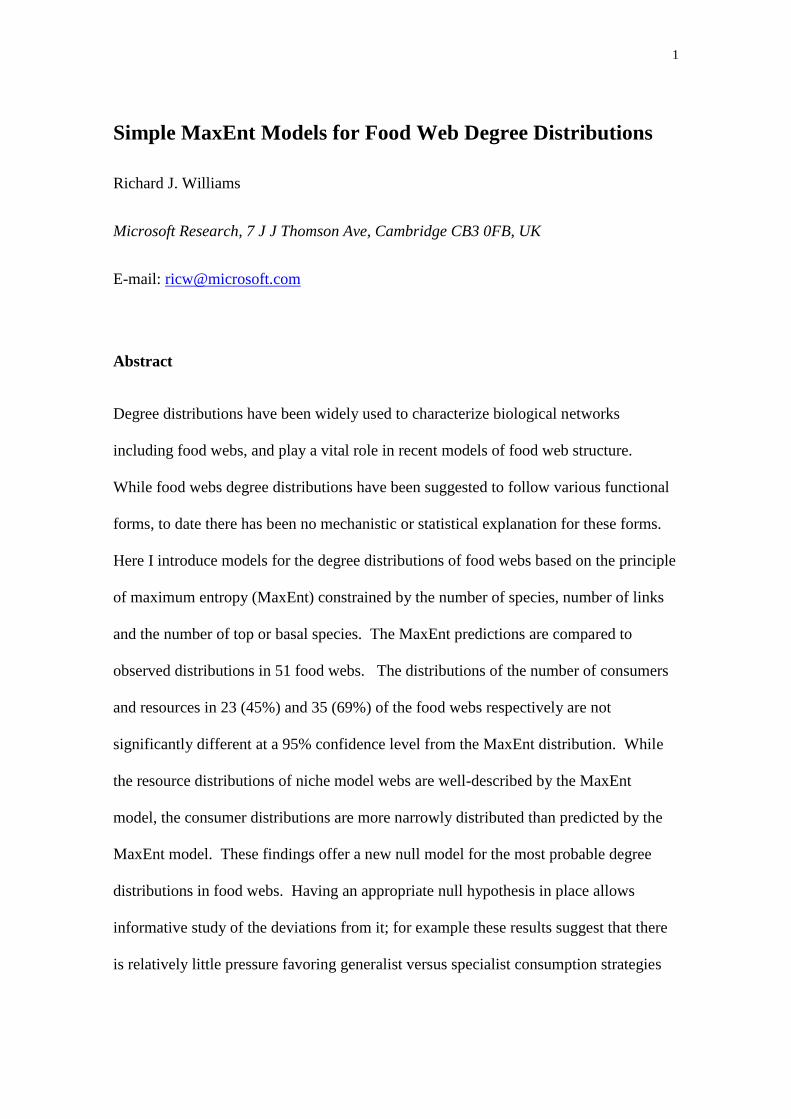
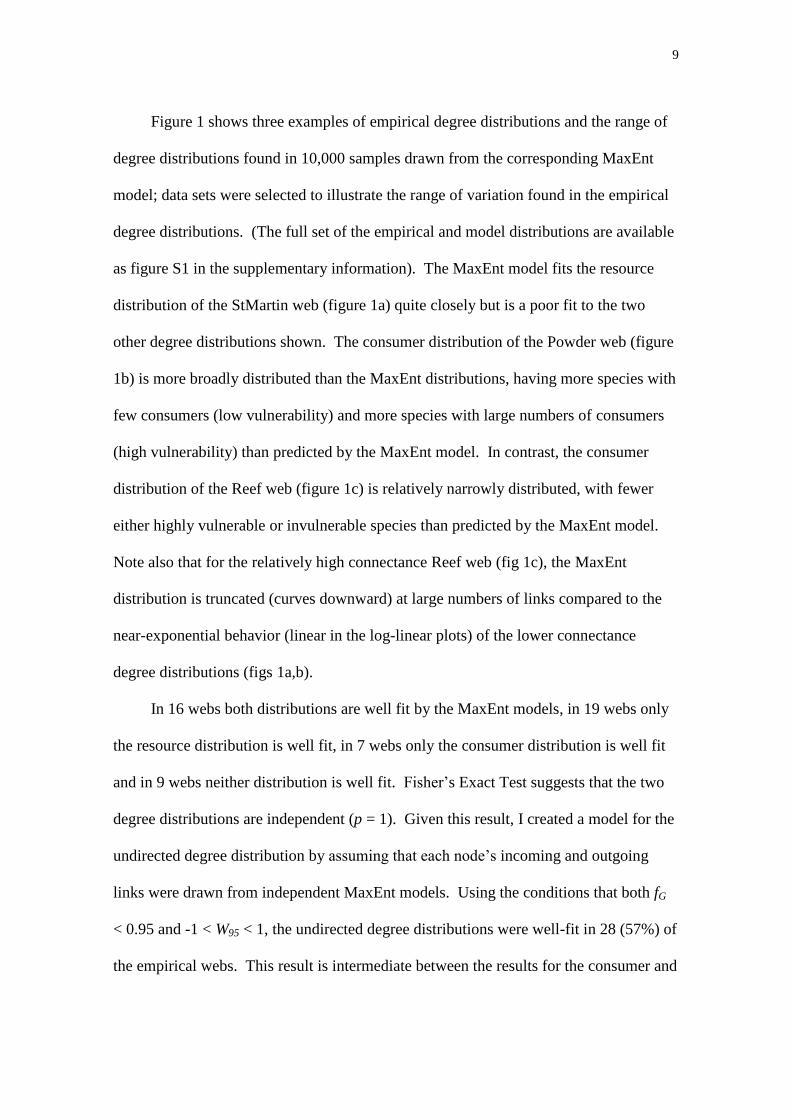
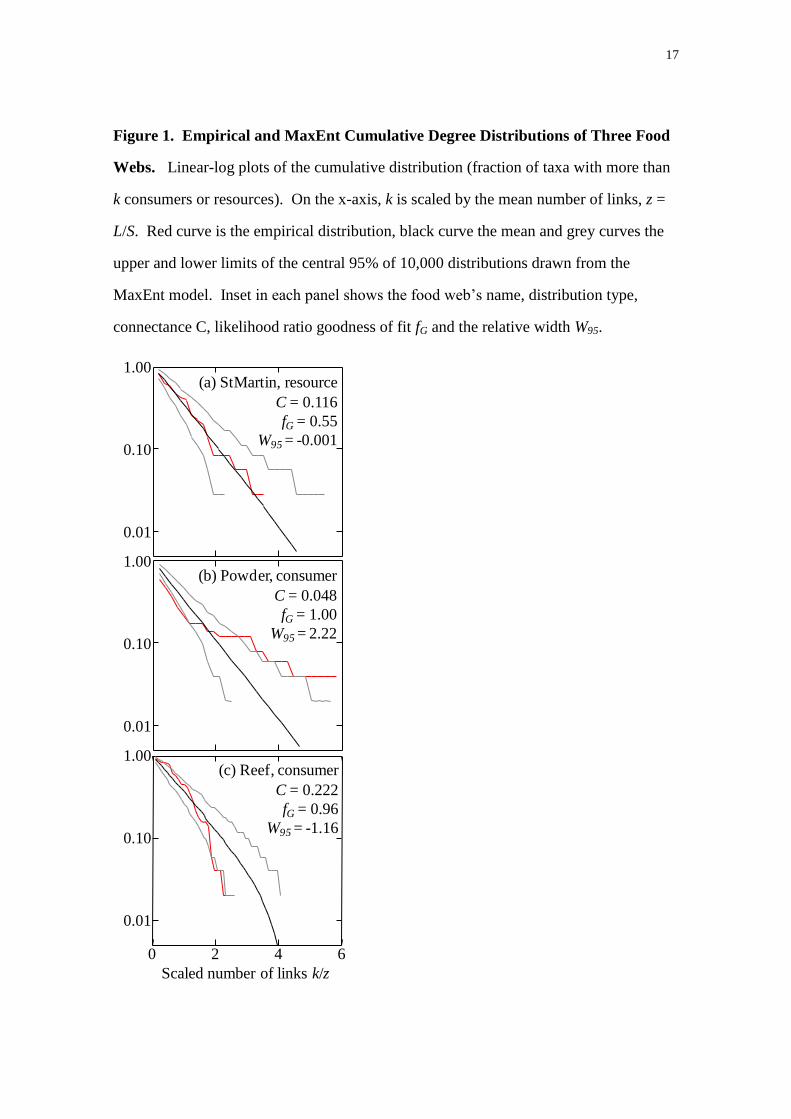
Figure 1 shows three examples of empirical degree distributions and the range of
degree distributions found in 10,000 samples drawn from the corresponding MaxEnt
model; data sets were selected to illustrate the range of variation found in the empirical
degree distributions. (The full set of the empirical and model distributions are available
as figure S1 in the supplementary information). The MaxEnt model fits the resource
distribution of the StMartin web (figure 1a) quite closely but is a poor fit to the two
other degree distributions shown. The consumer distribution of the Powder web (figure
1b) is more broadly distributed than the MaxEnt distributions, having more species with
few consumers (low vulnerability) and more species with large numbers of consumers
(high vulnerability) than predicted by the MaxEnt model. In contrast, the consumer
distribution of the Reef web (figure 1c) is relatively narrowly distributed, with fewer
either highly vulnerable or invulnerable species than predicted by the MaxEnt model.
Note also that for the relatively high connectance Reef web (fig 1c), the MaxEnt
distribution is truncated (curves downward) at large numbers of links compared to the
near-exponential behavior (linear in the log-linear plots) of the lower connectance
degree distributions (figs 1a,b).
In 16 webs both distributions are well fit by the MaxEnt models, in 19 webs only
the resource distribution is well fit, in 7 webs only the consumer distribution is well fit
and in 9 webs neither distribution is well fit. Fisher’s Exact Test suggests that the two
degree distributions are independent (p = 1). Given this result, I created a model for the
undirected degree distribution by assuming that each node’s incoming and outgoing
links were drawn from independent MaxEnt models. Using the conditions that both fG
< 0.95 and -1 < W95 < 1, the undirected degree distributions were well-fit in 28 (57%) of
the empirical webs. This result is intermediate between the results for the consumer and
10
resource distributions taken separately and further reinforces the idea that the consumer
and resource distributions can be treated as independent.
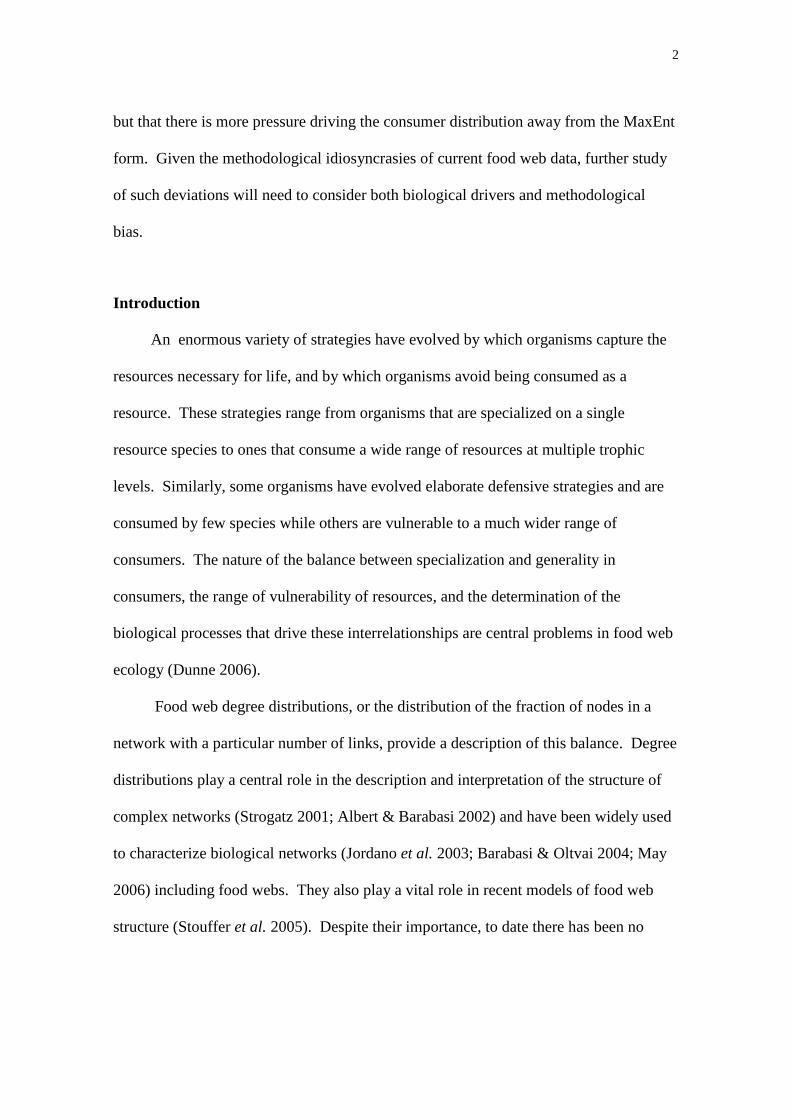
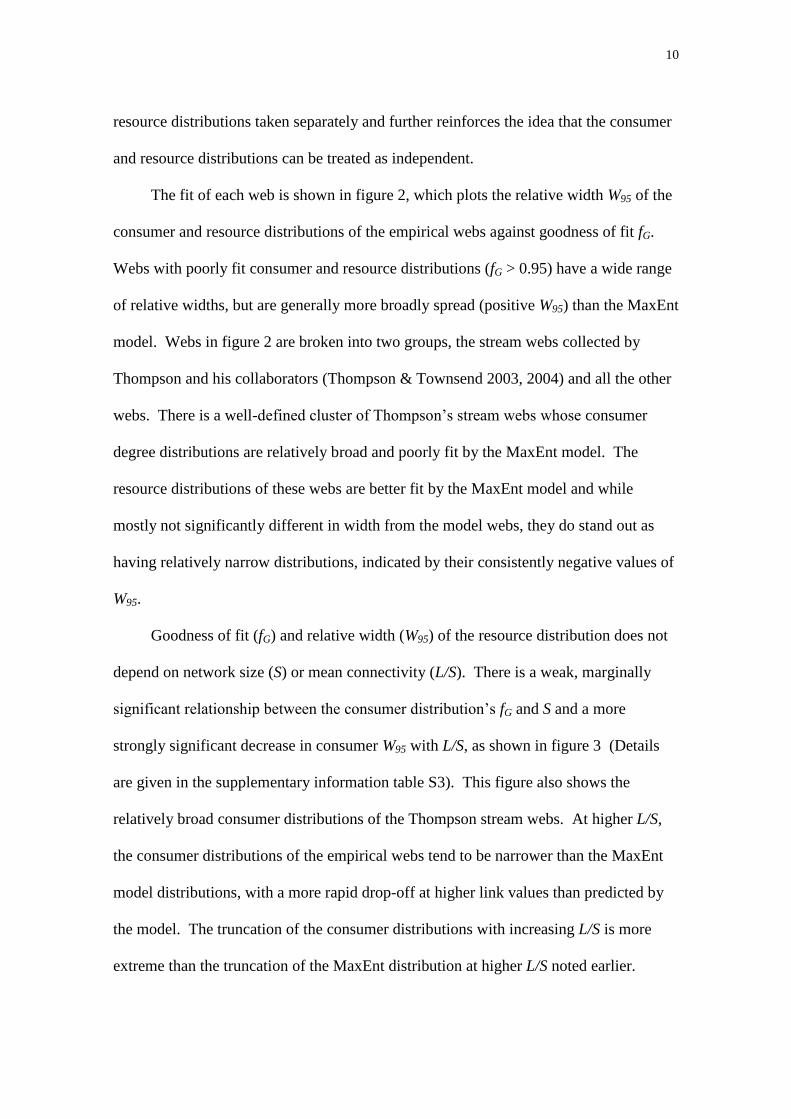
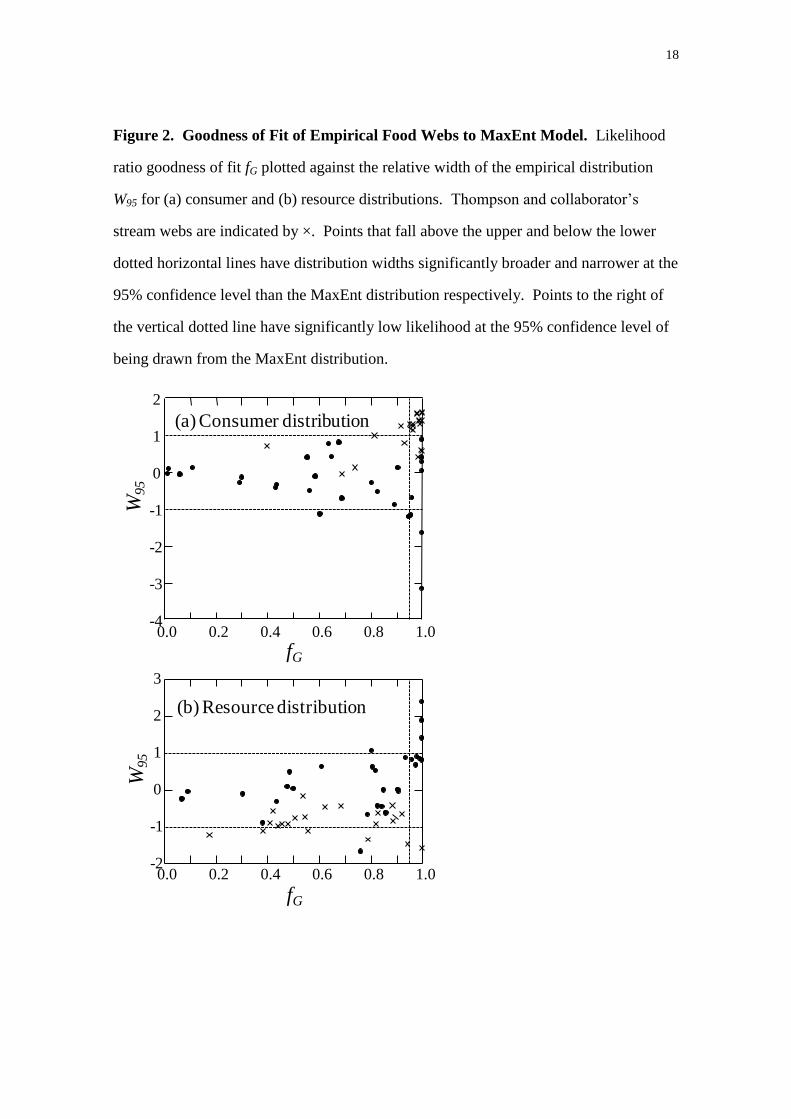
The fit of each web is shown in figure 2, which plots the relative width W95 of the
consumer and resource distributions of the empirical webs against goodness of fit fG.
Webs with poorly fit consumer and resource distributions (fG > 0.95) have a wide range
of relative widths, but are generally more broadly spread (positive W95) than the MaxEnt
model. Webs in figure 2 are broken into two groups, the stream webs collected by
Thompson and his collaborators (Thompson & Townsend 2003, 2004) and all the other
webs. There is a well-defined cluster of Thompson’s stream webs whose consumer
degree distributions are relatively broad and poorly fit by the MaxEnt model. The
resource distributions of these webs are better fit by the MaxEnt model and while
mostly not significantly different in width from the model webs, they do stand out as
having relatively narrow distributions, indicated by their consistently negative values of
W95.
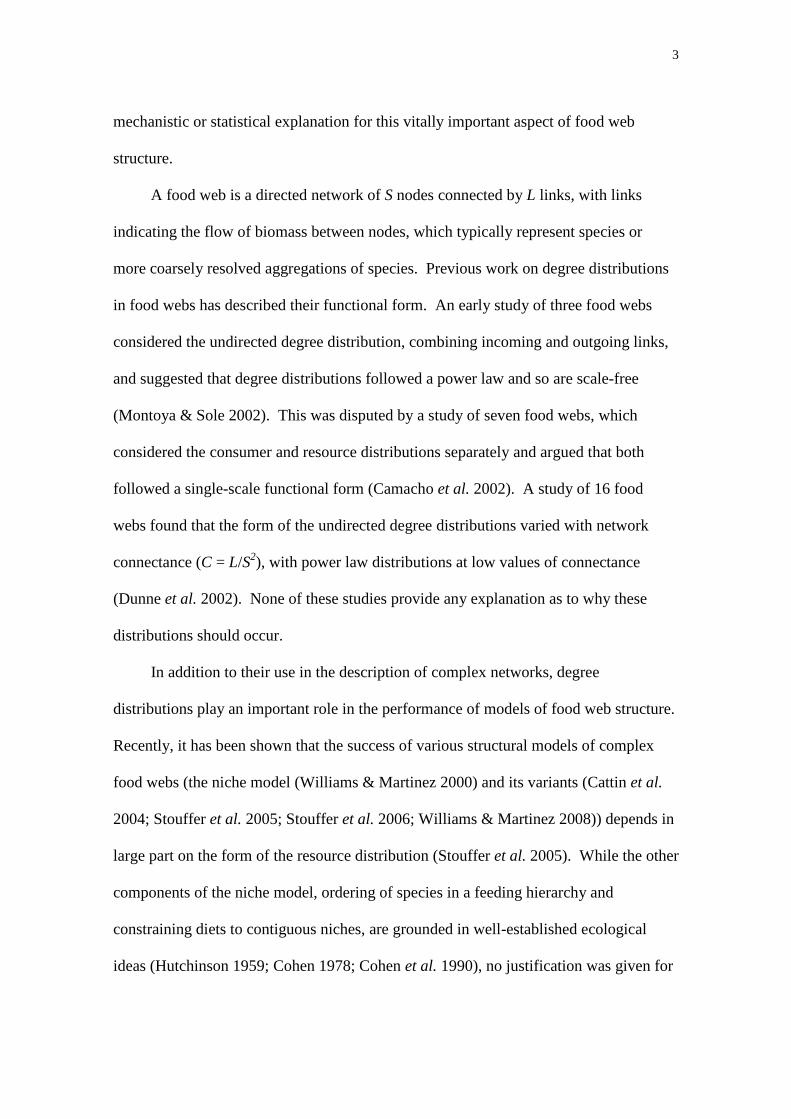
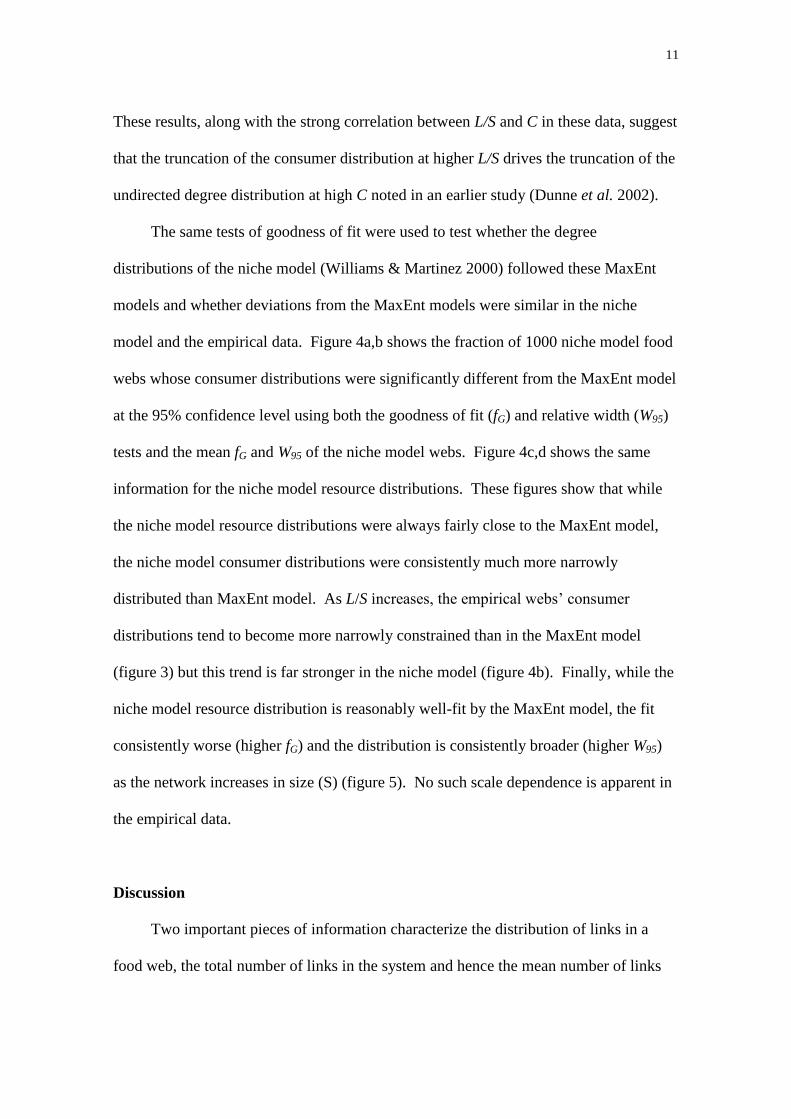
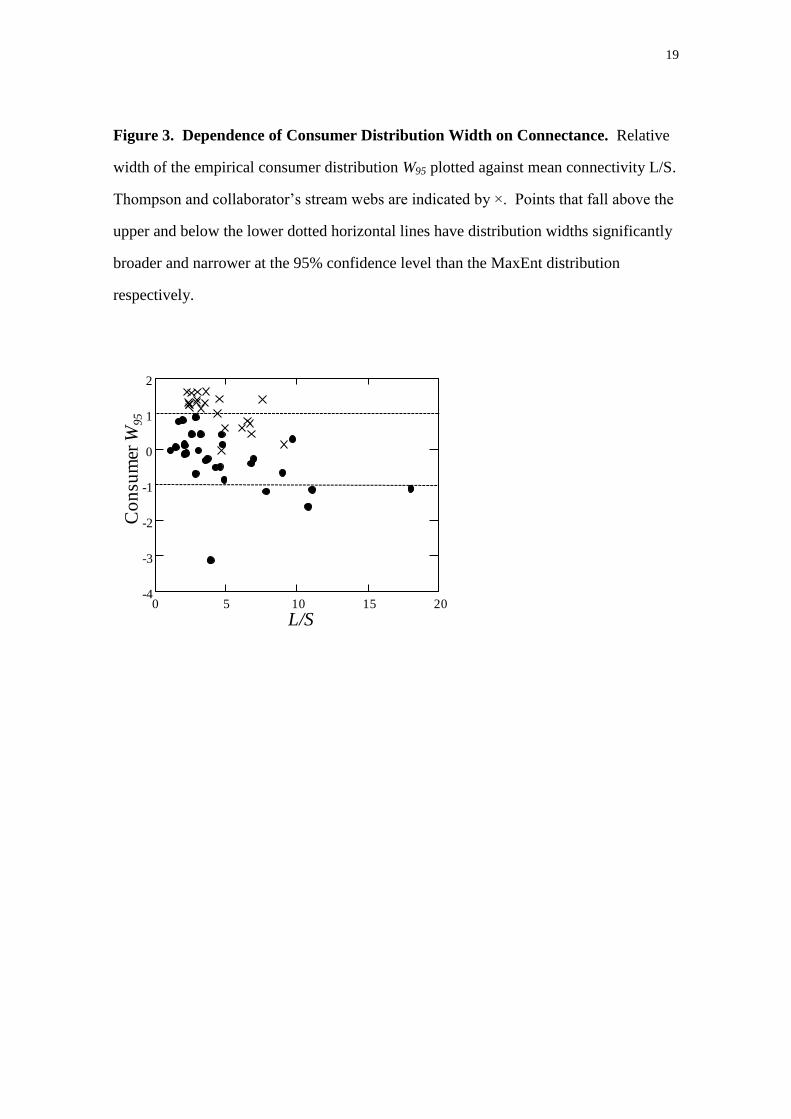
Goodness of fit (fG) and relative width (W95) of the resource distribution does not
depend on network size (S) or mean connectivity (L/S). There is a weak, marginally
significant relationship between the consumer distribution’s fG and S and a more
strongly significant decrease in consumer W95 with L/S, as shown in figure 3 (Details
are given in the supplementary information table S3). This figure also shows the
relatively broad consumer distributions of the Thompson stream webs. At higher L/S,
the consumer distributions of the empirical webs tend to be narrower than the MaxEnt
model distributions, with a more rapid drop-off at higher link values than predicted by
the model. The truncation of the consumer distributions with increasing L/S is more
extreme than the truncation of the MaxEnt distribution at higher L/S noted earlier.
11
These results, along with the strong correlation between L/S and C in these data, suggest
that the truncation of the consumer distribution at higher L/S drives the truncation of the
undirected degree distribution at high C noted in an earlier study (Dunne et al. 2002).
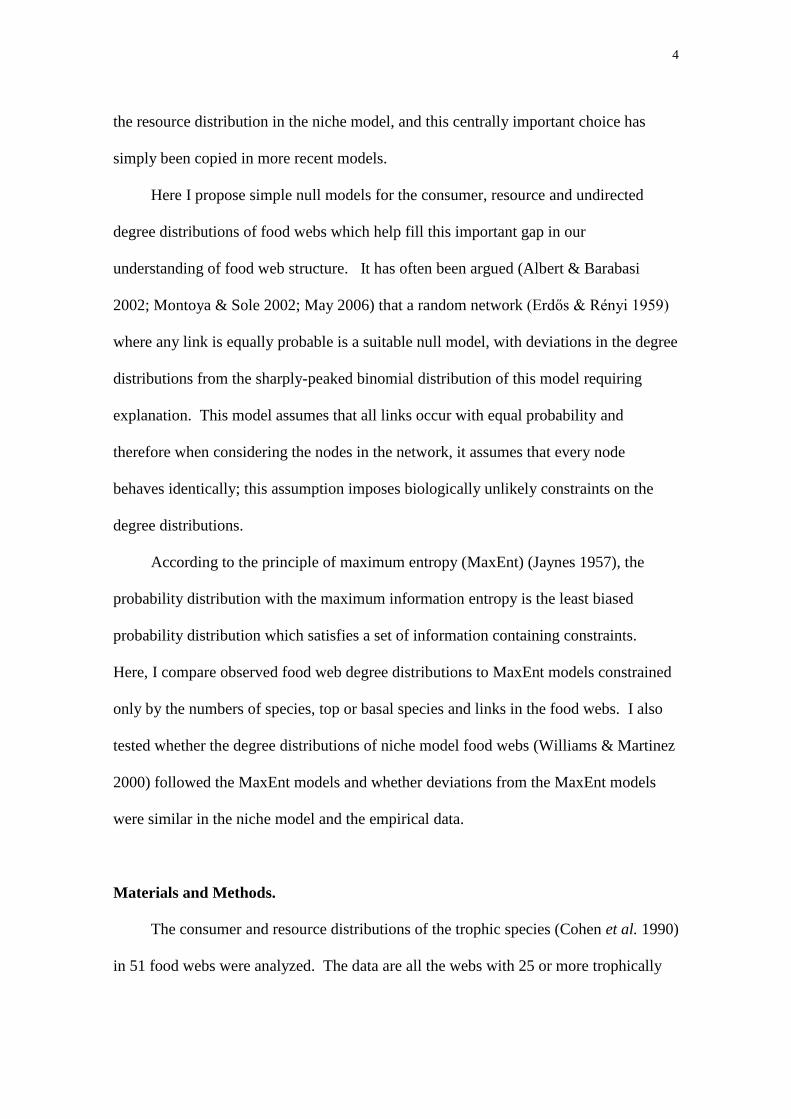
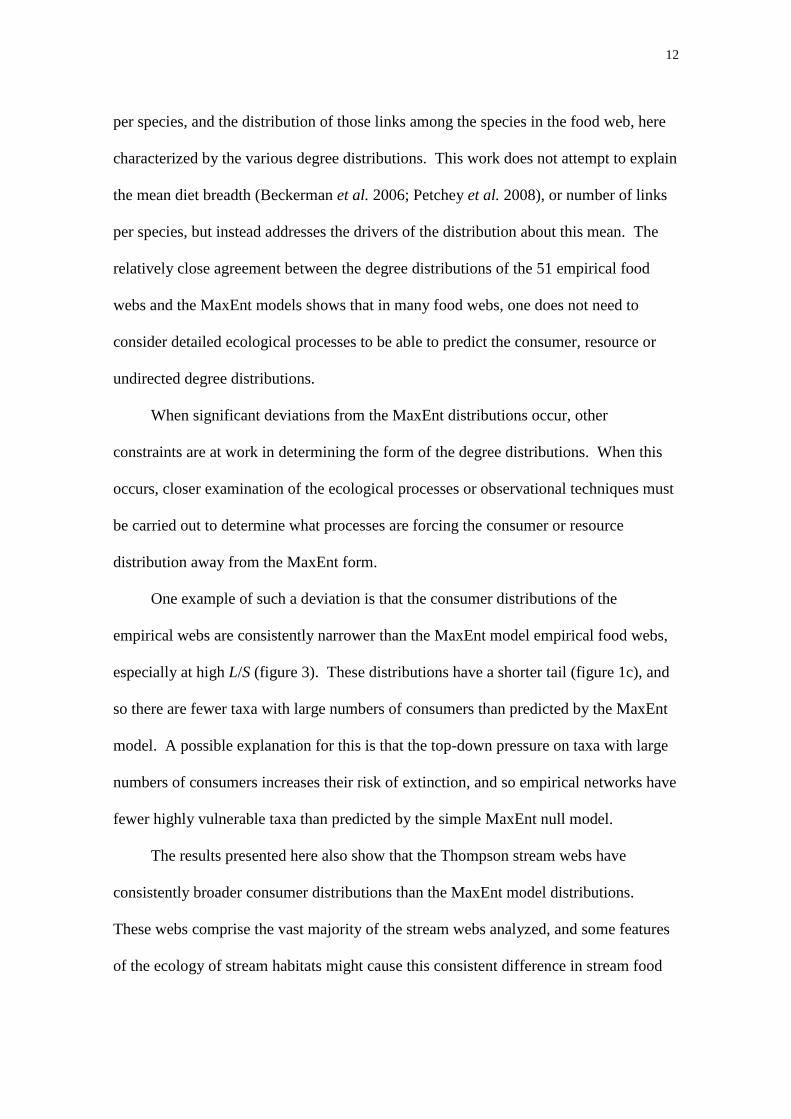
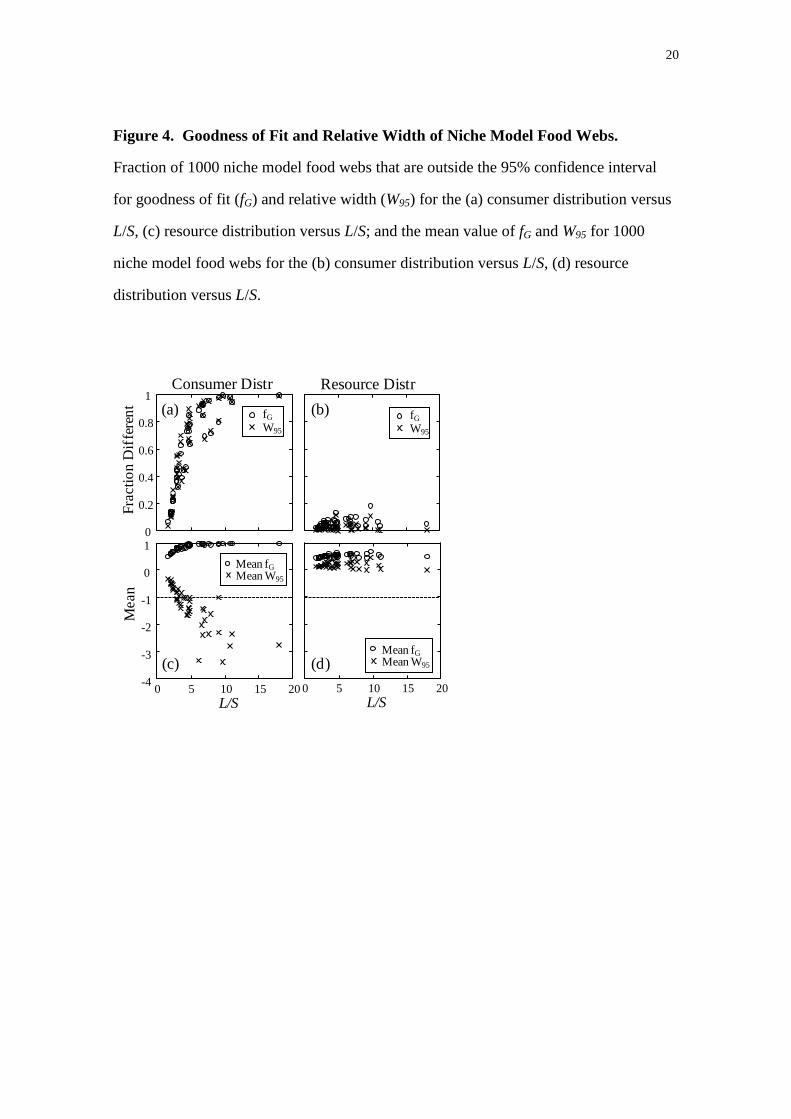
The same tests of goodness of fit were used to test whether the degree
distributions of the niche model (Williams & Martinez 2000) followed these MaxEnt
models and whether deviations from the MaxEnt models were similar in the niche
model and the empirical data. Figure 4a,b shows the fraction of 1000 niche model food
webs whose consumer distributions were significantly different from the MaxEnt model
at the 95% confidence level using both the goodness of fit (fG) and relative width (W95)
tests and the mean fG and W95 of the niche model webs. Figure 4c,d shows the same
information for the niche model resource distributions. These figures show that while
the niche model resource distributions were always fairly close to the MaxEnt model,
the niche model consumer distributions were consistently much more narrowly
distributed than MaxEnt model. As L/S increases, the empirical webs’ consumer
distributions tend to become more narrowly constrained than in the MaxEnt model
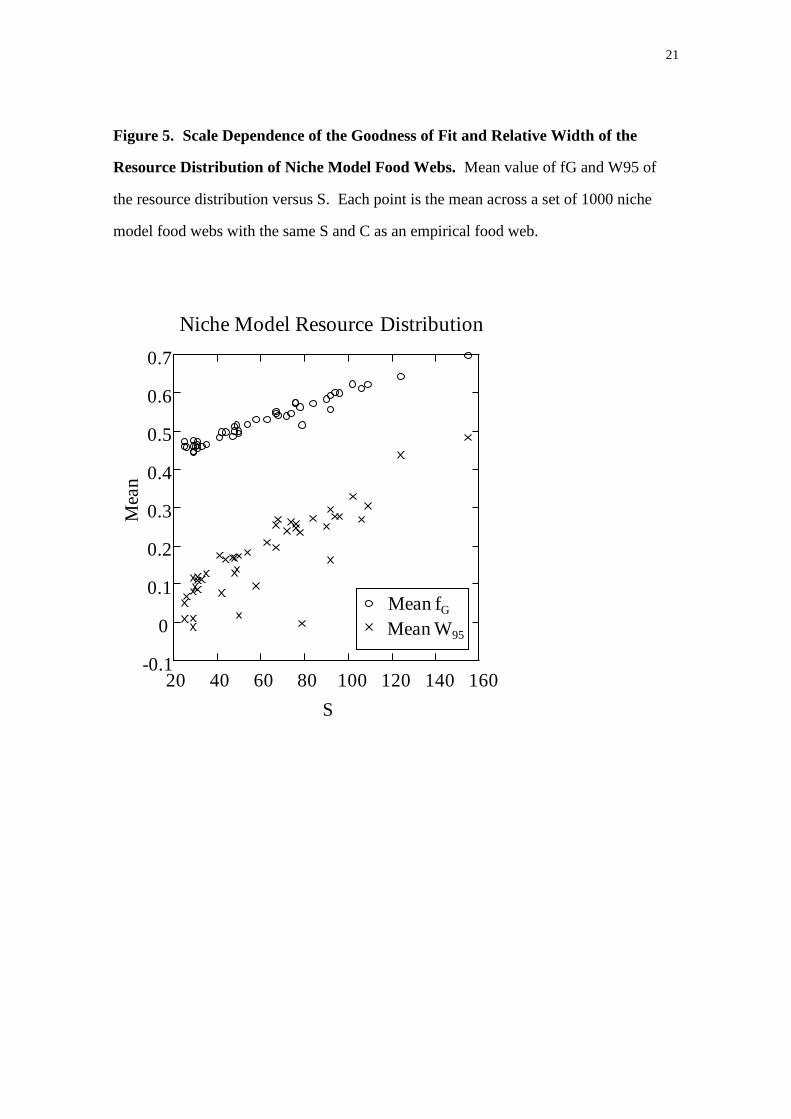
(figure 3) but this trend is far stronger in the niche model (figure 4b). Finally, while the
niche model resource distribution is reasonably well-fit by the MaxEnt model, the fit
consistently worse (higher fG) and the distribution is consistently broader (higher W95)
as the network increases in size (S) (figure 5). No such scale dependence is apparent in
the empirical data.
Discussion
Two important pieces of information characterize the distribution of links in a
food web, the total number of links in the system and hence the mean number of links
12
per species, and the distribution of those links among the species in the food web, here
characterized by the various degree distributions. This work does not attempt to explain
the mean diet breadth (Beckerman et al. 2006; Petchey et al. 2008), or number of links
per species, but instead addresses the drivers of the distribution about this mean. The
relatively close agreement between the degree distributions of the 51 empirical food
webs and the MaxEnt models shows that in many food webs, one does not need to
consider detailed ecological processes to be able to predict the consumer, resource or
undirected degree distributions.
When significant deviations from the MaxEnt distributions occur, other
constraints are at work in determining the form of the degree distributions. When this
occurs, closer examination of the ecological processes or observational techniques must
be carried out to determine what processes are forcing the consumer or resource
distribution away from the MaxEnt form.
One example of such a deviation is that the consumer distributions of the
empirical webs are consistently narrower than the MaxEnt model empirical food webs,
especially at high L/S (figure 3). These distributions have a shorter tail (figure 1c), and
so there are fewer taxa with large numbers of consumers than predicted by the MaxEnt
model. A possible explanation for this is that the top-down pressure on taxa with large
numbers of consumers increases their risk of extinction, and so empirical networks have
fewer highly vulnerable taxa than predicted by the simple MaxEnt null model.
The results presented here also show that the Thompson stream webs have
consistently broader consumer distributions than the MaxEnt model distributions.
These webs comprise the vast majority of the stream webs analyzed, and some features
of the ecology of stream habitats might cause this consistent difference in stream food
13
web consumer distributions. It is also possible that the data gathering techniques used
produced food webs that are consistently different from food webs generated using
other techniques, as suggested in an earlier study (Stouffer et al. 2007). These webs
stand out methodologically, being based on gut content analysis of a relatively small
number of individuals of each species, leading to an acknowledged likely
undersampling of links (Thompson & Townsend 2003). If rare links tend to be to
relatively invulnerable species, increased sampling could make the consumer
distributions less broadly distributed by reducing the number of species with very low
vulnerability.
The comparison of the degree distributions of niche model food webs with the
MaxEnt models show that there are a number of consistent differences between the
degree distributions of the empirical webs and the niche model which need to be
addressed by future structural models of food webs. Resource distributions are more
narrowly distributed than predicted by the MaxEnt model and there is pronounced scale-
dependence in the fit of the consumer distributions, with larger niche model webs
having more broadly distributed consumer distributions.
Given the methodological variability of the data sets, not only between the
Thompson data and the other webs but also across the other webs (Dunne et al. 2004;
Stouffer et al. 2007), the degree distributions of complex food webs are remarkably well
described by the simple MaxEnt model presented here. The many questions
surrounding data quality mean that it is currently difficult to assess whether deviations
from the MaxEnt model are a result of ecological processes or biases in the data.
14
Acknowledgements
Thanks to Jen Dunne and Ross Thompson for generously sharing their data sets, to Jen
Dunne, Drew Purves and David Stouffer for helpful discussions and comments on
earlier versions of this paper.
References
Albert R. & Barabasi A.L. (2002). Statistical mechanics of complex networks. Rev.
Modern Phys., 74, 47-97.
Barabasi A.L. & Oltvai Z.N. (2004). Network Biology: Understanding the Cell's
Functional Organization. Nature Reviews Genetics, 5, 101-113.
Beckerman A.P., Petchey O.L. & Warren P.H. (2006). Foraging biology predicts food
web complexity. Proceedings of the National Academy of Science, USA, 103,
13745-13749.
Camacho J., Guimera R. & Amaral L.A.N. (2002). Robust patterns in food web
structure. Phys. Rev. Lett., 88.
Cattin M.-F., Bersier L.-F., Banasek-Richter C., Baltensperger R. & Gabriel J.-P.
(2004). Phylogenetic constraints and adaptation explain food-web structure.
Nature, 427, 835-839.
Cohen J.E. (1978). Food Webs and Niche Space. Princeton University Press, Princeton,
N.J.
Cohen J.E., Beaver R.A., Cousins S.H., DeAngelis D.L., Goldwasser L., Heong K.L.,
Holt R.D., Kohn A.J., Lawton J.H., Martinez N., O'Malley R., Page L.M., Patten
B.C., Pimm S.L., Polis G.A., Rejm nek M., Schoener T.W., Schoely K., Sprules
W.G., Teal J.M., Ulanowicz R.E., Warren P.H., Wilbur H.M. & Yodzis P.
(1993). Improving food webs. Ecology, 74, 252-258.
Cohen J.E., Briand F. & Newman C.M. (1990). Community food webs: data and
theory. Springer, Berlin.
Cover T.M. & Thomas J.A. (2006). Elements of Information Theory (2nd Edition).
Wiley-Interscience.
Dunne J.A. (2006). The network structure of food webs. In: Ecological Networks:
Linking Structure to Dynamics in Food Webs (eds. Pascual M & Dunne JA).
Oxford University Press New York.
Dunne J.A., Williams R.J. & Martinez N.D. (2002). Food-web structure and network
theory: The role of connectance and size. Proc. Natl Acad. Sci. USA, 99, 12917-
12922.
Dunne J.A., Williams R.J. & Martinez N.D. (2004). Network structure and robustness
of marine food webs. Mar Ecol Prog Ser, 273, 291-302.
Erdős P. & Rényi A. (1959). On random graphs I. Publicationes Mathematicae
Debrecen, 6, 290-297.
Hutchinson G.E. (1959). Homage to Santa Rosalia or Why are there so many kinds of
animals? Am. Nat., 93, 145-159.
Jaynes E.T. (1957). Information theory and statistical mechanics. Physical Review, 106,
620-630.
15
Jordano P., Bascompte J. & Olesen J.M. (2003). Invariant properties in coevolutionary
networks of plant-animal interactions. Ecol Lett, 6, 69-81.
May R.M. (2006). Network structure and the biology of populations. Trends Ecol.
Evol., 21, 394-399.
Montoya J.M. & Sole R.V. (2002). Small world patterns in food webs. J. Theor. Biol.,
214, 405-412.
Petchey O.L., Beckerman A.P., Riede J.O. & Warren P.H. (2008). Size, foraging and
food web structure. Proceedings of the National Academy of Science, USA, 105,
4191-4196.
Sokal R.R. & Rohlf F.J. (1995). Biometry. Freeman, New York.
Stouffer D.B., Camacho J. & Amaral L.A.N. (2006). A robust measure of food web
intervality. Proceedings of the National Academy of Science, USA, 103, 19015-
19020.
Stouffer D.B., Camacho J., Guimera R., Ng C.A. & Amaral L.A.N. (2005). Quantitative
patterns in the structure of model and empirical food webs. Ecology, 86, 1301-
1311.
Stouffer D.B., Camacho J., Jiang W. & Amaral L.A.N. (2007). Evidence for the
existence of a robust pattern of prey selection in food webs. Proc R Soc Lond B,
274, 1931-1940.
Strogatz S.H. (2001). Exploring complex networks. Nature, 410, 268-276.
Thompson R.M., Hemberg M., Starzomski B.M. & Shurin J.B. (2007). Trophic levels
and trophic tangles: the prevalence of omnivory in real food webs. Ecology, 88,
612-617.
Thompson R.M. & Townsend C.R. (2003). Impacts on stream food webs of native and
exotic forest: An intercontinental comparison. Ecology, 84, 145-161.
Thompson R.M. & Townsend C.R. (2004). Landuse influences on New Zealand stream
communities – effects on species composition, functional organization and food-
web structure. New Zealand Journal Marine and Freshwater Research, 38, 595–
608.
Williams R.J. & Martinez N.D. (2000). Simple rules yield complex food webs. Nature,
404, 180-183.
Williams R.J. & Martinez N.D. (2008). Success and its limits among structural models
of complex food webs. J. Anim. Ecol.
16
Table 1. Number and (Fraction) of 51 food webs which are not significantly different
from the MaxEnt and binomial (random model) distribution based on various criteria.
Criteria All-Species
Consumer Distr
All-Species
Resource Distr
fG < 0.95 25 (0.49) 21 (0.41)
W95 > -1 and W95 < 1 28 (0.55) 41 (0.80)
W95 > -1, W95 < 1 and fG < 0.95 21 (0.41) 20 (0.39)
fG < 0.99 36 (0.71) 28 (0.55)
Binomial fG < 0.99 1 (0.02) 4 (0.078)
Restricted
Consumer Distr
Restricted
Resource Distr
fG < 0.95 28 (0.55) 42 (0.82)
W95 > -1 and W95 < 1 31 (0.61) 40 (0.78)
W95 > -1, W95 < 1 and fG < 0.95 23 (0.45) 35 (0.69)
fG < 0.99 39 (0.76) 47 (0.92)
17
Figure 1. Empirical and MaxEnt Cumulative Degree Distributions of Three Food
Webs. Linear-log plots of the cumulative distribution (fraction of taxa with more than
k consumers or resources). On the x-axis, k is scaled by the mean number of links, z =
L/S. Red curve is the empirical distribution, black curve the mean and grey curves the
upper and lower limits of the central 95% of 10,000 distributions drawn from the
MaxEnt model. Inset in each panel shows the food web’s name, distribution type,
connectance C, likelihood ratio goodness of fit fG and the relative width W95.
0.01
0.10
1.00
0 2 4 6
Scaled number of links k/z
0.01
0.10
1.00
0.01
0.10
1.00
(a) StMartin, resource
C = 0.116
fG = 0.55
W95 = -0.001
(b) Powder, consumer
C = 0.048
fG = 1.00
W95 = 2.22
(c) Reef, consumer
C = 0.222
fG = 0.96
W95 = -1.16
18
Figure 2. Goodness of Fit of Empirical Food Webs to MaxEnt Model. Likelihood
ratio goodness of fit fG plotted against the relative width of the empirical distribution
W95 for (a) consumer and (b) resource distributions. Thompson and collaborator’s
stream webs are indicated by ×. Points that fall above the upper and below the lower
dotted horizontal lines have distribution widths significantly broader and narrower at the
95% confidence level than the MaxEnt distribution respectively. Points to the right of
the vertical dotted line have significantly low likelihood at the 95% confidence level of
being drawn from the MaxEnt distribution.
0.0 0.2 0.4 0.6 0.8 1.0
fG
-4
-3
-2
-1
0
1
2
W9
5
(a) Consumer distribution
0.0 0.2 0.4 0.6 0.8 1.0
fG
-2
-1
0
1
2
3
W95
(b) Resource distribution
19
Figure 3. Dependence of Consumer Distribution Width on Connectance. Relative
width of the empirical consumer distribution W95 plotted against mean connectivity L/S.
Thompson and collaborator’s stream webs are indicated by ×. Points that fall above the
upper and below the lower dotted horizontal lines have distribution widths significantly
broader and narrower at the 95% confidence level than the MaxEnt distribution
respectively.
0 5 10 15 20
L/S
-4
-3
-2
-1
0
1
2
Co
nsu
mer
W9
5
20
Figure 4. Goodness of Fit and Relative Width of Niche Model Food Webs.
Fraction of 1000 niche model food webs that are outside the 95% confidence interval
for goodness of fit (fG) and relative width (W95) for the (a) consumer distribution versus
L/S, (c) resource distribution versus L/S; and the mean value of fG and W95 for 1000
niche model food webs for the (b) consumer distribution versus L/S, (d) resource
distribution versus L/S.
0
0.2
0.4
0.6
0.8
1
Fra
cti
on
Dif
fere
nt
-4
-3
-2
-1
0
1
0 5 10 15 20
Mean fG
Mean W95
Mean
L/S0 5 10 15 20
L/S
Consumer Distr Resource Distr
fG
W95
(a) (b)
(c) (d)
fG
W95
Mean fG
Mean W95
21
Figure 5. Scale Dependence of the Goodness of Fit and Relative Width of the
Resource Distribution of Niche Model Food Webs. Mean value of fG and W95 of
the resource distribution versus S. Each point is the mean across a set of 1000 niche
model food webs with the same S and C as an empirical food web.
Niche Model Resource Distribution
-0.1
0
0.1
0.2
0.3
0.4
0.5
0.6
0.7
20 40 60 80 100 120 140 160
Mean fG
Mean W95
Mea
n
S
22
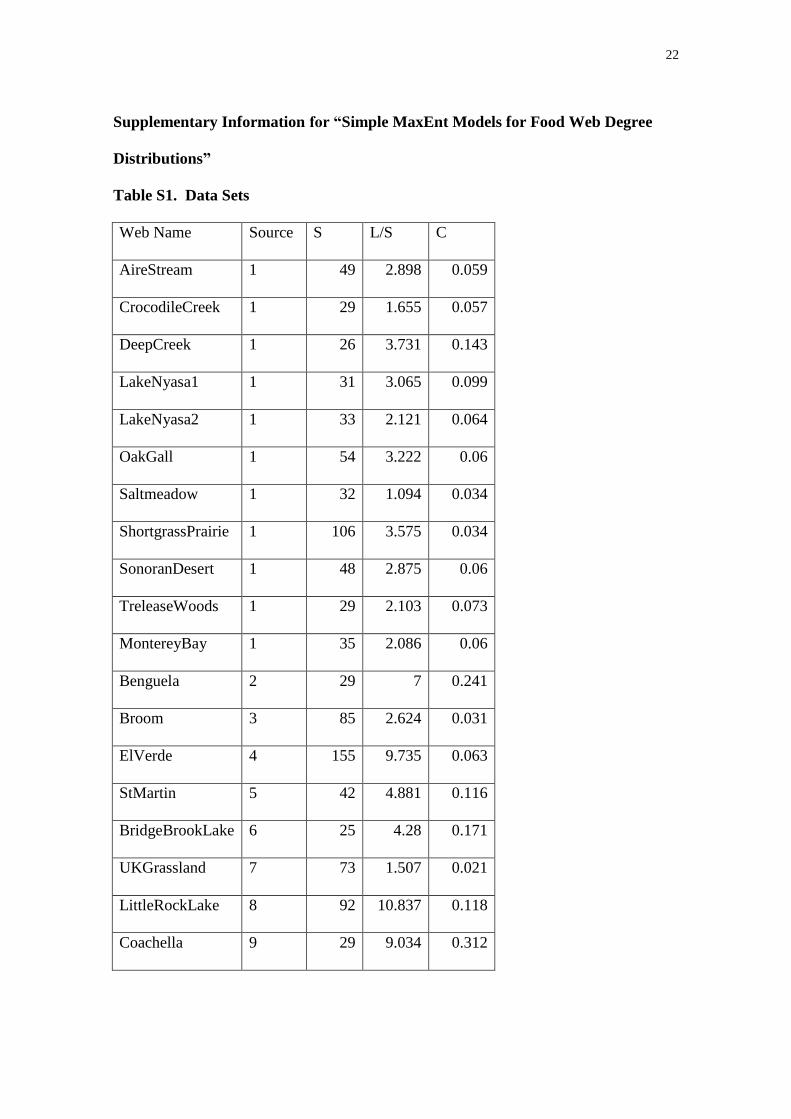
Supplementary Information for “Simple MaxEnt Models for Food Web Degree
Distributions”
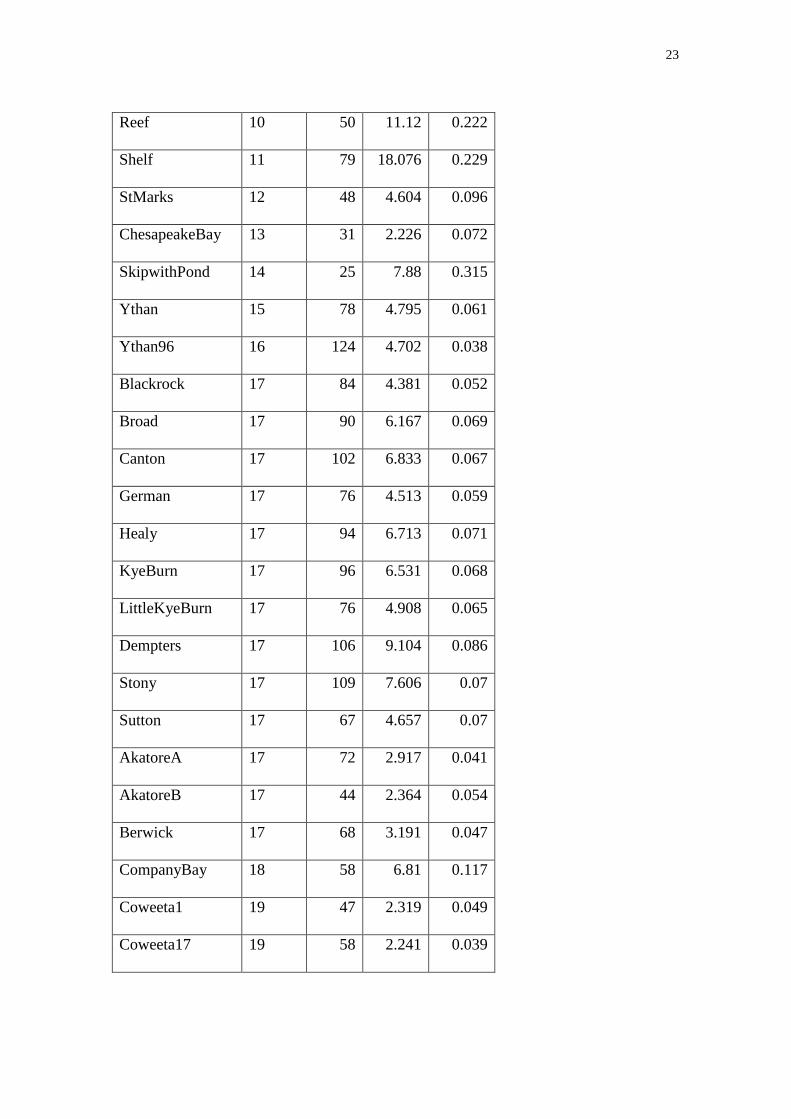
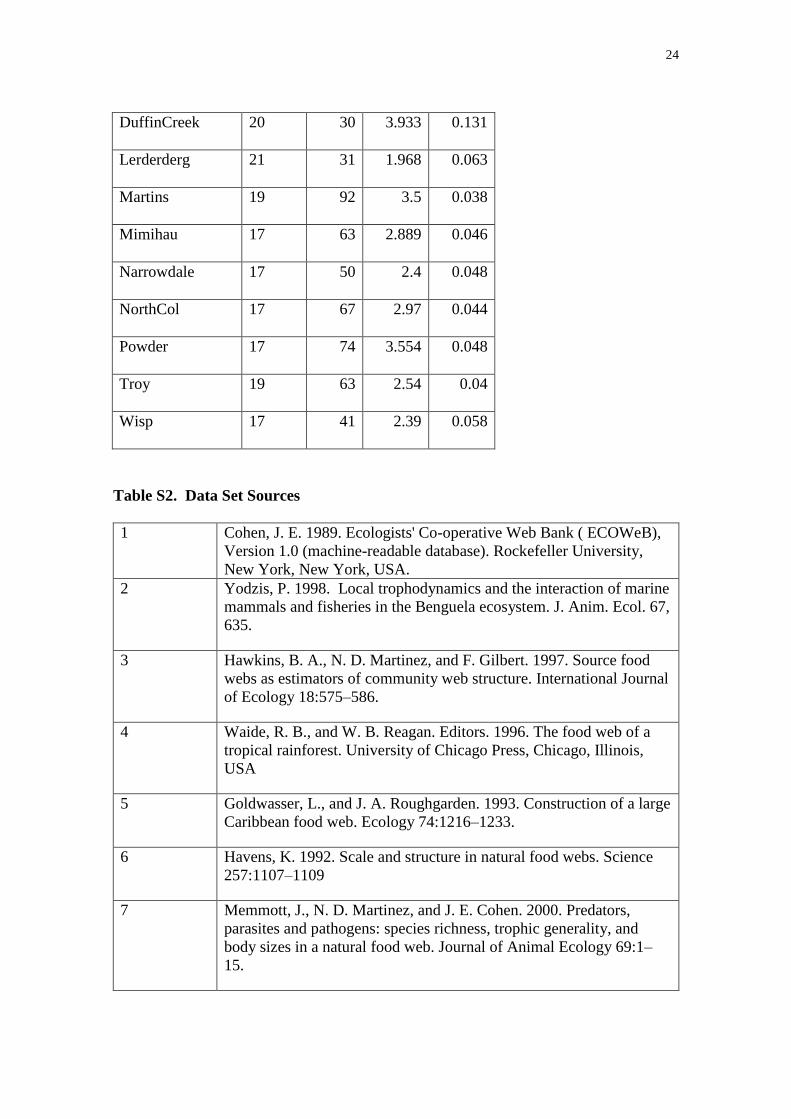
Table S1. Data Sets
Web Name Source S L/S C
AireStream 1 49 2.898 0.059
CrocodileCreek 1 29 1.655 0.057
DeepCreek 1 26 3.731 0.143
LakeNyasa1 1 31 3.065 0.099
LakeNyasa2 1 33 2.121 0.064
OakGall 1 54 3.222 0.06
Saltmeadow 1 32 1.094 0.034
ShortgrassPrairie 1 106 3.575 0.034
SonoranDesert 1 48 2.875 0.06
TreleaseWoods 1 29 2.103 0.073
MontereyBay 1 35 2.086 0.06
Benguela 2 29 7 0.241
Broom 3 85 2.624 0.031
ElVerde 4 155 9.735 0.063
StMartin 5 42 4.881 0.116
BridgeBrookLake 6 25 4.28 0.171
UKGrassland 7 73 1.507 0.021
LittleRockLake 8 92 10.837 0.118
Coachella 9 29 9.034 0.312
23
Reef 10 50 11.12 0.222
Shelf 11 79 18.076 0.229
StMarks 12 48 4.604 0.096
ChesapeakeBay 13 31 2.226 0.072
SkipwithPond 14 25 7.88 0.315
Ythan 15 78 4.795 0.061
Ythan96 16 124 4.702 0.038
Blackrock 17 84 4.381 0.052
Broad 17 90 6.167 0.069
Canton 17 102 6.833 0.067
German 17 76 4.513 0.059
Healy 17 94 6.713 0.071
KyeBurn 17 96 6.531 0.068
LittleKyeBurn 17 76 4.908 0.065
Dempters 17 106 9.104 0.086
Stony 17 109 7.606 0.07
Sutton 17 67 4.657 0.07
AkatoreA 17 72 2.917 0.041
AkatoreB 17 44 2.364 0.054
Berwick 17 68 3.191 0.047
CompanyBay 18 58 6.81 0.117
Coweeta1 19 47 2.319 0.049
Coweeta17 19 58 2.241 0.039
24
DuffinCreek 20 30 3.933 0.131
Lerderderg 21 31 1.968 0.063
Martins 19 92 3.5 0.038
Mimihau 17 63 2.889 0.046
Narrowdale 17 50 2.4 0.048
NorthCol 17 67 2.97 0.044
Powder 17 74 3.554 0.048
Troy 19 63 2.54 0.04
Wisp 17 41 2.39 0.058
Table S2. Data Set Sources
1 Cohen, J. E. 1989. Ecologists' Co-operative Web Bank ( ECOWeB),
Version 1.0 (machine-readable database). Rockefeller University,
New York, New York, USA.
2 Yodzis, P. 1998. Local trophodynamics and the interaction of marine
mammals and fisheries in the Benguela ecosystem. J. Anim. Ecol. 67,
635.
3 Hawkins, B. A., N. D. Martinez, and F. Gilbert. 1997. Source food
webs as estimators of community web structure. International Journal
of Ecology 18:575–586.
4 Waide, R. B., and W. B. Reagan. Editors. 1996. The food web of a
tropical rainforest. University of Chicago Press, Chicago, Illinois,
USA
5 Goldwasser, L., and J. A. Roughgarden. 1993. Construction of a large
Caribbean food web. Ecology 74:1216–1233.
6 Havens, K. 1992. Scale and structure in natural food webs. Science
257:1107–1109
7 Memmott, J., N. D. Martinez, and J. E. Cohen. 2000. Predators,
parasites and pathogens: species richness, trophic generality, and
body sizes in a natural food web. Journal of Animal Ecology 69:1–
15.
25
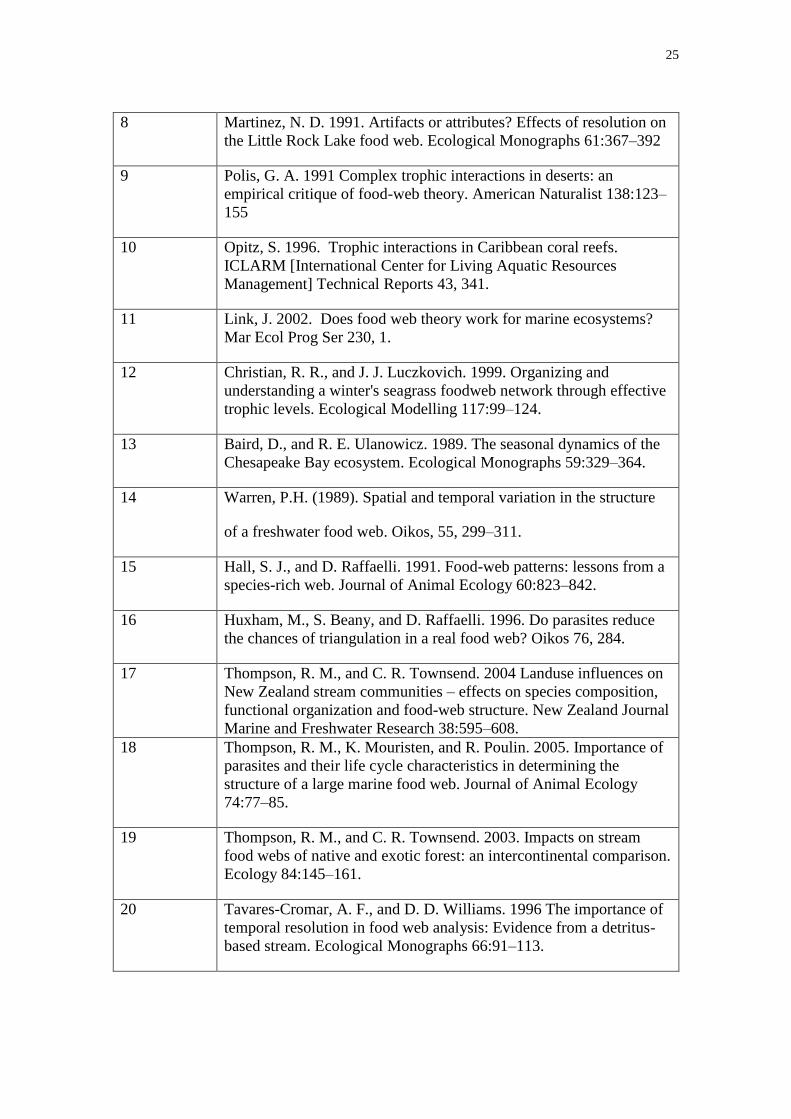
8 Martinez, N. D. 1991. Artifacts or attributes? Effects of resolution on
the Little Rock Lake food web. Ecological Monographs 61:367–392
9 Polis, G. A. 1991 Complex trophic interactions in deserts: an
empirical critique of food-web theory. American Naturalist 138:123–
155
10 Opitz, S. 1996. Trophic interactions in Caribbean coral reefs.
ICLARM [International Center for Living Aquatic Resources
Management] Technical Reports 43, 341.
11 Link, J. 2002. Does food web theory work for marine ecosystems?
Mar Ecol Prog Ser 230, 1.
12 Christian, R. R., and J. J. Luczkovich. 1999. Organizing and
understanding a winter's seagrass foodweb network through effective
trophic levels. Ecological Modelling 117:99–124.
13 Baird, D., and R. E. Ulanowicz. 1989. The seasonal dynamics of the
Chesapeake Bay ecosystem. Ecological Monographs 59:329–364.
14 Warren, P.H. (1989). Spatial and temporal variation in the structure
of a freshwater food web. Oikos, 55, 299–311.
15 Hall, S. J., and D. Raffaelli. 1991. Food-web patterns: lessons from a
species-rich web. Journal of Animal Ecology 60:823–842.
16 Huxham, M., S. Beany, and D. Raffaelli. 1996. Do parasites reduce
the chances of triangulation in a real food web? Oikos 76, 284.
17 Thompson, R. M., and C. R. Townsend. 2004 Landuse influences on
New Zealand stream communities – effects on species composition,
functional organization and food-web structure. New Zealand Journal
Marine and Freshwater Research 38:595–608.
18 Thompson, R. M., K. Mouristen, and R. Poulin. 2005. Importance of
parasites and their life cycle characteristics in determining the
structure of a large marine food web. Journal of Animal Ecology
74:77–85.
19 Thompson, R. M., and C. R. Townsend. 2003. Impacts on stream
food webs of native and exotic forest: an intercontinental comparison.
Ecology 84:145–161.
20 Tavares-Cromar, A. F., and D. D. Williams. 1996 The importance of
temporal resolution in food web analysis: Evidence from a detritus-
based stream. Ecological Monographs 66:91–113.
26
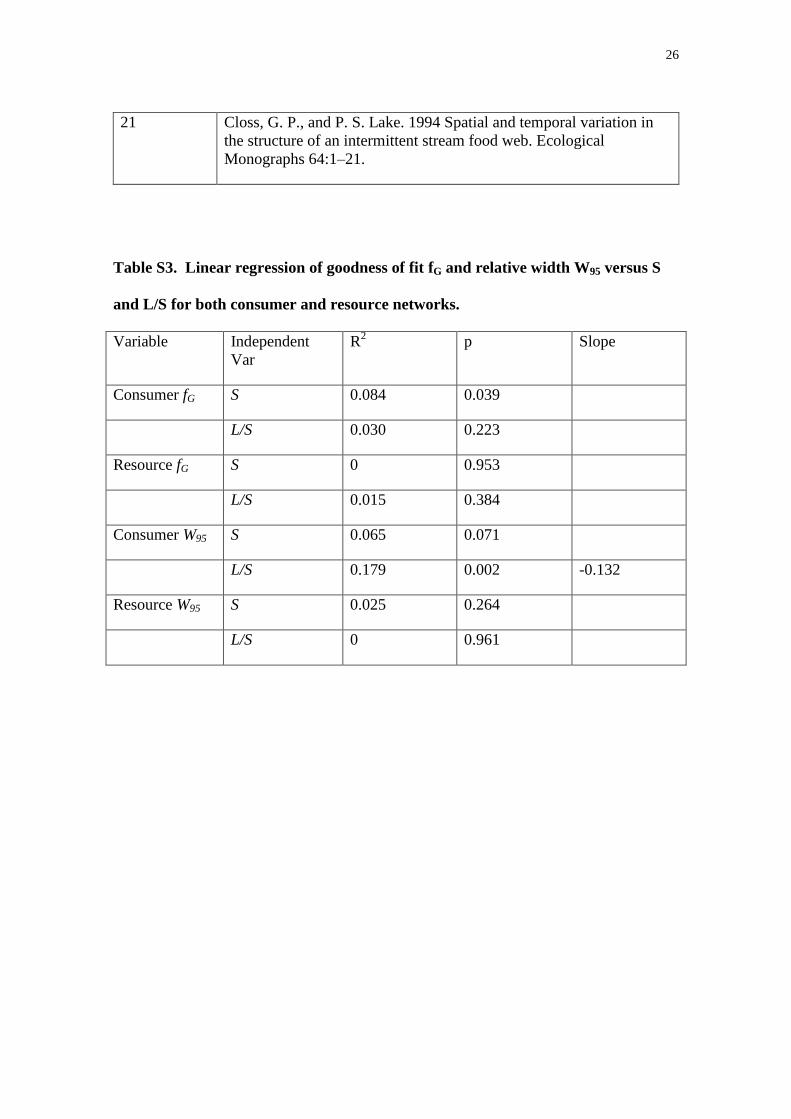
21 Closs, G. P., and P. S. Lake. 1994 Spatial and temporal variation in
the structure of an intermittent stream food web. Ecological
Monographs 64:1–21.
Table S3. Linear regression of goodness of fit fG and relative width W95 versus S
and L/S for both consumer and resource networks.
Variable Independent
Var
R2 p Slope
Consumer fG S 0.084 0.039
L/S 0.030 0.223
Resource fG S 0 0.953
L/S 0.015 0.384
Consumer W95 S 0.065 0.071
L/S 0.179 0.002 -0.132
Resource W95 S 0.025 0.264
L/S 0 0.961
27
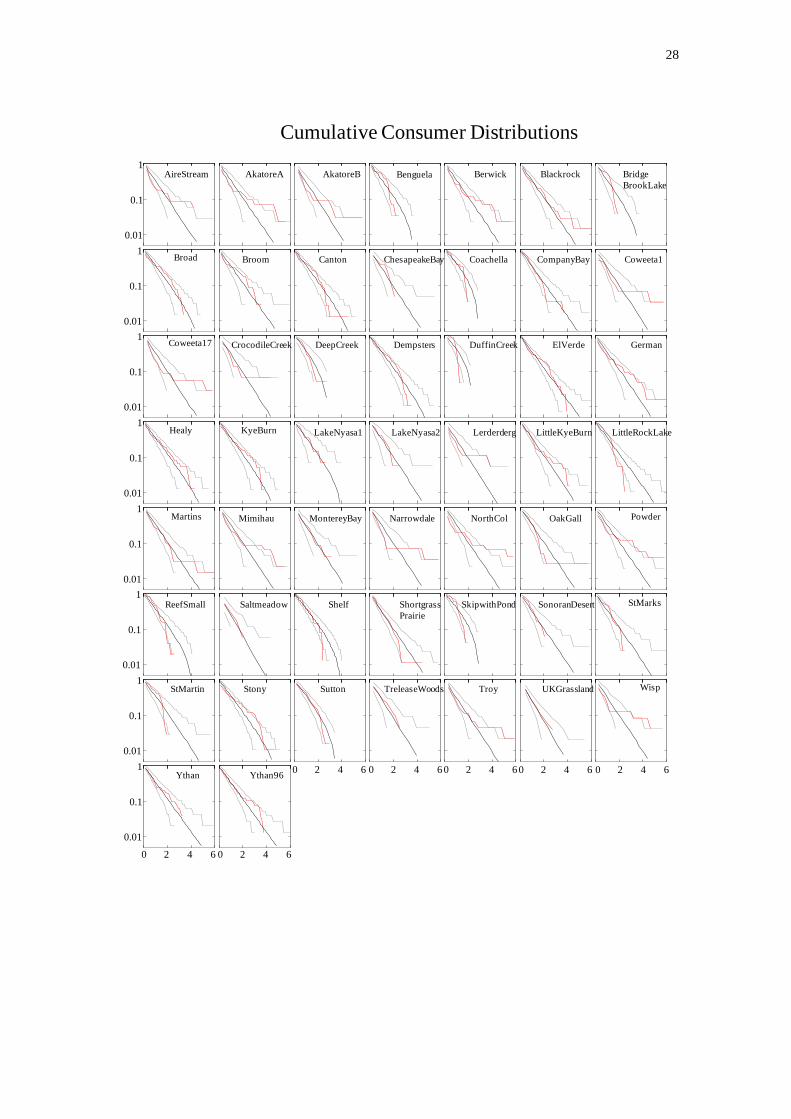
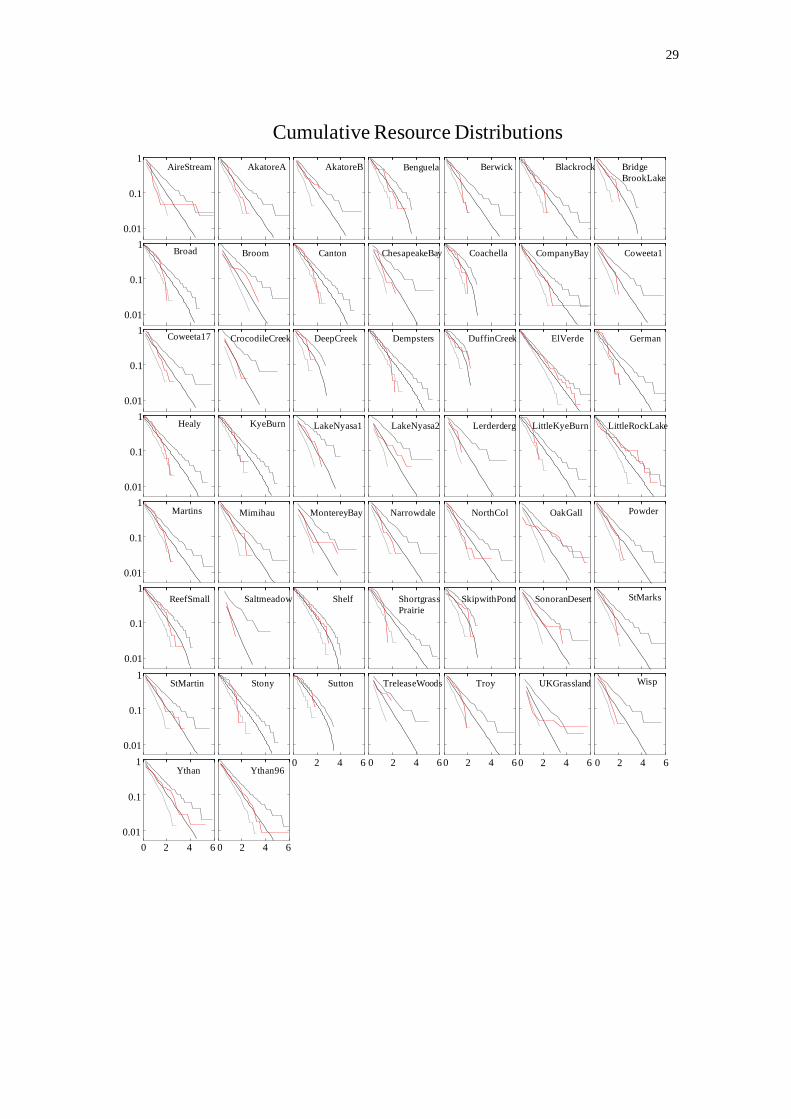
Figure S1. Cumulative predator and prey distributions of the 51 empirical food
webs. Linear-log plots of the cumulative distribution (fraction of species (nodes) with
more than k predators or prey. On the x-axis, the number of links is scaled by the mean
number of links, z = L/S. Red curce is the empirical degree distribution, black curve the
mean and grey curves the upper and lower limits of the central 95% of 10,000
distributions drawn from the Maxent model. Inset in each panel shows the food web’s
connectance C, likelihood ratio goodness of fit fG and fit measured by the relative width
of the distribution W95.
28
Cumulative Consumer Distributions
AireStream AkatoreA AkatoreB Berwick Blackrock Bridge
BrookLake
Broad Broom Canton ChesapeakeBay Coachella CompanyBay Coweeta1
Coweeta17 CrocodileCreek DeepCreek Dempsters DuffinCreek ElVerde German
KyeBurn LakeNyasa1 LakeNyasa2 Lerderderg LittleKyeBurn LittleRockLake
Martins Mimihau MontereyBay Narrowdale NorthCol OakGall Powder
ReefSmall Saltmeadow Shelf Shortgrass
Prairie
SkipwithPond SonoranDesert StMarks
StMartin Stony Sutton TreleaseWoods Troy UKGrassland Wisp
Ythan Ythan96
Benguela
Healy
0 2 4 60 2 4 6
0 2 4 6 0 2 4 6 0 2 4 6 0 2 4 6 0 2 4 6
1
0.1
0.01
1
0.1
0.01
1
0.1
0.01
1
0.1
0.01
1
0.1
0.01
1
0.1
0.01
1
0.1
0.01
1
0.1
0.01
29
Cumulative Resource Distributions
AireStream AkatoreA AkatoreB Berwick Blackrock Bridge
BrookLake
Broad Broom Canton ChesapeakeBay Coachella CompanyBay Coweeta1
Coweeta17 CrocodileCreek DeepCreek Dempsters DuffinCreek ElVerde German
KyeBurn LakeNyasa1 LakeNyasa2 Lerderderg LittleKyeBurn LittleRockLake
Martins Mimihau MontereyBay Narrowdale NorthCol OakGall Powder
ReefSmall Saltmeadow Shelf Shortgrass
Prairie
SkipwithPond SonoranDesert StMarks
StMartin Stony Sutton TreleaseWoods Troy UKGrassland Wisp
Ythan Ythan96
Benguela
Healy
0 2 4 60 2 4 6
0 2 4 6 0 2 4 6 0 2 4 6 0 2 4 6 0 2 4 61
0.1
0.01
1
0.1
0.01
1
0.1
0.01
1
0.1
0.01
1
0.1
0.01
1
0.1
0.01
1
0.1
0.01
1
0.1
0.01
Top Related