


Languages
Pages
Legal


Massachusetts Climate Change Adaptation Report
8
The Commonwealth of Massachusetts is already
experiencing the effects of climate change in the
form of hotter summers, rising sea levels, more
frequent flooding, and warmer waters — leading to a
growing concern about how the impacts of these
changes will affect the state‘s future. The ―Perfect
Storm‖ of October 1991, which was once considered
a one in greater than 1,000-year event, is now a one
in 200- to 500-year event (Kirshen at al., 2008).
Storms such as the Hurricane of 1938, which caused
widespread coastal flooding and resulted in losses
such as loss of life, property, and infrastructure, are
now considered one in two-year events in
Massachusetts. Extensive areas of beachfront are
lost to coastal erosion and some groundwater
supplies near the coast are rendered undrinkable by
saltwater intrusion. Every summer, 5 to 20 days now
reach over 32°C (90°F), nearly double of what it was
45 years ago. This results in poor air quality and
causes significant respiratory and cardiovascular
health problems, especially for children and the
elderly.
Over the last 40 years, fish stocks have shifted north
to remain within their preferred temperature range
(Nye et al., 2009). Summer heat stress reduces
Massachusetts dairy milk production by 5 to 10
percent and weed problems escalate for local
farmers. River and stream flooding from increased
extreme rain events results in combined sewer
overflows and the increased stormwater can cause
outbreaks of water-borne diseases from pathogens
such as Giardia and Cryptosporidium. Migratory
songbirds decline as their habitat is reduced and
degraded, while stands of hemlock fall prey to the
woolly adelgid, an invasive insect.
Over the next several decades, temperatures are
expected to continue to increase. As winters get
warmer and receive less snow, Massachusetts ski
areas and other winter recreation businesses will be
adversely affected. By 2100, the Northeast region
can expect a decrease of 10 to 20 percent in skiing
days, resulting in a loss of $405 million to $810
million per year (Ruth et al., 2007). With warmer
marine waters, lobster, cod, and other commercially
important seafood species will become harder to find
in state waters and nearby fishing grounds.
Other industries are also vulnerable to climate
change. By the end of the century, the $31 million
maple sugar industry is projected to lose 17 to 39
percent in annual revenue due to
decreased sap flow. With
increasing temperatures,
electricity demand in
Massachusetts could increase by
40 percent in 2030, most of
which would occur in the
summer months and require significant investment
in peak load capacity and energy efficiency measures
(Ruth et al., 2007). Also this increase in energy
demand for cooling triggers the electric grid to fire
up fossil-fuel powered ―peaking‖ plants—among the
most expensive of the region‘s energy generation
portfolio to operate—resulting in the production of
additional climate change-causing greenhouse gas
emissions.
Taken as a whole, these impacts can have significant
economic consequences to Massachusetts. Studies
quantifying climate change impacts on the U.S.
Gross Domestic Product (GDP) estimate that, by the
year 2100, under a business-as-usual emissions
scenario, damages from climate change are
projected to cost up to 2.6 percent of the U.S. GDP
(Ackerman et al., 2009). There are no studies that
have downscaled economic impacts of climate
change to the state level, but it seems logical and
likely that a coastal state like Massachusetts will see
significant impacts to its economy from sea level
rise, precipitation shifts, and temperature changes.
At the same time, it is important to recognize that,
even with these potential negative economic
impacts, climate change may create new economic
opportunities. From new fish stocks to longer
growing seasons, new natural resource-related
opportunities might emerge. With a variety of
sectors that develop and deploy technologies to
address water quality, sewerage and stormwater,
these businesses might be able to take advantage of
new markets as precipitation patterns change. With
an integrated policy to reduce greenhouse gas
emissions, build a clean energy economy, and gain
energy independence, Massachusetts has already
seized state, national, and global economic
opportunities in clean energy research and
development, manufacturing, delivery and services.
Recognizing these concerns and the potential
opportunities, Massachusetts enacted the Global
Warming Solutions Act of 2008. Along with
mandating immediate action to reduce
Climate Change Adaptation in Massachusetts 1

9
Massachusetts‘ contribution to global warming, the
Act established the Climate Change Adaptation
Advisory Committee to investigate the potential
impacts of climate change in Massachusetts and
propose strategies to adapt to these impacts. This
report presents the work and recommendations of
the committee. This introductory chapter summa-
rizes the Global Warming Solutions Act, describes
the committee and its work, and provides an
overview of the remainder of the report.
The Global Warming Solutions Act
In recognition of the scope and magnitude of the
threat and opportunities posed by global climate
change, Governor Deval Patrick signed the Global
Warming Solutions Act on August 13, 2008. Enacted
by the state Legislature under the leadership of Sen-
ate President Therese
Murray, Senate Committee
on Global Warming and
Climate Change Chairman
Marc Pacheco, and House
Speaker Salvatore DiMasi,
the Act affirms Massachu-
setts‘ leadership in clean
energy and environmental
stewardship by requiring reductions in greenhouse
gas emissions from 1990 levels by between 10 and
25 percent by 2020, and by 80 percent by 2050. In
December 2010, in compliance with the new law, the
Secretary of Energy and Environmental Affairs set
the 2020 reduction limit at 25 percent, and unveiled
the Massachusetts Clean Energy and Climate Change
Plan for 2020, which lays out a strategy to achieve
that goal.
Among other components, the Global Warming
Solutions Act contains a section focused on meeting
the threats and challenges posed by climate change.
Section 9 of the Act requires the Secretary of Energy
and Environmental Affairs (EEA) to convene and
chair an advisory committee ―to analyze strategies
for adapting to the predicted impacts of climate
change in the Commonwealth‖. To ensure expansive
and diverse input, the Act called for broad advisory
committee membership, with experts from a range
of sectors facing climate change impacts. The Act
also required the advisory committee to submit to
the Legislature a report of its findings and
recommendations on strategies for adapting to
climate change.
The Climate Change Adaptation
Advisory Committee
In June 2009, the EEA Secretary named the Climate
Change Adaptation Advisory Committee to advise
the State on strategies for adapting to sea level rise,
warming temperatures, increased incidence of floods
and droughts, and other predicted effects of climate
change. As mandated by the Act, the committee
includes members representing the following
sectors: transportation and built infrastructure;
commercial, industrial, and manufacturing activities;
low-income consumers; energy generation and
distribution; land conservation; water supply and
quality; recreation; ecosystem dynamics; coastal
zone and ocean; rivers and wetlands; and local
government. The committee also included experts in
public health, insurance, forestry, agriculture, and
public safety.
Five technical subcommittees provided forums for in-
depth examination of specific topic areas:
• Natural Resources and Habitat
• Key Infrastructure
• Human Health and Welfare
• Local Economy and Government
• Coastal Zone and Oceans
In addition, a sixth subcommittee, under the local
economy and government subcommittee focused on
land use issues. The subcommittees comprised of
members of the full committee, as well as additional
experts and representatives. (See sector chapters
for the subcommittee membership list.) In all, more
than 200 individual experts, professionals, and
stakeholders participated in the advisory committee
process.
To develop the report, the committee followed a
deliberate process to gain public input, evaluate data
and information, develop recommendations, and
inform the Legislature.
Public Engagement
To provide wide public input into the report
development process, public comment was taken at
a series of public information and input sessions.
Eight public information sessions were held across
the state in June and July of 2009. Presentations at
these sessions provided an overview of the Global
Warming Solutions Act, a review of current global
trends on climate change and predicted climate
change impacts in the Northeast (such as
temperature change, sea level rise, and precipita-
tion), and examples of how these impacts may affect
Massachusetts. After an open forum for public input
and questions-and-answers, contact information was
solicited to ensure that stakeholders received
updates on the committee‘s progress.
In addition. EEA established a website to publish
information about climate change adaptation and
Chapter 1: Climate Change Adaptation in Massachusetts
Massachusetts Climate Change Adaptation Report
10
post documents, presentations, references, and
advisory committee and subcommittee meeting
notices. Every meeting was open to the public and
time was specifically allocated at each meeting for
members of the public to speak. EEA also publicized
the meetings widely via its website, email,
newsletters, and The Environmental Monitor,
published bi-weekly by EEA‘s Massachusetts
Environmental Policy Act office.
Meetings
The advisory committee met three times between
June and October of 2009. At the first meeting, the
committee reviewed and discussed predicted climate
changes in Massachusetts and approved a general
course of action and timeline. The focus of the
committee‘s second meeting was on the progress
and general themes emerging from the work of the
individual subcommittees and from the public
information sessions. Among the common topics
identified were shared data and information needs,
the preliminary identification of Massachusetts‘
potential vulnerabilities to climate change impacts,
and the recognition of the ―cross-cutting‖ nature of
many expected impacts. The six subcommittees met
frequently over the summer and fall of 2009,
reviewing climate change effects, discerning risks
and vulnerabilities, and identifying possible
strategies to reduce these threats and ensure that
Massachusetts is better positioned to address and
adapt to a changing climate. In October 2009, at its
third meeting, each subcommittee presented the
highlights of its recommendations to the whole
committee. These presentations were followed by
questions and deliberations, and a discussion on the
final steps of the process.
Legislative Briefings
Over a two-month period between October and
December of 2009, the advisory committee made
presentations on its efforts and progress to the
House Committee on Global Warming and Climate
Change, chaired by Representative Frank Smizik.
These presentations included: briefings on Climate
Change Science provided by Rob Thieler of the U.S.
Geological Survey and on Coastal Zone and Ocean
topics by Bud Ris of the New England Aquarium;
briefings on Key Infrastructure by Alexander Taft of
National Grid and Ray Jack of the Town of Falmouth;
on Local Economy and Government by Karen O‘Reilly
of AIU Holdings, Inc. and Missy Stults from ICLEI—
Local Governments for Sustainability, and on Land
Use by Marc Draisen of the Metropolitan Area
Planning Council; and briefings on Natural Resources
and Habitat by Andrew Finton of The Nature
Conservancy and on Human Health and Welfare by
Paul Epstein of Harvard University. The briefings
were open to the public and well attended.
Overview of the Climate Change
Adaptation Advisory Committee
Report
This report to the Legislature presents the work and
recommendations of the committee in two parts.
Part I, which is comprised of three chapters, contains
the over-arching conclusions and recommendations
of the committee. Chapter 2 presents a summary of
the observed and forecasted changes in climate
parameters and the known and expected impacts in
Massachusetts. Chapter 3 contains several key
findings that emerged from the committee process
and describes a set of principles that guided the
committee process and should serve as guidelines
for future development and implementation of
climate change adaptation strategies. Chapter 3 also
presents cross-cutting strategies, which were
informed by and developed directly from the
information and ideas generated by the individual
sector-specific subcommittees.
Part II contains individual sector-specific chapters.
These chapters contain analysis and policy
suggestions for specific topics (or ―sectors‖): Natural
Resources and Habitat, Key Infrastructure, Human
Health and Welfare, Local Economy and
Government, and Coastal Zone and Oceans. Each
chapter provides a general overview of the sector
and its general vulnerabilities, followed by a
description of sub-sectors with specific vulnerabilities
and impacts that could result from predicted climate
change (as described in Chapter 2), and strategies to
help increase resilience, decrease vulnerabilities, and
better prepare the sector for a changing climate.
Each strategy is associated with one of two
implementation timelines—short-term and long-
term. Short-term strategies are those strategies
that can be implemented over the next five years—a
time frame that is considered to be a typical
planning horizon. Long-term strategies are those
that may take many years to implement, or would
not be expected to be initiated for at least five years,
such as larger infrastructure projects or strategies
dependent on data collection and monitoring. In
addition, no regret strategies are also identified for
each sector, i.e., strategies that are easily
implemented, help to make systems more resilient,
and would offer substantive benefits beyond climate
change adaptation.
11
REFERENCES
Ackerman, F., E. Stanton, C. Hope, and S. Alberth, 2009. Did the Stern Review Underestimate US and Global
Climate Damages? Energy Policy 37: 2717-2721.
Kirshen P., C. Watson, E. Douglas, A. Gontz, J. Lee, and Y. Tian, 2008. Coastal flooding in the Northeastern
United States due to climate change. Mitig Adapt Strat Glob Change 13:437–451.
Nye, J. A., J. S. Link, J. A. Hare, and W. J. Overholtz, 2009. Changing spatial distribution of fish stocks in relation
to climate and population size on the Northeast United States continental shelf. Marine Ecology Progress Series
393: 111-129.
Ruth, M., D. Coelho, and D. Karetnikov. 2007. The US Economic Impacts of Climate Change and the Costs of
Inaction. University of Maryland: Center for Integrative Environmental Research.
Chapter 1: Climate Change Adaptation in Massachusetts

Massachusetts Climate Change Adaptation Report
12
It is widely accepted by the scientific community that
the increased amount of emissions from
anthropogenically generated greenhouse gases, such
as carbon dioxide (CO2), methane (CH4), and nitrous
oxide (N2O), are contributing to changing climatic
conditions. Generation of these gases has increased
dramatically in the last century from industrial
processes, fossil fuel combustion, and changes in
land use (e.g., deforestation). In its 2007 report, the
Intergovernmental Panel on Climate Change (IPCC)
found that the ―warming of the climate system is
unequivocal, as is now evident from observations of
increases in global average air and ocean
temperatures, widespread melting of snow and ice,
and rising global average sea level‖ (IPCC, 2007).
Global climate change is already causing and will
continue to result in significant local impacts.
Since the start of the Industrial Revolution,
emissions of greenhouse gases from human activity
have resulted in accumulation in the atmosphere,
trapping more heat and enhancing the ―greenhouse
effect‖. Without the natural heat-trapping function of
these gases, the earth‘s atmosphere would be too
cold to support life. CO2 concentrations, however,
are higher today than they have ever been during
human history. There is broad agreement and high
confidence this increase in greenhouse gas
concentrations is changing the earth‘s climate—not
only raising average global temperatures, but more
importantly, altering regional and local climatic and
weather patterns (IPCC, 2007). Observed effects of
climate change include increased atmospheric and
ocean temperatures, heat waves, increased
evapotranspiration and precipitation, and a greater
intensity of storms, floods, and droughts. Thermal
expansion of a warmer ocean and the melting of
glaciers are contributing to a rise in sea level. These
changes are expected to continue for a minimum of
several decades even if greenhouse gas emissions
are reduced.
This chapter summarizes the observed and
forecasted changes in climate conditions and the
expected impacts in Massachusetts.
The Global Scale
Globally, CO2 concentrations have reached 385 parts
per million (ppm)—about 105 ppm greater than
during pre-industrial times (see Figure 1). The
increasing atmospheric CO2 and other heat trapping
greenhouse gases are causing an increase in the
earth‘s air temperatures. Over the last 100 years,
global average temperature has increased by about
0.74°C (1.3°F) (IPCC, 2007). A recent study by
NOAA (2010) indicates that the summer of 2010 tied
with 1998 as having the warmest global temperature
on record. For the period between January–
September in 2010, the global combined land and
ocean surface temperature was 0.65°C (1.17°F)
above the 20th century average of 14.1°C (57.5°F).
Also, each year in the 2000s was hotter than
average conditions in the 1990s, which, in turn, were
hotter than average conditions in the 1980s. This
trend could continue until the end of the century.
According to climate models, global temperatures
could increase by an additional 1.8° to 4°C (3.2° to
7.2°F) by the end of this century.
The ongoing debate in the scientific community is
not about whether climate change will occur, but the
rate at and extent to which it will occur and the
adjustments needed to address its impacts. Much of
the uncertainty about the predicted rate and extent
The Changing Climate and Its Impacts 2
Figure 1: Global Temperature and CO2 Trends
Source: NASA graphs by Robert Simmon, based on carbon
dioxide data (Dr. Pieter Tans, NOAA/ESRL) and temperature
data (NASA Goddard Institute for Space Studies).
13
of climate change results from the difficulty of
projecting whether and how rapidly greenhouse gas
emissions will be stabilized or reduced.
In general, relatively modest changes in temperature
are predicted to have major impacts on already
stressed coastal
ecosystems, thus
threatening
biodiversity and
ecosystem-based
economies such as fisheries, tourism, and recreation
(NOAA, 2009). The amount of water available on a
global scale is projected to increase in the higher
latitudes by 10 to 40 percent and decrease in
already dry regions by 10 to 30 percent. Scientists
predict an increase in precipitation in the form of
heavy rain events, as well as vast desertification of
the African continent. Sea level is projected to rise
and cause increased coastal inundation, and
scientists predict many low lying areas around the
world—such as the Nile River Delta, the Ganges-
Brahmaputra Delta, and small Pacific Ocean islands—
will be submerged.
Global warming is also likely to cause melting of the
ice caps. The Arctic is expected to experience ice-
free summers within a few years. Overall, the biodi-
versity of plants and animal species is projected to
decrease—20 to 30 percent of the assessed plant
and animal species in the world face an elevated risk
of extinction.
Climate change is projected to impact food
production and cause an increase in the number of
people affected by malnutrition. There is also
predicted to be an elevation in public health concerns
given the expectation of a greater incidence and
range of vector-borne diseases and longer disease
transmission seasons.
Climate Change Predictions and
Impacts in Massachusetts
Peer-reviewed scientific projections and existing data
and observations were examined and compiled to
help define current conditions and the range of
predicted climate changes in Massachusetts. This
information was used in the development and
analysis of strategies to adapt to these predicted
changes. Where available, Massachusetts-specific
data were used for this report, but, for the most
part, assessments and projected impacts developed
for the northeast United States were used as a
surrogate for impacts in Massachusetts.
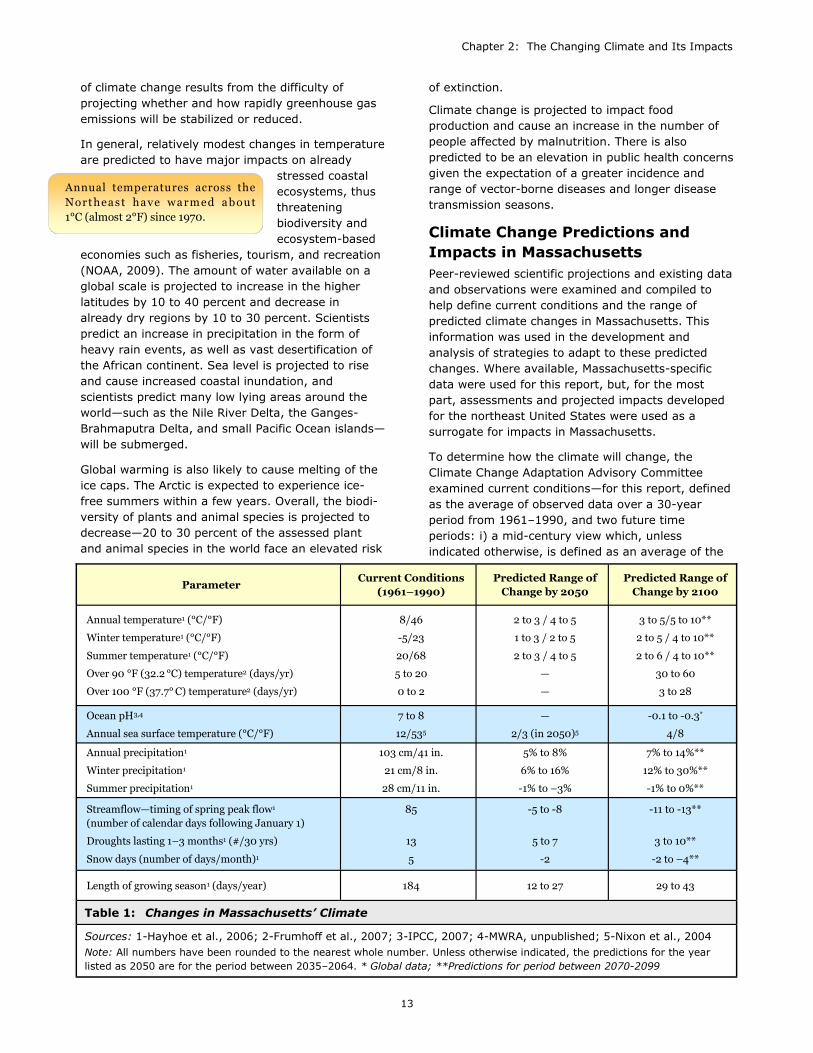
To determine how the climate will change, the
Climate Change Adaptation Advisory Committee
examined current conditions—for this report, defined
as the average of observed data over a 30-year
period from 1961–1990, and two future time
periods: i) a mid-century view which, unless
indicated otherwise, is defined as an average of the
Parameter Current Conditions
(1961–1990)
Predicted Range of
Change by 2050
Predicted Range of
Change by 2100
Annual temperature1 (°C/°F)
Winter temperature1 (°C/°F)
Summer temperature1 (°C/°F)
Over 90 °F (32.2 °C) temperature2 (days/yr)
Over 100 °F (37.7° C) temperature2 (days/yr)
8/46
-5/23
20/68
5 to 20
0 to 2
2 to 3 / 4 to 5
1 to 3 / 2 to 5
2 to 3 / 4 to 5
—
—
3 to 5/5 to 10**
2 to 5 / 4 to 10**
2 to 6 / 4 to 10**
30 to 60
3 to 28
Ocean pH3,4
Annual sea surface temperature (°C/°F)
7 to 8
12/535
—
2/3 (in 2050)5
-0.1 to -0.3*
4/8
Annual precipitation1
Winter precipitation1
Summer precipitation1
103 cm/41 in.
21 cm/8 in.
28 cm/11 in.
5% to 8%
6% to 16%
-1% to –3%
7% to 14%**
12% to 30%**
-1% to 0%**
Streamflow—timing of spring peak flow1
(number of calendar days following January 1)
Droughts lasting 1–3 months1 (#/30 yrs)
Snow days (number of days/month)1
85
13
5
-5 to -8
5 to 7
-2
-11 to -13**
3 to 10**
-2 to –4**
Length of growing season1 (days/year) 184 12 to 27 29 to 43
Table 1: Changes in Massachusetts’ Climate
Sources: 1-Hayhoe et al., 2006; 2-Frumhoff et al., 2007; 3-IPCC, 2007; 4-MWRA, unpublished; 5-Nixon et al., 2004
Note: All numbers have been rounded to the nearest whole number. Unless otherwise indicated, the predictions for the year
listed as 2050 are for the period between 2035–2064. * Global data; **Predictions for period between 2070-2099
Annual temperatures across the
Northeast have warmed about
1°C (almost 2°F) since 1970.
Chapter 2: The Changing Climate and Its Impacts

Massachusetts Climate Change Adaptation Report
14
2035–2064 predictions, and ii) an end-of-
the-century prediction (2100).
Each of the two future scenarios has a
predicted range of change—the lower
number is based on the lowest prediction
of the low emissions scenario (―B1‖
scenario with CO2 concentration of 550
ppm or above) as outlined by the IPCC
(Nakicenovic et al., 2000), and the higher
number is based on the highest prediction
of the higher emissions scenario (―A1FI‖
scenario with CO2 concentration of 970
ppm) as outlined by the IPCC
(Nakicenovic et al., 2000). Table 1
provides an overview of the observed and
expected changes in Massachusetts‘
climate over a 140-year period.
Inherent in scientific predictions of
climate change is a measure of
uncertainty. Due to the variety of
influencing factors, it is difficult to know
what the levels of future greenhouse
gases emissions will be. The further the
projections are made into the future, the higher the
level of uncertainty associated with projected
emission levels, demographics, economic
development, and technological advances that could
drive greenhouse gas emissions.
However, the risk to Massachusetts is clear. As a
coastal state, Massachusetts is expected to
experience significant impacts to its coastline due to
sea level rise. All of the scenarios of partial or
complete melting of ice caps in Greenland and
Antarctica threaten to raise sea level and inundate
the highly populated coastal areas of Massachusetts
by the end of the century. Scientists also predict
that, by mid-century, Massachusetts will experience
longer growing seasons, more short-term droughts,
and increased precipitation rates especially during
the winter months (Hayhoe et al., 2006). The
duration of the winter snow season could be reduced
by 50 percent, with impacts on industries from skiing
to water supplies.
Ambient Temperature
As with global climate change, the climate of the
Northeast United States and Massachusetts has
already been changing. Over the last century, annual
air temperatures from Maine to New Jersey have
increased. Weather station records of the United
States Historical Climatology Network indicate that
the Northeast has been
warming at an average
rate of nearly 0.26°C
(0.5°F) per decade since 1970, and winter
temperatures have been rising even faster at a rate
of over 0.7°C (1.3°F) per decade (Frumhoff et al.,
2006, 2007; Hayhoe et al., 2006). By mid-century,
the projected increase is 2.1° to 2.9°C (3.8° to 5.2°
F), and 2.9° to 5.3°C (5.2° to 9.5°F) by the end of
the century. According to Frumhoff et al (2006),
temperatures over the next few decades are
projected to increase more in winter than in
summer.
These warming trends are associated with other
observed changes
including, more
frequent days with
temperatures above
32°C (90°F), rising sea surface temperatures and
sea levels, changes in precipitation patterns and
amounts, and alterations in hydrological patterns.
Heat waves are expected to increase in duration
each year as greenhouse gas emissions increase. By
late-century, many North-eastern cities can expect
60 or more days per year over 32°C (90°F) under
the higher-emissions scenario or at least 30 such
days if conservation and renewable energy efforts
are successful. (There are now approximately 12
such days each year.) The number of days over 38°C
(100°F) in the summer of 2100 could range from 3
to 9 under the lower-emissions scenario to between
14 and 28 under the higher-emissions scenario
(Frumhoff et al., 2006, 2007).
Projected increases in temperature could result in a
Extreme heat in summer is
becoming more frequent.
Figure 2: Blue Hill Observatory Annual Temperature, 1831–2008
Source: Michael J. Iacono, Atmospheric and Environmental Research,
Inc./Blue Hill Observatory, MA
Note: Plot includes temperature data for 1831–1884 from Milton and Canton that
were adjusted to the Blue Hill summit location.
Winters are warming at 0.72°C
(1.3ºF) per decade since 1970.
15
decline in air quality, aggravate asthma, and cause
other human health effects in Massachusetts, which
already has one of the highest rates of adult asthma
in the United States (Massachusetts Department of
Public Health—State Health Facts). Periods of
extreme heat—or heat waves—are already
significant health threats, especially to children, the
elderly, and lower income communities. The extreme
heat is most dangerous in urban areas because of a
combination of large concentrations of vulnerable
populations and a large extent of heat-absorbing
pavement and buildings, which cause daytime and
nighttime temperatures to be markedly higher than
in suburban or rural areas. Heat waves are of
particular concern and could have broad implications
for public health, infrastructure, government
capacities, plants, and crops. The state‘s
susceptibility to these extreme heat events is high,
since 36 percent of its land area is urban and more
than half of the 100 most populated cities in New
England are located in Massachusetts. Higher
temperatures can also affect the agricultural section.
While a longer growing season due to increased
temperatures may support new crops and fruits,
agricultural activities could experience compounded
impacts due to changes in precipitation and runoff,
and increasing weed and pest problems.
Sea Surface Temperature
Data collected at Woods Hole in Massachusetts show
that annual mean sea surface temperature increased
at a rate of 0.04°C (0.07°F) per year from 1970-
2002, a total of 1.3°C (2.3°F) during that period
(Nixon et al., 2004). By mid-century, sea surface
temperature could increase by 1.7°C (3°F) and, by
the end of this century, it could increase 2.2° to
2.8°C (4° to 5°F) under the lower emissions
scenario, or 3.3° to 4.4°C (6° to 8°F) under the
higher emissions scenario (Dutil and Brander, 2003;
Frumhoff et al., 2007; Nixon et al., 2004).
The anticipated effects of sea temperature increases
on many coastal and marine animals are not
certain , but it is likely that habitat boundaries of
some species may shift. Certain native populations
will likely move northward toward cooler waters, and
the occurrence of species that are typically found in
southern latitudes is predicted to increase in Mass-
achusetts and nearby waters. While the increased
temperatures will have broad effects across
estuarine and marine habitats and the ecosystem
services they support, impacts to commercially
important species will influence the state‘s fishing
industry—both recreational and commercial. For
example, cod require habitat with a mean annual
bottom temperature below 12°C (54°F). This species
will likely disappear from the waters south of Cape
Cod by late-century under the higher emissions
scenario (Drinkwater, 2005; Dutil and Brander,
2003; Frumhoff et al., 2007). Bottom waters of the
Georges Bank fishery, one of the most productive
fishing grounds in the eastern Atlantic, may also
approach the maximum temperature threshold for
cod, reducing recruitment and productivity, and
further taxing the sustainability of the region‘s
significant cod fishery (Frumhoff et al., 2007).
In shallower nearshore waters south of Cape Cod,
lobster fisheries may be lost by mid-century.
Already, declining populations of lobster south of
Cape Cod are indicative of possible climate impacts.
Increased surface temperatures and more high-
latitude freshwater input (from precipitation and ice-
melt) may disrupt large-scale circulation patterns in
the western North
Atlantic, leading to
profound cascading
effects on marine
ecosystems and
weather patterns.
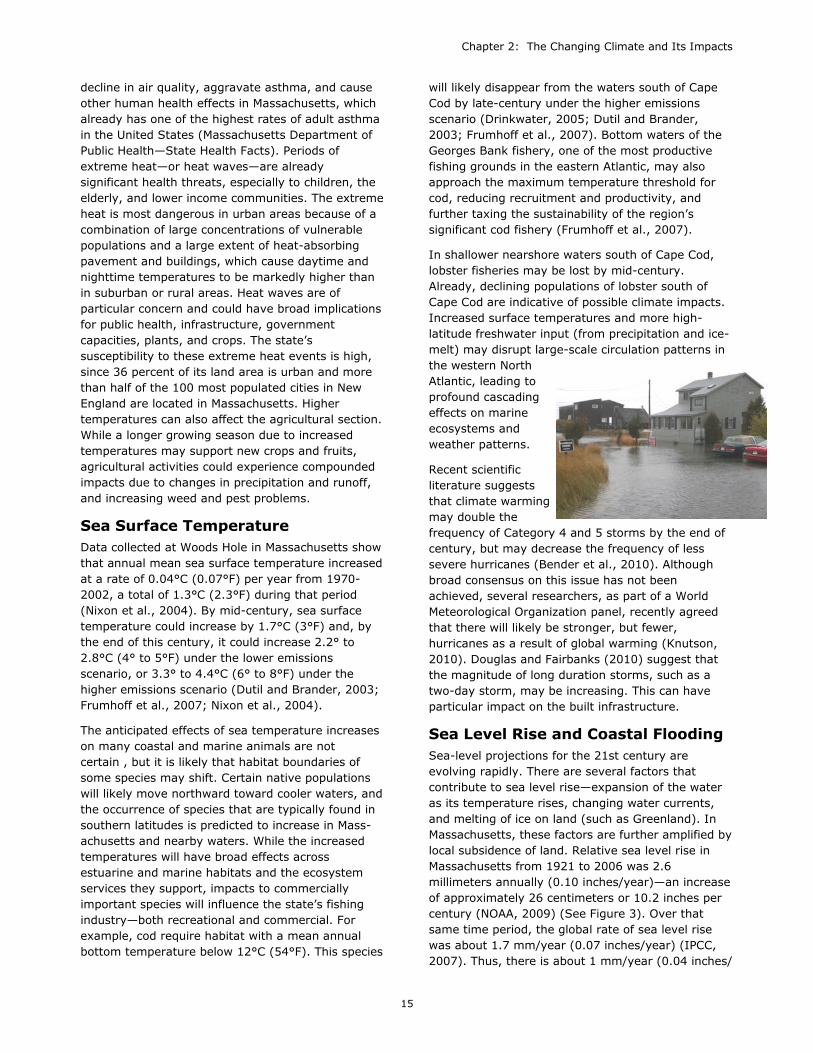
Recent scientific
literature suggests
that climate warming
may double the
frequency of Category 4 and 5 storms by the end of
century, but may decrease the frequency of less
severe hurricanes (Bender et al., 2010). Although
broad consensus on this issue has not been
achieved, several researchers, as part of a World
Meteorological Organization panel, recently agreed
that there will likely be stronger, but fewer,
hurricanes as a result of global warming (Knutson,
2010). Douglas and Fairbanks (2010) suggest that
the magnitude of long duration storms, such as a
two-day storm, may be increasing. This can have
particular impact on the built infrastructure.
Sea Level Rise and Coastal Flooding
Sea-level projections for the 21st century are
evolving rapidly. There are several factors that
contribute to sea level rise—expansion of the water
as its temperature rises, changing water currents,
and melting of ice on land (such as Greenland). In
Massachusetts, these factors are further amplified by
local subsidence of land. Relative sea level rise in
Massachusetts from 1921 to 2006 was 2.6
millimeters annually (0.10 inches/year)—an increase
of approximately 26 centimeters or 10.2 inches per
century (NOAA, 2009) (See Figure 3). Over that
same time period, the global rate of sea level rise
was about 1.7 mm/year (0.07 inches/year) (IPCC,
2007). Thus, there is about 1 mm/year (0.04 inches/
Chapter 2: The Changing Climate and Its Impacts

Massachusetts Climate Change Adaptation Report
16
year) local land subsidence in the relative sea level
record (Bamber et al., 2009).
The Massachusetts Climate Change Adaptation
Advisory Committee relied on three sources of
projections for sea level rise by 2100 (Table 2 and
Figure 4). First, the 2007 IPCC projections are widely
viewed as conservative (Rahmstorf, 2007; Rahmstorf
et al., 2007; Jevrejeva, 2008) but are highly credible
and internationally recognized. Second, the
Rahmstorf et al. (2007) approach uses a relationship
between global mean surface temperature and sea
level and then projects future changes using the
IPCC Third Assessment Report (2001) temperature
scenarios. Third, Pfeffer et al. (2008) use the IPCC
(2007) steric projection, and add ice melt to it.
Pfeffer et al. (2008) base this on physically plausible
melt or deterioration rates for Greenland, Antarctica,
and other glaciers and ice caps related to different
rates of melting and discharge that are known from
ice sheet and glacier behavior.
Sea currents also play a role in sea level rise along
the Massachusetts coast. The northeastern U.S. may
experience additional sea level
rise above the global mean due
to changes in the strength of the
Atlantic Meridional Overturning
Circulation, of which the Gulf
Stream is a part (Yin et al.,
2009; Hu et al., 2009). As the
Atlantic Meridional Overturning
Circulation slows, the dynamic
topography of the sea surface
changes and sea-level rises
along the coast. Yin et al. (2009)
suggest that there is the
potential for an additional 15 to
27 cm (5.9 to 10.6 in.) sea level
rise in Boston by 2100, while Hu
et al. (2009) suggest that a sea
level rise of 10 to 30 cm (3.9 to
11.8 in.) will occur in the
northeastern U.S. by 2100.
Finally, Bamber et al. (2009) found that the collapse
of the West Antarctic Ice Sheet would not only add
to sea level rise but, as it shrinks, would also cause a
redistribution of ocean mass due to the reduced
gravitational attraction of the smaller West Antarctic
Ice Sheet. This would be a global effect, most
pronounced in a band at ~40° north latitude where
the sea level rise is projected to be about 25 percent
more than elsewhere around the globe. Coastal
Massachusetts extends from roughly 41°10'N to 42°
53'N and would experience the full brunt of this
impact. There is presently high uncertainty regarding
the potential for full West Antarctic Ice Sheet
collapse, but this effect also applies to a partial
collapse. Overall, by 2100 sea level rise in
Massachusetts could range from 29 to 201 cm.
Current rates of sea level rise and projections for ac-
celerated trends are all significant threats to the
coastal communities of the state. Sea level rise
would increase the height of storm surges and asso-
ciated coastal flooding frequencies, permanently
inundate low-lying coastal areas, and amplify shore-
Figure 3: Mean Sea Level Trend measured at the Boston tide gauge.
Source: NOAA. http://tidesandcurrents.noaa.gov/sltrends/
sltrends_station.shtml?stnid=8443970
Source
Projections by 2050 Projections by 2100
Low
Emissions
High
Emissions
Low
Emissions
Mid
Emissions
High
Emissions
Pfeffer et al 2008 — — 78/31 83/33 201/79
Rahmstorf 2007 20/8 40/16 50/20 80/32 140/55
IPCC 2007 — — 18/7 48/19 59/23
Current sea-level trend (A1F1 scenario) 16/6 29/11
Table 2: Projected Sea Level Rise (centimeters/inches)
Note: All numbers have been rounded to the nearest whole number.

17
line erosion. Extensive development and infrastruc-
ture, both public and private, would be affected in
these expanding vulnerable areas. Analysis of five
coastal sites in the Northeast, including Boston and
Woods Hole, indicates that future sea level rise
would create significant increases in the frequency of
today‘s 100-year flood events (Kirshen et al., 2008).
Increased sea level, combined with increased erosion
rates, is also predicted to threaten Massachusetts‘
barrier beach and dune systems. Development on
the beaches themselves, as in the case of Plum
Island, will continue to face challenges associated
with erosion and storm damage. Barrier beaches will
be more susceptible to erosion and overwash, and in
some cases breaching. Such breaching will put at
risk extensive areas of developed shoreline located
behind these barrier spits and islands, such as the
shorelines of Plymouth, Duxbury, and Kingston.
Engineered structures, such as seawalls designed to
stabilize shorelines, could be overtopped. Large
areas of critical coastal and estuarine habitat,
including the North Shore‘s Great Marsh—the largest
continuous stretch of salt marsh in New England,
extending from Cape Ann to New Hampshire—are at
risk as they will be unable to adapt and migrate as
sea level rises and local land subsides. The National
Marine Fisheries Service estimates that 32 percent of
the commercial fish and shellfish collected in New
England are directly dependent on estuaries and salt
marshes for various life stages, including spawning
and early stage development (Stedman and Hanson,
1997). Higher sea levels will also intrude on
productive aquifers situated in permeable sands and
gravels, while drinking water options for
more and more communities and private
homeowners will become limited due to
saltwater intrusion.
Precipitation
New England is expected to experience
changes in the amount, frequency, and
timing of precipitation. Although
Massachusetts is a water-rich part of the
country, the predicted changes could add
pressure to the state‘s water resources.
Since 1900, precipitation recorded at
United States Historical Climatology
Network weather stations across the
Northeast has increased on average by 5
to 10 percent.
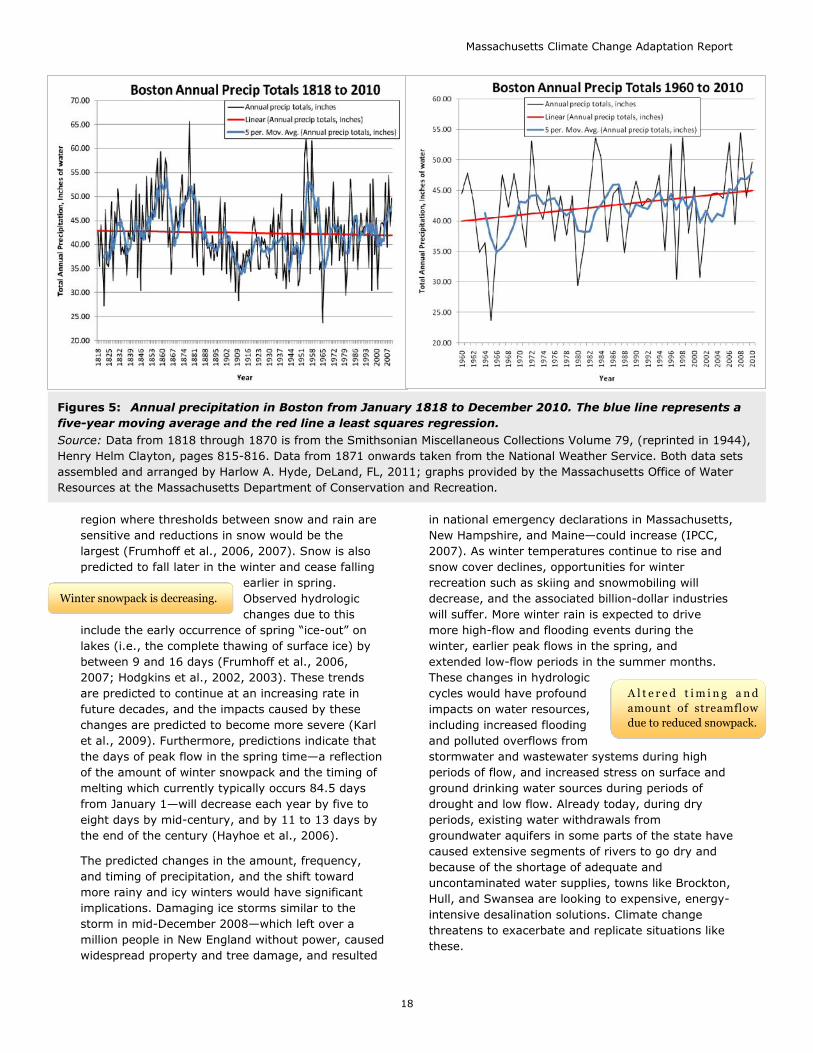
While precipitation data that goes back
nearly 200 years (Figures 5) illustrates a
slight decrease in annual precipitation.
However, a more recent 50-year view
shows an increase in total precipitation by
approximately 10 percent (2.12 mm/year). Also,
except in the Cape Cod region, the most recent 30-
year normal precipitation for Massachusetts is the
highest it has been since records started to be taken
(Massachusetts Water Resources Commission,
2008). In the past few decades, more of this
precipitation has been falling during winter as rain
(Frumhoff et al., 2006, 2007; Hayhoe et al., 2006;
Keim et al., 2005).There is also evidence of a strong
increase in extreme precipitation (defined as the
annual maximum daily precipitation depth) since the
1970s (Douglas and Fairbank, 2010) in northern
coastal New England.
By the end of the century, under the high-emissions
scenario, annual precipitation is expected to increase
by 14 percent, with a slight decrease in the sum-
mer—a time when river flows are already low—and a
30 percent increase in the winter (Hayhoe et al.,
2006). It is predicted that most of the winter precipi-
tation will be in the form of rain rather than snow.
This change in precipitation type will have significant
effects on the amount of snow cover, winter
recreation, spring snow melt
and peak stream flows,
water supply, aquifer
recharge, and water quality.
Large areas of the Northeast
are projected to lose more
than one-quarter and up to one-half of their snow-
covered days toward the end of the century in the
high-emissions scenario as a result of increased
ambient temperature in February and March.
Massachusetts is situated in the central part of the
Figure 4: Global sea level rise trend and projections
March 2010 was the wettest
month on record in
Massachusetts with 18.8
inches of precipitation!
Chapter 2: The Changing Climate and Its Impacts
Massachusetts Climate Change Adaptation Report
18
region where thresholds between snow and rain are
sensitive and reductions in snow would be the
largest (Frumhoff et al., 2006, 2007). Snow is also
predicted to fall later in the winter and cease falling
earlier in spring.
Observed hydrologic
changes due to this
include the early occurrence of spring ―ice-out‖ on
lakes (i.e., the complete thawing of surface ice) by
between 9 and 16 days (Frumhoff et al., 2006,
2007; Hodgkins et al., 2002, 2003). These trends
are predicted to continue at an increasing rate in
future decades, and the impacts caused by these
changes are predicted to become more severe (Karl
et al., 2009). Furthermore, predictions indicate that
the days of peak flow in the spring time—a reflection
of the amount of winter snowpack and the timing of
melting which currently typically occurs 84.5 days
from January 1—will decrease each year by five to
eight days by mid-century, and by 11 to 13 days by
the end of the century (Hayhoe et al., 2006).
The predicted changes in the amount, frequency,
and timing of precipitation, and the shift toward
more rainy and icy winters would have significant
implications. Damaging ice storms similar to the
storm in mid-December 2008—which left over a
million people in New England without power, caused
widespread property and tree damage, and resulted
in national emergency declarations in Massachusetts,
New Hampshire, and Maine—could increase (IPCC,
2007). As winter temperatures continue to rise and
snow cover declines, opportunities for winter
recreation such as skiing and snowmobiling will
decrease, and the associated billion-dollar industries
will suffer. More winter rain is expected to drive
more high-flow and flooding events during the
winter, earlier peak flows in the spring, and
extended low-flow periods in the summer months.
These changes in hydrologic
cycles would have profound
impacts on water resources,
including increased flooding
and polluted overflows from
stormwater and wastewater systems during high
periods of flow, and increased stress on surface and
ground drinking water sources during periods of
drought and low flow. Already today, during dry
periods, existing water withdrawals from
groundwater aquifers in some parts of the state have
caused extensive segments of rivers to go dry and
because of the shortage of adequate and
uncontaminated water supplies, towns like Brockton,
Hull, and Swansea are looking to expensive, energy-
intensive desalination solutions. Climate change
threatens to exacerbate and replicate situations like
these.
Figures 5: Annual precipitation in Boston from January 1818 to December 2010. The blue line represents a
five-year moving average and the red line a least squares regression.
Source: Data from 1818 through 1870 is from the Smithsonian Miscellaneous Collections Volume 79, (reprinted in 1944),
Henry Helm Clayton, pages 815-816. Data from 1871 onwards taken from the National Weather Service. Both data sets
assembled and arranged by Harlow A. Hyde, DeLand, FL, 2011; graphs provided by the Massachusetts Office of Water
Resources at the Massachusetts Department of Conservation and Recreation.
A l t e r e d t i m i n g a n d
amount of streamflow
due to reduced snowpack.
Winter snowpack is decreasing.

19
Floods
It is forecast that the Northeast will experience a
greater frequency of high precipitation events. Past
observations show that extreme precipitation events
(>50 mm / 2.0 in. of rain) have increased during the
period between 1949 and 2002 in eastern
Massachusetts (Wake et al., 2006). In 2010, heavy
spring rains (three intense rainstorms in March
alone) caused flooding throughout the state. A
number of rivers were at their highest flows since
record keeping began (see Table 3). Scientists
predict an 8 percent increase in extreme
precipitation events in the northeastern U.S. by mid-
century, and up to a 13 percent rise by 2100.
Rainfall during the wettest five-day period each year
is projected to increase by 10 percent by mid-
century and by 20 percent by the end of the century
(Frumhoff et al., 2006, 2007).
By 2050, Boston could experience the current 100-
year riverine flood every two to three years on
average and, by 2100, the current 100-year riverine
flood is expected to occur every one to two years
under both the low- and high-emissions scenarios. In
the case of coastal storms, the frequency and timing
of winter storms or nor‘easters could change. Under
the low-emissions scenario, little change is predicted
in the number of nor‘easters striking the Northeast,
but it could experience approximately 5 to 15
percent more late-winter storms under the high-
emissions scenario (Frumhoff et al., 2007).
Streamflow and Drought
Changes in temperature, as well as changes in the
amount, timing, and type of precipitation, affect
streamflows and drought characteristics. With more
winter precipitation in the form of rain and less as
snow, there is likely to be more runoff during the
winter and less during the
spring. This phenomenon
along with the increased
temperatures would cause
streamflow to peak earlier
in the year and to be lower
in the spring, which is
typically when flows are
highest. Changes in
precipitation and runoff can
have a significant impact on fisheries, agriculture,
and other natural systems.
Drought is related to soil moisture, which, in turn, is
related to evapotranspiration, rainfall, temperature,
drainage, and climatic changes. By the end of the
century, under the high emissions scenario, the
occurrence of droughts lasting one to three months
could go up by as much as 75% over existing
conditions (Hayhoe et al., 2006). Streamflows would
be lower in the summer months, especially under the
high emissions scenario, as a result of higher
evapotranspiration. Low flows and higher ambient air
temperatures would increase water temperatures,
which would affect coldwater fisheries, water-
dependent industries, growth, habitat, and salmon
and other anadromous fish migrations. Observations
indicate that the timing of the migration of
anadromous fish species, such as the Atlantic salmon
and alewives, has advanced in the last few decades
and they are migrating earlier in the season
(Huntington et al., 2003; Juanes and Beland, 2004).
During the Mothers’ Day floods of 2006, communities
along the northeastern Massachusetts received 38.1 cm
(15 in.) of rain in a 100-hour period.
Station Name
March-April 2010 Peak Flows Historic Peak Flow
Start of Analysis
Period Date Gage Height
(m/ft) Date
Gage Height
(m/ft)
Charles River at Waltham 3/15/2010 2.3 / 7.56 2/3/1976 1.99 / 6.54 1932
Indian Head River at Hanover 3/15/2010 2.23 / 7.32 3/18/1968 2.17 / 7.13 1967
Taunton River near Bridgewater 4/1/2010 4.56 / 14.97 3/20/1968 4.41 / 14.48 1930
Segreganset River near Dighton 3/15/2010 3/18/1968 2.64 / 8.66 2.34 / 7.69 1967
Table 3: Recent record High Spring flows in Massachusetts Rivers
Source: U.S. Geological Survey Massachusetts-Rhode Island Water Science Center
http://pubs.usgs.gov/of/2010/1315/
Chapter 2: The Changing Climate and Its Impacts
Massachusetts Climate Change Adaptation Report
20
Toward Adaptation
Changes in the climate can cause both subtle as well
as devastating effects to humans, human
infrastructure, and natural systems. An increase in
temperature can cause increased virulence of
viruses, insects and pests; decimation of sensitive
crops and plants; increased asthma and other
human health effects; and can impact the built
environment. Increased intensity of precipitation can
cause increased flooding, put humans and their
property at risk, ruin crops, and create public health
concerns from sewage and hazardous waste leaks.
Also, if the timing of the precipitation changes, it
could compromise water supplies and water
availability for fish and various habitats. Increases in
sea level rise can have severe consequences for both
natural and manmade systems.
There is a clear and compelling need for actions to
advance climate change adaptation in
Massachusetts. Scientific consensus affirms that
adaptation is necessary despite efforts to reduce
greenhouse gas emissions and its impacts. The 2007
IPCC report found that:
Societies across the world have a long record of
adapting and reducing their vulnerability to the
impacts of weather- and climate-related events such
as floods, droughts and storms. Nevertheless,
additional adaptation measures will be required at
regional and local levels to reduce the adverse
impacts of projected climate change and variability,
regardless of the scale of mitigation undertaken over
the next two to three decades.
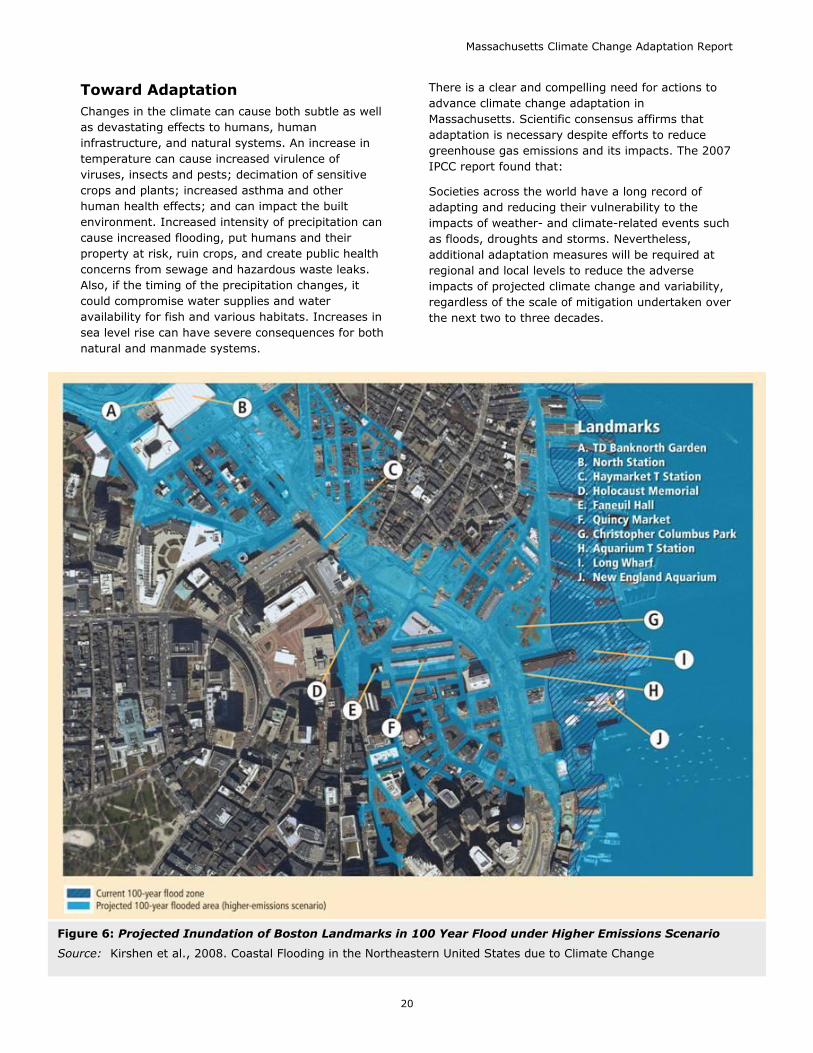
Figure 6: Projected Inundation of Boston Landmarks in 100 Year Flood under Higher Emissions Scenario
Source: Kirshen et al., 2008. Coastal Flooding in the Northeastern United States due to Climate Change
21
REFERENCES
Bamber, J. L., R. E. M. Riva, B. L. A. Vermeersen, and A. M. LeBrocq, 2009. Reassessment of the Potential Sea-
Level Rise from a Collapse of the West Antarctic Ice Sheet: Science, Vol. 324, No. 5929, pp. 901-903.
Bender, M. A., T. R. Knutson, R. E. Tuleya, J. J. Sirutis, G. A. Vecchi, S. T. Garner, and I. M. Held, 2010. Modeled
Impact of Anthropogenic Warming on the Frequency of Intense Atlantic Hurricanes. Science. Vol. 327, No. 5964,
pp. 454-458.
CCSP, 2009. Coastal Sensitivity to Sea-Level Rise: A Focus on the Mid-Atlantic Region. Synthesis and Assessment
Product 4.1. A report by the U.S. Climate Change Science Program and the Subcommittee on Global Change
Research. [James G. Titus (Coordinating Lead Author), K. Eric Anderson, Donald R. Cahoon, Dean B. Gesch,
Stephen K. Gill, Benjamin T. Gutierrez, E. Robert Thieler, and S. Jeffress Williams (Lead Authors)]. U.S.
Environmental Protection Agency, Washington D.C., USA, 320 pp. http://www.climatescience.gov/Library/sap/
sap4-1/final-report/sap4-1-final-report-all.pdf.
Douglas, E. M., and C. A. Fairbank, July 2011. Is precipitation in northern New England becoming more extreme?
A statistical analysis of extreme rainfall in Massachusetts, New Hampshire and Maine and updated estimates of
the 100-year storm. Journal of Hydrologic Engineering, 16 (3): 203-217.
Drinkwater, K. F., 2005. The response of Atlantic cod (Gadus morhua) to future climate change. ICES Journal of
Marine Science 62: 1327-1337.
Dutil, J. D., and K. Brander, 2003. Comparing productivity of North Atlantic cod (Gadus morhua) stocks and limits
to growth production. Fisheries Oceanography 12: 502-512.
Engelhart, S. E., Horton, B. P., Douglas, B. C., Peltier, W. R., and Törnqvist, T. E., 2009. Spatial variability of Late
Holocene and 20th Century sea-level rise along the U.S. Atlantic coast: Geology Vol. 37 No. 12 p. 1115-1118.
Frumhoff, P. C., J. J. McCarthy, J. M. Melillo, S. C. Moser, and D. J. Wuebbles, 2006. Climate Change in the U.S.
Northeast: A report of the Northeast Climate Impacts Assessment. Cambridge, MA: Union of Concerned
Scientists.
Frumhoff, P. C., J. J. McCarthy, J. M. Melillo, S. C. Moser, and D. J. Wuebbles, 2007. Confronting Climate Change
in the U.S. Northeast: Science, Impacts, and Solutions. Synthesis report of the Northeast Climate Impacts
Assessment. Cambridge, MA: Union of Concerned Scientists.
Hayhoe, K., C. P. Wake, T. G. Huntington, L. Luo, M. D. Schwartz, J. Sheffield, E. Wood, B. Anderson, J.
Bradbury, A. Degaetano, T. J. Troy, and D. Wolfe, 2006. Past and Future Changes in Climate and Hydrological
Indicators in the U.S. Northeast. Climate Dynamics 28:381-407, DOI 10.1007. Online at:
www.northeastclimateimpacts.org/pdf/tech/hayhoe_et_al_climate_dynamics_2006.pdf.
Hodgkins, G. A., I. C. James II, and T. G. Huntington, 2002. Historical changes in lake ice-out dates as indicators
of climate change in New England, 1850–2000. International Journal of Climatology 22: 1819–1827.
Hodgkins, G. A., R. W. Dudley, and T. G. Huntington, 2003. Changes in the timing of high river flows in New
England over the 20th century. Journal of Hydrology 278: 244–252.
Hu, A., G.A. Meehl, W. Han, and J. Yin, 2009. Transient response of the MOC and climate to potential melting of
the Greenland Ice Sheet in the 21st century: Geophys. Res. Lett., Vol. 36.
Huntington, T. G., G. A. Hodgkins, R. W. Dudley, 2003. Historical trend in river ice thickness and coherence in
hydroclimatological trends in Maine. Climate Change 61: 217-236.
IPCC (Intergovernmental Panel on Climate Change), 2001. Climate Change 2001: The Scientific Basis.
Contribution of Working Group I to the Third Assessment Report of the Intergovernmental Panel on Climate
Change [Houghton, J. T., Y. Ding, D. J. Griggs, M. Noguer, P. J. Van der Linden, X. Dai, K. Maskell, and C. A.
Johnson (eds.)]. Cambridge University Press, Cambridge, UK, and New York, 881 pp.
IPCC (Intergovernmental Panel on Climate Change), 2007. Climate Change 2007: The Physical Science Basis.
Contribution of Working Group I to the Fourth Assessment Report of the Intergovernmental Panel on Climate
Change [Solomon, S., D. Qin, M. Manning, Z. Chen, M. Marquis, K. B. Avery, M. Tignor, and H. L. Miller (eds.)].
Cambridge University Press, Cambridge, UK, and New York, 996 pp.
Chapter 2: The Changing Climate and Its Impacts
22
Massachusetts Climate Change Adaptation Report
Jevrejeva, S., J. C. Moore, A. Grinsted, and P. L. Woodworth, 2008. Recent global sea level acceleration started
over 200 years ago? Geophys. Res. Lett., Vol. 35.
Juanes F., S. Gephard, K. F. Beland, 2004. Long-term changes in migration timing of adult Atlantic salmon
(Salmo salar) at the southern edge of the species distribution. Cdn. J. Fisheries and Aquatic Sciences 61: 2392-
2400.
Karl, T. R., J. M. Melillo, and T. C. Peterson, 2009. Global Climate Change Impacts in the United States: A state of
knowledge report from the US Global Change Research Program. New York, NY: Cambridge University Press.
Keim, B. D., M. R. Fischer, and A. M. Wilson, 2005. Are there spurious precipitation trends in the United States
Climate Division database? Geophysical Research Letters 32:L04702, DOI 10.1029/2004GL021985.
Kirshen et al., 2003. Climate‘s Long-term Impacts on Metro Boston (CLIMB study). Tufts University.
Kirshen, P., C. Watson, E. Douglas, A. Gontz, J. Lee, and Y. Tian, 2008. Coastal Flooding in the Northeastern
United States due to Climate Change. Mitigation and Adaptation Strategies for Global Change 13(5-6): 437-451.
Knutson R. T., J. L. McBride, J. Chan, K. Emanuel, G. Holland, C. Landsea, I. Held, J. P. Kossin, A. K. Srivastava,
and M. Sugi, 2010. Tropical cyclones and climate change. Nature Geoscience 3, 157–163.
Massachusetts Department of Public Health. Quick Facts about Asthma in Massachusetts.
Massachusetts Water Resources Authority, unpublished data. Summary of 591 pH measurements taken since
June 2004.
Massachusetts Water Resources Commission meeting, February 2008. Update by staff on Precipitation Normals in
Massachusetts.
Nakicenovic, N., J. Alcamo, G. Davis, B. de Vries, J. Fenhann, S. Gaffin, K. Gregory, A. Grübler, T. Y. Jung, T.
Kram, E. L. L. Rovere, L. Michaelis, S. Mori, T. Morita, W. Pepper, H. Pitcher, L. Price, K. Riahi, A. Roehrl, H.
Rogner, A. Sankovski, M. Schlesinger, P. Shukla, S. Smith, R. Swart, S. V. Rooijen, N. Victor, and Z. Dadi, 2000.
IPCC Special Report on Emissions Scenarios. Cambridge, UK and New York, NY: Cambridge University Press.
Nixon, S. W., S. Granger, B. A. Buckley, M. Lamont, and B. Rowell, 2004. A one hundred and seventeen year
coastal water temperature record from Woods Hole, Massachusetts. Estuaries: 27(3): 397-404.
National Oceanic and Atmospheric Administration, 2009: http://co-ops.nos.noaa.gov/sltrends/sltrends.shtml.
National Oceanic and Atmospheric Administration, 2010. State of the Climate Global Analysis.
http://www.ncdc.noaa.gov/sotc/?report=global.
Pew Center on Global Climate Change http://www.pewclimate.org/.
Pfeffer, W.T., J. T. Harper, and S. O'Neel, 2008. Kinematic Constraints on Glacier Contributions to 21st-Century
Sea-Level Rise: Science, Vol. 321, No. 5894, pp. 1340-1343.
Rahmstorf, S., 2007. A Semi-Empirical Approach to Projecting Future Sea-Level Rise: Science, Vol. 315, No.
5810, pp. 368-370.
Rahmstorf, S., A. Cazenave, J. A. Church, J. E. Hansen, R. F. Keeling, D. E. Parker, and R. C. J. Somerville, 2007.
Recent Climate Observations Compared to Projections: Science, Vol. 316, No. 5825, pp. 709.
State Health Facts. http://www.statehealthfacts.org/comparemaptable.jsp?cat=2&ind=87.
Stedman, S. and J. Hanson. 1997. Wetlands, Fisheries and Economics in the New England Coastal States. Habitat
Connections. National Oceanic and Atmospheric Administration, National Marine Fisheries.
Wake, C., L. Burakowski, G. Lines, K. McKenzie, and T. Huntington, 2006. Cross border indicators of climate
change over the past century: Northeastern United States and Canadian Maritime Region. The climate change
task force of the Gulf of Maine Council on the Marine Environment in cooperation with Environment Canada and
Clean Air-Cool Planet. www.gulfofmaine.org/council/publications.
World Health Organization, 2007 factsheet. http://www.who.int/mediacentre/factsheets/fs266/en/index.html.
Yin, J., M. E. Schlesinger, R. J. and Stouffer, 2009. Model projections of rapid sea-level rise on the northeast
coast of the United States: Nature Geoscience, Vol. 2, No. 4, pp. 262-266.

23
Recognizing the risks posed by climate change, the
Commonwealth of Massachusetts has and will
continue to identify and implement measures to
protect its social, economic, cultural, and natural
resources. There is broad consensus that, even with
ambitious global reduction of greenhouse gas
emissions, some level of climate change is inevitable
(IPCC, 2007). Therefore, in addition to providing
strong leadership and action on mitigation, it is
important for Massachusetts to continue a similar
commitment on climate change adaptation.
The formation of the Climate Change Adaptation
Advisory Committee by the Global Warming
Solutions Act served as an important impetus and a
forum for informed and broad-based dialogue on this
issue. Based on the Committee‘s work, this chapter
presents: (1) several key findings that articulate the
central themes and challenges of adaptation in
Massachusetts; (2) a set of principles that have
guided and should continue to guide Massachusetts‘
approach to adapting to climate change; and (3) a
series of common strategies that cut across several,
if not all, sectors.
1. FINDINGS
The following findings—based on the common
themes, challenges, opportunities, and needs
identified through the Committee process—inform all
strategies, including the cross-cutting strategies
presented later in this chapter, and can continue to
shape future climate change adaptation efforts in
Massachusetts.
Climate Change Is Already Happening and
Will Continue
Climate change is already having demonstrable
effects in Massachusetts and the region. As
described in Chapter 2, the Northeast has been
warming at a rate of nearly 0.27°C (0.5 °F) per
decade, and winter temperatures are rising at an
even faster rate of 0.72°C (1.3°F) per decade
(Frumhoff et al., 2007). These long-term warming
trends are associated with other observed changes,
including rising sea-surface temperatures and sea
levels, more frequent days with temperatures above
32°C (90°F), reduced snowpack, and earlier spring
snowmelt resulting in earlier peak streamflows.
While projected climate trends indicate that the
situation will worsen, the range in scope and
magnitude of these changes, as well as the impacts
that they will cause, will be influenced by current
and future levels of greenhouse gas emissions. Even
with aggressive policies to reduce greenhouse gas
emissions, however, efforts will be required to adapt
to climate change impacts already in play due to
past emissions.
Climate Change Impacts Are Wide Ranging
and Affect Many Sectors of Society
From greater frequency of excessively hot days to
increased flooding and habitat disruption, the
impacts of climate change have broad implications.
As an example, predicted sea level rise and the
associated increases in flooding, erosion, and salt
water intrusion into freshwater aquifers will have
adverse effects on residential and commercial
development, infrastructure and critical facilities, and
natural resources and ecosystems. These impacts, in
turn, will affect residents, landowners, private
business, industry, government, and many others.
Developing effective and efficient responses to
climate change will require high levels of
communication, coordination, collaboration, and
integration across and within all levels of
government, in close connection with private
businesses and industries, non-governmental
organizations, academic institutions, and stakeholder
groups.
The Cost of Impacts Will Be High
Impacts from climate change will be very costly.
Under the high emission scenario described by the
Intergovernmental Panel on Climate Change (IPCC,
2007), the average annual cost of climate change
impacts to the U.S. could reach 2.6 percent of the
gross domestic product by 2100 (Ackerman et al.,
2009). Lenton et al. (2009) estimate that a global
sea level rise of 20 inches (0.5 meters) by 2050
would expose $25 trillion to $28 trillion in assets to a
100-year storm event in 136 port megacities
worldwide—over $7 trillion in assets in 17 port cities
in the United States alone. Boston ranks fourth
among U.S. cities with the greatest predicted risk of
asset exposure due to sea level rise, with predicted
asset exposure from a mid-century 100-year storm
event estimated to exceed $400 billion and current
asset exposure to a 100-year storm estimated at
$77 billion (Lenton et al., 2009). Adding to that,
evacuation costs alone from sea level rise and
storms in Massachusetts may range between
Findings, Principles and Strategies 3 Chapter 3: Findings, Principles and Strategies
Massachusetts Climate Change Adaptation Report
24
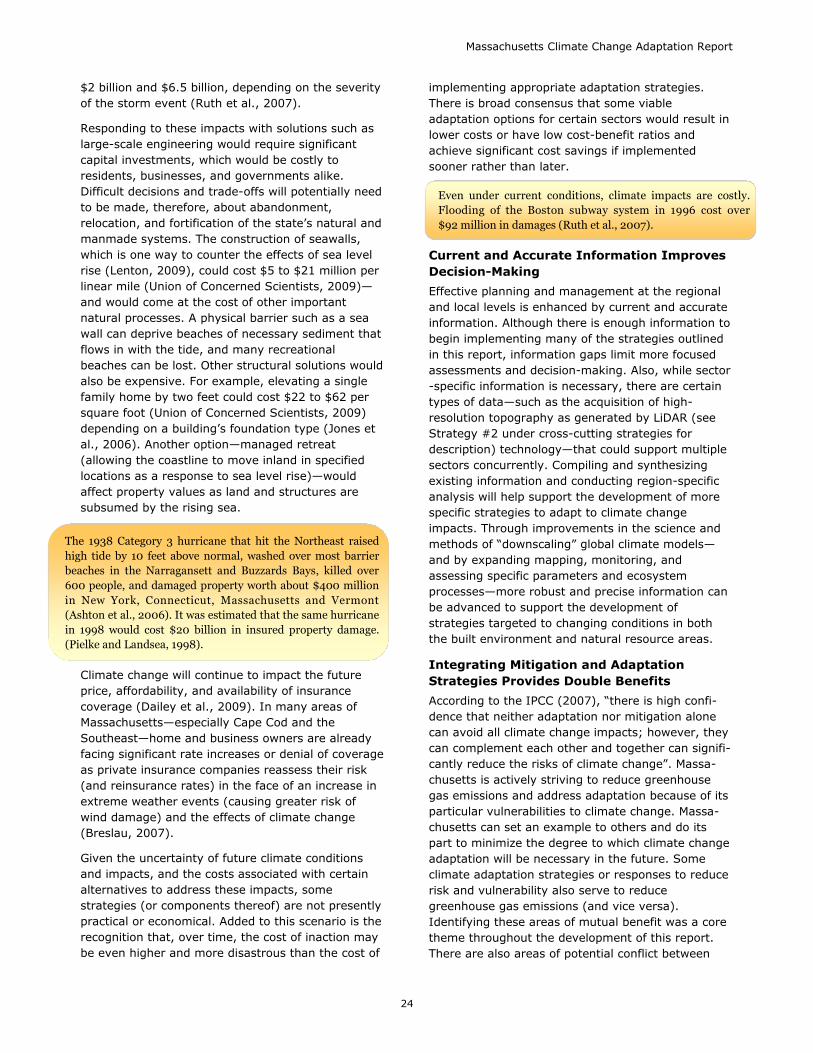
$2 billion and $6.5 billion, depending on the severity
of the storm event (Ruth et al., 2007).
Responding to these impacts with solutions such as
large-scale engineering would require significant
capital investments, which would be costly to
residents, businesses, and governments alike.
Difficult decisions and trade-offs will potentially need
to be made, therefore, about abandonment,
relocation, and fortification of the state‘s natural and
manmade systems. The construction of seawalls,
which is one way to counter the effects of sea level
rise (Lenton, 2009), could cost $5 to $21 million per
linear mile (Union of Concerned Scientists, 2009)—
and would come at the cost of other important
natural processes. A physical barrier such as a sea
wall can deprive beaches of necessary sediment that
flows in with the tide, and many recreational
beaches can be lost. Other structural solutions would
also be expensive. For example, elevating a single
family home by two feet could cost $22 to $62 per
square foot (Union of Concerned Scientists, 2009)
depending on a building‘s foundation type (Jones et
al., 2006). Another option—managed retreat
(allowing the coastline to move inland in specified
locations as a response to sea level rise)—would
affect property values as land and structures are
subsumed by the rising sea.
Climate change will continue to impact the future
price, affordability, and availability of insurance
coverage (Dailey et al., 2009). In many areas of
Massachusetts—especially Cape Cod and the
Southeast—home and business owners are already
facing significant rate increases or denial of coverage
as private insurance companies reassess their risk
(and reinsurance rates) in the face of an increase in
extreme weather events (causing greater risk of
wind damage) and the effects of climate change
(Breslau, 2007).
Given the uncertainty of future climate conditions
and impacts, and the costs associated with certain
alternatives to address these impacts, some
strategies (or components thereof) are not presently
practical or economical. Added to this scenario is the
recognition that, over time, the cost of inaction may
be even higher and more disastrous than the cost of
implementing appropriate adaptation strategies.
There is broad consensus that some viable
adaptation options for certain sectors would result in
lower costs or have low cost-benefit ratios and
achieve significant cost savings if implemented
sooner rather than later.
Current and Accurate Information Improves
Decision-Making
Effective planning and management at the regional
and local levels is enhanced by current and accurate
information. Although there is enough information to
begin implementing many of the strategies outlined
in this report, information gaps limit more focused
assessments and decision-making. Also, while sector
-specific information is necessary, there are certain
types of data—such as the acquisition of high-
resolution topography as generated by LiDAR (see
Strategy #2 under cross-cutting strategies for
description) technology—that could support multiple
sectors concurrently. Compiling and synthesizing
existing information and conducting region-specific
analysis will help support the development of more
specific strategies to adapt to climate change
impacts. Through improvements in the science and
methods of ―downscaling‖ global climate models—
and by expanding mapping, monitoring, and
assessing specific parameters and ecosystem
processes—more robust and precise information can
be advanced to support the development of
strategies targeted to changing conditions in both
the built environment and natural resource areas.
Integrating Mitigation and Adaptation
Strategies Provides Double Benefits
According to the IPCC (2007), ―there is high confi-
dence that neither adaptation nor mitigation alone
can avoid all climate change impacts; however, they
can complement each other and together can signifi-
cantly reduce the risks of climate change‖. Massa-
chusetts is actively striving to reduce greenhouse
gas emissions and address adaptation because of its
particular vulnerabilities to climate change. Massa-
chusetts can set an example to others and do its
part to minimize the degree to which climate change
adaptation will be necessary in the future. Some
climate adaptation strategies or responses to reduce
risk and vulnerability also serve to reduce
greenhouse gas emissions (and vice versa).
Identifying these areas of mutual benefit was a core
theme throughout the development of this report.
There are also areas of potential conflict between
The 1938 Category 3 hurricane that hit the Northeast raised
high tide by 10 feet above normal, washed over most barrier
beaches in the Narragansett and Buzzards Bays, killed over
600 people, and damaged property worth about $400 million
in New York, Connecticut, Massachusetts and Vermont
(Ashton et al., 2006). It was estimated that the same hurricane
in 1998 would cost $20 billion in insured property damage.
(Pielke and Landsea, 1998).
Even under current conditions, climate impacts are costly.
Flooding of the Boston subway system in 1996 cost over
$92 million in damages (Ruth et al., 2007).

25
climate change adaptation and mitigation strategies
that must be reconciled. As an example, an increase
in ambient air temperature can lead to an increase in
the use of air conditioning to provide relief during
high heat days. This in turn increases the demand
for electricity, which in Massachusetts is mainly gen-
erated through the burning of natural gas and coal.
Adaptive Management and Forward-Thinking
Goals Should Be Built into Current Actions
The science of climate change is constantly improv-
ing, as predictions are refined with new data,
research, and modeling. Addressing the challenges
posed by a changing climate can seem daunting. In-
corporating climate change into existing strategic,
management, and fiscal plans and building upon
existing efforts can, however, readily increase
adaptation capacity. The concept of ―adaptive man-
agement‖ is particularly suited to climate change
response, where planning and decisions are made
within a context of incomplete and imperfect
knowledge. Adaptive management seeks to reduce
risk and uncertainty over time through the deliberate
development of iterative and flexible approaches. It
relies on monitoring and evaluation to adjust these
approaches based on what has been learned.
Long-term choices about climate responses can be
segmented into shorter-term, more manageable
steps and decisions. By ranking and prioritizing,
leveraging resources and shared goals, and
enhancing communication, collaboration, and
partnerships, forward-thinking climate change
responses can be built into current land-use and
resource management plans, financial budgets and
capital investments, regulatory processes, and
similar implementation mechanisms.
Actions Addressing Climate Change May
Present Opportunities
The need to adapt to climate change and mitigate
the emissions of greenhouse gases could create
economic opportunities in Massachusetts. These
could include the expansion of sectors such as clean
energy, restoration and management services, the
construction industry, research and development in
an array of high tech sectors, and development of
drought- and pest-resistant crops.
2. PRINCIPLES
Each adaptation strategy will have specific elements
and considerations. However, the development and
implementation of climate change adaptation
strategies should be guided by the following core
principles.
Broad-Based Participation
The effects of climate change will be felt throughout
Massachusetts. To address these challenges
effectively, engagement of a wide array of
stakeholders is necessary. The development of this
report was informed by the active participation of
more than 200 experts, representatives, and
stakeholders, as well as input from the general
public. As efforts to increase Massachusetts‘ capacity
to adapt to climate change advance, diverse and
broad participation will continue to be essential.
Best Available Science & Technology
Significant progress has occurred over the past
decades in the scientific understanding of the earth‘s
changing climate, its causes, and its impacts. The
science and models that inform the understanding of
global and regional climate change issues are
evolving rapidly. Recognizing the value of this work,
the options and strategies being considered in
Massachusetts to adapt to climate change impacts
should be grounded in the most current and
established science and technology.
Strong Leadership
In order to prioritize and implement adaptation
strategies, strong leadership will be necessary at the
local, state, and federal levels. A national leader on
clean energy, climate and environmental issues,
Massachusetts is poised to be a pacesetter on
climate change adaptation.
Coordination of Efforts
Climate change impacts occur across a range of
issue areas. Consequently, developing effective and
efficient responses will require strong coordinated
efforts among various entities with different
mandates and interests— from the private sector, to
the state and federal agencies, cities and towns, non
-government organizations, and academic
institutions. In moving forward, current partnerships
should be fostered and new ones developed.
Assisting Vulnerable Populations
Vulnerable populations are broadly defined as those
who are more susceptible to the effects of climate
change, and for whom adaptive change will be more
difficult. Whether by virtue of economic status, social
capacity and resources, health, age, or geography,
adaptation efforts should be mindful of, and include,
planning to meet the unique needs and conditions of
people who are most vulnerable, protecting them
during sudden extreme events, and helping them
adapt to health issues, energy costs, and other
chronic impacts.
Chapter 3: Findings, Principles and Strategies

Massachusetts Climate Change Adaptation Report
26
Cost-Effective and Risk-Based Approaches
With the potential for large impacts from climate
change, the current and future benefits and costs of
various adaptation alternatives deserve careful
consideration. There is explicit recognition that,
given the uncertainty of future climate conditions,
costs of impacts, and the costs associated with
alternative responses, there may be particular
strategies (or components thereof) that are not
presently practical or economical. Investments of
resources need to be made strategically, focusing
on: climate-related impacts and their relative risks,
timing of occurrence, and uncertainties as well as
costs and cost-effectiveness of responses. Priority
should be given to strategies that have clear, robust,
and long-term benefits and significance, including
those that,
• address known risks and vulnerabilities;
• support large portions of the public over special
interests;
• promote public health, safety, security, and well-
being;
• protect particularly vulnerable populations or
those with unequal access to resources;
• build upon current programs and successes;
• protect critical habitats and key ecosystem
services; and
• provide economic growth potential.
3. CROSS-CUTTING
STRATEGIES
The technical subcommittees of the Climate Change
Adaptation Advisory Committee—which were
organized by general issue areas or ―sectors‖—made
significant progress in their review of climate change
impacts, general risks and vulnerabilities, and
possible strategies. As is evidenced by the wide-
ranging assembly of strategies for each sector in
Part II of this report, there are numerous options
and prospective pathways for improving capacity in
Massachusetts to adapt to climate change. The
following set of recommended strategies was
informed by and developed directly from the
information and ideas contained in the individual
sector-specific chapters. These cross-cutting
strategies emerged as common themes in several, if
not all, sectors and were discussed extensively at the
subcommittee and the advisory committee meetings.
Guided by the principles and informed by the
findings presented earlier in this chapter, these
strategies represent a synthesis to direct and inform
climate change adaptation efforts in Massachusetts.
Strategy #1 — Combine Mitigation
and Adaptation Strategies
The committee discussed the connection
between the state working to reduce its share of
greenhouse gas emissions as part of a global effort,
and the influence that will have on reductions in
climate change impacts. The Committee found many
strategies that would have the dual benefit of
helping a sector adapt to a changing climate while
also helping to reduce or mitigate greenhouse gas
emissions. One such strategy is the acquisition or
conservation of large forest blocks that would
minimize stressors, and provide ecosystem
resilience, while also serving as a carbon sink.
Another strategy is deploying measures such as the
implementation of Smart Growth, including ―low
impact development‖ (LID) and Leadership in Energy
and Environmental Design (LEED) building methods.
LID and LEED techniques reduce the environmental
and energy footprint of conventional residential and
commercial buildings and provide for better site-
design. With less energy, water resource, and
material demands for both construction and
operation, harmful emissions can be reduced. These
strategies will reduce operation and maintenance
costs over time, while conserving natural habitats,
providing for better localized water recharge, and
minimizing anthropogenic stress on ecosystems.
Other examples of specific strategies that address
both climate change adaptation and mitigation are
reductions in allergens and asthmogens from
decreased emissions, using tree plantings to reduce
heat island effect and reduce heating and cooling
costs, and increasing adaptive building techniques,
such as white roofs, to reduce cooling requirements
(and therefore emissions).
Strategy #2 — Identify and Fill Critical
Information Gaps
Effective adaptation efforts require up-to-date and
accurate information, models, and decision-support
tools. Addressing the key knowledge and
technological gaps to identify and predict
vulnerability of both the built environment and
natural resource areas is a high priority. Much of the
information and products currently used for land-use
and infrastructure planning, lending and investment
decisions, and resource management reflect climate
conditions from the last several decades and do not
accurately reflect current risks of inundation,
temperature change, and other climate-related
impacts. Therefore, assessing future risk and
developing strategies for adaptation poses significant
challenges. Through improvements in the science
and methods of ―downscaling‖ global climate models

27
so that they reflect Massachusetts-specific
conditions—and by expanding mapping, monitoring,
and assessments of specific parameters and
ecosystem processes—more robust and specific
information can be advanced to support the
development of strategies targeted to changing
conditions.
The use of monitoring and modeling—including
expansion, acceleration, and leveraging of existing
efforts—is essential in following climate trends and
simulating climate change scenarios. Other types of
monitoring and models will be needed to address
vulnerabilities of inland and coastal wetland resource
areas; cultural, archaeological, and historic resources
at risk; important infrastructure; and water quality
and quantity. For all kinds of monitoring, it is
important to have consistent methods, frequent
sampling and long study durations since many
climate-related phenomena are inherently variable
and more data points over longer periods will
provide a higher degree of confidence in discerning
the effects of climate change. Consideration should
also be given to providing a single entity or
clearinghouse to better support, integrate,
standardize, and disseminate these resources within
each sector, or across multiple sectors.
A common strategy among all sectors was to collect
or update information to better predict impacts from
storm-related flooding and sea level rise, such as:
• LiDAR (Light Detection and Ranging) — LiDAR is
an airborne laser sensor technology for collecting
extremely accurate elevation data. It can be
used to help predict the
impact of flooding and sea
level rise on estuarine
marshes and to identify
neighborhoods, businesses,
and infrastructure at risk from
coastal storms and sea level
rise.
• Floodplain mapping —
Maps of areas that have a 1
percent chance of flooding
during a given year (i.e., the
100-year flood) should be
updated. Massachusetts‘
regional equations used for estimating floods of
various frequencies, which are derived from
available U.S. Geological Survey streamgage
data and basin characteristics, have not been
updated in over 35 years and do not reflect
current conditions (rainfall patterns and
impervious surfaces)—much less what would
likely occur given future climate change. These
shortcomings are illustrated by the fact that
many flood damaged areas lie outside the
mapped areas at risk of a 100-year flood. In
fact, according to the Federal Emergency
Management Agency (FEMA), as many as 30
percent of flood damage claims lie outside these
areas. It is recommended that various funding
sources be pursued vigorously and more flexible
and relevant formats for floodplain mapping be
discussed with FEMA. Updating the flood maps to
reflect current conditions is a first step toward
developing maps that can also incorporate
predictions of future conditions.
• Rainfall Intensity — It is recommended that the
―design storms‖ (i.e., what qualifies as a 100-
year storm or a 50-year storm) for
Massachusetts be updated to reflect current
conditions and those precipitation conditions
predicted for the future. Transportation and
environmental agencies and many local planning
boards rely on the precipitation return
frequencies derived by the National Weather
Service in 1961, 1964, and 1977. Precipitation
return frequencies are used in designing
stormwater controls to attenuate the peak rate
of runoff from land development and in sizing
culverts. Local culverts are likely undersized,
which can potentially cause culvert failure and
damage due to flooding. This could get worse
over time as rainfall intensity increases with
climate change.
Strategy #3 — Advance Risk and
Vulnerability Assessments
Risk and vulnerability assessments are used to
determine the susceptibility and exposure of groups
or communities of people, physical structures and
assets, natural resources and the environment,
economic conditions, and other resources and
interests to changing climate conditions and
associated impacts. These assessments can be
conducted for various purposes, at different scales,
for a range of subjects, and with a range of
techniques. While the areas of interest and
approaches may vary, these assessments all share
the primary goal of quantifying and qualifying levels
of risk and vulnerability.
This report provides an initial outline of some of the
risks and vulnerabilities for general sectors. These
overviews of vulnerability are useful starting points,
but in some cases, more complete and detailed
assessments are required to generate the necessary
materials, information, and tools to support the
development, prioritization, and implementation of
targeted and robust—yet flexible—climate change
adaptation plans and strategies.
Chapter 3: Findings, Principles and Strategies
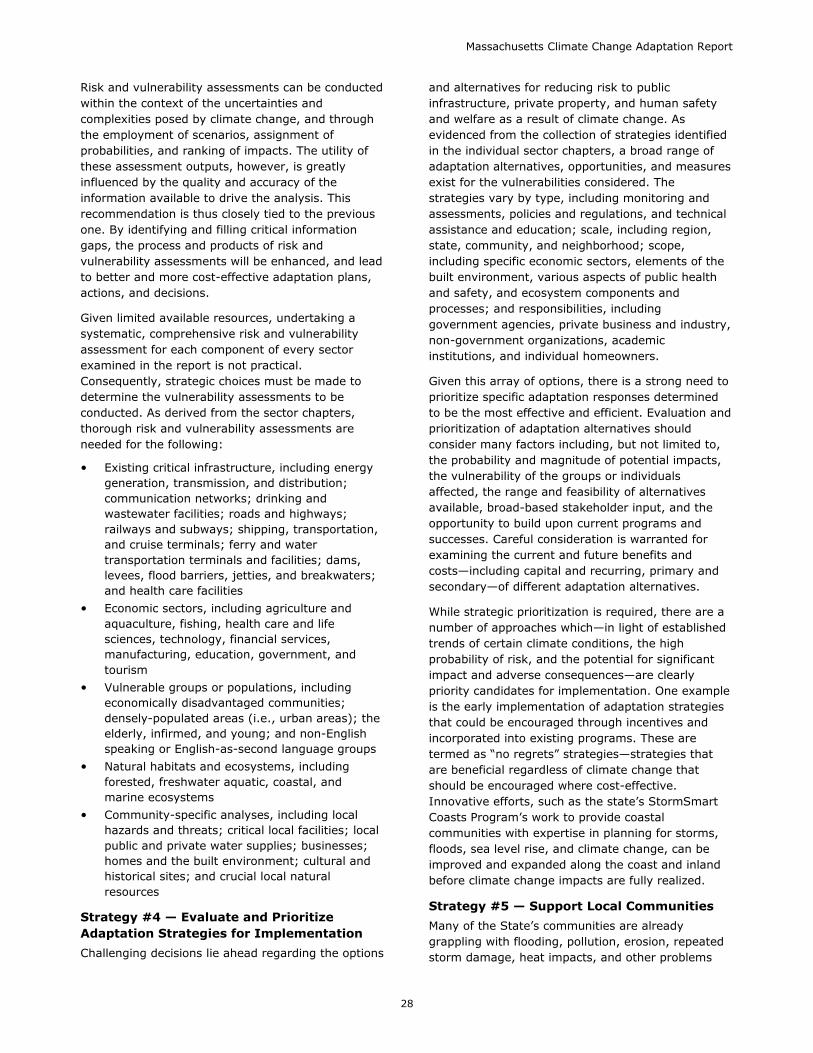
Massachusetts Climate Change Adaptation Report
28
Risk and vulnerability assessments can be conducted
within the context of the uncertainties and
complexities posed by climate change, and through
the employment of scenarios, assignment of
probabilities, and ranking of impacts. The utility of
these assessment outputs, however, is greatly
influenced by the quality and accuracy of the
information available to drive the analysis. This
recommendation is thus closely tied to the previous
one. By identifying and filling critical information
gaps, the process and products of risk and
vulnerability assessments will be enhanced, and lead
to better and more cost-effective adaptation plans,
actions, and decisions.
Given limited available resources, undertaking a
systematic, comprehensive risk and vulnerability
assessment for each component of every sector
examined in the report is not practical.
Consequently, strategic choices must be made to
determine the vulnerability assessments to be
conducted. As derived from the sector chapters,
thorough risk and vulnerability assessments are
needed for the following:
• Existing critical infrastructure, including energy
generation, transmission, and distribution;
communication networks; drinking and
wastewater facilities; roads and highways;
railways and subways; shipping, transportation,
and cruise terminals; ferry and water
transportation terminals and facilities; dams,
levees, flood barriers, jetties, and breakwaters;
and health care facilities
• Economic sectors, including agriculture and
aquaculture, fishing, health care and life
sciences, technology, financial services,
manufacturing, education, government, and
tourism
• Vulnerable groups or populations, including
economically disadvantaged communities;
densely-populated areas (i.e., urban areas); the
elderly, infirmed, and young; and non-English
speaking or English-as-second language groups
• Natural habitats and ecosystems, including
forested, freshwater aquatic, coastal, and
marine ecosystems
• Community-specific analyses, including local
hazards and threats; critical local facilities; local
public and private water supplies; businesses;
homes and the built environment; cultural and
historical sites; and crucial local natural
resources
Strategy #4 — Evaluate and Prioritize
Adaptation Strategies for Implementation
Challenging decisions lie ahead regarding the options
and alternatives for reducing risk to public
infrastructure, private property, and human safety
and welfare as a result of climate change. As
evidenced from the collection of strategies identified
in the individual sector chapters, a broad range of
adaptation alternatives, opportunities, and measures
exist for the vulnerabilities considered. The
strategies vary by type, including monitoring and
assessments, policies and regulations, and technical
assistance and education; scale, including region,
state, community, and neighborhood; scope,
including specific economic sectors, elements of the
built environment, various aspects of public health
and safety, and ecosystem components and
processes; and responsibilities, including
government agencies, private business and industry,
non-government organizations, academic
institutions, and individual homeowners.
Given this array of options, there is a strong need to
prioritize specific adaptation responses determined
to be the most effective and efficient. Evaluation and
prioritization of adaptation alternatives should
consider many factors including, but not limited to,
the probability and magnitude of potential impacts,
the vulnerability of the groups or individuals
affected, the range and feasibility of alternatives
available, broad-based stakeholder input, and the
opportunity to build upon current programs and
successes. Careful consideration is warranted for
examining the current and future benefits and
costs—including capital and recurring, primary and
secondary—of different adaptation alternatives.
While strategic prioritization is required, there are a
number of approaches which—in light of established
trends of certain climate conditions, the high
probability of risk, and the potential for significant
impact and adverse consequences—are clearly
priority candidates for implementation. One example
is the early implementation of adaptation strategies
that could be encouraged through incentives and
incorporated into existing programs. These are
termed as ―no regrets‖ strategies—strategies that
are beneficial regardless of climate change that
should be encouraged where cost-effective.
Innovative efforts, such as the state‘s StormSmart
Coasts Program‘s work to provide coastal
communities with expertise in planning for storms,
floods, sea level rise, and climate change, can be
improved and expanded along the coast and inland
before climate change impacts are fully realized.
Strategy #5 — Support Local Communities
Many of the State‘s communities are already
grappling with flooding, pollution, erosion, repeated
storm damage, heat impacts, and other problems

29
likely to be exacerbated by climate change. As a
home-rule state, many of the land-use decisions in
Massachusetts are made by cities and towns.
Managers of key assets such as water supply
infrastructure or local public safety resources may
not have the technical capacity or the resources to
plan for climate change. Consequently, to be
successful, adaptation strategies must be connected
with and directly support vulnerable communities.
Addressing some of these challenges at the local
level will require assistance—both, technical and
financial—from state and federal governments,
regional planning agencies, professional trade
organizations, and non-profit partners. This
assistance can help to ensure that revised operating
procedures, best practices for analyzing risk,
guidance for implementing adaptation measures, and
updated design standards for new facilities are
readily accessible to local government and
businesses.
Communities can also learn from one another, as
some already have experiences with climate change
adaptation strategies to share. Adaptation support
must also extend to key businesses and industries
such as local employers and vital, but vulnerable,
trades such as fishing and agriculture. Building upon
current programs that have demonstrated successes
and efficiencies, such as the Massachusetts Office of
Coastal Zone Management‘s StormSmart Coasts
Program (see Chapter 8 for more details) and the
ICLEI (International Council for Local Environmental
Initiatives)—Local Government for Sustainability
network, will be important. In addition to technical
and planning support, financial assistance to aid
communities in their efforts to implement sound
climate change adaptation strategies will be critical.
Strategy #6 — Improve Planning and Land
Use Practices
With increasing climate change impacts, particularly
those related to coastal and riverine flooding, society
will be faced with difficult decisions regarding risk to
public infrastructure, private property, natural
resources, and human safety and welfare. Criteria,
priorities, and policies are needed to help better
inform where protection of infrastructure and other
investments are necessary. In order to help fortify
existing structures and minimize and prevent
exposure, sound land use decisions should be
promoted through technical support to local
communities on consistent and effective land-use
standards and guidelines, model bylaws, and state
permitting processes. (See Chapter 7 for more
details on land use and planning.) The Department
of Fish and Game‘s BioMap2, provides a proactive
decision support tool to inform both conservation of
resilient ecosystems and areas better suited for
development.
Strategy #7 — Enhance Emergency
Preparedness
Hazard mitigation, evacuation, and emergency
response plans should be evaluated and updated to
reflect changing climate conditions and new
development. In general, emergency preparedness
resources have evolved in response to past
emergencies and storm events. The scope,
magnitude, and frequency of historic emergencies
have served as the basis for the design and
development of the existing emergency
preparedness infrastructure. As storms become more
frequent and intense and sea level rises, new and
increased levels of exposure may arise, and many
areas that previously escaped storm impacts will
likely be vulnerable.
Managers should assess and enhance emergency
management tools and capabilities in order to
respond to the predicted increased frequency and
intensity of extreme weather events. These tools
include the State Risk Assessment Inventory, the
State Comprehensive Emergency Management Plan,
the State Hazard Mitigation Plan, mapping and
information systems, and other emergency
management tools. (See Chapter 7 for more details.)
Strategy #8 — Encourage Ecosystem-Based
Adaptation
Natural ecosystems provide resilience and reduce the
vulnerability of the natural and built environments.
Protecting resilient ecosystems also increases their
ability to thrive, and strengthens the services they
support. Using natural habitats as ―green‖
infrastructure can help impede and potentially
eliminate the risk posed by some climate change
impacts while supporting crucial biota, enhancing
quality of life, and serving as a carbon sink.
ICLEI—Local Government for Sustainability
Since the early 1990s, ICLEI has led an international member
network to advance climate protection and sustainability.
Member communities bring experience, leadership, and the
ability to create solutions to a global problem while advancing
measures at the local level. The ICLEI network includes 38
Massachusetts communities who represent coastal regions
from Boston Harbor and Nantucket to areas inland, such as
Amherst and Pittsfield, and communities in between. This
expanding network of local governments from across the state
can share successes and challenges and create resilient
communities together with the larger ICLEI network.
Chapter 3: Findings, Principles and Strategies
Massachusetts Climate Change Adaptation Report
30
Strategy #9 — Continue to Seek Expert
Advice and Stakeholder Input
Continued efforts should also be made to ensure
broad-based expert and stakeholder input. Means to
engage representatives, stakeholders, and the
general public should include enhanced
communication efforts, formal and informal public
hearings, issue-based meetings with broad partners
and interests, enhanced state agency presence in
local communities, and advisory groups convened for
deliberation on specific research topics and policy
change proposals.
Strategy #10 — Ensure Agency and Regional
Coordination
There is a need for strong communication, coordina-
tion, and integration across various state agencies.
Massachusetts should explore options for policy and
implementation coordination across executive
agencies, state and local authorities.
Climate change adaptation also needs to be
addressed nationally and regionally in the Northeast.
Collaboration on adaptation within and across state
and federal boundaries is essential to ensure
coordinated data collection and modeling activities,
thereby reducing costs and minimizing duplication.
Collaboration is also essential to performing multi-
state assessments, planning for shared natural and
infrastructure resources, and to allowing climate
adaptation planners to learn and build from each
other‘s successes and challenges.
Massachusetts is actively participating in multi-state
and regional coordination and collaboration efforts
on climate change adaptation. The 2008 New Eng-
land Governor‘s Conference Resolution 32-5 entitled
‗Resolution Concerning Climate Change and Adapta-
tion‘ recognized the importance of needing to adapt
to climate change, and committed the New England
Governors and Eastern Canadian Premiers to share
data and information on vulnerable areas, and coor-
dinate decision-making and planning processes to
optimize regional adaptation and mitigation strate-
gies. The Northeast States for Coordinated Air Use
Management (NESCAUM) is actively facilitating a
multi-agency coordination effort to discuss adapta-
tion efforts occurring at state and federal agencies in
the Northeast and assess the need for regional
collaboration between these efforts. The goal of this
group is to provide a mechanism for coordination,
communication, and work across sectors and states,
and to develop a framework for the Northeast to
address adaptation to climate change.
Going forward, Massachusetts should continue to
actively participate in on-going regional collaboration
efforts, share this report with regional partners,
collaboratively pursue federal funding for adaptation
efforts in all the New England and northeastern
states, participate in regional efforts to create an
online clearinghouse for climate change adaptation
information, work with other states to address
specific issues that cross political boundaries, foster
academic collaboration, and reach out to other
organizations for inclusion in future information
sharing and collaborative planning for the Northeast.
Strategy #11 — Promote Communication and
Outreach
Because climate change adaptation is complex, it is
imperative that targeted communication efforts are
in place to inform local officials, the private sector,
and citizens of the potential risks and consequences
of a changing climate. An ongoing strategy should be
the training and skill-building of decision-makers and
environmental planners to promote fluency on
climate change adaptation sufficient to initiate and
perpetuate action. For this, an assessment of the
current knowledge, perceptions, skills, and intentions
of these constituents should be conducted so that
communication is appropriately focused.
Strategy #12 — Start Now, Be Bold
Enough is known about climate change science and
its impacts to start to address it now. Earlier action
is often cheaper and could help prevent predicted
future impacts to key infrastructure resources, public
health, natural systems, and the economy.
4. MOVING FORWARD
This report presents a first step toward the
identification, development, and implementation of
strategies that will advance the State‘s ability to
adapt more effectively and efficiently to a changing
climate. Significant challenges remain, and there is
much work to be done. Under the leadership of the
legislative and executive branches, and with the
assistance and collaboration afforded by a broad
range of partners—cities and towns, non-
government organizations, academic institutions,
private businesses, and stakeholder groups and
individuals, Massachusetts can strategically position
itself to maximize opportunities and address threats.
With the submittal of this report to the Legislature,
the statutory obligations of the Committee are
complete. The Committee now urges the Secretary
of Energy and Environmental Affairs to consider the
committee‘s recommendations and find opportunities
for action—immediately, in the short run, and the
long-term—and to consider how to maintain public,
expert, and stakeholder input into the ongoing
challenge of adapting to climate change in
Massachusetts.

31
REFERENCES
Ackerman, F., E. A. Stanton, C. Hope, and S. Alberth, 2009. Did the Stern Review Underestimate US and Global
Climate Damages? Energy Policy 37: 2717-2721.
Ashton, A., J. Donnelly, and R. Evans, 2006. A discussion of the potential impacts of climate change on the
shorelines of the northeastern United States of America. Northeast Climate Impacts Assessment, Union of
Concerned Scientists.
Breslau, K., 2007. The insurance climate change: Coastal homeowners in the East are losing their policies or
watching premiums skyrocket. Carriers say that global warming is to blame. Newsweek, January 29. Online at
http://www.newsweek.com/id/70119. Last accessed 01/27/10.
Dailey, P., M. Huddleston, S. Brown, and D. Fasking, 2009. The Financial Risks of Climate Change: Examining the
financial implications of climate change using climate models and insurance catastrophe risk models. ABI
Research Paper #19; Report by AIR Worldwide Corp. and the Met Office.
Eastern Research Group, 2010. Cost-Effective Greenhouse Gas Mitigation in Massachusetts: An Analysis of 2020
Potential. Draft Report. Prepared with Synapse Energy Economics, Inc., Cambridge Systematics, Inc., Abt
Associates, Inc., Stockholm Environment Institute—U.S.
Frumhoff, P. C., J. J. McCarthy, J. M. Melillo, S. C. Moser, and D. J. Wuebbles, 2007. Confronting Climate Change
in the U.S. Northeast: Science, Impacts, and Solutions. Synthesis report of the Northeast Climate Impacts
Assessment. Cambridge, MA: Union of Concerned Scientists.
Hayhoe, K., C. P. Wake, T. G. Huntington, L. Luo, M. D. Schwartz, J. Sheffield, E. Wood, B. Anderson, J.
Bradbury, A. Degaetano, T. J. Troy, and D. Wolfe, 2006. Past and Future Changes in Climate and Hydrological
Indicators in the U.S. Northeast. Climate Dynamics 28:381-407, DOI 10.1007. Online at:
www.northeastclimateimpacts.org/pdf/tech/hayhoe_et_al_climate_dynamics_2006.pdf.
IPCC (Intergovernmental Panel on Climate Change), 2007. Climate Change 2007: The Physical Science Basis.
Contribution of Working Group I to the Fourth Assessment Report of the Intergovernmental Panel on Climate
Change [Solomon, S., D. Qin, M. Manning, Z. Chen, M. Marquis, K. B. Avery, M. Tignor, and H. L. Miller (eds.)].
Cambridge University Press, Cambridge, UK, and New York, 996 pp.
Jones, C. P., W. L. Coulbourne, J. Marshall, and S. M. Rogers Jr., 2006. Evaluation of the National Flood Insurance
Program‘s Building Standards. American Institutes for Research: Washington, DC.
Lenton, T., A. Footitt, and A. Dlugolecki. Major Tipping Points in the Earth‘s Climate System and Consequences for
the Insurance Sector, 2009. World Wide Fund for Nature, Gland, Switzerland and Allianz SE, Munich, Germany.
http://knowledge.allianz.com/climate_tipping_points_en.html.
Nakicenovic N., J. Alcamo, G. Davis, B. de Vries, J. Fenhann, S. Gaffin, K. Gregory, A. Grübler, T. Y. Jung, T.
Kram, E. L. L. Rovere, L. Michaelis, S. Mori, T. Morita, W. Pepper, H. Pitcher, L. Price, K. Riahi, A. Roehrl, H.
Rogner, A. Sankovski, M. Schlesinger, P. Shukla, S. Smith, R. Swart, S. V. Rooijen, N. Victor, and Z. Dadi, 2000.
IPCC Special Report on Emissions Scenarios. Cambridge, UK and New York, NY: Cambridge University Press.
National Oceanic and Atmospheric Administration, 2009. http://co-ops.nos.noaa.gov/sltrends/sltrends.shtml.
Pielke, R. A., and C. W. Landsea, 1998. Normalized hurricane damages in the United States: 1925-95. Weather
and Forecasting 13:621-631.
Ruth, M., D. Coelho, and D. Karetnikov, 2007. The US Economic Impacts of Climate Change and the Costs of
Inaction. University of Maryland: Center for Integrative Environmental Research.
Union of Concerned Scientists, 2009. Climate Change in the United States. The Prohibitive Costs of Inaction.
Chapter 3: Findings, Principles and Strategies
Top Related