


Languages
Pages
Legal


TTI: 9-1002
MASH TEST 3-11 OF THE TxDOT SINGLE SLOPE BRIDGE RAIL (TYPE SSTR) ON
PAN-FORMED BRIDGE DECK
Research/Test Report 9-1002-3 Cooperative Research Program
in cooperation with the Federal Highway Administration and the
Texas Department of Transportation http://tti.tamu.edu/documents/9-1002-3.pdf
TEXAS TRANSPORTATION INSTITUTE THE TEXAS A&M UNIVERSITY SYSTEM
COLLEGE STATION, TEXAS
TEXAS DEPARTMENT OF TRANSPORTATION
ISO 17025 Laboratory
Testing Certificate # 2821.01
Crash testing performed at: TTI Proving Ground 3100 SH 47, Building 7091 Bryan, TX 77807


Technical Report Documentation Page 1. Report No. FHWA/TX-11/9-1002-3
2. Government Accession No.
3. Recipient's Catalog No.
4. Title and Subtitle MASH TEST 3-11 OF THE TXDOT SINGLE SLOPE BRIDGE RAIL (TYPE SSTR) ON PAN-FORMED BRIDGE DECK
5. Report Date November 2010 Published: March 2011 6. Performing Organization Code
7. Author(s) William F. Williams, Roger P. Bligh, and Wanda L. Menges
8. Performing Organization Report No. Report 9-1002-3
9. Performing Organization Name and Address Texas Transportation Institute Proving Ground The Texas A&M University System College Station, Texas 77843-3135
10. Work Unit No. (TRAIS) 11. Contract or Grant No. Project 9-1002
12. Sponsoring Agency Name and Address Texas Department of Transportation Research and Technology Implementation Office P.O. Box 5080 Austin, Texas 78763-5080
13. Type of Report and Period Covered Technical Report: September 2009–August 2010 14. Sponsoring Agency Code
15. Supplementary Notes Project performed in cooperation with the Texas Department of Transportation and the Federal Highway Administration. Project Title: Roadside Safety Device Crash Testing Program URL: http://tti.tamu.edu/documents/9-1002-3.pdf 16. Abstract The objective of this crash test was to determine whether the TxDOT Single Slope Traffic Rail (Type SSTR) would perform acceptably on a pan-formed deck when tested according to the guidelines set forth in Manual for Assessing Safety Hardware (MASH). The crash test performed was MASH test 3-11 involving a 2270P vehicle (5000-lb pickup truck) impacting the critical impact point (CIP) of the bridge rail at an impact speed and angle of 62 mi/h and 25 degrees, respectively. This report presents the details of the TxDOT Type SSTR on pan-formed bridge deck, description of the crash test performed, an assessment of the test results, and the implementation plan. The TxDOT Type SSTR bridge rail on pan-formed deck performed acceptably for MASH test 3-11. 17. Key Words Bridge Rail, Roadside Safety, Crash Test, MASH
18. Distribution Statement No restrictions. This document is available to the public through NTIS: National Technical Information Service Springfield, Virginia 22161 http://www.ntis.gov
19. Security Classif.(of this report) Unclassified
20. Security Classif.(of this page) Unclassified
21. No. of Pages 62
22. Price
Form DOT F 1700.7 (8-72) Reproduction of completed page authorized


MASH TEST 3-11 OF THE TXDOT SINGLE SLOPE BRIDGE RAIL (TYPE SSTR)
ON PAN-FORMED BRIDGE DECK
by
William F. Williams, P.E. Assistant Research Engineer
Texas Transportation Institute
Roger P. Bligh, P.E. Research Engineer
Texas Transportation Institute
and
Wanda L. Menges Associate Research Specialist Texas Transportation Institute
Report 9-1002-3 Project 9-1002
Project Title: Roadside Safety Device Crash Testing Program
Performed in cooperation with the Texas Department of Transportation
and the Federal Highway Administration
November 2010 Published: March 2011
TEXAS TRANSPORTATION INSTITUTE The Texas A&M University System College Station, Texas 77843-3135


v
DISCLAIMER
This research was performed in cooperation with the Texas Department of Transportation (TxDOT) and the Federal Highway Administration (FHWA). The contents of this report reflect the views of the authors, who are responsible for the facts and the accuracy of the data presented herein. The contents do not necessarily reflect the official view or policies of the FHWA or TxDOT. This report does not constitute a standard, specification, or regulation, and its contents are not intended for construction, bidding, or permit purposes. In addition, the above listed agencies assume no liability for its contents or use thereof. The United States Government and the State of Texas do not endorse products or manufacturers. Trade or manufacturers’ names appear herein solely because they are considered essential to the object of this report. The engineer in charge of the project was Roger P. Bligh, P.E. (Texas, #78550).
TTI PROVING GROUND DISCLAIMER
The results of the crash testing reported herein apply only to the article being tested.
_______________________________________ Wanda L. Menges, Research Specialist
Deputy Quality Manager
_______________________________________ Richard A. Zimmer, Senior Research Specialist
Test Facility Manager Quality Manager
Technical Manager
ISO 17025 Laboratory
Testing Certificate # 2821.01
Crash testing performed at: TTI Proving Ground 3100 SH 47, Building 7091 Bryan, TX 77807

vi
ACKNOWLEDGMENTS
This research project was conducted under a cooperative program between the Texas Transportation Institute, the Texas Department of Transportation, and the Federal Highway Administration. The TxDOT project director for this research was Rory Meza, P.E. with the Design Division. John Holt, P.E., and Jon Reis with the Bridge Division served as project advisors and helped guide this research. The TxDOT research engineer was Wade Odell, P.E. with the Research and Technology Implementation Office. The authors acknowledge and appreciate their guidance and assistance.

vii
TABLE OF CONTENTS
Page LIST OF FIGURES ....................................................................................................................... ix LIST OF TABLES .......................................................................................................................... x CHAPTER 1. INTRODUCTION .................................................................................................. 1
1.1 INTRODUCTION .......................................................................................................... 1 1.2 BACKGROUND ............................................................................................................ 1 1.3 OBJECTIVES/SCOPE OF RESEARCH ....................................................................... 1
CHAPTER 2. SYSTEM DETAILS ............................................................................................... 3
2.1 TEST ARTICLE DESIGN AND CONSTRUCTION .................................................... 3 2.2 MATERIAL SPECIFICATIONS ................................................................................... 4
CHAPTER 3. TEST REQUIREMENTS AND EVALUATION CRITERIA ............................... 7
3.1 CRASH TEST MATRIX ................................................................................................ 7 3.2 EVALUATION CRITERIA ........................................................................................... 7
CHAPTER 4. CRASH TEST PROCEDURES ............................................................................. 9
4.1 TEST FACILITY ............................................................................................................ 9 4.2 VEHICLE TOW AND GUIDANCE PROCEDURES ................................................... 9 4.3 DATA ACQUISITION SYSTEMS ................................................................................ 9
4.3.1 Vehicle Instrumentation and Data Processing ............................................................ 9 4.3.2 Anthropomorphic Dummy Instrumentation ............................................................. 10 4.3.3 Photographic Instrumentation and Data Processing ................................................. 10
CHAPTER 5. CRASH TEST RESULTS .................................................................................... 11
5.1 TEST DESIGNATION AND ACTUAL IMPACT CONDITIONS ............................ 11 5.2 TEST VEHICLE ........................................................................................................... 11 5.3 WEATHER CONDITIONS.......................................................................................... 11 5.4 TEST DESCRIPTION .................................................................................................. 11 5.5 DAMAGE TO TEST INSTALLATION ...................................................................... 14 5.6 VEHICLE DAMAGE ................................................................................................... 14 5.7 OCCUPANT RISK FACTORS .................................................................................... 14
CHAPTER 6. SUMMARY AND CONCLUSIONS .................................................................... 21
6.1 ASSESSMENT OF TEST RESULTS .......................................................................... 21 6.1.1 Structural Adequacy .................................................................................................. 21 6.1.2 Occupant Risk ........................................................................................................... 21 6.1.3 Vehicle Trajectory .................................................................................................... 22
6.2 CONCLUSIONS........................................................................................................... 22 CHAPTER 7. IMPLEMENTATION STATEMENT ................................................................... 25

viii
TABLE OF CONTENTS (CONTINUED)
Page REFERENCES ............................................................................................................................. 27 APPENDIX A. DETAILS OF THE TEST ARTICLE ................................................................ 29 APPENDIX B. CERTIFICATION DOCUMENTATION .......................................................... 35 APPENDIX C. TEST VEHICLE PROPERTIES AND INFORMATION ................................. 41 APPENDIX D. SEQUENTIAL PHOTOGRAPHS ..................................................................... 45 APPENDIX E. VEHICLE ANGULAR DISPLACEMENTS AND ACCELERATIONS ......... 49

ix
LIST OF FIGURES Figure Page Figure 2.1. Details of the TxDOT Pan-Formed Bridge Rail Installation. .................................... 5 Figure 2.2. TxDOT Pan-Formed Bridge Rail Installation Before Test No. 420020-3. ................ 6 Figure 5.1. Vehicle/Installation Geometrics for Test No. 420020-3. ......................................... 12 Figure 5.2. Vehicle Before Test No. 420020-3. ......................................................................... 13 Figure 5.3. After Impact Vehicle Position for Test No. 420020-3. ............................................ 15 Figure 5.4. Installation After Test No. 420020-3. ...................................................................... 16 Figure 5.5. Vehicle After Test No. 420020-3. ............................................................................ 17 Figure 5.6. Interior of Vehicle for Test No. 420020-3. .............................................................. 18 Figure 5.7. Summary of Results for MASH Test 3-11 on the TxDOT Pan-Form
Bridge Rail. .............................................................................................................. 19 Figure C1. Vehicle Properties for Test No. 420020-3. .............................................................. 41 Figure D1. Sequential Photographs for Test No. 420020-3 (Overhead and Frontal Views). .... 45 Figure D2. Sequential Photographs for Test No. 420020-3 (Rear View). ................................. 47 Figure E1. Vehicle Angular Displacements for Test No. 420020-3. ......................................... 49 Figure E2. Vehicle Longitudinal Accelerometer Trace for Test No. 420020-3
(Accelerometer Located at Center of Gravity). ....................................................... 50 Figure E3. Vehicle Lateral Accelerometer Trace for Test No. 420020-3
(Accelerometer Located at Center of Gravity). ....................................................... 51 Figure E4. Vehicle Vertical Accelerometer Trace for Test No. 420020-3
(Accelerometer Located at Center of Gravity). ....................................................... 52

x
LIST OF TABLES Table Page Table 6.1. Performance Evaluation Summary for MASH Test 3-11 on the TxDOT
Pan-Form Bridge Rail. ............................................................................................. 23 Table C1. Exterior Crush Measurements for Test No. 420020-3. ............................................ 42 Table C2. Occupant Compartment Measurements for Test No. 420020-3. ............................. 43

1
CHAPTER 1. INTRODUCTION 1.1 INTRODUCTION This project was set up to provide Texas Department of Transportation (TxDOT) with a mechanism to quickly and effectively evaluate high priority issues related to roadside safety devices. Roadside safety devices shield motorists from roadside hazards such as non-traversable terrain and fixed objects. To maintain the desired level of safety for the motoring public, these safety devices must be designed to accommodate a variety of site conditions, placement locations, and a changing vehicle fleet. As changes are made or in-service problems encountered, there is a need to assess the compliance of existing safety devices with current vehicle testing criteria and, if problems are identified, to modify the device or develop a new device with enhanced performance and maintenance characteristics. 1.2 BACKGROUND Pan form girders with bridge decks were developed in the late 1940s in anticipation of a need for low cost bridges in rural areas in Texas that were soon to be funded by the federal government. The terminology depicts the modular steel forms required for cast-in-place reinforced concrete spans. When assembled, bolted together and supported from bent caps, a metal pan is used to form the concrete and support the weight in flexure without intermediate support. Forms and falsework are combined in a sturdy reuseable package. The original span length was 30 ft for 20-inch wide caps and no skew. It was soon discovered that trestle piling would seldom fit inside a 20-inch wide cap. The cap width was changed to 24 inches and, since the distance face to face of caps had to remain the same to allow form removal, the basic span length became 30 ft-4 inches. In 1956, a design was introduced for 40-ft spans to be constructed on a skew. In the 1960s, standard drawings were distributed for superstructure and substructure for different combinations or span ranges, roadway widths, and skew angles. Prior to the use of prestressed concrete beams, pan form girders were the most economical method for constructing a highway bridge over small to moderate streams. By 1988, approximately 3750 pan form girder bridges had been constructed on the Texas highway system. Many of these bridges are presently still in use. 1.3 OBJECTIVES/SCOPE OF RESEARCH The objective of this crash test was to determine if the TxDOT Type SSTR bridge rail retrofitted on a pan-formed bridge deck would perform acceptably according to the guidelines set forth in American Association of State Highway and Transportation Officials (AASHTO) Manual for Assessing Safety Hardware (MASH) (1). The crash test performed was MASH test 3-11 involving a 2270P vehicle (5000-lb pickup truck) impacting the critical impact point (CIP) of the bridge rail at an impact speed and angle of 62 mi/h and 25 degrees, respectively.

2
This report presents the details of the TxDOT SSTR bridge rail retrofitted on a typical pan-formed bridge deck installation, description of the crash test performed, an assessment of the test results, and the implementation plan.

3
CHAPTER 2. SYSTEM DETAILS 2.1 TEST ARTICLE DESIGN AND CONSTRUCTION
The TxDOT Single-Slope Traffic Rail (Type SSTR) bridge rail was anchored to the top of a 6-inch thick reinforced concrete deck cantilever. The TxDOT Type SSTR bridge rail is 36 inches in height and has a single sloped traffic face. The bridge rail is 13 inches wide at the base and 7½ inches wide at the top. The traffic face of the bridge rail is sloped 7 inches over the 36-inch height of the bridge rail. Reinforcement in the bridge rail consisted of pre-fabricated deformed welded wire (WWR) provided by Insteel Industries, Inc., Mount Airy, North Carolina. The welded wire mesh consisted of 31 ft preformed units with all unions of longitudinal and vertical wires welded. TTI received a drawing from Insteel Industries, Inc. entitled “SSTR Bridge Rail Texas DOT,” (Insteel Drawing No. 09-DS-99) and dated May 22, 2009. This drawing provided fabrication details for the welded wire reinforcement used in the TxDOT Type SSTR bridge rail tested for this project. Longitudinal reinforcement between the preformed units was lapped approximately 12 inches. The specified yield strength of the deformed wire used to fabricate the panels was specified to be 70 ksi steel material.
The TxDOT Type SSTR bridge rail was anchored to the 6-inch thick deck using 1-inch
diameter ASTM F1554 Grade 55 galvanized anchor bolts 24 inches in length near the traffic side face of the bridge rail. The bolts were anchored through the deck in 1¼-inch diameter core drilled holes. The anchor bolts were located approximately 11 inches from the edge of the deck and were fabricated with a 15-degree bend. This bend helped accommodate approximately 15 inches of anchorage embedment within the deformed welded wire reinforcement of the TxDOT Type SSTR bridge rail. The bridge rail was additionally anchored to the deck using #4 dowels spaced on 48-inch centers 4½ inches from the edge of the deck and approximately 4 inches into the deck using the Hilti RE 500 Epoxy anchoring system. The length of these #4 dowels was approximately 16 inches.
A 6-inch thick by 21¼ inches wide deck cantilever was constructed for this project. Reinforcement in the deck cantilever consisted of one layer of steel reinforcement. Transverse reinforcement consisted of #4 bars located on 6-inch centers. One longitudinal #4 bar was placed within the deck approximately 1¾ inch from the field side edge of the deck.
The test installation for this project measured approximately 75 ft-¾ inch in length. The installation was constructed with a ¾-inch wide expansion joint in both the TxDOT Type SSTR bridge rail and 6-inch thick deck. This joint in the bridge rail and deck was located approximately 32 ft from the upstream end of the installation. Two #8 deformed bars, approximately 60 inches in length, were used to provide additional lateral strength to the two opposing ends of the bridge rail at the joint. The #8 bars were anchored approximately 31¾ inches within one end of the TxDOT Type SSTR bridge rail at the joint. On the adjacent bridge rail end, these dowels extended through the joint and were placed in sleeved PVC pipe sections. These pipe sections were approximately 32½ inches in length and accommodated movement in the opposing end of the bridge rail. For additional information, please refer to Figures 1 and 2 and the drawings in Appendix A.

4
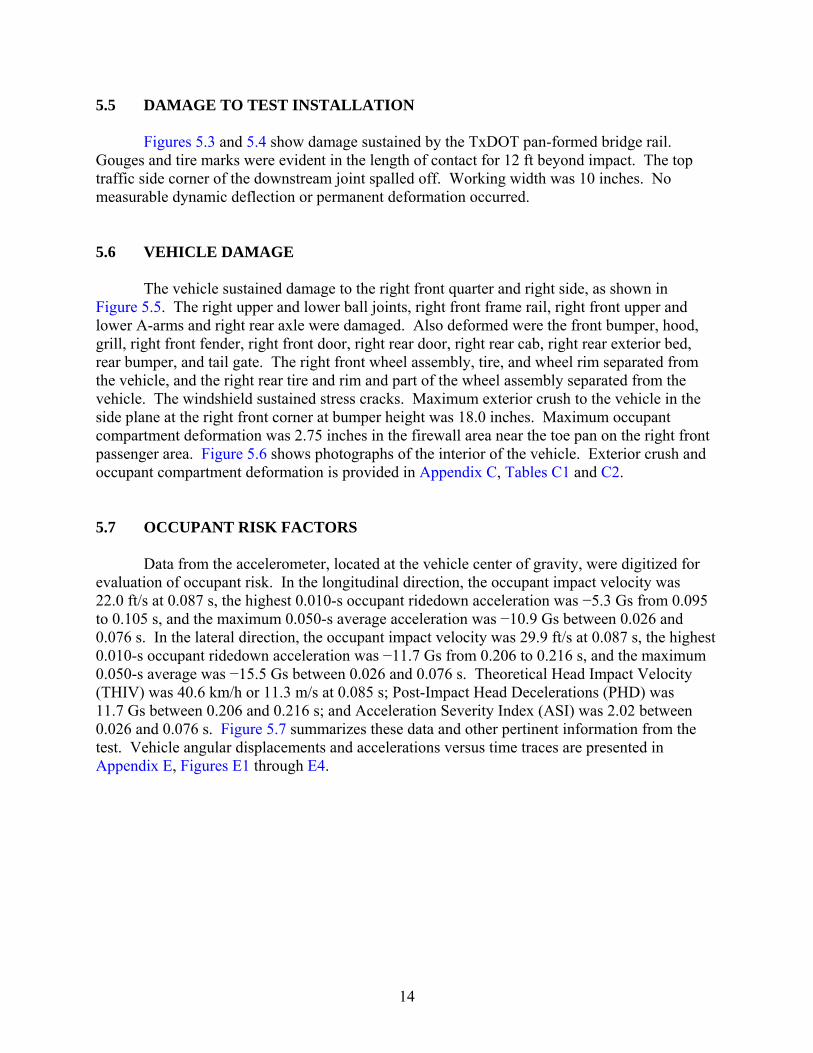
2.2 MATERIAL SPECIFICATIONS Reinforcement in the bridge rail consisted of pre-fabricated deformed welded wire provided by Insteel Industries, Inc., Mount Airy, North Carolina. The specified compressive strength of the concrete for the TxDOT Type SSTR bridge rail and the deck were 3600 psi and 3000 psi, respectively. The compressive strengths of the bridge rail and deck on the day the test was performed measured 4360 psi on the upstream end of the parapet (upstream from the expansion joint), 3525 psi on the downstream end of the parapet (downstream from expansion joint), and 3450 psi on the deck. Appendix B contains mill certifications sheets and other certification documents for the materials used in the TxDOT Type SSTR bridge rail information.

5
Fi
gure
2.1
. D
etai
ls o
f the
TxD
OT
Pan
-For
med
Bri
dge
Rai
l Ins
talla
tion.

6
Figure 2.2. TxDOT Pan-Formed Bridge Rail Installation before Test No. 420020-3.

7
CHAPTER 3. TEST REQUIREMENTS AND EVALUATION CRITERIA 3.1 CRASH TEST MATRIX
According to MASH, two tests are recommended to evaluate longitudinal barriers to test level three (TL-3). Details of the tests are as described below.
MASH test 3-10: An 1100C (2425 lb/1100 kg) vehicle impacting the critical impact point (CIP) of the length of need (LON) of the barrier at a nominal impact speed and angle of 62 mi/h and 25 degrees, respectively. This test is to investigate a barrier’s ability to successfully contain and redirect a small passenger vehicle. MASH test 3-11: A 2270P (5000 lb/2270 kg) vehicle impacting the CIP of the LON of the barrier at a nominal impact speed and angle of 62 mi/h and 25 degrees, respectively. This is a strength test to verify a barrier’s performance for impacts involving light trucks and SUVs for all test levels.
The test performed on the TxDOT pan-formed bridge rail was MASH test 3-11. The target CIP was determined to be 4.3 ft upstream of joint centerline in the TxDOT Type SSTR bridge rail. The crash test and data analysis procedures were in accordance with guidelines presented in MASH. Chapter 4 presents brief descriptions of these procedures. 3.2 EVALUATION CRITERIA
The crash test was evaluated in accordance with the criteria presented in MASH. The performance of the TxDOT Type SSTR bridge rail on pan-formed bridge rail is judged on the basis of three factors: structural adequacy, occupant risk, and post impact vehicle trajectory. Structural adequacy is judged upon the ability of the TxDOT Type SSTR bridge rail on pan-formed bridge rail to contain and redirect the vehicle, or bring the vehicle to a controlled stop in a predictable manner. Occupant risk criteria evaluates the potential risk of hazard to occupants in the impacting vehicle, and to some extent other traffic, pedestrians, or workers in construction zones, if applicable. Post impact vehicle trajectory is assessed to determine potential for secondary impact with other vehicles or fixed objects, creating further risk of injury to occupants of the impacting vehicle and/or risk of injury to occupants in other vehicles. The appropriate safety evaluation criteria from table 5-1 of MASH were used to evaluate the crash test reported herein, and are listed in further detail under the assessment of the crash test.


9
CHAPTER 4. CRASH TEST PROCEDURES 4.1 TEST FACILITY
The full-scale crash test reported herein was performed at Texas Transportation Institute
(TTI) Proving Ground. TTI Proving Ground is an International Standards Organization (ISO) 17025 accredited laboratory with American Association for Laboratory Accreditation (A2LA) Mechanical Testing certificate 2821.01. The full-scale crash test was performed according to TTI Proving Ground quality procedures and according to the MASH guidelines and standards. The Texas Transportation Institute Proving Ground is a 2000-acre complex of research and training facilities located 10 miles northwest of the main campus of Texas A&M University. The site, formerly an Air Force base, has large expanses of concrete runways and parking aprons well suited for experimental research and testing in the areas of vehicle performance and handling, vehicle-roadway interaction, durability and efficacy of highway pavements, and safety evaluation of roadside safety hardware. The site selected for construction and testing of the TxDOT SSTR bridge rail on pan-formed bridge deck evaluated under this project is along the edge of an out-of-service apron. The apron consists of an unreinforced jointed-concrete pavement in 12.5 ft by 15 ft blocks nominally 8 to 12 inches deep. The apron is over 50 years old, and the joints have some displacement, but are otherwise flat and level. 4.2 VEHICLE TOW AND GUIDANCE PROCEDURES The test vehicle was towed into the test installation using a steel cable guidance and reverse tow system. A steel cable for guiding the test vehicle was tensioned along the path, anchored at each end, and threaded through an attachment to the front wheel of the test vehicle. An additional steel cable was connected to the test vehicle, passed around a pulley near the impact point, through a pulley on the tow vehicle, and then anchored to the ground such that the tow vehicle moved away from the test site. A two-to-one speed ratio between the test and tow vehicle existed with this system. Just prior to impact with the installation, the test vehicle was released to be free-wheeling and unrestrained. The vehicle remained free-wheeling, i.e., no steering or braking inputs, until the vehicle cleared the immediate area of the test site, at which time brakes on the vehicle were activated to bring it to a safe and controlled stop. 4.3 DATA ACQUISITION SYSTEMS 4.3.1 Vehicle Instrumentation and Data Processing
The test vehicle was instrumented with a self-contained, on-board data acquisition system. The signal conditioning and acquisition system is a 16-channel, Tiny Data Acquisition System (TDAS) Pro produced by Diversified Technical Systems, Inc. The accelerometers, that measure the x, y, and z axis of vehicle acceleration, are strain gauge type with linear millivolt output proportional to acceleration. Angular rate sensors, measuring vehicle roll, pitch, and yaw

10
rates, are ultra small size, solid state units designs for crash test service. The TDAS Pro hardware and software conform to the latest SAE J211, Instrumentation for Impact Test. Each of the 16 channels is capable of providing precision amplification, scaling, and filtering based on transducer specifications and calibrations. During the test, data are recorded from each channel at a rate of 10,000 values per second with a resolution of one part in 65,536. Once recorded, the data are backed up inside the unit by internal batteries should the primary battery cable be severed. Initial contact of the pressure switch on the vehicle bumper provides a time zero mark as well as initiating the recording process. After each test, the data are downloaded from the TDAS Pro unit into a laptop computer at the test site. The raw data are then processed by the Test Risk Assessment Program (TRAP) software to produce detailed reports of the test results. Each of the TDAS Pro units are returned to the factory annually for complete recalibration. Accelerometers and rate transducers are also calibrated annually with traceability to the National Institute for Standards and Technology.
TRAP uses the data from the TDAS Pro to compute occupant/compartment impact velocities, time of occupant/compartment impact after vehicle impact, and the highest 10-millisecond (ms) average ridedown acceleration. TRAP calculates change in vehicle velocity at the end of a given impulse period. In addition, maximum average accelerations over 50-ms intervals in each of the three directions are computed. For reporting purposes, the data from the vehicle-mounted accelerometers are filtered with a 60-Hz digital filter, and acceleration versus time curves for the longitudinal, lateral, and vertical directions are plotted using TRAP.
TRAP uses the data from the yaw, pitch, and roll rate transducers to compute angular displacement in degrees at 0.0001-s intervals and then plots yaw, pitch, and roll versus time. These displacements are in reference to the vehicle-fixed coordinate system with the initial position and orientation of the vehicle-fixed coordinate systems being initial impact. 4.3.2 Anthropomorphic Dummy Instrumentation
Use of a dummy in the 2270P vehicle is optional according to MASH, and there was no dummy used in this test. 4.3.3 Photographic Instrumentation and Data Processing
Photographic coverage of the test included three high-speed cameras: one overhead with a field of view perpendicular to the ground and directly over the impact point; one placed behind the installation at an angle; and a third placed to have a field of view parallel to and aligned with the installation at the downstream end. A flashbulb activated by pressure-sensitive tape switches was positioned on the impacting vehicle to indicate the instant of contact with the installation and was visible from each camera. The films from these high-speed cameras were analyzed on a computer-linked motion analyzer to observe phenomena occurring during the collision and to obtain time-event, displacement, and angular data. A mini-DV camera and still cameras recorded and documented conditions of the test vehicle and installation before and after the test.

11
CHAPTER 5. CRASH TEST RESULTS 5.1 TEST DESIGNATION AND ACTUAL IMPACT CONDITIONS
MASH test 3-11 involves a 2270P vehicle weighing 5000 lb ±100 lb and impacting the TxDOT pan-formed bridge rail at an impact speed of 62.2 mi/h ±2.5 mi/h and an angle of 25 degrees ±1.5 degrees. The target impact point was 4.3 ft upstream of the joint centerline in the TxDOT Type SSTR bridge rail. The 2005 Dodge Ram 1500 Quad-Cab pickup truck used in the test weighed 5036 lb and the actual impact speed and angle were 63.8 mi/h and 24.8 degrees, respectively. The actual impact point was 5.2 ft upstream of the joint centerline in the TxDOT Type SSTR bridge rail. Impact severity was calculated at 3881 kip-ft or 5.2 percent above the target value. 5.2 TEST VEHICLE A 2005 Dodge Ram 1500 Quad-Cab pickup, shown in Figures 5.1 and 5.2, was used for the crash test. Test inertia weight of the vehicle was 5036 lb, and its gross static weight was 5036 lb. The height to the lower edge of the vehicle bumper was 13.5 inches, and it was 26.00 inches to the upper edge of the bumper. The height of the vertical center of gravity was measured at 28.38 inches. Figure C1 in Appendix C gives additional dimensions and information on the vehicle. The vehicle was directed into the installation using the cable reverse tow and guidance system, and was released to be free-wheeling and unrestrained just prior to impact. 5.3 WEATHER CONDITIONS The test was performed on the morning of August 3, 2010. Weather conditions at the time of testing were as follows: wind speed: 2 mi/h; wind direction: 192 degrees with respect to the vehicle (vehicle was traveling in a southwesterly direction); Temperature: 97°F, Relative humidity: 56 percent. 5.4 TEST DESCRIPTION The 2270P vehicle, traveling at an impact speed of 63.8 mi/h, impacted the TxDOT pan-formed bridge rail with the right front corner of the bumper 5.2 ft upstream of the joint centerline in the TxDOT Type SSTR bridge rail at an impact angle of 24.8 degrees. Shortly after impact, the right front tire contacted the bridge rail, and the vehicle began redirection at 0.074 s after impact. The vehicle was traveling parallel with the bridge rail at 0.189 s, and was traveling at a speed of 50.6 mi/h. At 0.430 s, the 2270P vehicle lost contact with the bridge rail, traveling at an exit speed and angle of 49.5 mi/h and 7.2 degrees, respectively. Brakes on the vehicle were applied at 1.2 s after impact. The vehicle subsequently came to rest 170 ft downstream and 6 ft toward traffic lanes. Figures D1 and D2 in Appendix D show sequential photographs of the test period.

12
Figure 5.1. Vehicle/Installation Geometrics for Test No. 420020-3.

13
Figure 5.2. Vehicle before Test No. 420020-3.
14
5.5 DAMAGE TO TEST INSTALLATION Figures 5.3 and 5.4 show damage sustained by the TxDOT pan-formed bridge rail. Gouges and tire marks were evident in the length of contact for 12 ft beyond impact. The top traffic side corner of the downstream joint spalled off. Working width was 10 inches. No measurable dynamic deflection or permanent deformation occurred. 5.6 VEHICLE DAMAGE The vehicle sustained damage to the right front quarter and right side, as shown in Figure 5.5. The right upper and lower ball joints, right front frame rail, right front upper and lower A-arms and right rear axle were damaged. Also deformed were the front bumper, hood, grill, right front fender, right front door, right rear door, right rear cab, right rear exterior bed, rear bumper, and tail gate. The right front wheel assembly, tire, and wheel rim separated from the vehicle, and the right rear tire and rim and part of the wheel assembly separated from the vehicle. The windshield sustained stress cracks. Maximum exterior crush to the vehicle in the side plane at the right front corner at bumper height was 18.0 inches. Maximum occupant compartment deformation was 2.75 inches in the firewall area near the toe pan on the right front passenger area. Figure 5.6 shows photographs of the interior of the vehicle. Exterior crush and occupant compartment deformation is provided in Appendix C, Tables C1 and C2. 5.7 OCCUPANT RISK FACTORS
Data from the accelerometer, located at the vehicle center of gravity, were digitized for evaluation of occupant risk. In the longitudinal direction, the occupant impact velocity was 22.0 ft/s at 0.087 s, the highest 0.010-s occupant ridedown acceleration was −5.3 Gs from 0.095 to 0.105 s, and the maximum 0.050-s average acceleration was −10.9 Gs between 0.026 and 0.076 s. In the lateral direction, the occupant impact velocity was 29.9 ft/s at 0.087 s, the highest 0.010-s occupant ridedown acceleration was −11.7 Gs from 0.206 to 0.216 s, and the maximum 0.050-s average was −15.5 Gs between 0.026 and 0.076 s. Theoretical Head Impact Velocity (THIV) was 40.6 km/h or 11.3 m/s at 0.085 s; Post-Impact Head Decelerations (PHD) was 11.7 Gs between 0.206 and 0.216 s; and Acceleration Severity Index (ASI) was 2.02 between 0.026 and 0.076 s. Figure 5.7 summarizes these data and other pertinent information from the test. Vehicle angular displacements and accelerations versus time traces are presented in Appendix E, Figures E1 through E4.

15
Figure 5.3. After Impact Vehicle Position for Test No. 420020-3.

16
Figure 5.4. Installation after Test No. 420020-3.

17
Figure 5.5. Vehicle after Test No. 420020-3.

18
Before Test After Test
Figure 5.6. Interior of Vehicle for Test No. 420020-3.

19
0.00
0 s
0.08
9 s
0.17
5 s
0.44
0 s
Gen
eral
Info
rmat
ion
Te
st A
genc
y ....
......
......
......
......
...
Te
st S
tand
ard
Test
No.
.....
......
..
TT
I Tes
t No.
.....
......
......
......
......
.
Dat
e ...
......
......
......
......
......
......
....
Test
Art
icle
Type
......
......
......
......
......
......
......
.
Nam
e ...
......
......
......
......
......
......
..
In
stal
latio
n Le
ngth
.....
......
......
....
M
ater
ial o
r Key
Ele
men
ts ..
......
..
Soil
Type
and
Con
ditio
n ....
......
...
Test
Veh
icle
Type
/Des
igna
tion .
......
......
......
....
M
ake
and
Mod
el ..
......
......
......
....
C
urb .
......
......
......
......
......
......
......
Test
Iner
tial ..
......
......
......
......
......
Dum
my
......
......
......
......
......
......
..
G
ross
Sta
tic ..
......
......
......
......
.....
Texa
s Tr
ansp
orta
tion
Inst
itute
(TTI
) M
AS
H T
est 3
-11
4200
20-3
20
10-0
8-03
B
ridge
Rai
l Tx
DO
T P
an-F
orm
ed B
ridge
Rai
l 75
ft
TxD
OT
Sin
gle
Slo
pe T
raffi
c R
ail (
Type
S
STR
) anc
hore
d to
top
of 6
-inch
thic
k re
info
rced
con
cret
e de
ck c
antil
ever
C
oncr
ete
Brid
ge D
eck,
Dry
22
70P
20
05 D
odge
Ram
150
0 47
23 lb
50
36 lb
N
o du
mm
y 50
36 lb
Impa
ct C
ondi
tions
Spe
ed ..
......
......
......
......
......
A
ngle
.....
......
......
......
......
....
Lo
catio
n/O
rient
atio
n ...
......
.Ex
it C
ondi
tions
Spe
ed ..
......
......
......
......
......
A
ngle
.....
......
......
......
......
....
Occ
upan
t Ris
k Va
lues
Impa
ct V
eloc
ity
L
ongi
tudi
nal
......
......
......
..
Lat
eral
.....
......
......
......
.....
R
ided
own
Acc
eler
atio
ns
L
ongi
tudi
nal
......
......
......
..
Lat
eral
.....
......
......
......
.....
TH
IV ..
......
......
......
......
......
..
PH
D ..
......
......
......
......
......
...
AS
I .....
......
......
......
......
......
..M
ax. 0
.050
-s A
vera
ge
L
ongi
tudi
nal
......
......
......
..
Lat
eral
.....
......
......
......
.....
V
ertic
al
......
......
......
......
...
63.8
mi/h
24
.8 d
egre
es
5.2
ft up
stre
am o
f jo
int
49.5
mi/h
7.
2 de
gree
s 22
.0 ft
/s
29.9
ft/s
-
5.3
G
-11.
7 G
40
.6 k
m/h
11
.7 G
2.
02
-10.
9 G
-1
5.5
G
-6
.1 G
Post
-Impa
ct T
raje
ctor
y
Sto
ppin
g D
ista
nce
......
......
......
....
Vehi
cle
Stab
ility
Max
imum
Yaw
Ang
le...
......
......
...
Max
imum
Pitc
h A
ngle
......
......
.....
M
axim
um R
oll A
ngle
.....
......
......
.
Veh
icle
Sna
ggin
g ...
......
......
......
..
Veh
icle
Poc
ketin
g ....
......
......
......
.Te
st A
rtic
le D
efle
ctio
ns
D
ynam
ic ..
......
......
......
......
......
.....
P
erm
anen
t .....
......
......
......
......
.....
W
orki
ng W
idth
.....
......
......
......
.....
Vehi
cle
Dam
age
V
DS
.....
......
......
......
......
......
......
...
CD
C ...
......
......
......
......
......
......
.....
M
ax. E
xter
ior D
efor
mat
ion
......
...
OC
DI .
......
......
......
......
......
......
.....
M
ax. O
ccup
ant C
ompa
rtmen
t
Def
orm
atio
n ...
......
......
......
....
Impa
ct S
ever
ity ..
......
......
......
......
..
170
ft dw
nstrm
6.
0 ft
twd
traffi
c -3
4 de
gree
s
8 d
egre
es
26
degr
ees
No
No
Nil
N
il
10 in
ches
01
RFQ
5 01
RD
EW
4 18
.0 in
ches
R
F002
0000
2.
75 in
ches
38
81 k
ip-ft
(+5%
)
Figu
re 5
.7.
Sum
mar
y of
Res
ults
for
MA
SH T
est 3
-11
on th
e T
xDO
T P
an-F
orm
ed B
ridg
e R
ail.


21
CHAPTER 6. SUMMARY AND CONCLUSIONS 6.1 ASSESSMENT OF TEST RESULTS An assessment of the test based on the applicable MASH safety evaluation criteria is provided below. 6.1.1 Structural Adequacy
A. Test article should contain and redirect the vehicle or bring the vehicle to a controlled stop; the vehicle should not penetrate, underride, or override the installation although controlled lateral deflection of the test article is acceptable.
Results: The TxDOT pan-formed bridge rail contained and redirected the 2270P
vehicle. The vehicle did not penetrate, underride, or override the installation. No measurable dynamic deflection was noted. (PASS)
6.1.2 Occupant Risk
D. Detached elements, fragments, or other debris from the test article should not penetrate or show potential for penetrating the occupant compartment, or present an undue hazard to other traffic, pedestrians, or personnel in a work zone. Deformation of, or intrusions into, the occupant compartment should not exceed limits set forth in Section 5.3 and Appendix E of MASH. (roof ≤4.0 inches; windshield ≤3.0 inches; side windows = no shattering by test article structural member; wheel/foot well/toe pan ≤9.0 inches; forward of A-pillar ≤12.0 inches; front side door area above seat ≤9.0 inches; front side door below seat ≤12.0 inches; floor pan/transmission tunnel area ≤12.0 inches).
Results: A small piece of concrete broke off the top traffic side corner of the
downstream joint of the bridge rail. This debris did not penetrate nor show potential for penetrating the occupant compartment, or present undue hazard to others in the area. (PASS)
Maximum occupant compartment deformation was 2.75 inches in the firewall area near the toe pan on the front right passenger side. (PASS)
F. The vehicle should remain upright during and after collision. The maximum
roll and pitch angles are not to exceed 75 degrees. Results: The 2270P vehicle remained upright during and after the collision event.
Maximum roll and pitch angles during the test were 26 degrees and 8 degrees, respectively. (PASS)

22
H. Occupant impact velocities should satisfy the following: Longitudinal and Lateral Occupant Impact Velocity
Preferred Maximum 30 ft/s 40 ft/s Results: Longitudinal occupant impact velocity was 22.0 ft/s, and lateral occupant
impact velocity was 29.9 ft/s. (PASS) I. Occupant ridedown accelerations should satisfy the following:
Longitudinal and Lateral Occupant Ridedown Accelerations Preferred Maximum 15.0 Gs 20.49 Gs Results: Longitudinal ridedown acceleration was −5.3 G, and lateral ridedown
acceleration was −11.7 G. (PASS)
6.1.3 Vehicle Trajectory For redirective devices, the vehicle shall exit the barrier within the exit box. Result: The vehicle exited within the exit box. (PASS)
6.2 CONCLUSIONS The TxDOT pan-formed bridge rail performed acceptably for MASH test 3-11, as shown in Table 6.1.

23
Tab
le 6
.1.
Perf
orm
ance
Eva
luat
ion
Sum
mar
y fo
r M
ASH
Tes
t 3-1
1 on
the
TxD
OT
Pan
-For
med
Bri
dge
Rai
l. Te
st A
genc
y: T
exas
Tra
nspo
rtatio
n In
stitu
te
Test
No.
: 42
0020
-3
Te
st D
ate:
201
0-08
-03
MA
SH T
est 3
-11
Eva
luat
ion
Cri
teri
a Te
st R
esul
ts
Ass
essm
ent
Stru
ctur
al A
dequ
acy
A.
Test
art
icle
shou
ld c
onta
in a
nd re
dire
ct th
e ve
hicl
e or
br
ing
the
vehi
cle
to a
con
trol
led
stop
; the
veh
icle
shou
ld
not p
enet
rate
, und
erri
de, o
r ove
rrid
e th
e in
stal
latio
n al
thou
gh c
ontr
olle
d la
tera
l def
lect
ion
of th
e te
st a
rtic
le is
ac
cept
able
.
The
TxD
OT
pan-
form
ed b
ridge
rail
cont
aine
d an
d re
dire
cted
the
2270
P ve
hicl
e. T
he v
ehic
le d
id n
ot
pene
trate
, und
errid
e, o
r ove
rrid
e th
e in
stal
latio
n.
No
mea
sura
ble
dyna
mic
def
lect
ion
was
not
ed.
Pass
Occ
upan
t Ris
k
D
. D
etac
hed
elem
ents
, fra
gmen
ts, o
r oth
er d
ebri
s fro
m th
e te
st a
rtic
le sh
ould
not
pen
etra
te o
r sho
w p
oten
tial f
or
pene
trat
ing
the
occu
pant
com
part
men
t, or
pre
sent
an
undu
e ha
zard
to o
ther
traf
fic, p
edes
tria
ns, o
r per
sonn
el
in a
wor
k zo
ne.
A sm
all p
iece
of c
oncr
ete
brok
e of
f the
top
traff
ic
side
cor
ner o
f the
dow
nstre
am jo
int.
Thi
s deb
ris
did
not p
enet
rate
nor
show
pot
entia
l for
pen
etra
ting
the
occu
pant
com
partm
ent,
or p
rese
nt u
ndue
haz
ard
to o
ther
s in
the
area
.
Pass
Def
orm
atio
ns o
f, or
intr
usio
ns in
to, t
he o
ccup
ant
com
part
men
t sho
uld
not e
xcee
d lim
its se
t for
th in
Sec
tion
5.3
and
Appe
ndix
E o
f MAS
H.
Max
imum
occ
upan
t com
partm
ent d
efor
mat
ion
was
2.
75 in
ches
in th
e fir
ewal
l are
a ne
ar th
e to
e pa
n on
th
e fr
ont r
ight
pas
seng
er si
de.
Pass
F.
The
vehi
cle
shou
ld re
mai
n up
righ
t dur
ing
and
afte
r co
llisi
on.
The
max
imum
roll
and
pitc
h an
gles
are
not
to
exce
ed 7
5 de
gree
s.
The
2270
P ve
hicl
e re
mai
ned
uprig
ht d
urin
g an
d af
ter t
he c
ollis
ion
even
t. M
axim
um ro
ll an
d pi
tch
angl
es d
urin
g th
e te
st w
ere
26 d
egre
es a
nd
8 de
gree
s, re
spec
tivel
y.
Pass
H.
Long
itudi
nal a
nd la
tera
l occ
upan
t im
pact
vel
ociti
es
shou
ld fa
ll be
low
the
pref
erre
d va
lue
of 3
0 ft/
s, or
at l
east
be
low
the
max
imum
allo
wab
le v
alue
of 4
0 ft/
s.
Long
itudi
nal o
ccup
ant i
mpa
ct v
eloc
ity w
as
22.0
ft/s
, and
late
ral o
ccup
ant i
mpa
ct v
eloc
ity w
as
29.9
ft/s
. Pa
ss
I. Lo
ngitu
dina
l and
late
ral o
ccup
ant r
ided
own
acce
lera
tions
shou
ld fa
ll be
low
the
pref
erre
d va
lue
of
15.0
Gs,
or a
t lea
st b
elow
the
max
imum
allo
wab
le v
alue
of
20.
49 G
s.
Long
itudi
nal r
ided
own
acce
lera
tion
was
−5.
3 G
, an
d la
tera
l rid
edow
n ac
cele
ratio
n w
as −
11.7
G.
Pass
Veh
icle
Tra
ject
ory
Fo
r red
irec
tive
devi
ces,
the
vehi
cle
shal
l exi
t the
bar
rier
w
ithin
the
exit
box.
Th
e 22
70P
vehi
cle
exite
d w
ithin
the
exit
box.
Pa
ss


25
CHAPTER 7. IMPLEMENTATION STATEMENT
The objective of this crash test was to determine if the TxDOT Type SSTR bridge rail on pan-formed retrofit bridge deck would perform acceptably according to the guidelines set forth in MASH. The crash test performed was MASH test 3-11 involving a 2270P vehicle (5000-lb pickup truck) impacting the critical impact point (CIP) of the bridge rail at an impact speed and angle of 62 mi/h and 25 degrees, respectively.
The TxDOT Type SSTR bridge rail retrofitted to the 6-inch thick pan-formed bridge deck
as tested and described herein performed acceptably for MASH test 3-11. In addition, the two #8 deformed bars, used in the expansion joint between the barrier ends to provide additional lateral strength to the two opposing ends of the barrier at the joint performed as designed. The retrofit SSTR bridge rail as tested for this project with the #8 expansion dowels in the barrier expansion joints are recommended* for implementation on any pan-form bridge upgrade projects with 6-inch minimum deck thickness.
* The opinions/interpretations expressed in this section are outside the scope of TTI Proving Ground’s A2LA accreditation.


27
REFERENCES 1. AASHTO, “Manual for Assessing Safety Hardware,” Fourth Edition: American
Association of State Highway and Transportation Officials, Washington, D.C., 2009.


29
APPENDIX A. DETAILS OF THE TEST ARTICLE

30

31

32

33


35
APPENDIX B. CERTIFICATION DOCUMENTATION

36
All reports are the exclusive property of K-T Bolt Manufacturing Company, Inc. ®. Any reproduction must be in their entirety and at the permission of the same.
37

38

39


41
APPENDIX C. TEST VEHICLE PROPERTIES AND INFORMATION Date: 2010-08-03 Test No.: 420020-3 VIN No.: 1D7HA18N455243883 Year: 2005 Make: Dodge Model: Ram 1500 Quad-Cab Tire Size: 245/70R17 Tire Inflation Pressure: 35 psi Tread Type: Highway Odometer: 138200 Note any damage to the vehicle prior to test:
Geometry: inches A 77.00 F 37.00 K 20.50 P 3.00 U 27.50B 73.25 G 28.38 L 28.75 Q 29.50 V 34.00C 227.00 H 63.86 M 68.25 R 18.50 W 53.50D 47.50 I 13.50 N 67.25 S 14.25 X 140.50E 140.50 J 26.00 O 44.75 T 75.50 Wheel Center Ht Front 14.125 Wheel Well Clearance (FR) 6.125 Frame Ht (FR) 16.685Wheel Center Ht Rear 14.25 Wheel Well Clearance (RR) 11.25 Frame Ht (RR) 24.25
RANGE LIMIT: A=78 ±2 inches; C=237 ±13 inches; E=148 ±12 inches; F=39 ±3 inches; G = > 28 inches; H = 63 ±4 inches; O=43 ±4 inches; M+N/2=67 ±1.5 inches
Mass Distribution: lb LF: 1408 RF: 1339 LR: 1141 RR: 1148
Figure C1. Vehicle Properties for Test No. 420020-3.
• Denotes accelerometer location. NOTES: Engine Type: V-8 Engine CID: 4.7 liter Transmission Type: x Auto or Manual FWD x RWD 4WD Optional Equipment: Dummy Data: Type: No dummy Mass: Seat Position:
GVWR Ratings: Mass: lb Curb Test
Inertial Gross Static
Front 3650 Mfront 2736 2747 Allowable Allowable
Back 3900 Mrear 1987 2289 Range Range
Total 6650 MTotal 4723 5036 5000 ±110 lb 5000 ±110 lb

42
Table C1. Exterior Crush Measurements for Test No. 420020-3.
Date: 2010-08-03 Test No.: 420020-3 VIN No.: 1D7HA18N455243883 Year: 2005 Make: Dodge Model: Ram 1500 Quad-Cab
VEHICLE CRUSH MEASUREMENT SHEET1 Complete When Applicable
End Damage Side Damage Undeformed end width ________
Corner shift: A1 ________
A2 ________
End shift at frame (CDC)
(check one)
< 4 inches ________
≥ 4 inches ________
Bowing: B1 _____ X1 _____
B2 _____ X2 _____
Bowing constant
221 XX + = ______
Note: Measure C1 to C6 from Driver to Passenger side in Front or Rear impacts – Rear to Front in Side Impacts.
Specific Impact Number
Plane* of C-Measurements
Direct Damage
Field L**
C1 C2 C3 C4 C5 C6 ±D Width** (CDC)
Max*** Crush
1 Front plane at bumper ht 16 13 26 0 1.5 3 6 8 13 +10
2 Side plane at bumper ht 16 18 58 0 4 --- --- 13 18 +68
Measurements recorded
in inches
1Table taken from National Accident Sampling System (NASS). *Identify the plane at which the C-measurements are taken (e.g., at bumper, above bumper, at sill, above sill, at beltline, etc.) or label adjustments (e.g., free space). Free space value is defined as the distance between the baseline and the original body contour taken at the individual C locations. This may include the following: bumper lead, bumper taper, side protrusion, side taper, etc. Record the value for each C-measurement and maximum crush. **Measure and document on the vehicle diagram the beginning or end of the direct damage width and field L (e.g., side damage with respect to undamaged axle). ***Measure and document on the vehicle diagram the location of the maximum crush. Note: Use as many lines/columns as necessary to describe each damage profile.

43
Table C2. Occupant Compartment Measurements for Test No. 420020-3. Date: 2010-08-03 Test No.: 420020-3 VIN No.: 1D7HA18N455243883 Year: 2005 Make: Dodge Model: Ram 1500 Quad-Cab *Lateral area across the cab from driver’s side kickpanel to passenger’s side kickpanel.
OCCUPANT COMPARTMENT DEFORMATION MEASUREMENT
Before After ( inches ) ( inches )
A1 64.25 64.25A2 64.50 64.50A3 65.25 65.50B1 45.50 45.50B2 39.25 38.25B3 45.50 45.75B4 42.25 42.50B5 42.50 43.00B6 42.25 42.62C1 29.50 29.50C2 ---- ----C3 26.75 24.00D1 12.50 12.50D2 2.50 2.12D3 11.50 12.50E1 62.50 62.75E2 64.25 66.00E3 63.88 64.12E4 64.00 64.25F 60.00 60.00G 60.00 60.00H 39.50 39.50I 39.50 39.50J* 62.25 61.00


45
APPENDIX D. SEQUENTIAL PHOTOGRAPHS
0.000 s
0.089 s
0.175 s
0.263 s
Figure D1. Sequential Photographs for Test No. 420020-3 (Overhead and Frontal Views).

46
0.352 s
0.440 s
0.526 s
0.615 s
Figure D1. Sequential Photographs for Test No. 420020-3 (Overhead and Frontal Views) (Continued).

47
0.000 s 0.352 s
0.089 s 0.440 s
0.175 s 0.526 s
0.263 s 0.615 s Figure D2. Sequential Photographs for Test No. 420020-3
(Rear View).


49
APPENDIX E. VEHICLE ANGULAR DISPLACEMENTS AND ACCELERATIONS
Rol
l, Pi
tch,
and
Yaw
Ang
les
00.
20.
40.
60.
81.
01.
2-1
00-80
-60
-40
-2002040
Tim
e (s
)
Angles (degrees)
Tes
t Num
ber:
4200
20-3
Tes
t Sta
ndar
d T
est N
o.: M
AS
H 3
-11
Tes
t Dat
e: 2
010-
08-0
3T
est A
rticl
e: T
xDO
T S
ST
R R
etro
fit P
an-F
orm
ed B
ridge
Rai
lT
est V
ehic
le: 2
005
Dod
ge R
am 1
500
Qua
d-C
abIn
ertia
l Mas
s: 5
036
lbG
ross
Mas
s: 5
036
lbIm
pact
Spe
ed: 6
3.8
mi/h
Impa
ct A
ngle
: 24.
8 de
gree
s
Rol
lP
itch
Yaw
Fi
gure
E1.
Veh
icle
Ang
ular
Dis
plac
emen
ts fo
r T
est N
o. 4
2002
0-3.
Axes
are v
ehicl
e-fix
ed.
Sequ
ence
for d
eterm
ining
or
ientat
ion: 1.
Yaw.
2.
Pitch
. 3.
Roll.

50
X A
ccel
erat
ion
at C
G
00.
20.
40.
60.
81.
01.
2-3
0
-20
-10010
Tim
e (s
)
Longitudinal Acceleration (G)
Tes
t Num
ber:
4200
20-3
Tes
t Sta
ndar
d T
est N
o.: M
AS
H 3
-11
Tes
t Dat
e: 2
010-
08-0
3T
est A
rticl
e: T
xDO
T S
ST
R R
etro
fit P
an-F
orm
ed B
ridge
Rai
lT
est V
ehic
le: 2
005
Dod
ge R
am 1
500
Qua
d-C
abIn
ertia
l Mas
s: 5
036
lbG
ross
Mas
s: 5
036
lbIm
pact
Spe
ed: 6
3.8
mi/h
Impa
ct A
ngle
: 24.
8 de
gree
s
Tim
e of
OIV
(0.0
867
sec)
SA
E C
lass
60
Filte
r50
-mse
c av
erag
e
Fi
gure
E2.
Veh
icle
Lon
gitu
dina
l Acc
eler
omet
er T
race
for
Tes
t No.
420
020-
3 (A
ccel
erom
eter
Loc
ated
at C
ente
r of
Gra
vity
).

51
Y A
ccel
erat
ion
at C
G
00.
20.
40.
60.
81.
01.
2-4
0
-30
-20
-10010
Tim
e (s
)
Lateral Acceleration (G)
Tes
t Num
ber:
4200
20-3
Tes
t Sta
ndar
d T
est N
o.: M
AS
H 3
-11
Tes
t Dat
e: 2
010-
08-0
3T
est A
rticl
e: T
xDO
T S
ST
R R
etro
fit P
an-F
orm
ed B
ridge
Rai
lT
est V
ehic
le: 2
005
Dod
ge R
am 1
500
Qua
d-C
abIn
ertia
l Mas
s: 5
036
lbG
ross
Mas
s: 5
036
lbIm
pact
Spe
ed: 6
3.8
mi/h
Impa
ct A
ngle
: 24.
8 de
gree
s
Tim
e of
OIV
(0.0
867
sec)
SA
E C
lass
60
Filte
r50
-mse
c av
erag
e
Fi
gure
E3.
Veh
icle
Lat
eral
Acc
eler
omet
er T
race
for
Tes
t No.
420
020-
3 (A
ccel
erom
eter
Loc
ated
at C
ente
r of
Gra
vity
).

52
Z A
ccel
erat
ion
at C
G
00.
20.
40.
60.
81.
01.
2-3
0
-20
-10010203040
Tim
e (s
)
Vertical Acceleration (G)
Tes
t Num
ber:
4200
20-3
Tes
t Sta
ndar
d T
est N
o.: M
AS
H 3
-11
Tes
t Dat
e: 2
010-
08-0
3T
est A
rticl
e: T
xDO
T S
ST
R R
etro
fit P
an-F
orm
ed B
ridge
Rai
lT
est V
ehic
le: 2
005
Dod
ge R
am 1
500
Qua
d-C
abIn
ertia
l Mas
s: 5
036
lbG
ross
Mas
s: 5
036
lbIm
pact
Spe
ed: 6
3.8
mi/h
Impa
ct A
ngle
: 24.
8 de
gree
s
SA
E C
lass
60
Filte
r50
-mse
c av
erag
e
Fi
gure
E4.
Veh
icle
Ver
tical
Acc
eler
omet
er T
race
for
Tes
t No.
420
020-
3 (A
ccel
erom
eter
Loc
ated
at C
ente
r of
Gra
vity
).
Top Related