


Languages
Pages
Legal


Luiss School of European Political Economy
Market power and productivity trends in the European economies: A macroeconomic perspective Claudio Battiati, Cecilia Jona-Lasinio, Enrico Marvasi and Silvia Sopranzetti Working Paper 1/2021 January 18, 2021

Market power and productivity trends in
the European economies. A
macroeconomic perspective.
Claudio Battiati*
Enrico Marvasi�Cecilia Jona-Lasinio�
Silvia Sopranzetti§
January 18, 2021
Abstract
Recent empirical investigations have documented an upward trend in profit
rates, markups, and concentration over the last decades, bringing a renewed in-
terest in market power and its causes and consequences. While most studies
have focused on the US, recent works identify similar patterns in other advanced
economies as well. In light of such results, a growing concern is emerging about
the negative effects of declining competition. Do we observe a similar pattern in
the EU countries? This paper relies on national accounting data to investigate
these issues for four major EU countries: France, Germany, Italy and Spain.
We find that, despite some common trends, EU countries are differentiated and
followed different trends relative to the US. The upward markup trend is less
pronounced than in the US and markups are positively correlated with pro-
ductivity and investments, including on innovation; while imported inputs and
Global Value Chains have pro-competitive effects. In the EU, despite country
and sector specificities, increased concentration and market power are generally
of less concern than in the US, while a larger role for the most efficient firms
might increase efficiency.
Keywords: productivity growth, markups, market power, global value chains.
JEL reference: F40, F10, F60.
*MEF and LUISS University�University of Florence and LUISS University�ISTAT and LUISS University§MEF and LUISS University0Acknowledgments: This research has been conducted within a project on “Productivity trends
in the Euro Area” sponsored by the Luiss-School of Economic Policy and the Italian Statistical Insti-tute. We are grateful to Sergio De Nardis, Marcello Messori, Roberto Monducci, Giorgia Giovannetti,Anna Giunta, Luca De Benedictis and Lelio Iapadre for useful discussions and insights to develop thisresearch. We also thank the participants to the LUISS-SEP seminars, to the 61-th annual conferenceof the Italian Economic Association and to the Roma Tre University GDS17 workshop. All errors areours.
1 Introduction
Recent empirical investigations have documented a broad upward trend in profit rates,
markups, and concentration over the last decades, bringing a renewed interest in mar-
ket power and its causes and consequences. While most studies have focused on the US,
recent works (Diez et al., 2018, 2019; Calligaris et al., 2018; De Loecker and Eeckhout,
2018) identify similar patterns in other advanced economies as well. In light of such re-
sults, a growing concern is emerging about the negative effects of declining competition.
While, on one side, a certain degree of market power (and profitability) is necessary for
firms to have an incentive to invest in innovative products and processes, on the other
side weakening competition will probably fail to provide incentives to try to escape
competition through innovation (Aghion et al., 2005) or other productivity-boosting
enablers such as management practices (Van Reenen, 2011). As its market power rises,
a firm can increase its profits by charging higher prices and reducing output, which,
in turn, leads to a lower demand for labor and capital. By reducing investment and
employment, rising markups can generate economic slack. In the short-run, this may
imply a trade-off for monetary policy. Rising markups may lead to higher inflation,
potentially calling for restrictive policies. Yet, firms with greater market power may
reduce output and investment, which instead would imply a more accommodating
monetary policy stance. In the long-run, real wages will need to fall to restore an
inflation rate consistent with the Central Bank’s target, leading to lower participation
rate and employment, and thus to lower potential output Autor et al. (2020). Several
authors have recently tried to link the observed increase in concentration to other re-
cent macroeconomic trends such as the observed drops in productivity growth (Baqaee
and Farhi, 2019; Aghion et al., 2019), in investment rates (Gutierrez and Philippon,
2017; Diez et al., 2018; Eggertsson et al., 2018), and in the labor’s share of income
(Barkai, ming; Eggertsson et al., 2018; De Loecker and Eeckhout, 2017; Autor et al.,
2020). Other studies, however, point into the opposite direction. For instance, Autor
et al. (2017) and Crouzet and Eberly (2019) find a positive relation between concen-
tration and productivity growth, although the latter finds a positive relation only in
some sectors, such as Retail and Wholesale trade and, to some extent, the High-tech.
As pointed out by Van Reenen (2018), if the rising concentration and markup levels
reflect technological changes favoring a reallocation of output to more efficient firms
rather than weakening competition, we may expect to eventually observe higher pro-
ductivity, lower prices and higher real wages. This possibility raises a number of issues
that need to be addressed in order to ascertain whether and to what extent increases
in the average level of market power must be held accountable for the aforementioned
trends.
In this paper we provide an overview of the main findings of the literature and
1

discuss the main evidence for four major European countries: France, Germany, Italy
and Spain. Our aim is identify the main stylized facts for markups and productivity
dynamics in the EU countries as compared to the US. This descriptive evidence is
helpful in setting the stage for further investigations on the causes and consequences
of market power and productivity dynamics in the EU. The literature focusing on EU
countries is relatively scarce. Moreover, micro-level analyses typically focus on one
country, while direct cross-country comparisons are difficult due to data availability.
Our paper contributes to fill this gap. To do so we rely on national accounting data
(EUROSTAT and EU KLEMS), which ensures cross-country comparability and allows
us to provide for the first time an aggregate cross-country analysis for EU countries.
The evidence gathered in this paper helps answering some important questions and
puzzles regarding recent trends. Some of these questions are: Were trends in the EU
different from the US? What are the drivers of aggregate and sector markup trends in
the EU economies? What are the common factors across EU countries?
We find that the four EU sample countries are heterogeneous. After a declining
trend from 1995 to 2007, especially for France and Italy, markups show country-specific
dynamics with an increase in cross-country dispersion after the 2008 financial crisis.
However, in all four EU countries markups are lower than in the US. Productivity
dynamics are also heterogeneous with Germany being the only country with no clear
sign of a productivity slowdown. The country-level aggregate markups and produc-
tivity series do not seem much correlated. At a more disaggregated level, however,
there is a positive correlation between markups and productivity. These correlations
apply both to cross-sectional country-industry markups (period averages) and over
time. Moreover, country-industry markups are correlated negatively with the labour
share and positively with the investment share, including on innovation. Import pen-
etration does seem much associated with markups, but further analysis reveals that
the type of goods imported matters. Considering imported inputs and global value
chains (GVC) there is a clear negative correlation between markups and (backward)
GVC participation. This correlation holds after controlling for several factors as well
as country-industry and year fixed effects.
Overall, our results highlight that despite the EU single market, France, Germany,
Italy and Spain had specific trends. Nonetheless, markups remained lower and market
power did not play the same role as in the US. In the EU the association between
markups and productivity is positive. This is in line with the idea that the EU economy
is now more fragmented and competitive relative to the US. Market shares reallocation
towards the most productive firms may still be beneficial in terms of efficiency while
the risk of monopoly rents does not seem imminent. Global value chain participation
and the use of imported inputs may have contributed to moderate markup increases.
2
2 Background literature on markups
The main issue of the literature regards the drivers of markups. Several mechanisms
can lead to markups increases. They may reflect different market structures and forms
of interactions between firms. A number of studies postulates a positive relation be-
tween productivity and market power, at least at the firm level, and a crucial role of
technological advancements in linking the two. In contrast with this evidence, several
works suggest that rising market power may eventually undermine aggregate produc-
tivity growth, even if it is driven by a reallocation of resources to most productive
firms.
In what follows we briefly review the literature highlighting the role of productivity,
of reallocation of marker shares within and between sectors, of innovation activity of
firms and of Global Value Chains (GVC).
2.1 Productivity
The association between markups and productivity is of primary importance to gauge
whether increased concentration and market power represent a major concern. How-
ever, theoretical considerations show that the relation between these variables is non-
trivial and causality can go in either direction, implying that the issue is mainly em-
pirical.
The sign of the relation between market power and productivity depends on the
degree of market power. Diez et al. (2018) find support for this hypothesis using
data on publicly traded firms from 33 advanced economies.1 They find that at low
levels of markups, an increase in market power is associated with more investment,
but the relation is eventually reverted for higher markup levels, and particularly for
firms operating in industries with high levels of market concentration. In a study on a
large sample of French manufacturing firms over the period 1998-2007, Bellone et al.
(2014) find a positive association of markups with firms’ productivity and a negative
relation with variables describing the competitive environment such as the size of the
local markets where firms operate or the degree of import penetration. They also find
markups to be positively related to productivity and export participation, the size
of the effect growing with the wealth and the distance of the destination countries,
which, the authors speculate, suggests quality differentiation across markets. Aghion
et al. (2005) propose a model in which innovation increases with competition for low
initial competition levels; at higher levels of market competition, however, innovation
decreases, as the potential payoffs decline. Aghion et al. (2019) and De Ridder (2019)
provide theoretical frameworks, based on innovation-led endogenous growth, that link
1But they take investment (both on physical capital and R&D) as the dependent variable ratherthan productivity or a measure of innovation.
3
the rise in concentration to a slowdown in aggregate productivity. In Aghion et al.
(2019), high-productivity firms exploit IT improvements to expand their reach into
new markets. Since these firms also enjoy higher markups, we observe a temporary
surge in productivity coupled with rising average markup. But eventually they run into
a high-productivity incumbent: at this point, both firms curtail their efforts at creative
destruction, knowing they will face stiffer competition. In De Ridder (2019), the rise of
intangible inputs gives firms with low adoption costs a competitive advantage that can
be used to deter (potential) competitors from developing higher quality products, thus
reducing the rate of creative destruction and innovation. Crouzet and Eberly (2019)
find that the relation between intangibles, markups and productivity may vary across
sectors. Their evidence points to a positive association between intangible investment
by industry leaders and productivity gains in the Consumer and High-tech sectors.
By contrast, in the Healthcare sector (and to a less extent in High-tech), intangible
investment is associated with rising markups, suggesting that it may have been used
by leading firms to exert market power.
2.2 Reallocation
Firms and industries may have different characteristics, implying that researchers must
pay attention not only to within-firm dynamics but also to between-firms and between-
sectors reallocation.
A common result in the literature is that, while aggregate markups have increased
across all major industries, their distribution has broadened and become more skewed
upward over time. Baqaee and Farhi (2019) generalize the growth accounting method-
ology to account for deviations from perfect competition, and decompose the estimated
changes in aggregate productivity into two components: technical change, and vari-
ations in allocative efficiency. They find that the reallocation of market shares to
high-markup firms accounts for about half of measured aggregate TFP growth in the
US over the period 1997-2015. Nevertheless, they also show that eliminating the misal-
location resulting from the large and dispersed markups would raise aggregate TFP by
about 15%. The increase in average markups, then, seems to be led by a reallocation
of market shares towards higher-markup firms rather than by a generalized increase
in price-cost margins. Such result, found by De Loecker and Eeckhout (2017) in their
study on publicly listed US firms, is confirmed by Calligaris et al. (2018), Diez et al.
(2019), Hartman-Glaser et al. (2019), Autor et al. (2020) who also describe similar
dynamics in other advanced economies. Diez et al. (2019), for a panel of private and
listed firms from 20 (mostly advanced) countries, find evidence of a U-shaped relation-
ship between markups and firms size, with markups declining with firms size, except
for firms in the top 5 percentile of the distribution of firm sales. Suggested expla-
4
nations include lax antitrust enforcement of mergers and acquisitions (Grullon et al.,
2019) or, on the contrary, growing federal regulation creating entry barriers, and thus
reducing competition (Andrews et al., 2016; Gutierrez and Philippon, 2017). While
this explanation may apply relatively well to the US, it would hardly be the case of EU
countries, which instead have undergone major product market deregulation since the
1990s, and where competition law and policy is widely seen as stringent in international
comparison (IMF, 2019).
2.3 Innovation
Given the broad-based nature of changes in markups and their distribution across
countries and industries, a case could be made that some common underlying forces
have changed the nature of competition, allowing firms that better adapt to new tech-
nologies to capture outsized market power. This is the thesis of Autor et al. (2017,
2020) who find evidence of a positive relationship between the growth of concentra-
tion and the growth of patent intensity and labor productivity both in the US and
in other OECD countries. They speculate that this is explained by greater competi-
tion resulting from globalization and improved abilities of consumers to find low-cost
or high-quality firms, made possible by advances in information technology. Bessen
(2017) finds a positive relation between industry concentration in the US and the use
of IT systems, which in turn is associated with enhanced performance of the top firms
within each industry. The paper shares the idea that higher concentration may be
part of an efficiency-enhancing shift, but the author suggests that this is explained by
a growing role of scale economies and network effects rather than by increased com-
petition. Other works also stress the role of technological change in driving market
power and markups. Guellec and Paunov (2017) point out that in markets where com-
petition is based on digital innovation, ”winner-take-all” dynamics allow winners to
extract a rent, by raising the price of output and/or lowering the price of inputs, and
this mechanism is reinforced by globalization, which allows successful firms to expand
beyond their national markets. Calligaris et al. (2018) find that firms in the top-digital
sectors display on average higher markups than firms operating in low-digital sectors
and that this gap is larger nowadays than in the past. Aghion et al. (2019) build a
model of endogenous growth through innovation and creative destruction that links the
recent trends of productivity and markups to the IT improvements in the mid-1990s
to mid-2000s which allowed the most efficient firms to expand their boundaries.
2.4 Entry barriers and technology diffusion
The findings on increases in concentration and markups resulting from few successful
firms’ innovation capacity raise the question of why the great majority of firms lags
5

behind, apparently unable to exploit technological advancements and to benefit from
knowledge spillovers. Akcigit and Ates (2019) suggest that data-dependent production
processes allow large and established firms not just to exploit data-network effects, but
also to prevent potential competitors from entering markets where incumbents’ success
rests on hard-to-reproduce (or hard-to-buy) intangible assets, such as large proprietary
consumer databases. Moreover, large and more productive firms are more likely to
be able to acquire relevant complementary managerial and technical skills (Andrews
et al., 2016; Bessen, 2017), to exploit patent protection through the creation of patent
thickets (Bessen, 2017; Guellec and Paunov, 2017), or to use big data in financial
markets to reduce the cost of capital (Begenau et al., 2018). Finally, Akcigit and Ates
(2019) and Guellec and Paunov (2017) also highlight that large firms frequently buy
patents of potential competitors or successful startups. While the macro market power
literature has widely investigated the links between average industry-level market power
(although often using concentration as a measure of market power) and technology
adoption, less attention has been devoted to the drivers of markups dispersion between
firms within and between industries. Cassiman and Vanormelingen (2013) estimate
the impact of innovation activities on firms’ markups for a panel of 4,600 Spanish
manufacturing firms between 1990 and 2008. They find that both product and process
innovations are associated with higher markups although the effect is stronger for
smaller firms. The intensity of competition also matters. Product innovations do not
lead to sizeable markups increases in atomistic nor in monopolistic markets, while
process innovations only play a role in less competitive markets where cost savings are
more likely retained by firms.
2.5 Global Value Chains
International trade and participation into Global Value Chains (GVC) may also af-
fect markups. Trade openness is typically thought to yield pro-competitive effects.
Moreover, it is well known that the most productive firms tend to be larger and are
more likely to internationalize and being involved into GVC operations. But larger
and more productive firms also tend to face more rigid demand, i.e. have more market
power, and can set higher markups. These firms can benefit from GVC-related cost
reductions as they are only partially passed into lower prices, thus, allowing them to
increase their markups (Antras, 2019). GVC participation and, more specifically cost
reductions stemming from the use of imported inputs, can therefore represent a specific
channel affecting markups. De Loecker et al. (2016) document that Indian firms im-
porting inputs from abroad increased their markups after an input trade liberalization.
The 2020 World Development Report (World Bank, 2020) shows evidence suggesting
that the correlation between markups and GVC participation might actually be am-
6

biguous. For instance, for firms in developed countries GVC participation is associated
with rising markups, while the opposite holds for firms in developing countries. The
sign of the correlation is thus likely to depend on the modality through which firms
participate into GVC. Different positioning implies different bargaining power. Lead
firms in GVC, while incurring in increased fixed costs due to complex internation-
alization strategy, may benefit from input cost reductions (or quality improvements)
relative to other GVC particpants. The GVC-driven increased markups are also likely
to contribute to a lower labour share (Karabarbounis and Neiman, 2014).
If cost reductions due to imported inputs may imply higher markups for the firms
involved, the aggregate country-level effect remains ambiguous. When cost reductions
are only partially passed-through, it is possible to have rising markups and declining
prices. This may force local competitors to lower their prices as well, but without the
benefit of GVC-related cost reductions, thus forcing them to reduce their markups.
GVC may thus increase market power of (lead) firms involved but at the same time
yield pro-competitive effects on their competitors (or on GVC-firms in low-end tasks).
The net effect at the country-industry level is thus ambiguous.
While we are not aware of any paper addressing directly the relationship between
GVC and markups at the country or industry level, the idea that GVC may contribute
to moderate price increases is in line with some macro-level findings. For instance,
de Soyres and Franco (2019), Bianchi and Civelli (2015) and Auer et al. (2017) argue
that GVC and lower input prices have contributed to lower inflation. Using disaggre-
gated data for the EU, Chen et al. (2009) show that openness reduces both prices and
markups while raising productivity.
3 Measurement issues
The most commonly used measure of market power in the macroeconomic literature
are concentration indexes. They are simple to calculate and intuitively appealing. But
they also suffer from several shortcomings.2
First, concentration indexes are calculated on revenues and do not take into account
profits nor price-cost margins, which instead define the extent of market power more
accurately.
Second, any meaningful concentration measure requires an appropriate definition
of the relevant market. This is not obvious both from a geographical point of view as
well as with respect to the degree of substitutability between different goods/services.
Third, concentration is a market outcome rather than a determinant of the level of
competition: focusing on it may be misleading as it can be negatively associated with
2A deeper discussion can be found in Syverson (2019).
7
price-cost margins (as is the case with monopolistically competitive markets) and pos-
itively correlated with competition and welfare to the extent that higher concentration
might arise from increased product substitutability.
Because of these shortcomings, markups may be preferable to simpler concentra-
tion indexes. In fact, markups are the most rigorous measure of market power on
theoretical grounds. However, markups also presents important issues in terms of data
requirements and measurement methods.
A direct estimate of markups requires data on prices and marginal costs at the firm
level. As the latter are not readily available, different estimation methods have been
proposed.
The demand approach (Berry et al., 1995), used in the micro literature, requires
assumptions on market competition and consumers’ behaviour and to estimate the
demand function using data on prices, market shares and product attributes.
The production approach of De Loecker and Warzynski (2012) and De Loecker and
Eeckhout (2017) uses accounting data to estimate a firm’s production function, and
notably the output elasticity of variable inputs as, following Hall (1988), markup is
equal to the ratio between the elasticity of output to a variable input and the share of
revenues the input is paid.
The production approach is relatively parsimonious both in terms of assumptions
and data inputs, but it is not exempt from critiques related to the identification of
variable costs and the possible discrepancies in accounting practices, simultaneity and
selection biases, functional dependence problems (Ackerberg et al., 2015), the biases
introduced by multi-product firms or by the use of industry-level price deflators.
An alternative approach, that we adopt in this paper, is to measure markups as the
ratio of price to average variable cost, which is equal to the ratio between revenues and
total variable costs, once both of these are divided by quantity produced. Certainly
simpler than the former, this method, relying on national accounts data, improves the
comparability across countries and sectors at the cost of assuming equality between
average variable cost and marginal cost, which would only be true if marginal cost was
constant at all quantity levels.
3.1 Markup estimation methods
The demand approach (Berry et al., 1995) requires to define a model of competition
and consumers’ behaviour, and to derive a demand system that can be estimated using
data on prices, market shares and product attributes. Given the estimated elasticities
of substitution across the goods considered, markups can then be recovered from the
first-order conditions, after specifying a model of competition. Due to the large amount
of data (and assumptions) it requires, such approach, while appropriate for market-level
8
studies, is ill-suited for larger and less homogeneous aggregates.
The production approach, recently made popular by De Loecker and Warzynski
(2012) and De Loecker and Eeckhout (2017), uses accounting data to estimate a firm’s
production function, and notably the output elasticity of variable inputs. It relies on
the work of Hall (1988) showing that, under cost minimization, for any variable input,
the firm’s markup is equal to the ratio between the elasticity of output to that variable
input, and the share of revenues the input is paid. In formula for every firm i at time
t:
µit =βνitsνit
(1)
where µ is the multiplicative markup and βν is the elasticity of output with respect
to the variable input ν obtained from the firm’s production function, and sν is the
share of revenues paid to the variable input supplier.
The production approach is more parsimonious as it only needs panel data on firms’
inputs and output together with assuming cost minimization, the existence of (at least)
one input of production that can be adjusted without frictions and some identifying
assumptions to avoid bias from the potential correlation between productivity shocks
and variable input levels.
However, a number of issues have recently been raised regarding the production
approach. The demarcation between variable and fixed costs does not coincide with
the accounting classification of expenses. While most of the literature adopts the
Cost of Goods Sold (COGS) as the variable costs, Syverson (2019) points out that
there are several categories of costs not included in COGS that can be deemed as
variable and, vice versa, that some costs in COGS might arguably be fixed. Also,
discrepancies may arise in accounting practices across sectors and countries, and even
across firms when we extend the analysis beyond the limited sample of publicly listed
firms. A further reason for caution is the potential bias that can derive from the
application of industry-level deflators to firms’ or from imposing a common technology
across firms in an industry. Finally, Raval (2020) remarks that while Hicks-neutral
productivity is generally assumed, if productivity is instead labor augmenting, and
inputs are complements, more productive firms will have lower output elasticities of
labor and higher elasticities of materials than less productive firms, which may lead to
systematically different markups estimates when different inputs are used.
A different method, based on aggregate macroeconomic data, is used by Eggertsson
et al. (2018) who exploit the fact that under constant returns to scale production,
markups are proportional to the profit share (PS) of the economy (in particular, they
are equal to the inverse of the share of production not accounted for by pure profits)
in formula:
9

µ =1
1 − PS(2)
As the profit share is computed by subtracting labor and capital income from
output, the main weaknesses here lie in the estimation of the latter depending on
factors which are difficult to measure or uncertain, and in the omission of overhead
costs.
An alternative approach to measuring markups, also based on aggregate data, is
to look at the ratio of price to average variable costs, which is equal to the ratio
between revenues and total variable costs, once both of these are divided by quantity
produced. Certainly simpler than the production approach, both these alternative
methods, relying on national accounts data, also improve the comparability across
countries and sectors.
Applying a related approach to plant-level data, Shuichiro and Mari (2019) also
approximate output elasticities from cost shares and estimate markups as revenues di-
vided by the total costs (which is equivalent to the cost share of an input divided by the
revenue share of that input). Such “cost approaches”, by imposing that first-order con-
ditions are always met, could be inconsistent with the timing assumption traditionally
presumed, as labor hiring and capital installation may take longer than purchasing
intermediate inputs. Thus, such approaches may be appropriate in the medium to
long run, and indeed the markup dynamics estimated for Japan by Shuichiro and Mari
(2019) are consistent with the theoretical predictions, exhibiting a positive correlation
with prices, output, and productivity, and a negative relation with unit costs, which is
not always the case with markups computed with the production approach.
Beyond the above methodological questions, cross-country studies must deal with
the additional issue of data harmonization and comparability.3 In this paper, to com-
pare the evolution of markups across four major European economies, we need reliable
and comparable data. National accounts data are highly harmonized at the European
level and guarantee representativeness at national and sectoral level. In this work, we
thus rely this data source. In particular, we calculate markup µ as the ratio of price to
average variable cost, which is equal to the ratio between revenues and total variable
costs, once both of these are divided by quantity produced assuming equality between
average variable cost and marginal cost, which would only be true if marginal cost was
constant at all quantity levels. In formula:
µ =Output
Intermediate Consumption+ Compensation of Employees∗(3)
3For further details, related to this paper, on markup measurement at the micro and macro level,see the work by Rinaldi and Oropallo (mimeo, 2020).
10
where
Compensation of Employees∗ = CE +CE
Employees DomesticSelf Employed (4)
Differently from De Loecker and Warzynski (2012) and De Loecker and Eeckhout
(2017) our measure of markup is not estimated but it is a direct one observed ex-
post. To calculate it we can use two different data sources: national accounts (NA) or
structural business statistics (SBS) with significant difference depending on the data
sources. To check the robustness of our markup measure we compare the NA markup
series to the one obtained using SBS data calculated as:
µ =Turnover
Purchase of goods and services+ Personnel cost∗(5)
where
Personnel cost∗ = Personnel costs+Personnel cost
N. EmployeesN. Unpaid Employed (6)
Figure 1 represent the ratio between our markup calculated using NA data and the
ones obtained using SBS in Manufacturing for the 4 countries included in our sample.
In the time span from 2008 to 2017 the difference between the two markups is lower
for Germany and Italy and higher for Spain. Overall the measures are quite similar in
our sample with the differences amounting to few percentage points. Relative to the
NA markup series the ones calculated using SBS tend to increasingly underestimate
markups over time, especially for Spain, Germany and France, while Italian NA and
SBS data seem more consistent.
11

Figure 1: Ratio between µNA and µSBS for Manufacturing
0.94
0.96
0.98
1.00
1.02
1.04
1.06
1.08
1.10
2008 2009 2010 2011 2012 2013 2014 2015 2016 2017
Germany Spain France Italy
Source: elaborations on Eurostat data (Rinaldi and Oropallo).
4 Evidence and stylized facts
4.1 Cross-country trends
Most empirical studies on market power and productivity developed so far focused their
attention on the US emphasizing that the increasing extent of imperfect competition
in the US firms might partly explain aggregate productivity slowdown. On the other
hand, the evidence for the European countries is still scant and as a consequence
comparative analysis for markups dynamics is at the very beginning. This paper aims
at providing some evidence in this respect and to offer new evidence on markup and
productivity trends within the EU market economies. Therefore, the main question is:
what are the markups dynamics in the EU? Are they similar to the US ones?
To get the sense of the differences between aggregate markup size and dynamics
between the US and four big EU countries, Germany, Italy, Spain and France, Figure
2 shows markups for the market sectors over the years 1995-2017.4 The main evidence
can be summarized as follows.
Stylized fact 1 - Aggregate markup dynamics of EU countries are differentiated,
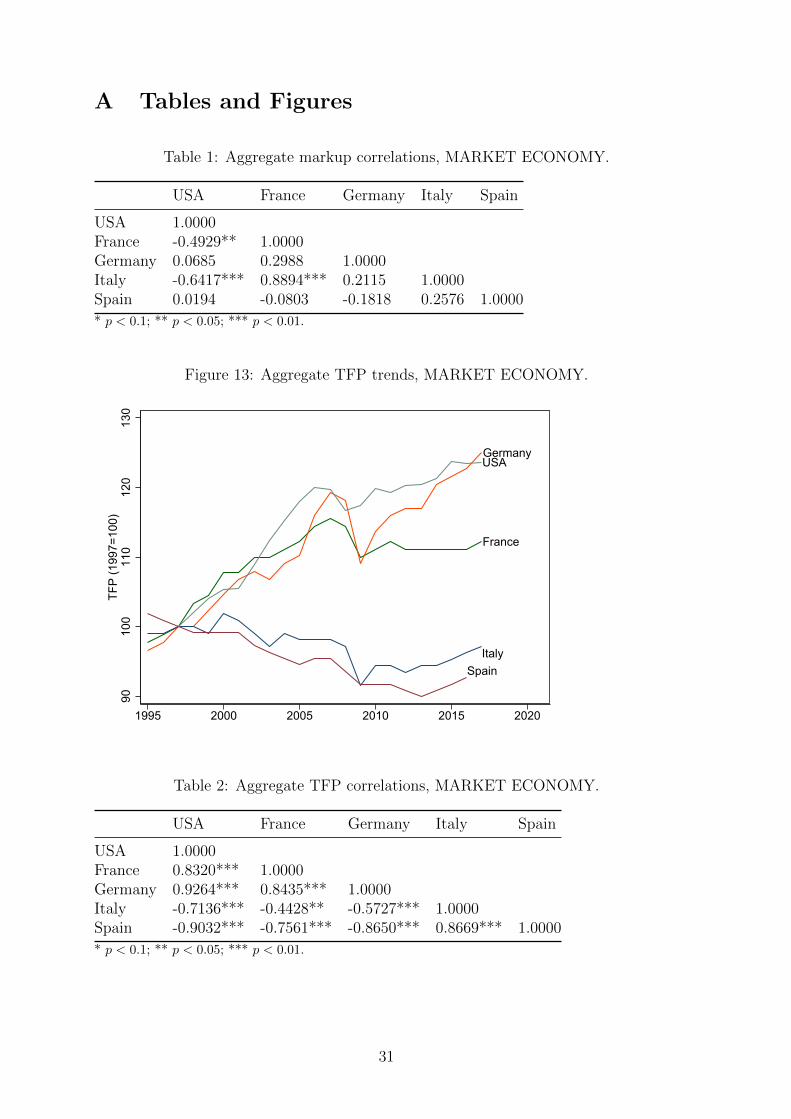
4Table 1 in the Appendix reports the correlation matrix. Correlations are generally low and non-significant, except for Italy and France, confirming that aggregate markups followed differentiatedtrends.
12

but markups are lower and do not seem to follow the increasing trend observed in
the US. Markups were instead stable or on a decreasing trend at least until the 2008
financial crisis.
In the US, markup increased steadily since 2000 outpacing the EU economies. In
Spain there has been a slight decreasing trend between 1995 and 2006, followed by a
rising tendency started after the financial crisis. Italy, Germany and France kept a
decreasing dynamics since the beginning of the period up to 2008 when Germany and
Italy experienced an upward trend while France slowed down. The declining trend
that characterized all the EU countries between 1995 and 2000 was likely driven by
the improvements in intra-EU competition fostered by both the inception of the Single
Market in 1993 and of the monetary union in 1999. Then the cyclical drop started
in 2008, because of the financial crisis, hugely affected the competitive environment in
the European economies (Weche and Wambach, 2018) who experienced a sharp fall in
average market power (markups). But, since 2010, many EU economies, Spain, Ger-
many and Italy among them, started a process of industry restructuring associated to
a rise in firm level markup likely affecting the aggregate figures for the market sector
(Figure 2). Firm level markup estimates for EU firms reveal a significant heterogenen-
ity within them, with some countries (Spain, Italy and Germany) showing increasing
average post crisis trend and others (France) markedly decreasing dynamics.
Figure 2: Aggregate markup trends in US, France, Germany, Italy and Spain.
France
GermanyItaly
Spain
USA
1.1
1.15
1.2
1.25
Mar
kup
1995 2000 2005 2010 2015 2020
13
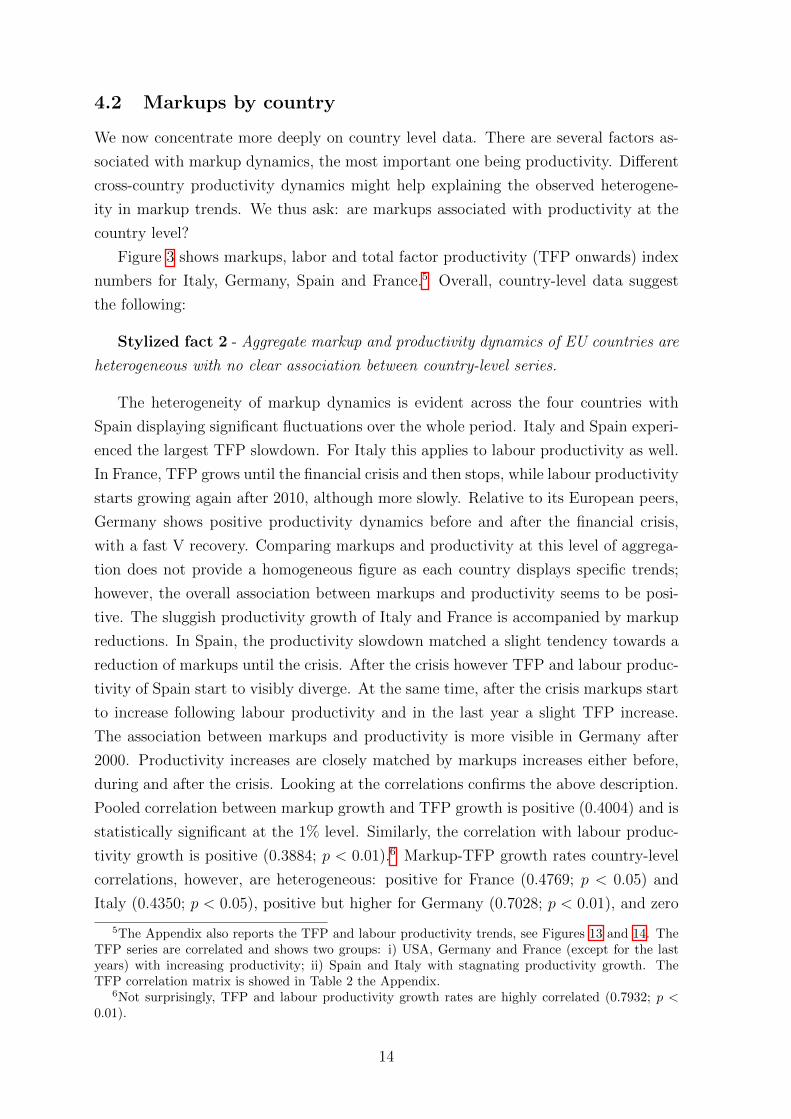
4.2 Markups by country
We now concentrate more deeply on country level data. There are several factors as-
sociated with markup dynamics, the most important one being productivity. Different
cross-country productivity dynamics might help explaining the observed heterogene-
ity in markup trends. We thus ask: are markups associated with productivity at the
country level?
Figure 3 shows markups, labor and total factor productivity (TFP onwards) index
numbers for Italy, Germany, Spain and France.5 Overall, country-level data suggest
the following:
Stylized fact 2 - Aggregate markup and productivity dynamics of EU countries are
heterogeneous with no clear association between country-level series.
The heterogeneity of markup dynamics is evident across the four countries with
Spain displaying significant fluctuations over the whole period. Italy and Spain experi-
enced the largest TFP slowdown. For Italy this applies to labour productivity as well.
In France, TFP grows until the financial crisis and then stops, while labour productivity
starts growing again after 2010, although more slowly. Relative to its European peers,
Germany shows positive productivity dynamics before and after the financial crisis,
with a fast V recovery. Comparing markups and productivity at this level of aggrega-
tion does not provide a homogeneous figure as each country displays specific trends;
however, the overall association between markups and productivity seems to be posi-
tive. The sluggish productivity growth of Italy and France is accompanied by markup
reductions. In Spain, the productivity slowdown matched a slight tendency towards a
reduction of markups until the crisis. After the crisis however TFP and labour produc-
tivity of Spain start to visibly diverge. At the same time, after the crisis markups start
to increase following labour productivity and in the last year a slight TFP increase.
The association between markups and productivity is more visible in Germany after
2000. Productivity increases are closely matched by markups increases either before,
during and after the crisis. Looking at the correlations confirms the above description.
Pooled correlation between markup growth and TFP growth is positive (0.4004) and is
statistically significant at the 1% level. Similarly, the correlation with labour produc-
tivity growth is positive (0.3884; p < 0.01).6 Markup-TFP growth rates country-level
correlations, however, are heterogeneous: positive for France (0.4769; p < 0.05) and
Italy (0.4350; p < 0.05), positive but higher for Germany (0.7028; p < 0.01), and zero
5The Appendix also reports the TFP and labour productivity trends, see Figures 13 and 14. TheTFP series are correlated and shows two groups: i) USA, Germany and France (except for the lastyears) with increasing productivity; ii) Spain and Italy with stagnating productivity growth. TheTFP correlation matrix is showed in Table 2 the Appendix.
6Not surprisingly, TFP and labour productivity growth rates are highly correlated (0.7932; p <0.01).
14

(−0.0438; insignificant) for Spain. Similar results hold for labour productivity.7
All in all, aggregate markups and productivity trends seem to display a positive
correlation for the four EU countries analyzed together, but the picture is heterogeneous
at the country-level.
Figure 3: Aggregate markups and productivity trends in France, Germany, Italy andSpain.
9010
011
012
013
0
9698
100
102
1995 2000 2005 2010 2015
France
9010
011
012
013
0
9698
100
102
1995 2000 2005 2010 2015
Germany
9010
011
012
013
0
9698
100
102
1995 2000 2005 2010 2015
Italy
9010
011
012
013
0
9698
100
102
1995 2000 2005 2010 2015
Spain
Markup TFP (rhs) L prod (rhs)
While aggregate trends raise important questions on the different degrees to which
EU countries experienced the productivity slowdown, they do not seem to improve our
understanding of markup dynamics in the four sample EU country. Arguably, more
disaggregated data are needed and more factors must be considered. A first step in
this direction is to consider that, by construction, markup movements result from both
output and cost components. It is thus informative to decompose markups and ask:
what is the role of output and cost components in aggregate markups trends in the
EU?
We investigate this in Figures 4 and 5, where we single out output, intermediate
cost and labour cost. We find that, despite the heterogeneous dynamics, markup
7See Table 3 in the Appendix for details.
15

components show a similar pattern in all the four EU countries analyzed:
Stylized fact 3 - Since 1995, intermediate costs have increased more than output,
thus contributing to attenuate markup growth, while labour costs did not contribute
much to markup changes. The heterogeneous markup dynamics result from the different
balance of these forces.
Markups can be decomposed as follows:
∆µ
µ≈ Output effect + Int. cost effect + L cost effect (7)
Output effect ≡ ∆ Output
Output(8)
Int. cost effect ≡ −∆ Int. cost
Int. cost
Int. cost
Int. cost + L cost(9)
L cost effect ≡ −∆ L cost
L cost
L cost
Int. cost + L cost(10)
Figure 4 displays the contribution of each component to annual markups growth.
Intermediate costs constitute the majority of costs and their importance has increased
over time from about 58% to about 65%, and symmetrically the share of labour costs
has reduced from about 42% to 35%. In the Figure, this implies that the intermediate
cost effect is larger than the labour cost effect. Markup growth has therefore been
moderated mainly by intermediate costs rather than by labour costs.8
8It is important to note that the components of the labour share of output also enter into thenational-accounting-based definition of markup. Other things equal, i.e. given intermediate costs,a reduction in the labour share must be associated to markup increases; but intermediate costs arenot constant and we have seen that they matter much more than labour costs for markup growth.Therefore the correlation between markups and labour share is not obviously negative and remainsan empirical matter, as we discuss later in the paper.
16

Figure 4: Decomposition of markups growth.
9610
010
4
-13
013
1995 2000 2005 2010 2015
France
9610
010
4
-13
013
1995 2000 2005 2010 2015
Germany
9610
010
4
-13
013
1995 2000 2005 2010 2015
Italy
9610
010
4
-13
013
1995 2000 2005 2010 2015
Spain
Markup (1995=100, rhs) Markup growth (%)Output effect (%) Intermediate cost effect (%)Labour cost effect (%)
In Figure 5, we display more clearly the evolution of each component over the en-
tire period by setting 1995 to 100. In France and Germany, all the components grow
over the period. In Italy and Spain, instead, they stop after the financial crisis. Some
common trends emerge. In all countries, since 1995, labour cost has increased less than
output and less than intermediate cost. This is most visible in Spain and Germany. On
the contrary, intermediate cost has increased more than the other components. These
two cost entries have therefore increased more (intermediate cost) and less (labour cost)
than output. This implies that while the labour share of output has decreased in all
countries, the intermediate cost share has increased. Growth in labour costs has not
been large enough to significantly moderate markups growth, however increasing in-
termediate costs contributed to avoid markup increases. Aggregate markups dynamics
are the results of these opposite forces.
17
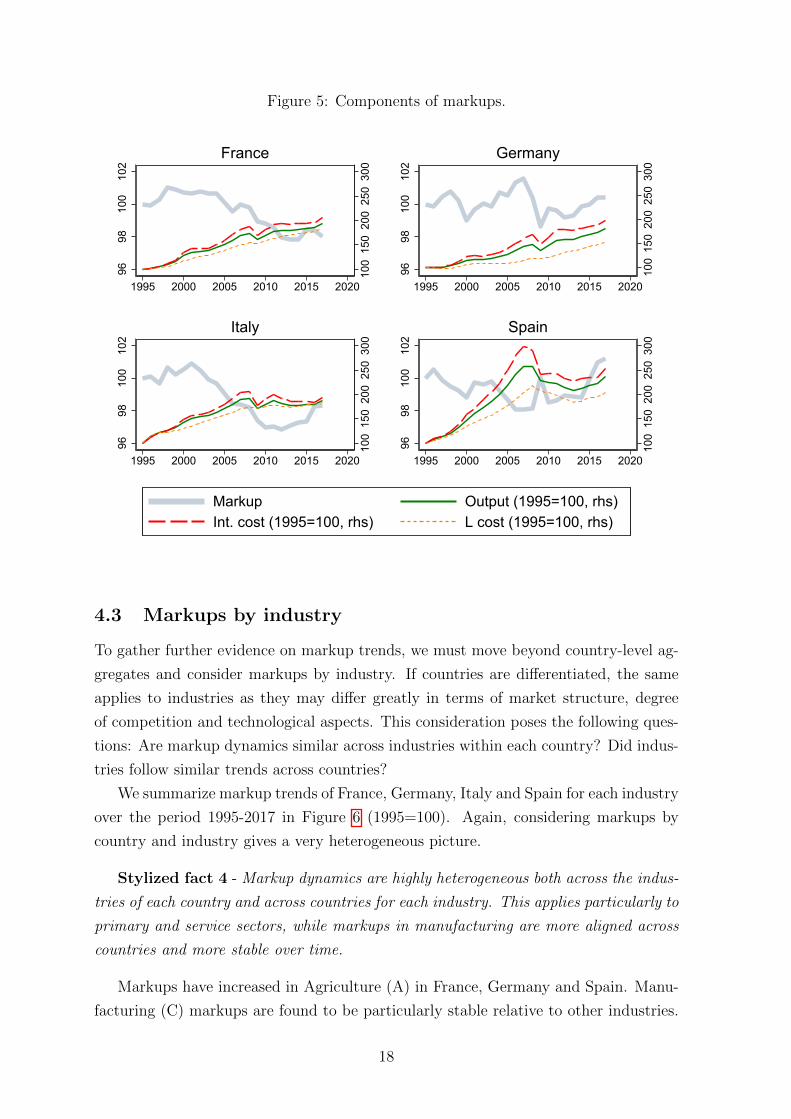
Figure 5: Components of markups.
100
150
200
250
300
9698
100
102
1995 2000 2005 2010 2015 2020
France
100
150
200
250
300
9698
100
102
1995 2000 2005 2010 2015 2020
Germany
100
150
200
250
300
9698
100
102
1995 2000 2005 2010 2015 2020
Italy
100
150
200
250
300
9698
100
102
1995 2000 2005 2010 2015 2020
Spain
Markup Output (1995=100, rhs)Int. cost (1995=100, rhs) L cost (1995=100, rhs)
4.3 Markups by industry
To gather further evidence on markup trends, we must move beyond country-level ag-
gregates and consider markups by industry. If countries are differentiated, the same
applies to industries as they may differ greatly in terms of market structure, degree
of competition and technological aspects. This consideration poses the following ques-
tions: Are markup dynamics similar across industries within each country? Did indus-
tries follow similar trends across countries?
We summarize markup trends of France, Germany, Italy and Spain for each industry
over the period 1995-2017 in Figure 6 (1995=100). Again, considering markups by
country and industry gives a very heterogeneous picture.
Stylized fact 4 - Markup dynamics are highly heterogeneous both across the indus-
tries of each country and across countries for each industry. This applies particularly to
primary and service sectors, while markups in manufacturing are more aligned across
countries and more stable over time.
Markups have increased in Agriculture (A) in France, Germany and Spain. Manu-
facturing (C) markups are found to be particularly stable relative to other industries.
18
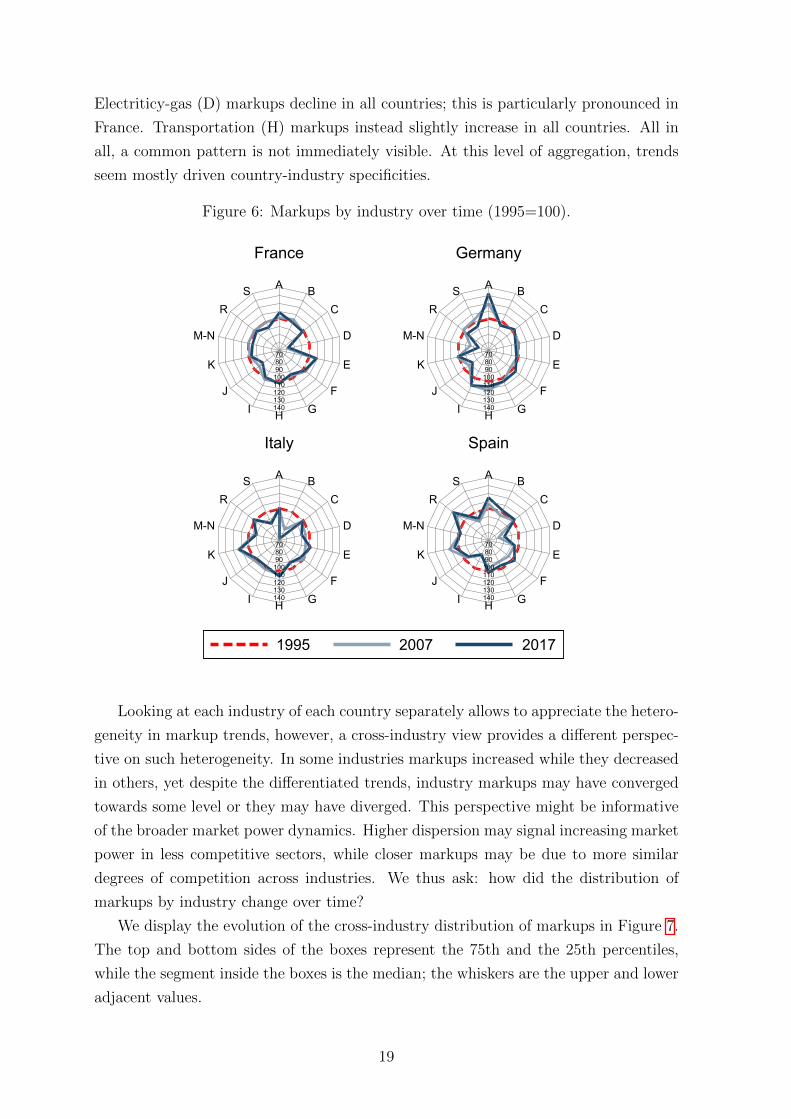
Electriticy-gas (D) markups decline in all countries; this is particularly pronounced in
France. Transportation (H) markups instead slightly increase in all countries. All in
all, a common pattern is not immediately visible. At this level of aggregation, trends
seem mostly driven country-industry specificities.
Figure 6: Markups by industry over time (1995=100).
A BC
D
E
FGHI
J
K
M-N
RS
708090
100110120130140
France
A BC
D
E
FGHI
J
K
M-N
RS
708090
100110120130140
Germany
A BC
D
E
FGHI
J
K
M-N
RS
708090
100110120130140
Italy
A BC
D
E
FGHI
J
K
M-N
RS
708090
100110120130140
Spain
1995 2007 2017
Looking at each industry of each country separately allows to appreciate the hetero-
geneity in markup trends, however, a cross-industry view provides a different perspec-
tive on such heterogeneity. In some industries markups increased while they decreased
in others, yet despite the differentiated trends, industry markups may have converged
towards some level or they may have diverged. This perspective might be informative
of the broader market power dynamics. Higher dispersion may signal increasing market
power in less competitive sectors, while closer markups may be due to more similar
degrees of competition across industries. We thus ask: how did the distribution of
markups by industry change over time?
We display the evolution of the cross-industry distribution of markups in Figure 7.
The top and bottom sides of the boxes represent the 75th and the 25th percentiles,
while the segment inside the boxes is the median; the whiskers are the upper and lower
adjacent values.
19
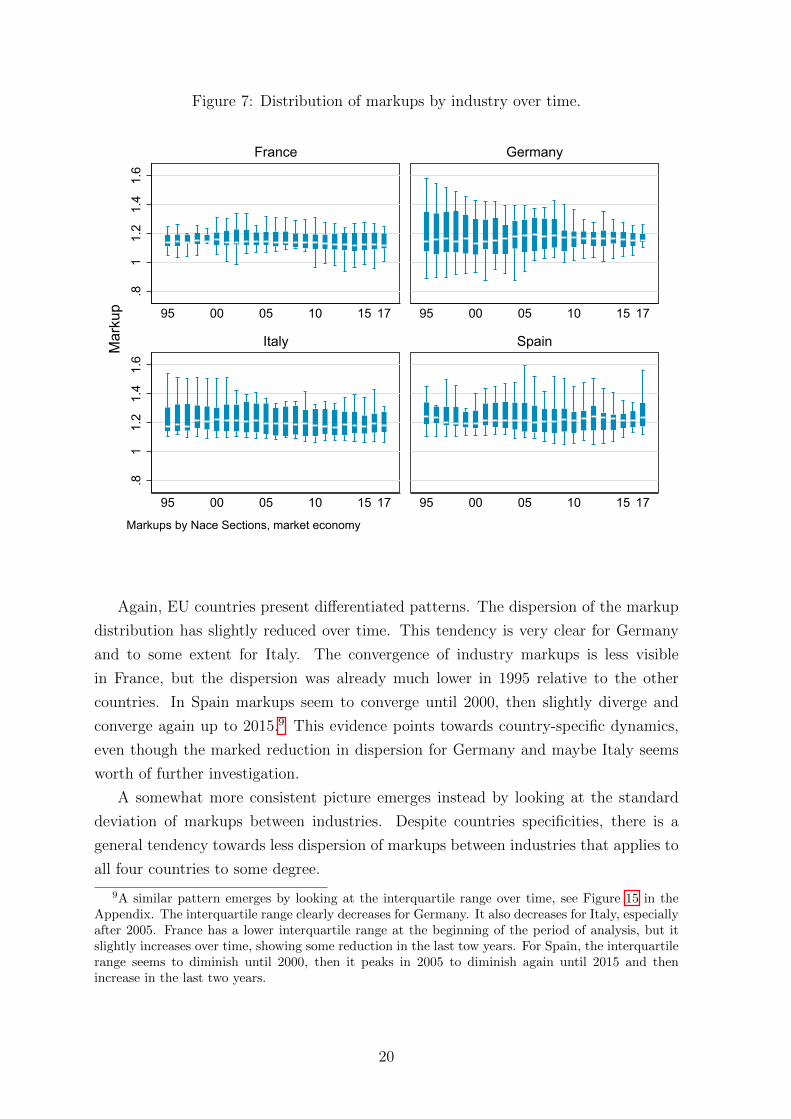
Figure 7: Distribution of markups by industry over time.
.81
1.2
1.4
1.6
.81
1.2
1.4
1.6
95 00 05 10 15 17 95 00 05 10 15 17
95 00 05 10 15 17 95 00 05 10 15 17
France Germany
Italy SpainMar
kup
Markups by Nace Sections, market economy
Again, EU countries present differentiated patterns. The dispersion of the markup
distribution has slightly reduced over time. This tendency is very clear for Germany
and to some extent for Italy. The convergence of industry markups is less visible
in France, but the dispersion was already much lower in 1995 relative to the other
countries. In Spain markups seem to converge until 2000, then slightly diverge and
converge again up to 2015.9 This evidence points towards country-specific dynamics,
even though the marked reduction in dispersion for Germany and maybe Italy seems
worth of further investigation.
A somewhat more consistent picture emerges instead by looking at the standard
deviation of markups between industries. Despite countries specificities, there is a
general tendency towards less dispersion of markups between industries that applies to
all four countries to some degree.
9A similar pattern emerges by looking at the interquartile range over time, see Figure 15 in theAppendix. The interquartile range clearly decreases for Germany. It also decreases for Italy, especiallyafter 2005. France has a lower interquartile range at the beginning of the period of analysis, but itslightly increases over time, showing some reduction in the last tow years. For Spain, the interquartilerange seems to diminish until 2000, then it peaks in 2005 to diminish again until 2015 and thenincrease in the last two years.
20
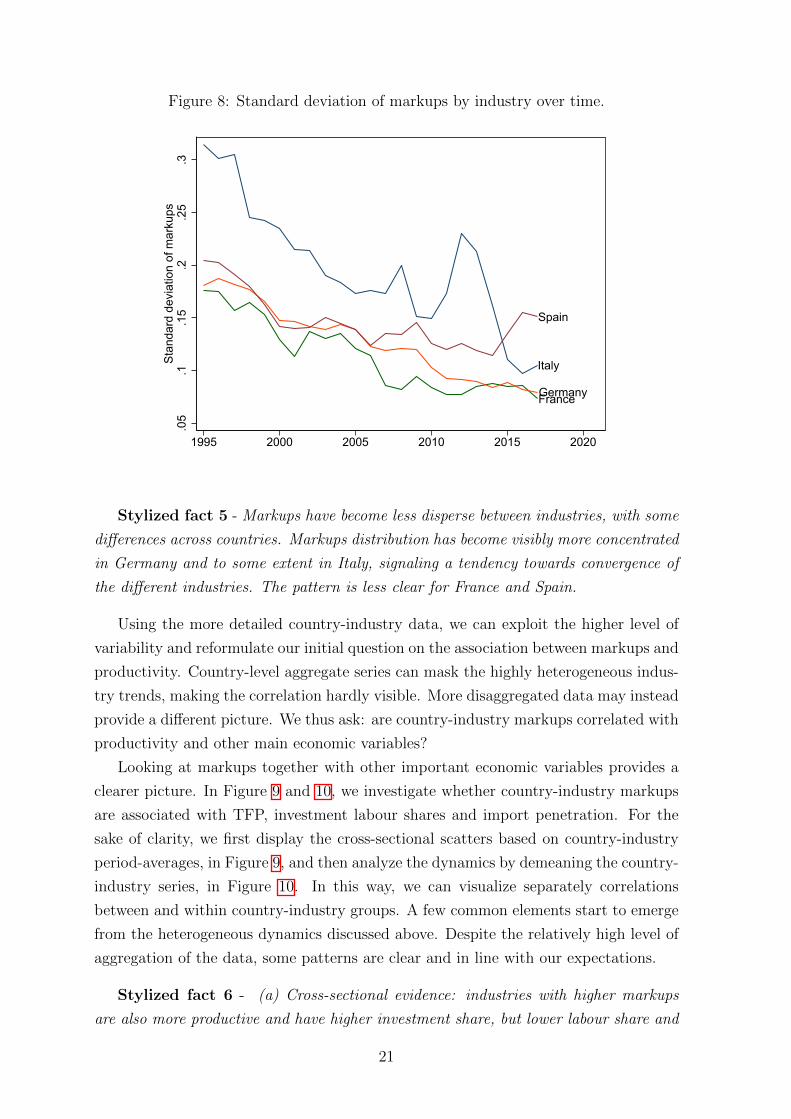
Figure 8: Standard deviation of markups by industry over time.
FranceGermany
Italy
Spain
.05
.1.1
5.2
.25
.3St
anda
rd d
evia
tion
of m
arku
ps
1995 2000 2005 2010 2015 2020
Stylized fact 5 - Markups have become less disperse between industries, with some
differences across countries. Markups distribution has become visibly more concentrated
in Germany and to some extent in Italy, signaling a tendency towards convergence of
the different industries. The pattern is less clear for France and Spain.
Using the more detailed country-industry data, we can exploit the higher level of
variability and reformulate our initial question on the association between markups and
productivity. Country-level aggregate series can mask the highly heterogeneous indus-
try trends, making the correlation hardly visible. More disaggregated data may instead
provide a different picture. We thus ask: are country-industry markups correlated with
productivity and other main economic variables?
Looking at markups together with other important economic variables provides a
clearer picture. In Figure 9 and 10, we investigate whether country-industry markups
are associated with TFP, investment labour shares and import penetration. For the
sake of clarity, we first display the cross-sectional scatters based on country-industry
period-averages, in Figure 9, and then analyze the dynamics by demeaning the country-
industry series, in Figure 10. In this way, we can visualize separately correlations
between and within country-industry groups. A few common elements start to emerge
from the heterogeneous dynamics discussed above. Despite the relatively high level of
aggregation of the data, some patterns are clear and in line with our expectations.
Stylized fact 6 - (a) Cross-sectional evidence: industries with higher markups
are also more productive and have higher investment share, but lower labour share and
21

lower import penetration. (b) Time-series evidence: within industries, markup growth
is correlated positively with productivity growth and, to a lesser extent, to investment
share increases, while negatively with labour share reductions and uncorrelated with
import penetration.
Industries with higher productivity tend to have higher markups, and those with
faster productivity growth also tend to increase their markups faster. This may signal
the fact that efficiency improvements tend to increase market power of firms, perhaps
by granting larger market shares. On the contrary, industries with higher labour shares
are characterized by lower markups, and those that increase their markups more tend
to reduce their labour shares. Again this negative association is consistent with the
available evidence from the USA. Markups are associated with higher investments,
including on in innovation; however, changes over time do not seem correlated. Lastly,
there is a negative association between markups and import penetration. This may
signal the fact that import competition has pro-competitive effects.
Figure 9: Between country-industry patterns: Markups vs. TFP, labour share,investments, imports; country-industry period averages.
0.2
.4.6
Mar
kup
(ln),
perio
d av
erag
e
80 100 120 140 160TFP (2010=100), period average
0.2
.4.6
Mar
kup
(ln),
perio
d av
erag
e
.1 .2 .3 .4Labour share, period average
0.2
.4.6
Mar
kup
(ln),
perio
d av
erag
e
0 .05 .1 .15 .2 .25Investment share, period average
0.2
.4.6
Mar
kup
(ln),
perio
d av
erag
e
0 .1 .2 .3 .4 .5Import penetration, period average
A: Agric. B: Mining C: Manuf. D: Elec, gas E: WaterF: Constr. G: Sales H: Transp. I: Accomm. J: ICTK: Finance M-N Prof/Admin R: Entertain S: Other serv.
22
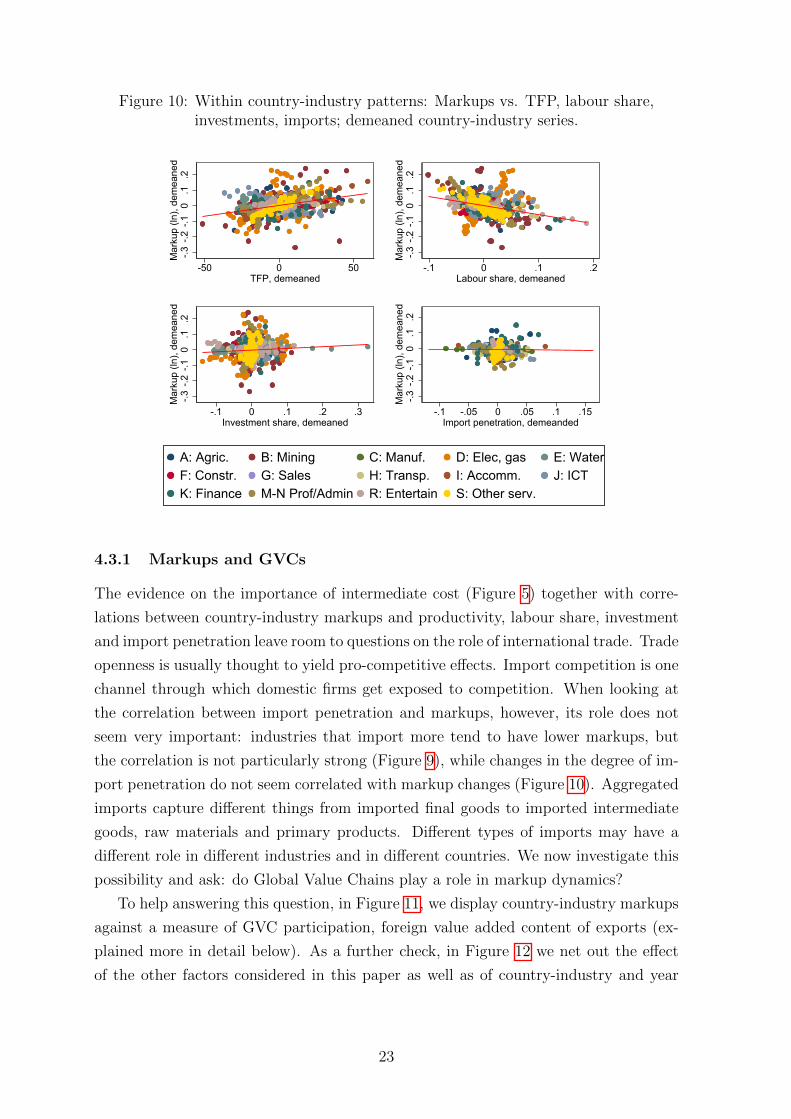
Figure 10: Within country-industry patterns: Markups vs. TFP, labour share,investments, imports; demeaned country-industry series.
-.3-.2
-.10
.1.2
Mar
kup
(ln),
dem
eane
d
-50 0 50TFP, demeaned
-.3-.2
-.10
.1.2
Mar
kup
(ln),
dem
eane
d
-.1 0 .1 .2Labour share, demeaned
-.3-.2
-.10
.1.2
Mar
kup
(ln),
dem
eane
d
-.1 0 .1 .2 .3Investment share, demeaned
-.3-.2
-.10
.1.2
Mar
kup
(ln),
dem
eane
d-.1 -.05 0 .05 .1 .15
Import penetration, demeanded
A: Agric. B: Mining C: Manuf. D: Elec, gas E: WaterF: Constr. G: Sales H: Transp. I: Accomm. J: ICTK: Finance M-N Prof/Admin R: Entertain S: Other serv.
4.3.1 Markups and GVCs
The evidence on the importance of intermediate cost (Figure 5) together with corre-
lations between country-industry markups and productivity, labour share, investment
and import penetration leave room to questions on the role of international trade. Trade
openness is usually thought to yield pro-competitive effects. Import competition is one
channel through which domestic firms get exposed to competition. When looking at
the correlation between import penetration and markups, however, its role does not
seem very important: industries that import more tend to have lower markups, but
the correlation is not particularly strong (Figure 9), while changes in the degree of im-
port penetration do not seem correlated with markup changes (Figure 10). Aggregated
imports capture different things from imported final goods to imported intermediate
goods, raw materials and primary products. Different types of imports may have a
different role in different industries and in different countries. We now investigate this
possibility and ask: do Global Value Chains play a role in markup dynamics?
To help answering this question, in Figure 11, we display country-industry markups
against a measure of GVC participation, foreign value added content of exports (ex-
plained more in detail below). As a further check, in Figure 12 we net out the effect
of the other factors considered in this paper as well as of country-industry and year
23

specificities. The pattern that emerges is very clear.
Stylized fact 7 - Markups are negatively correlated with (backward) Global Value
Chain participation and the use of imported inputs.
In the figures, we consider foreign value added content of exports. This is a measure
of the share of foreign value added incorporated into exports of each country-industry.
This measure is derived from cross-country input-output tables (TiVA) using a method-
ology by Koopman et al. (2010) and Koopman et al. (2014).10 A higher FVAX share
signals a deeper integration into GVC and, more specifically, a more intense backward
participation due to the use of intermediate inputs. 11 shos that there is a clear nega-
tive correlation between GVC participation and markups: a higher GVC participation
tends to be associated with lower markups.
In Figure 12, we explore this correlation further. Since we know that markups are
correlated with other country-level variables, we need to check whether GVC play a
role even after we control for other factors. Thus, we first run a panel regression of
markups controlling for TFP, labour share, investment and import penetration, we
then check how the residuals are correlated with FVAX share (the regression includes
country-industry and year fixed effects). The correlation is now even stronger: GVC
participation clearly contributes to explain markups variability. Higher GVC partici-
pation is correlated with lower markups, other things equal.
10On this matter also see Borin and Mancini (2019). For methodological de-tails on the TiVA database and indicators see the TiVA-OECD guide available athttps://www.oecd.org/sti/ind/tiva/TiVA2018 Indicators Guide.pdf.
24

Figure 11: Markups and backward GVC participation (foreign value added inexports).
-.20
.2.4
.6.8
Mar
kup
(ln)
-3 -2.5 -2 -1.5 -1Backward participation, FVAX/X (ln)
A: Agric. B: Mining C: Manuf. D: Elec, gas E: WaterF: Constr. G: Sales H: Transp. I: Accomm. J: ICTK: Finance M-N Prof/Admin R: Entertain S: Other serv.
Figure 12: Markup residuals and backward GVC participation (foreign value addedin exports).
-.6-.4
-.20
.2M
arku
p (ln
), re
sidu
als
-3 -2.5 -2 -1.5 -1Backward participation, FVAX/X (ln)
A: Agric. B: Mining C: Manuf. D: Elec, gas E: WaterF: Constr. G: Sales H: Transp. I: Accomm. J: ICTK: Finance M-N Prof/Admin R: Entertain S: Other serv.
25

5 Conclusion
In the EU markup dynamics have been different than in the US. Focusing on four
major EU countries, namely France, Germany, Italy and Spain, we singled out some
stylized facts based on aggregate country and country-industry national accounts data.
While markups have been increasing in the US at least since 1995, the same does not
apply to EU countries. Country-level dynamics have been heterogeneous, but markups
were more stable or even declining at least until the 2008 financial crisis, while they
were already increasing in the US. After the crisis markups kept increasing in the US
and started increasing also in Spain, Italy and Germany, but not in France. In all the
four sample EU countries, markups remained lower than in the US since 1995. Some
researchers have connected increasing market power, concentration and markups in
the US to the productivity slowdown. The same story does not apply to EU coun-
tries according to aggregate data. Country-level markups and productivity dynamics
are not closely related, while country-industry markups are positively correlated with
productivity either across-industries and over time. This positive association suggests
that rather than hampering efficiency, higher markups might come together with pro-
ductivity gains in the EU. At the same time, Global Value Chain participation and the
use of imported inputs, activities typically done by the most performing high-markup
firms, are instead strongly correlated with lower markups in EU countries. These in-
ternational activities seem to simultaneously be productivity enhancing (through cost
reductions or better quality inputs) and yield aggregate pro-competitive effects, al-
though the precise mechanism needs to be better characterized. Relative to the US,
the EU market appears less characterized by rising market power and rents, on the
contrary it may be too fragmented, so that some degree of concentration towards the
most efficient firms could enhance efficiency, rather than posing an imminent threat
to competition. Markups and productivity gains could, however, imply lower labour
shares with possible impacts on inequality calling for economic and social policy mea-
sures. Whether this is in fact the case is an open question left for further studies.
Future research needs to address several issues from measurement problems to bridg-
ing micro and macro evidence, to the precise identifications of the mechanisms and the
channels linking markups, productivity and other economic variables. The descriptive
evidence gathered in this paper is helpful in setting the stage for deeper investigations
on the causes and consequences of market power and productivity dynamics in the EU.
26
References
Ackerberg, D. A., Caves, K., and Frazer, G. (2015). Identification properties of recent
production function estimators. Econometrica, 83(6):2411–2451.
Aghion, P., Bergeaud, A., Boppart, T., Klenow, P. J., and Li, H. (2019). A theory of
falling growth and rising rents. Working Paper 26448, National Bureau of Economic
Research.
Aghion, P., Bloom, N., Blundell, R., Griffith, R., and Howitt, P. (2005). Competition
and Innovation: an Inverted-U Relationship. The Quarterly Journal of Economics,
120(2):701–728.
Akcigit, U. and Ates, S. T. (2019). Ten facts on declining business dynamism and
lessons from endogenous growth theory. Working Paper 25755, National Bureau of
Economic Research.
Andrews, D., Criscuolo, C., and Gal, P. N. (2016). The best versus the rest. Produc-
tivity Working Paper 2016/5, OECD.
Antras, P. (2019). Conceptual Aspects of Global Value Chains. National Bureau of
Economic Research, (January).
Auer, R., Borio, C., and Filardo, A. (2017). The Globalisation of Inflation: the Growing
Importance of Global Value Chains. Federal Reserve Bank of Dallas, Globalization
and Monetary Policy Institute Working Papers, 2017(300).
Autor, D., Dorn, D., Katz, L. F., Patterson, C., and Reenen, J. V. (2017). The Fall of
the Labor Share and the Rise of Superstar Firms. Working Paper 23396, National
Bureau of Economic Research.
Autor, D., Dorn, D., Katz, L. F., Patterson, C., and Reenen, J. V. (2020). The fall
of the labor share and the rise of superstar firms. Quarterly Journal of Economics,
135(2).
Baqaee, D. R. and Farhi, E. (2019). Productivity and Misallocation in General Equi-
librium. The Quarterly Journal of Economics, 135(1):105–163.
Barkai, S. (forthcoming). Declining Labor and Capital Shares. Journal of Finance.
Begenau, J., Farboodi, M., and Veldkamp, L. (2018). Big data in finance and the growth
of large firms. Working Paper 24550, National Bureau of Economic Research.
Bellone, F., Musso, P., Nesta, L., and Warzynski, F. (2014). International trade
and firm-level markups when location and quality matter. Journal of Economic
Geography, 16(1):67–91.
27
Berry, S., Levinsohn, J., and Pakes, A. (1995). Automobile prices in market equilib-
rium. Econometrica, 63(4):841–890.
Bessen, J. E. (2017). Industry concentration and information technology. Law and
Economics Research Paper 41, Boston Univ. School of Law.
Bianchi, F. and Civelli, A. (2015). Globalization and inflation: Evidence from a time-
varying VAR. Review of Economic Dynamics, 18(2):406–433.
Borin, A. and Mancini, M. (2019). Measuring what matters in global value chain and
value-added trade. Policy Research Working Paper, background paper of the World
Development Report 2020, 8804(April 2019):1–64.
Calligaris, S., Criscuolo, C., and Marcolin, L. (2018). Mark-ups in the digital era.
Science, Technology and Industry Working Papers 2018/10, OECD.
Cassiman, B. and Vanormelingen, S. (2013). Profiting from Innovation: Firm Level
Evidence on Markups. CEPR Discussion Papers 9703, C.E.P.R.
Chen, N., Imbs, J., and Scott, A. (2009). The dynamics of trade and competition.
Journal of International Economics, 77(1):50–62.
Crouzet, N. and Eberly, J. C. (2019). Understanding weak capital investment: the role
of market concentration and intangibles. Working Paper 25869, National Bureau of
Economic Research.
De Loecker, J. and Eeckhout, J. (2017). The rise of market power and the macroeco-
nomic implications. Working Paper 23687, National Bureau of Economic Research.
De Loecker, J. and Eeckhout, J. (2018). Global market power. Working Paper 24768,
National Bureau of Economic Research.
De Loecker, J., Goldberg, P. K., Khandelwal, A. K., and Pavcnik, N. (2016). Prices,
markups, and trade reform. Econometrica, 84(2):445–510.
De Loecker, J. and Warzynski, F. (2012). Markups and firm-level export status. The
American Economic Review, 102(6):2437–2471.
De Ridder, M. (2019). Market power and innovation in the intangible economy. Dis-
cussion Papers 1907, Centre for Macroeconomics (CFM).
de Soyres, F. and Franco, S. (2019). Inflation dynamics and global value chains. World
Development Report 2020 Background Paper.
Diez, F., Fan, J., and Villegas-Sanchez, C. (2019). Global Declining Competition. IMF
Working Papers 13696, International Monetary Fund.
28
Diez, F. J., Leigh, D., and Tambunlertchai, S. (2018). Global Market Power and its
Macroeconomic Implications. IMF Working Papers 18/137, International Monetary
Fund.
Eggertsson, G. B., Robbins, J. A., and Wold, E. G. (2018). Kaldor and piketty’s facts:
The rise of monopoly power in the united states. Working Paper 24287, National
Bureau of Economic Research.
Grullon, G., Larkin, Y., and Michaely, R. (2019). Are US Industries Becoming More
Concentrated?*. Review of Finance, 23(4):697–743.
Guellec, D. and Paunov, C. (2017). Digital innovation and the distribution of income.
Working Paper 23987, National Bureau of Economic Research.
Gutierrez, G. and Philippon, T. (2017). Declining competition and investment in the
u.s. Working Paper 23583, National Bureau of Economic Research.
Hall, R. E. (1988). The relation between price and marginal cost in u.s. industry.
Journal of Political Economy, 96(5):921–947.
Hartman-Glaser, B., Lustig, H., and Xiaolan, M. Z. (2019). Capital share dynamics
when firms insure workers. The Journal of Finance, 74(4):1707–1751.
IMF (2019). World economic outlook, april 2019 growth slowdown, precarious recovery.
Report, IMF.
Karabarbounis, L. and Neiman, B. (2014). The global decline of the labor share. The
Quarterly journal of economics, 129(1):61–103.
Koopman, R., Powers, W., Wang, Z., and Wei, S.-J. (2010). Give credit where credit is
due: Tracing value added in global production chains. NBER Working Paper Series,
pages 1–58.
Koopman, R., Wang, Z., and Wei, S.-J. (2014). Tracing Value-Added and Double
Counting in Gross Exports. American Economic Review, 104(2):459–494.
Raval, D. (2020). Testing the Production Approach to Markup Estimation. Unpub-
lished manuscript.
Shuichiro, N. and Mari, T. (2019). Measuring Markups from Revenue and Total Cost:
An Application to Japanese Plant-Product Matched Data. Discussion papers 19-E-
018, Research Institute of Economy, Trade and Industry (RIETI).
Syverson, C. (2019). Macroeconomics and market power: Context, implications, and
open questions. Journal of Economic Perspectives, 33(3):23–43.
29
Van Reenen, J. (2011). Does competition raise productivity through improving man-
agement quality? International Journal of Industrial Organization, 29(3):306 – 316.
Special Issue: Selected Papers, European Association for Research in Industrial Eco-
nomics 37th Annual Conference, Istanbul, Turkey, September 2-4, 2010.
Van Reenen, J. (2018). Increasing differences between firms: Market power and the
macro-economy. CEP Discussion Papers dp1576, Centre for Economic Performance,
LSE.
Weche, J. P. and Wambach, A. (2018). The fall and rise of market power in europe.
ZEW-Centre for European Economic Research Discussion Paper, (18-03).
World Bank (2020). World Development Report 2020: Trading for Development in the
Age of Global Value Chains.
30
A Tables and Figures
Table 1: Aggregate markup correlations, MARKET ECONOMY.
USA France Germany Italy Spain
USA 1.0000France -0.4929** 1.0000Germany 0.0685 0.2988 1.0000Italy -0.6417*** 0.8894*** 0.2115 1.0000Spain 0.0194 -0.0803 -0.1818 0.2576 1.0000
* p < 0.1; ** p < 0.05; *** p < 0.01.
Figure 13: Aggregate TFP trends, MARKET ECONOMY.
France
Germany
ItalySpain
USA
9010
011
012
013
0TF
P (1
997=
100)
1995 2000 2005 2010 2015 2020
Table 2: Aggregate TFP correlations, MARKET ECONOMY.
USA France Germany Italy Spain
USA 1.0000France 0.8320*** 1.0000Germany 0.9264*** 0.8435*** 1.0000Italy -0.7136*** -0.4428** -0.5727*** 1.0000Spain -0.9032*** -0.7561*** -0.8650*** 0.8669*** 1.0000
* p < 0.1; ** p < 0.05; *** p < 0.01.
31

Table 3: Markups and productivity correlations by country (growth rates), MARKETECONOMY.
Markup TFP L prod Markup TFP L prod
France GermanyMarkup 1.0000 1.0000TFP 0.4769** 1.0000 0.7028*** 1.0000L prod 0.4362** 0.9010*** 1.0000 0.6938*** 0.9440*** 1.0000
Italy SpainMarkup 1.0000 1.0000TFP 0.4350** 1.0000 -0.0438 1.0000L prod 0.2877 0.9236*** 1.0000 0.1934 0.0837 1.0000
* p < 0.1; ** p < 0.05; *** p < 0.01.
Figure 14: Aggregate labour productivity trends, MARKET ECONOMY.
FranceGermany
Italy
Spain
USA
100
110
120
130
140
150
Labo
r pro
duct
ivity
(199
7=10
0)
1995 2000 2005 2010 2015 2020
32

Figure 15: Interquartile range of markups by industry over time.
France
Germany
Italy
Spain
.05
.1.1
5.2
.25
.3In
terq
uarti
le ra
nge
of m
arku
ps
1995 2000 2005 2010 2015 2020
Figure 16: Aggregate markup trends, TOTAL ECONOMY.
France
Germany
Italy
Spain
USA
1.18
1.2
1.22
1.24
1.26
1.28
Mar
kup
1995 2000 2005 2010 2015 2020
33
Figure 17: Aggregate TFP trends, TOTAL ECONOMY.
France
Germany
ItalySpain
USA
9010
011
012
0TF
P (1
997=
100)
1995 2000 2005 2010 2015 2020
Figure 18: Aggregate TFP trends, TOTAL ECONOMY (St.Louis FED data).
France
Germany
Italy
Spain
USA
8090
100
110
120
TFP
(199
5=10
0)
1995 2000 2005 2010 2015 2020
34
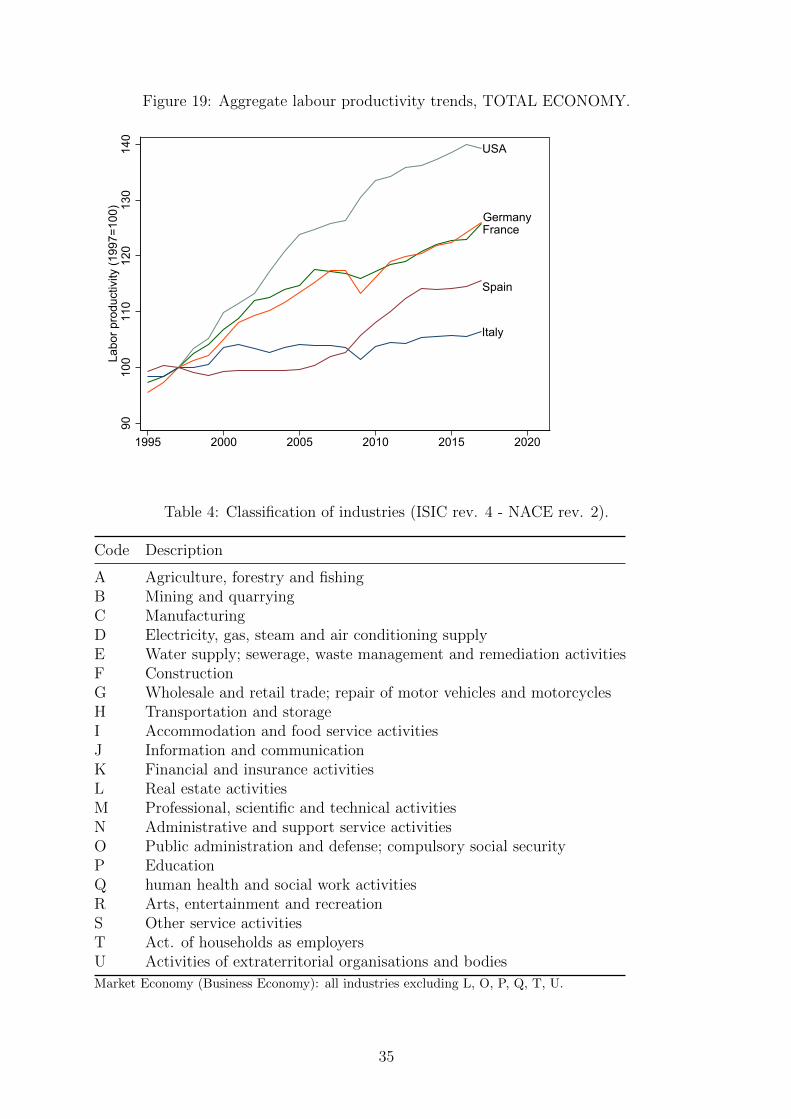
Figure 19: Aggregate labour productivity trends, TOTAL ECONOMY.
FranceGermany
Italy
Spain
USA
9010
011
012
013
014
0La
bor p
rodu
ctiv
ity (1
997=
100)
1995 2000 2005 2010 2015 2020
Table 4: Classification of industries (ISIC rev. 4 - NACE rev. 2).
Code Description
A Agriculture, forestry and fishingB Mining and quarryingC ManufacturingD Electricity, gas, steam and air conditioning supplyE Water supply; sewerage, waste management and remediation activitiesF ConstructionG Wholesale and retail trade; repair of motor vehicles and motorcyclesH Transportation and storageI Accommodation and food service activitiesJ Information and communicationK Financial and insurance activitiesL Real estate activitiesM Professional, scientific and technical activitiesN Administrative and support service activitiesO Public administration and defense; compulsory social securityP EducationQ human health and social work activitiesR Arts, entertainment and recreationS Other service activitiesT Act. of households as employersU Activities of extraterritorial organisations and bodies
Market Economy (Business Economy): all industries excluding L, O, P, Q, T, U.
35
Top Related