


Languages
Pages
Legal

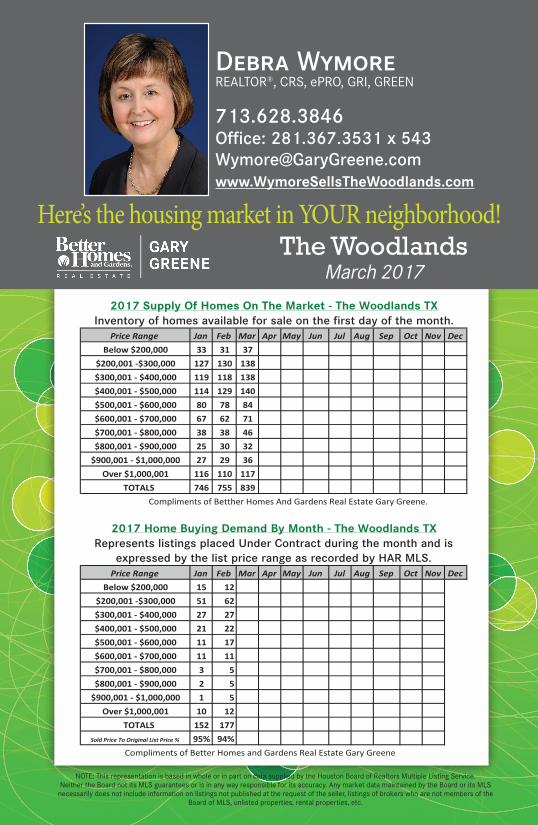
Price Range Jan Feb Mar Apr May Jun Jul Aug Sep Oct Nov DecBelow $200,000 33 31 37
$200,001 -$300,000 127 130 138$300,001 - $400,000 119 118 138$400,001 - $500,000 114 129 140$500,001 - $600,000 80 78 84$600,001 - $700,000 67 62 71$700,001 - $800,000 38 38 46$800,001 - $900,000 25 30 32
$900,001 - $1,000,000 27 29 36Over $1,000,001 116 110 117
TOTALS 746 755 839 Compliments of Betther Homes And Gardens Real Estate Gary Greene.
Price Range Jan Feb Mar Apr May Jun Jul Aug Sep Oct Nov DecBelow $200,000 15 12
$200,001 -$300,000 51 62$300,001 - $400,000 27 27$400,001 - $500,000 21 22$500,001 - $600,000 11 17$600,001 - $700,000 11 11$700,001 - $800,000 3 5$800,001 - $900,000 2 5
$900,001 - $1,000,000 1 5Over $1,000,001 10 12
TOTALS 152 177Sold Price To Original List Price % 95% 94%
Compliments of Better Homes and Gardens Real Estate Gary Greene
2017 Supply Of Homes On The Market - The Woodlands TXInventory of homes available for sale on the first day of the month.
2017 Home Buying Demand By Month - The Woodlands TXRepresents listings placed Under Contract during the month and is
expressed by the list price range as recorded by HAR MLS.
NOTE: This representation is based in whole or in part on data supplied by the Houston Board of Realtors Multiple Listing Service. Neither the Board not its MLS guarantees or is in any way responsible for its accuracy. Any market data maintained by the Board or its MLS
necessarily does not include information on listings not published at the request of the seller, listings of brokers who are not members of the Board of MLS, unlisted properties, rental properties, etc.
The WoodlandsMarch 2017
713.628.3846Office: 281.367.3531 x [email protected]
Debra WymoreREALTOR®, CRS, ePRO, GRI, GREEN
Here’s the housing market in YOUR neighborhood!
Top Related