


Languages
Pages
Legal


© 2016 Korn Ferry Hay Group. All rights reserved.
www.kornferry.com/haygroup
March 13, 2017
City of Rockville
Pension Plan Experience Study 2011-2015

www.kornferry.com/haygroup
Contents
Executive Summary ................................................... 1
Section 1 – Introduction ............................................ 3
Section 2 – Methodology ........................................... 5
Section 3 – Demographic Assumptions Analysis ... 7
Overview ..................................................................... 7
Nondisabled Termination Assumptions................... 9
Nondisabled Retirement Assumptions .................. 11
Nondisabled Mortality Assumptions ...................... 13
Disability Retirement Assumptions ........................ 13
Summary of Demographic Assumption Analysis . 13
Salary Growth Rate Assumptions .......................... 15
Inflation Rate Assumptions ..................................... 18
Investment Return ................................................... 19
Appendix .................................................................. 20

Korn Ferry Hay Group 1
Executive Summary
Pension plan funding has the goal of ensuring sufficient assets are on hand to pay benefits when
due – even when the benefits are payable in sixty or more years in the future. To evaluate whether
the funding is on track, plan sponsors should periodically evaluate the assumptions used in the
valuation.
The City of Rockville (“the City”) charged Korn Ferry Hay Group with conducting an evaluation
of the experience of The City of Rockville Employees Retirement System (ROCKERS) over the
past five years, and based on that analysis setting out recommendations for actuarial assumptions
to be used in future valuations.
Based on our study of the demographic and economic assumptions and the actual experience of
active participants in Rockers, we recommend a number of proposed changes to the Plans’
demographic and economic assumptions.
Demographic Assumptions
In brief, the changes in demographic assumptions reflect somewhat earlier retirements for the
Administrative (Admin) and Union employees (enrolled in either the Thrift or Defined Benefit
(DB) plans) and unchanged retirement rates for the Police employees. Active Admin and Union
employees are expected to terminate at a somewhat higher rate under the proposed assumptions
as compared to the current assumptions.
We are also recommending a change to the mortality rates which are based on the RP-2000
mortality tables. We propose using a table of rates for healthy annuitant and disabled annuitant
deaths that reflects actual experience of a large state governmental employer that we believe
reasonably estimates the ROCKERS mortality. These mortality tables contain a sufficient margin
for improvements in life expectancy and are appropriate tables for the City’s pension plans. The
number of covered lives in the retirement plan is too few to develop City specific mortality tables,
therefore the tables we have chosen are appropriate.
Economic Assumptions
Currently, salary growth assumptions differ for Police, the DB plan, and the Thrift plan. Since
there are very few members left in the DB plan and since the split between Union and Admin is a
better indicator of future pay increase, we propose replacing the DB and Thrift split with a Union
and Admin split. The proposed Union, Admin, and Police tables were built using merit and
promotion increases over the experience study period and adding expected future general wage

Korn Ferry Hay Group 2
growth to those amounts. On average, the salary growth rates that we propose are lower than
the current rates.
We recommend lowering the long-term inflation assumption from 2.75% to 2.50%. We
recommend reducing the investment return assumption from 7.50% to 7.00%.
Actuarial Certification
To the best of our knowledge, this report is complete and accurate and all rates have been
determined in conformance with generally accepted actuarial principles and on the basis of
actuarial methods which are reasonable (taking into account past experience under the Plan and
reasonable expectations) and which in combination represent our best estimate of anticipated
experience under the plan.
The results shown in this report are reasonable actuarial results. However, a different set of results
could also be considered reasonable actuarial results. The reason for this is that actuarial standards
of practice describe a "best-estimate range" for each assumption, rather than a single best-estimate
value. Thus, reasonable results differing from those presented in this report could have been
developed by selecting different points within the best-estimate ranges for various assumptions.
The actuary certifying to this valuation is a member of professional actuarial organizations, and
meets the General Qualification Standards of the American Academy of Actuaries for purposes of
issuing Statements of Actuarial Opinion.
________________________________________
Enrolled Actuary No. 14-7319
Hay Group
March 13, 2017
Craig R. Graby
Member of the American Academy of Actuaries
Fellow of the Conference of Consulting Actuaries

Korn Ferry Hay Group 3
Section 1 – Introduction
Hay Group conducted a demographic and economic experience study of the City of Rockville
Employees Retirement System for Admin employees, Union employees and Police employees
collectively the “Plans” for the period April 1, 2011 through July 1, 2015 (the evaluation period).
The purpose of this study was to determine the reasonableness and appropriateness of the
demographic and economic assumptions of the Plans and to recommend changes to those
assumptions as we deemed appropriate, in consultation with the City’s Retirement Board.
As detailed in this Report we analyzed the most recent five years of data for each assumption used
in the determination of the Plans’ liabilities, actuarially determined contribution, and other
actuarial analyses presented in our annual Actuarial Valuations of the Plans, and made
recommendations for changes where appropriate.
The new actuarial assumptions will be used for both the City’s Defined Benefit Pension and the
Retiree Benefit Trust (OPEB) valuations. This Report formalizes our findings and
recommendations to the City Retirement Board. We have included in this report our proposed
assumption changes, which we have utilized in our July 1, 2016 Defined Benefit Pension Plan
valuation.
Background
For the Plans to operate on a sound actuarial basis, Plan assets together with expected future
contributions must be adequate to cover the value of future promised benefit payments. Each year,
as part of the actuarial valuation process, we, as the Plans’ actuary, project future benefits and
determine the present value of such benefits. These projections serve as a basis for determining,
as of the actuarial valuation date, each Plan’s unfunded actuarial accrued liability and the City’s
normal cost.
These projections are based on numerous economic and demographic assumptions (as explained
below). Since both the economic and demographic experience change over time, it is essential to
conduct a periodic review of the experience and to adjust the assumptions in the valuation to reflect
the most recent experience.
It is general practice to introduce some degree of conservatism in setting actuarial assumptions.
However, the degree of conservatism varies widely among pension plans. Some plans set
assumptions so that the pension plan contributions will be at least as great as the contributions
needed in the most adverse foreseeable circumstances. Other plans set assumptions that are close
to the actual experience but conservative enough to protect against small deviations from past
experience. The latter, a moderately conservative approach, has been used by Korn Ferry Hay

Korn Ferry Hay Group 4
Group in this study and the assumption revisions presented in this report were developed on that
basis.
Section 2 of this Report describes the methodology that was used to analyze the data and develop
the demographic rates. Section 3 presents the results of the analysis of the demographic
experience, and the basis for the proposed demographic assumptions. Section 4 presents the results
of the analysis of the economic experience, and the basis for the proposed economic assumptions.
Appendix A shows the full set of rates to be used as part of the actuarial assumptions for actuarial
valuations for plan years beginning on and after July 1, 2016.

Korn Ferry Hay Group 5
Section 2 – Methodology
The specific objective of this actuarial experience study is the development of the demographic
and economic assumptions, considering the experience of the Admin and Union employees
separately from the Police employees.
Demographic assumptions
Demographic assumptions include the set of rates that predict certain events occurring to a group
of employees or retirees. Events of significance to a retirement system are those that result in a
commencement or termination of a benefit payment. The events affecting active employees
include reasons for leaving the Plans such as retirement (retirement rates), becoming disabled
(disability rates), terminating service (termination rates – also called withdrawal rates), or death
(mortality rates). The events affecting annuitants include death (post disability or post retirement).
If an annuitant were to return to service, or if a disabled annuitant were to recover, the benefit
payments to the annuitant would stop. However, these events are not included in the analysis
because the occurrences of these events are rare, and would not materially affect the calculation of
the decrement rates. During our study of the evaluation period we analyzed the following
demographic assumptions:
▪ The rates of terminations (separation from active duty for reasons other than death or
disability) among active duty participants who are not eligible for retirement, and
▪ The rates of nondisabled retirements among active duty participants who are eligible for
retirement.
Due to the small size of the data we did not examine emerging mortality or disability experience.
Based on emerging mortality experience from other similar plans and large-scale actuarial studies
of mortality we recommend adopting a modified version of the mortality tables of RP-2000 that
reflect large governmental experience and contain a margin for future mortality improvements.
Economic assumptions
The economic assumptions cover the salary growth, inflation and investment return. These
relatively few assumptions, compared to the larger number of demographic assumptions, generally
have the most significant effect on the value of future benefits. The following economic
assumptions were reviewed as part of the experience study and adjusted to keep pace with changes
in the rate of general inflation:
▪ The salary growth rates specific for the Admin plans,
▪ The salary growth rates specific for the Union plans, and

Korn Ferry Hay Group 6
▪ The salary growth rates specific for the Police plan.
Development of the assumptions begins with the analysis of actual experience over the evaluation
period and a comparison to expected experience, analyzing the experience of each plan separately.
Expected experience is derived by applying the current (most recent actuarial valuation)
assumptions to past active duty populations for each plan. This analysis results in the calculation
of the actual-to-expected ratio. The actual-to-expected ratio, which is developed separately for
each completed years of service, and in total, gives a measure of how closely the assumption
predicted what actually happened. If the actual-to-expected ratio is greater than 1.0, then the
actuarial assumption under-predicted; if the actual-to-expected ratio is less than 1.0, then the
assumption over-predicted the number of occurrences.
The product of the analysis is a set of proposed actuarial assumptions that produce an actual-to-
expected ratio closer to 1.0, based upon the Plans’ actual experience and our judgment as actuaries
regarding the reliability of that experience as a predictor of future experience. When an actuarial
experience analysis produces an actual-to-expected ratio which is close to 1.0 (e.g., in the range of
0.9 to 1.1), it will often be viewed as a match, and no adjustment to that assumption is warranted.
The demographic assumptions were developed by analyzing the actual experience of the
participants in the Plans and comparing that experience to what was expected based on the
demographic assumptions currently being used in the two actuarial valuations. During the normal
valuation cycles, we were provided with the annual data files in order to perform the annual
valuations. These files contain a “snap-shot” of the active employees participating in each Plan as
well as the retired and survivors currently receiving benefit payments. The annual files also
included terminated employees who are due a future benefit.
To determine the number of employees who left the City during the evaluation period, we matched
consecutive annual files. For example, we matched the April 1, 2011 active member file to the
April 1, 2012 active member file to determine who had left each plan during the plan year ending
in 2012. In 2013, the plan year was changed April 1 to July 1, so the next period covered 1.25
years from April 1, 2012 through July 1, 2013. As appropriate, the expected number of decrements
were adjusted to reflect the extra quarter of a year in this period. Thereafter, July 1, data files were
matched through 2015.
Overall, we found that many of the actuarial assumptions of the Plans warranted some changes to
better reflect a reasonable forecast of future experience based on currently available information.

Korn Ferry Hay Group 7
Section 3 – Demographic Assumptions Analysis
Overview
The terminations from active employment for the City participants were analyzed by two
categories, depending on the eligibility for plan benefits:
• Termination
• Retirement
In addition to the two categories above, we also recommended changes to the following categories
based using large governmental data sets:
• Mortality
• Disability
Tables 1 and 2, below, compare the actual occurrences (i.e., for terminations and retirements) that
have occurred during the evaluation period to the expected results based on the current set of
actuarial assumptions separately for each Plan. These Tables will be discussed in greater detail in
the subsequent parts of this Section.
TABLE 1
COMPARISON OF ACTUAL AND EXPECTED OCCURRENCES
THRIFT AND DEFINED BENEFIT (DB) EMPLOYEE PLAN
Expected
Actual
Ratio
Actual-to-Expected
Terminations 107.9 141 1.31
Retirement 48.4 54 1.12
TABLE 2
COMPARISON OF ACTUAL AND EXPECTED OCCURRENCES
POLICE PLAN
Expected
Actual
Ratio
Actual-to-Expected
Terminations 8.6 10 1.16
Retirement 7.6 2 0.26

Korn Ferry Hay Group 8
Based on our study, we recommend the following changes in demographic assumptions:
• Increase the termination assumptions (primarily in the earliest service periods) for all
employees under the Thrift and DB plans.
• Leave unchanged the termination assumption for the employees in the Police plan.
• Increase the retirement assumptions at certain ages for employees under the Thrift and DB
plans.
• Leave unchanged the retirement assumptions for employees under the Police plan.
• Update the healthy and disabled annuitant mortality tables to reflect more recent large
governmental experience (including a margin for mortality improvement).
• Update the rates of disability to reflect more recent large governmental experience.

Korn Ferry Hay Group 9
Nondisabled Termination Assumptions
Termination is the term commonly given to separations from active duty for reasons other than
retirement, disability, or death. Terminations generally include members who cease to be on active
status, whether or not they have a right to receive future Plan benefits (i.e., those who withdraw may
or may not be vested in a benefit). For the City’s actuarial valuation purposes, different service based
termination rates are currently applied to active participants depending upon the number of years of
service they have completed. The current assumptions were adopted based on the prior experience
study.
Thrift and Defined Benefit (DB) Employee Plan
Table 1, on page 7, shows that 107.9 employees were expected to leave during the evaluation period.
During this period there were 141 actual terminations. Therefore, the actual-to-expected ratio was
131 percent. A ratio above 100 percent shows the actual withdrawal experience was greater than the
expected rates. In developing our recommended rates we used smoothed actual experience to develop
rates producing an actual-to-expected ratio closer to 1.0. The following chart shows the comparison
of the actual, expected and proposed termination rates. Detailed rates based on completed years of
service can be found in the Appendix.
0%
5%
10%
15%
20%
25%
30%
35%
40%
45%
1 3 5 7 9 11 13 15 17 19 21 23 25 27 29 31 33 35 37 39 41
Term
inat
ion
Rat
e
Years of Service
Thrift and Defined Benefit (DB) Plans Termination Experience
Actual Expected Recommended

Korn Ferry Hay Group 10
Police Plan
Table 2, on page 7, shows that 8.6 Police employees were expected to leave during the evaluation
period. During this period there were 10 actual terminations. Therefore, the actual-to-expected ratio
was 116 percent. A ratio greater than 100 percent shows there were more terminations than expected.
Since there were so few actual terminations, we left this assumption unchanged. Detailed rates based
on completed years of service can be found in the Appendix.
0%
5%
10%
15%
20%
25%
0 2 4 6 8 10 12 14 16 18 20 22 24 26 28 30 32 34 36 38 40
Term
inat
ion
Rat
e
Years of Service
Police PlanTermination Experience
Actual Expected Recommended

Korn Ferry Hay Group 11
Nondisabled Retirement Assumptions
Thrift and Defined Benefit (DB) Employee Plan
Table 1, on page 7, shows that based on current assumption 48.4 employees were expected to retire
during the evaluation period. During this period there were 54 actual retirements. Therefore, the
actual-to-expected ratio was 112 percent. A ratio greater than 100 percent shows there were more
retirements than expected. Based on our analysis we increased many of the retirement rates at the
earlier ages and left most retirement rates unchanged at later ages. All employees are still expected
to retire at age 70 in our recommended assumption. Detailed age based comparisons and rates can be
found in the Appendix.
0%
10%
20%
30%
40%
50%
60%
70%
80%
90%
100%
50 51 52 53 54 55 56 57 58 59 60 61 62 63 64 65 66 67 68 69 70
Ret
ire
me
nt
Rat
e
Age
Thrift and Defined Benefit (DB) PlansRetirement Experience
Actual Expected Recommended

Korn Ferry Hay Group 12
Police Plan
Table 2, on page 7, shows that 7.6 Police employees were expected to retire during the evaluation
period. During this period there were 2 actual retirements. Therefore, the actual-to-expected ratio
was 26 percent. A ratio less than 100 percent shows there were fewer retirements than expected. Since
there were so few retirements and so few eligible to retire (35 exposures), we recommend no change
to this assumption. To maintain a degree of conservatism we continue to assume all police employees
will retire at age 61. Going forwards with more emerging experience we will modify this assumption.
The following chart shows the comparison of the actual and expected/proposed retirement rates.
Detailed age based comparisons and rates can be found in the Appendix.
0%
10%
20%
30%
40%
50%
60%
70%
80%
90%
100%
50 51 52 53 54 55 56 57 58 59 60 61 62 63 64 65
Ret
ire
me
nt
Rat
e
Age
Police PlanRetirement Experience
Actual Expected Recommended

Korn Ferry Hay Group 13
Nondisabled Mortality Assumptions
Thrift and Defined Benefit (DB) Employee and Police Employee Plan
Occurrences of death are difficult to predict in a small population. The rate of death, the mortality
assumption, is applied to the active population as well as the retirement population. The mortality
assumption is used to predict how long the fund will be paying retirement benefits to the
participants once they retire.
The recommendation of this study is to update the mortality to reflect large governmental
experience that we believe reasonably predicts the Plans’ mortality and includes appropriate
margins for improvement.
Disability Retirement Assumptions
Thrift and Defined Benefit (DB) Employee and Police Employee Plan
Occurrences of disability are rare and difficult to predict in a small group. Because the disability
numbers are small and hard to predict, we recommend adopting a table developed from large
governmental experience.
Summary of Demographic Assumption Analysis
Withdrawal Rates
Based on the analysis of the withdrawal experience the current rates were increased for the Thrift
and DB plans and left unchanged for the Police plan.
Retirement Rates
Based on the analysis of the retirement experience the current assumption was increased for certain
ages in the Thrift and DB plans and left unchanged for the Police plan.
Mortality Rates
The recommendation of this study is to adopt new mortality tables based on large governmental
plan experience.
Disability Rates
The recommendation of this study is to adopt a disability rate tables based on large governmental
plan experience.

Korn Ferry Hay Group 14
Section 4 - Economic Assumption Analysis
Overview
The economic assumptions for the City participants were analyzed by the following categories:
• Salary growth rate
• Inflation rate
Based on our study, we made the following recommendations:
• Move from salary growth rates that reflect DB, Thrift, and Police plan participants to rates
that differ based on Admin, Union, and Police.
• Build new salary growth rates using a three-step approach:
o Determine the merit and promotion increases for each employee group based on the
most recent salary data, and
o Add the expected average general wage growth of 2.75% to 3.25% to the merit and
promotion increases to create the total scale.
o Add an expected cost-of-living adjustment (COLA) increase of 1% per year that is
applied to all salary

Korn Ferry Hay Group 15
Salary Growth Rate Assumptions
Admin Employees
Since we are creating a new set of rates that did not exist last year, we did not calculate actual to
expected ratios for the Admin employee group in the traditional manner. We developed the rates
using the three-step process described above. The following chart shows the comparison of the actual
(adjusted to common underlying general and COLA increases), general wage plus COLA and total
proposed salary growth rates. Detailed age base comparisons and rates can be found in the Appendix.
There were spikes in salary increases a several ages. Most of these included relatively few people
at those ages, so we smoothed the rates using an averaging method that included the two years
before and two years after each age.
0%
1%
2%
3%
4%
5%
6%
7%
8%
9%
10%
21 26 31 36 41 46 51 56 61 66
Sala
ry In
cre
ase
Age
Admin PlansSalary Experience
Actual % General/COLA % Recommended

Korn Ferry Hay Group 16
Union Employees
Since we are creating a new set of rates that did not exist last year, we did not calculate actual to
expected ratios for the Union employee group in the traditional manner. We developed the rates using
the three-step process described above. The following chart shows the comparison of the actual
(adjusted to common underlying general and COLA increases), general wage plus COLA and total
proposed salary growth rates. Detailed age base comparisons and rates can be found in the Appendix.
There were spikes in salary increases a several ages. Most of these included relatively few people
at those ages, so we smoothed the rates using an averaging method that included the two years
before and two years after each age. Also, the pay scale for Union employees ends at Step 16. A
new hire will generally reach the end of general step increases after 15 years. Due to prior steps
not being funded, we are using an assumption that the 2.75% step increases cease after 20 years of
service for Union employees.
0%
2%
4%
6%
8%
10%
12%
14%
16%
19 24 29 34 39 44 49 54 59 64 69
Sala
ry In
cre
ase
Age
Union Plans Salary Experience
Actual % General/COLA % Recommended

Korn Ferry Hay Group 17
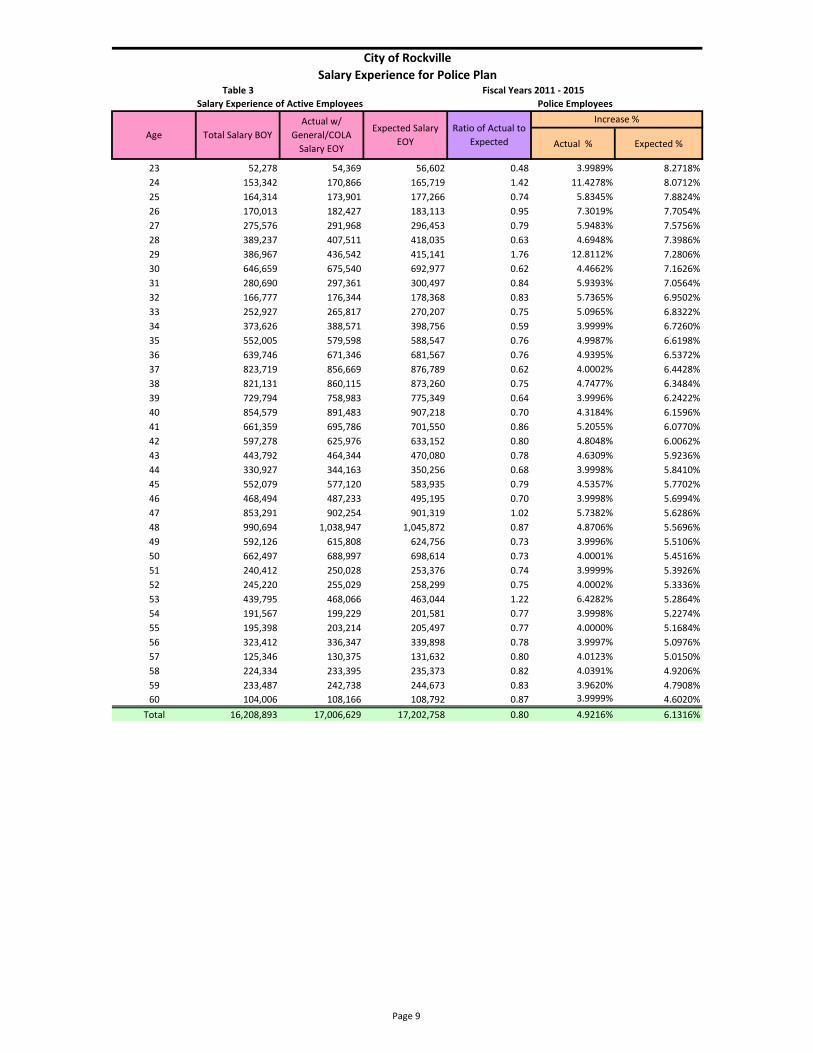
Police Employee Plan
Even though the Police salary growth rates existed last year, we are adopting a new building block
approach to create the rates this year. Therefore, we did not calculate actual to expected ratios for the
Police employees in the traditional manner. We developed the rates using the three-step process
described above. The following chart shows the comparison of the actual (adjusted to common
underlying general and COLA increases), expected (based on the current assumption) and total
proposed salary growth rates. Detailed age base comparisons and rates can be found in the Appendix.
There were spikes in salary increases at some ages. Based on conversations about career patterns
and increases, we gave the two spikes at earlier ages near full credibility. Also, the pay scale for
Police ends at Step 16. A new hire will generally reach the end of general step increases after 15
years. Due to prior steps not being funded, we are using an assumption that the 3% step increases
cease after 20 years of service for Police.
0%
2%
4%
6%
8%
10%
12%
23 28 33 38 43 48 53 58
Sala
ry In
cre
ase
Age
Police PlanSalary Experience
Actual % Expected % Recommended

Korn Ferry Hay Group 18
Inflation Rate Assumptions
The inflation assumption is a common component of both salaries and investment return.
The most important set of rates in the valuation is the set of economic assumptions that include
the prediction of future rates of investment return and general salary increases. The assumed rates
of investment return and general salary increases are nominal rates and are therefore developed
from an assessment of the underlying rate of inflation.
While inflation does not directly affect Rockers liabilities or assets (as it would if automatic
COLAs applied), it is an important consideration in our review of both the investment return and
general salary increase assumptions. Price inflation continues to be at historical lows. The Social
Security Administration, for purposes of cost projections included in their most recent annual
Trustees’ Reports (based upon their “intermediate assumptions”), projects that future annual
inflation will be at a rate of 2.6 percent. This is down from the prior report’s assumption of 2.7
percent.
We believe, based upon historical inflation rates and our current expectations for the future that it
is reasonable and appropriate to recommend lowering the anticipated annual inflation assumption
from 2.75 percent to 2.50 percent.
While over the last 20 years the calendar year annual inflation rate has ranged from a low of -0.5
percent to a high of 4.3 percent, the rolling 5-year average has ranged between 1.4 percent and 3.1
percent. The current five-year average is 1.4 percent and the 10-year average is 1.8 percent.
96 97 98 99 00 01 02 03 04 05 06 07 08 09 10 11 12 13 14 15
Annual 3.3% 1.5% 1.6% 2.7% 3.4% 1.3% 2.4% 1.6% 3.4% 3.5% 2.4% 4.3% -0.5 3.4% 1.7% 3.2% 1.7% 1.5% 0.3% 0.4%
5-Yr Avg 2.8% 2.5% 2.3% 2.3% 2.5% 2.1% 2.3% 2.3% 2.4% 2.4% 2.7% 3.1% 2.6% 2.6% 2.3% 2.4% 1.9% 2.3% 1.7% 1.4%
-1.0%
0.0%
1.0%
2.0%
3.0%
4.0%
5.0%
An
nu
al R
ate
Consumer Price Index for Urban Wage Earners and Clerical Workers (CPI-W)

Korn Ferry Hay Group 19
Investment Return
The investment time horizon for the pension plan is over 30 years. While the recent experience is
important to review, unlike the demographic assumptions and salary increase assumption, which
reflect the decisions of the City, the investment performance is driven more by outside forces and
factors. The key areas of the investment return that can be affected by decisions of the Retirement
Board are selection of the asset allocation policy and selection of investment managers.
The pension plan assets are invested in a diversified portfolio of asset classes. The following table
shows the asset allocation policy and actual allocation as of June 30, 2016.
Asset Class Minimum Target Actual Maximum
Large Cap Equity 13% 18% 17.71% 23%
Small Cap Equity 7% 12% 11.01% 17%
International Equity 15% 20% 19.21% 25%
Fixed Income 15% 20% 18.77% 25%
US TIPS 2.5% 7.5% 7.72% 12.5%
Real Estate 7.5% 12.5% 13.77% 15%
Global 5% 10% 11.36% 15%
Cash 0% 0% 0.46% 5%
The use of professional investment managers, selection of a portfolio of multiple asset classes and
frequent monitoring of performance supports a long-term real investment return in the range of
4.00% to 5.00% per year. As the plan’s funding requirements will result in limited liquidity needs
in the next several years, it is reasonable to expect a real return around the middle of the range.
We therefore recommend a real return assumption of 4.50%. This return, combined with the long-
term inflation assumption of 2.50%, results in a recommended nominal investment return of
7.00%.

Korn Ferry Hay Group 20
Appendix

AgeAdmin
Plans
Union
Plans
Police
Plan
Thrift and
DB PlanPolice Plan Service
Thrift and
DB Plan
Police
Plan
0 3.5000% 2.7500% 0.0000% 0.0000% 0.0000% 0 17.0000% 20.0000%
1 3.5000% 2.7500% 0.0000% 0.0000% 0.0000% 1 13.0000% 20.0000%
2 3.5000% 2.7500% 0.0000% 0.0000% 0.0000% 2 12.0000% 10.0000%
3 3.5000% 2.7500% 0.0000% 0.0000% 0.0000% 3 11.0000% 6.0000%
4 3.5000% 2.7500% 0.0000% 0.0000% 0.0000% 4 10.0000% 5.0000%
5 3.5000% 2.7500% 0.0000% 0.0000% 0.0000% 5 9.0000% 4.0000%
6 3.5000% 2.7500% 0.0000% 0.0000% 0.0000% 6 8.0000% 3.0000%
7 3.5000% 2.7500% 0.0000% 0.0000% 0.0000% 7 5.0000% 3.0000%
8 3.5000% 2.7500% 0.0000% 0.0000% 0.0000% 8 5.0000% 2.0000%
9 3.5000% 2.7500% 0.0000% 0.0000% 0.0000% 9 5.0000% 1.0000%
10 3.5000% 2.7500% 0.0000% 0.0000% 0.0000% 10 4.0000% 1.0000%
11 3.5000% 2.7500% 0.0000% 0.0000% 0.0000% 11 3.5000% 1.0000%
12 3.5000% 2.7500% 0.0000% 0.0000% 0.0000% 12 3.5000% 1.0000%
13 3.5000% 2.7500% 0.0000% 0.0000% 0.0000% 13 3.5000% 1.0000%
14 3.5000% 2.7500% 0.0000% 0.0000% 0.0000% 14 3.5000% 1.0000%
15 3.5000% 2.7500% 8.0000% 0.0000% 0.0000% 15 3.5000% 1.0000%
16 3.5000% 2.7500% 8.0000% 0.0000% 0.0000% 16 3.5000% 1.0000%
17 3.5000% 2.7500% 8.0000% 0.0000% 0.0000% 17 3.5000% 1.0000%
18 3.5000% 2.7500% 8.0000% 0.0000% 0.0000% 18 3.5000% 1.0000%
19 6.5000% 6.0000% 8.0000% 0.0000% 0.0000% 19 3.5000% 1.0000%
20 6.5000% 6.0000% 9.4400% 0.0000% 0.0000% 20 3.5000% 1.0000%
21 6.7500% 6.0000% 9.4400% 0.0000% 0.0000% 21 3.5000% 1.0000%
22 6.7500% 6.0000% 9.4400% 0.0000% 0.0000% 22 3.0000% 1.0000%
23 6.2500% 6.0000% 6.0000% 0.0000% 0.0000% 23 3.0000% 1.0000%
24 6.2500% 6.0000% 11.0000% 0.0000% 0.0000% 24 2.5000% 1.0000%
25 6.2500% 6.0000% 6.5000% 0.0000% 0.0000% 25 2.5000% 0.0000%
26 6.2500% 6.0000% 6.5000% 0.0000% 0.0000% 26 2.5000%
27 6.2500% 6.0000% 6.0000% 0.0000% 0.0000% 27 2.5000%
28 6.2500% 6.0000% 5.0000% 0.0000% 0.0000% 28 1.5000%
29 6.2500% 6.0000% 12.5000% 0.0000% 0.0000% 29 1.5000%
30 6.2500% 6.0000% 4.7500% 0.0000% 0.0000% 30 0.0000%
31 6.2500% 6.0000% 4.7500% 0.0000% 0.0000%
32 6.2500% 6.0000% 4.7500% 0.0000% 0.0000%
33 4.7500% 6.0000% 4.7500% 0.0000% 0.0000%
34 4.7500% 6.0000% 4.7500% 0.0000% 0.0000%
35 4.7500% 6.0000% 4.7500% 0.0000% 0.0000%
36 4.7500% 4.7500% 4.7500% 0.0000% 0.0000%
37 4.7500% 4.7500% 4.7500% 0.0000% 0.0000%
38 4.7500% 4.7500% 4.7500% 0.0000% 0.0000%
39 4.7500% 4.7500% 4.7500% 0.0000% 0.0000%
40 4.7500% 4.7500% 4.7500% 0.0000% 0.0000%
41 4.7500% 4.7500% 4.7500% 0.0000% 0.0000%
42 4.7500% 4.7500% 4.7500% 0.0000% 0.0000%
43 4.7500% 4.7500% 4.7500% 0.0000% 0.0000%
44 4.7500% 4.7500% 4.7500% 0.0000% 0.0000%
45 4.7500% 4.7500% 4.7500% 0.0000% 0.0000%
46 4.7500% 4.7500% 4.7500% 0.0000% 0.0000%
47 4.7500% 4.7500% 4.7500% 0.0000% 0.0000%
48 4.7500% 4.7500% 4.7500% 0.0000% 0.0000%
49 4.7500% 4.7500% 4.7500% 0.0000% 0.0000%
50 4.7500% 4.7500% 4.7500% 2.5000% 10.0000%
51 4.7500% 4.7500% 4.7500% 2.5000% 10.0000%
52 4.7500% 4.7500% 4.7500% 2.5000% 10.0000%
53 4.7500% 4.7500% 4.7500% 2.5000% 10.0000%
54 4.7500% 4.7500% 4.7500% 5.0000% 10.0000%
55 4.7500% 4.7500% 4.7500% 5.0000% 20.0000%
56 4.7500% 4.7500% 4.7500% 5.0000% 20.0000%
Retirement Rates Withdrawal Rates
City of Rockville
Summary of Recommended RatesAge Based Rates Service Based Rates
Salary Growth Assumption
Page 1

AgeAdmin
Plans
Union
Plans
Police
Plan
Thrift and
DB PlanPolice Plan Service
Thrift and
DB Plan
Police
Plan
Retirement Rates Withdrawal Rates
City of Rockville
Summary of Recommended RatesAge Based Rates Service Based Rates
Salary Growth Assumption
57 4.7500% 4.7500% 4.7500% 5.0000% 20.0000%
58 4.7500% 4.7500% 4.7500% 5.0000% 30.0000%
59 4.7500% 4.7500% 4.7500% 25.0000% 40.0000%
60 4.7500% 4.7500% 4.7500% 20.0000% 50.0000%
61 4.7500% 4.7500% 4.1300% 20.0000% 100.0000%
62 4.7500% 4.7500% 4.1300% 20.0000%
63 4.7500% 4.7500% 4.1300% 20.0000%
64 4.7500% 4.7500% 4.1300% 25.0000%
65 4.7500% 4.7500% 4.1300% 25.0000%
66 4.7500% 4.7500% 4.1300% 25.0000%
67 4.7500% 4.7500% 4.1300% 25.0000%
68 4.7500% 4.7500% 4.1300% 25.0000%
69 4.7500% 4.7500% 4.1300% 25.0000%
70 4.7500% 4.7500% 4.1300% 100.0000%
71 4.7500% 5.7000% 4.1300%
72 4.7500% 5.7000% 4.1300%
73 4.7500% 5.7000% 4.1300%
74 4.7500% 5.7000% 4.1300%
75 4.7500% 5.7000% 4.1300%
76 4.7500% 5.7000% 4.1300%
77 4.7500% 5.7000% 4.1300%
78 4.7500% 5.7000% 4.1300%
79 4.7500% 5.7000% 4.1300%
80 4.0000% 4.8000% 4.1300%
81 4.0000% 4.8000% 4.1300%
82 4.0000% 4.8000% 4.1300%
83 4.0000% 4.8000% 4.1300%
84 4.0000% 4.8000% 4.1300%
85 4.0000% 4.8000% 4.1300%
86 4.0000% 4.0000% 4.1300%
87 4.0000% 4.0000% 4.1300%
88 4.0000% 4.0000% 4.1300%
89 4.0000% 4.0000% 4.1300%
90 4.0000% 4.0000% 4.1300%
91 4.0000% 4.0000% 4.1300%
92 4.0000% 4.0000% 4.1300%
93 4.0000% 4.0000% 4.1300%
94 4.0000% 4.0000% 4.1300%
95 4.0000% 4.0000% 4.1300%
96 4.0000% 4.0000% 4.1300%
97 4.0000% 4.0000% 4.1300%
98 4.0000% 4.0000% 4.1300%
99 4.0000% 4.0000% 4.1300%
100 4.0000% 4.0000% 4.1300%
101 4.0000% 4.0000% 4.1300%
102 4.0000% 4.0000% 4.1300%
103 4.0000% 4.0000% 4.1300%
104 4.0000% 4.0000% 4.1300%
105 4.0000% 4.0000% 4.1300%
106 3.5000% 4.0000% 4.1300%
107 3.5000% 4.0000% 4.1300%
108 3.5000% 4.0000% 4.1300%
109 3.5000% 4.0000% 4.1300%
110 3.5000% 4.0000% 4.1300%
Page 2

Actual %Expected
General/COLA %
Ratio of Actual to
ExpectedAge
Increase %
City of Rockville
Salary Experience for Admin EmployeesTable 1 Fiscal Years 2011 - 2015
Salary Experience of Active Employees Thrift and DB Plans
Total Salary BOY
Actual w/
General/COLA
Salary EOY
General Salary
EOY
21 65,889 68,690 68,689 1.00 4.2503% 4.2500%
22 104,175 114,835 108,602 2.41 10.2332% 4.2500%
23 165,759 172,311 172,804 0.93 3.9528% 4.2500%
24 201,928 218,329 210,510 1.91 8.1222% 4.2500%
25 526,757 558,528 549,144 1.42 6.0314% 4.2500%
26 736,245 782,624 767,535 1.48 6.2994% 4.2500%
27 705,520 755,716 735,505 1.67 7.1147% 4.2500%
28 1,049,491 1,145,215 1,094,094 2.15 9.1209% 4.2500%
29 1,082,982 1,136,315 1,129,009 1.16 4.9246% 4.2500%
30 941,028 1,036,901 981,022 2.40 10.1881% 4.2500%
31 1,732,042 1,782,442 1,805,654 0.68 2.9099% 4.2500%
32 1,738,718 1,819,951 1,812,614 1.10 4.6720% 4.2500%
33 1,628,611 1,710,017 1,697,827 1.18 4.9985% 4.2500%
34 1,452,578 1,523,668 1,514,313 1.15 4.8940% 4.2500%
35 1,905,816 1,990,752 1,986,813 1.05 4.4567% 4.2500%
36 2,111,600 2,212,414 2,201,343 1.12 4.7743% 4.2500%
37 1,854,995 1,942,950 1,933,832 1.12 4.7415% 4.2500%
38 1,790,986 1,871,647 1,867,103 1.06 4.5037% 4.2500%
39 1,194,764 1,245,541 1,245,541 1.00 4.2500% 4.2500%
40 1,708,251 1,795,029 1,780,852 1.20 5.0799% 4.2500%
41 2,122,997 2,187,184 2,213,224 0.71 3.0234% 4.2500%
42 1,980,595 2,096,279 2,064,770 1.37 5.8409% 4.2500%
43 2,233,165 2,343,630 2,328,075 1.16 4.9466% 4.2500%
44 2,583,654 2,662,140 2,693,459 0.71 3.0378% 4.2500%
45 2,794,267 2,925,063 2,913,023 1.10 4.6809% 4.2500%
46 3,348,898 3,494,138 3,491,226 1.02 4.3370% 4.2500%
47 3,968,026 4,121,376 4,136,667 0.91 3.8647% 4.2500%
48 3,946,812 4,109,813 4,114,552 0.97 4.1299% 4.2500%
49 3,744,466 3,984,449 3,903,606 1.51 6.4090% 4.2500%
50 3,941,327 4,135,703 4,108,833 1.16 4.9317% 4.2500%
51 3,478,254 3,569,464 3,626,080 0.62 2.6223% 4.2500%
52 3,721,095 3,901,256 3,879,242 1.14 4.8416% 4.2500%
53 3,274,142 3,463,800 3,413,293 1.36 5.7926% 4.2500%
54 3,110,621 3,250,468 3,242,822 1.06 4.4958% 4.2500%
55 2,482,468 2,603,628 2,587,973 1.15 4.8806% 4.2500%
56 2,473,663 2,612,823 2,578,794 1.32 5.6256% 4.2500%
57 2,284,988 2,382,123 2,382,100 1.00 4.2510% 4.2500%
58 2,814,040 2,978,379 2,933,637 1.37 5.8400% 4.2500%
59 2,042,986 2,152,860 2,129,813 1.27 5.3781% 4.2500%
60 1,496,628 1,559,729 1,560,235 0.99 4.2162% 4.2500%
61 2,456,941 2,560,843 2,561,361 1.00 4.2289% 4.2500%
62 1,469,349 1,529,877 1,531,796 0.97 4.1194% 4.2500%
63 1,248,206 1,300,664 1,301,255 0.99 4.2027% 4.2500%
64 909,765 948,375 948,429 1.00 4.2441% 4.2500%
65 540,376 563,411 563,342 1.00 4.2626% 4.2500%
66 159,720 166,508 166,508 1.00 4.2497% 4.2500%
67 162,914 169,839 169,838 1.00 4.2505% 4.2500%
68 132,806 138,450 138,450 1.00 4.2499% 4.2500%
69 99,481 103,708 103,709 1.00 4.2494% 4.2500%
70 104,535 108,977 108,978 1.00 4.2496% 4.2500%
Page 3

Actual %Expected
General/COLA %
Ratio of Actual to
ExpectedAge
Increase %
City of Rockville
Salary Experience for Admin EmployeesTable 1 Fiscal Years 2011 - 2015
Salary Experience of Active Employees Thrift and DB Plans
Total Salary BOY
Actual w/
General/COLA
Salary EOY
General Salary
EOY
71 167,190 174,297 174,296 1.00 4.2507% 4.2500%
72 27,499 28,668 28,668 1.00 4.2500% 4.2500%
73 27,774 28,954 28,954 1.00 4.2500% 4.2500%
74 61,984 63,930 64,618 0.74 3.1392% 4.2500%
75 62,550 64,521 65,208 0.74 3.1503% 4.2500%
76 0 0 0 0.00 0.0000% 4.2500%
77 0 0 0 0.00 0.0000% 4.2500%
78 0 0 0 0.00 0.0000% 4.2500%
79 0 0 0 0.00 0.0000% 4.2500%
80 0 0 0 0.00 0.0000% 4.2500%
81 0 0 0 0.00 0.0000% 4.2500%
82 0 0 0 0.00 0.0000% 4.2500%
83 0 0 0 0.00 0.0000% 4.2500%
84 0 0 0 0.00 0.0000% 4.2500%
85 0 0 0 0.00 0.0000% 4.2500%
Total 88,172,318 92,369,199 91,919,641 1.12 4.7599% 4.2500%
Page 4

Actual % Recommended %Total Salary BOY
Actual w/
General/COLA
Salary EOY
Recommended
Salary EOY
Ratio of Actual to
Recommended
City of Rockville
Salary Experience for Admin EmployeesTable 1A (Recommended) Fiscal Years 2011 - 2015
Salary Experience of Active Employees Thrift and DB Plans
Increase %
Age
21 65,889 68,690 70,337 0.63 4.2503% 6.7500%
22 104,175 114,835 111,207 1.52 10.2332% 6.7500%
23 165,759 172,311 176,119 0.63 3.9528% 6.2500%
24 201,928 218,329 214,549 1.30 8.1222% 6.2500%
25 526,757 558,528 559,679 0.97 6.0314% 6.2500%
26 736,245 782,624 782,260 1.01 6.2994% 6.2500%
27 705,520 755,716 749,615 1.14 7.1147% 6.2500%
28 1,049,491 1,145,215 1,115,084 1.46 9.1209% 6.2500%
29 1,082,982 1,136,315 1,150,668 0.79 4.9246% 6.2500%
30 941,028 1,036,901 999,842 1.63 10.1881% 6.2500%
31 1,732,042 1,782,442 1,840,295 0.47 2.9099% 6.2500%
32 1,738,718 1,819,951 1,847,388 0.75 4.6720% 6.2500%
33 1,628,611 1,710,017 1,705,970 1.05 4.9985% 4.7500%
34 1,452,578 1,523,668 1,521,575 1.03 4.8940% 4.7500%
35 1,905,816 1,990,752 1,996,342 0.94 4.4567% 4.7500%
36 2,111,600 2,212,414 2,211,901 1.01 4.7743% 4.7500%
37 1,854,995 1,942,950 1,943,107 1.00 4.7415% 4.7500%
38 1,790,986 1,871,647 1,876,058 0.95 4.5037% 4.7500%
39 1,194,764 1,245,541 1,251,515 0.89 4.2500% 4.7500%
40 1,708,251 1,795,029 1,789,393 1.07 5.0799% 4.7500%
41 2,122,997 2,187,184 2,223,839 0.64 3.0234% 4.7500%
42 1,980,595 2,096,279 2,074,673 1.23 5.8409% 4.7500%
43 2,233,165 2,343,630 2,339,240 1.04 4.9466% 4.7500%
44 2,583,654 2,662,140 2,706,378 0.64 3.0378% 4.7500%
45 2,794,267 2,925,063 2,926,995 0.99 4.6809% 4.7500%
46 3,348,898 3,494,138 3,507,971 0.91 4.3370% 4.7500%
47 3,968,026 4,121,376 4,156,507 0.81 3.8647% 4.7500%
48 3,946,812 4,109,813 4,134,286 0.87 4.1299% 4.7500%
49 3,744,466 3,984,449 3,922,328 1.35 6.4090% 4.7500%
50 3,941,327 4,135,703 4,128,540 1.04 4.9317% 4.7500%
51 3,478,254 3,569,464 3,643,471 0.55 2.6223% 4.7500%
52 3,721,095 3,901,256 3,897,847 1.02 4.8416% 4.7500%
53 3,274,142 3,463,800 3,429,664 1.22 5.7926% 4.7500%
54 3,110,621 3,250,468 3,258,375 0.95 4.4958% 4.7500%
55 2,482,468 2,603,628 2,600,386 1.03 4.8806% 4.7500%
56 2,473,663 2,612,823 2,591,162 1.18 5.6256% 4.7500%
57 2,284,988 2,382,123 2,393,525 0.89 4.2510% 4.7500%
58 2,814,040 2,978,379 2,947,707 1.23 5.8400% 4.7500%
59 2,042,986 2,152,860 2,140,028 1.13 5.3781% 4.7500%
60 1,496,628 1,559,729 1,567,718 0.89 4.2162% 4.7500%
61 2,456,941 2,560,843 2,573,646 0.89 4.2289% 4.7500%
62 1,469,349 1,529,877 1,539,143 0.87 4.1194% 4.7500%
63 1,248,206 1,300,664 1,307,496 0.88 4.2027% 4.7500%
64 909,765 948,375 952,978 0.89 4.2441% 4.7500%
65 540,376 563,411 566,044 0.90 4.2626% 4.7500%
66 159,720 166,508 167,307 0.89 4.2497% 4.7500%
67 162,914 169,839 170,652 0.89 4.2505% 4.7500%
68 132,806 138,450 139,114 0.89 4.2499% 4.7500%
69 99,481 103,708 104,206 0.89 4.2494% 4.7500%
70 104,535 108,977 109,500 0.89 4.2496% 4.7500%
Total 88,172,318 92,369,199 92,497,111 0.97 4.7599% 4.9049%
Page 5

Actual %Expected
General/COLA %
Ratio of Actual to
ExpectedAge
Increase %
City of Rockville
Salary Experience for Union EmployeesTable 2 Fiscal Years 2011 - 2015
Salary Experience of Active Employees Thrift and DB Plans
Total Salary BOY
Actual w/
General/COLA
Salary EOY
General Salary
EOY
19 30,086 31,213 31,214 1.00 3.7471% 3.7500%
20 92,086 95,538 95,539 1.00 3.7490% 3.7500%
21 61,380 64,706 63,682 1.45 5.4194% 3.7500%
22 63,615 69,994 66,001 2.67 10.0269% 3.7500%
23 62,608 67,689 64,956 2.16 8.1152% 3.7500%
24 96,301 101,069 99,912 1.32 4.9509% 3.7500%
25 61,988 64,313 64,313 1.00 3.7504% 3.7500%
26 139,920 147,954 145,167 1.53 5.7417% 3.7500%
27 44,447 51,642 46,114 4.32 16.1880% 3.7500%
28 68,523 71,093 71,093 1.00 3.7512% 3.7500%
29 260,637 278,372 270,411 1.81 6.8044% 3.7500%
30 330,102 339,427 342,481 0.75 2.8248% 3.7500%
31 331,828 353,116 344,272 1.71 6.4154% 3.7500%
32 354,159 376,581 367,440 1.69 6.3311% 3.7500%
33 319,052 340,045 331,016 1.75 6.5799% 3.7500%
34 396,143 432,839 410,998 2.47 9.2633% 3.7500%
35 356,480 371,164 369,848 1.10 4.1191% 3.7500%
36 316,370 329,524 328,234 1.11 4.1579% 3.7500%
37 326,771 347,674 339,025 1.71 6.3970% 3.7500%
38 447,962 460,394 464,761 0.74 2.7752% 3.7500%
39 330,286 350,312 342,672 1.62 6.0634% 3.7500%
40 214,305 226,467 222,341 1.51 5.6751% 3.7500%
41 103,361 107,239 107,237 1.00 3.7515% 3.7500%
42 79,849 85,286 82,843 1.82 6.8085% 3.7500%
43 241,089 250,130 250,130 1.00 3.7500% 3.7500%
44 330,194 342,577 342,576 1.00 3.7503% 3.7500%
45 436,551 459,250 452,922 1.39 5.1995% 3.7500%
46 760,557 814,372 789,078 1.89 7.0757% 3.7500%
47 715,426 746,424 742,254 1.16 4.3328% 3.7500%
48 827,841 881,638 858,885 1.73 6.4984% 3.7500%
49 847,149 889,089 878,917 1.32 4.9507% 3.7500%
50 764,236 799,274 792,895 1.22 4.5847% 3.7500%
51 796,344 830,369 826,207 1.14 4.2727% 3.7500%
52 733,503 764,389 761,009 1.12 4.2108% 3.7500%
53 700,874 728,168 727,157 1.04 3.8943% 3.7500%
54 695,552 723,400 721,636 1.07 4.0036% 3.7500%
55 510,225 531,668 529,358 1.12 4.2027% 3.7500%
56 428,091 445,129 444,145 1.06 3.9800% 3.7500%
57 373,116 387,158 387,108 1.00 3.7634% 3.7500%
58 211,365 219,291 219,291 1.00 3.7498% 3.7500%
59 153,453 162,253 159,207 1.53 5.7346% 3.7500%
60 93,606 98,379 97,117 1.36 5.0986% 3.7500%
61 55,916 58,039 58,013 1.01 3.7967% 3.7500%
62 145,852 151,320 151,321 1.00 3.7492% 3.7500%
63 89,679 93,042 93,042 1.00 3.7505% 3.7500%
64 84,240 87,399 87,399 1.00 3.7506% 3.7500%
65 52,912 54,896 54,896 1.00 3.7498% 3.7500%
66 0 0 0 0.00 0.0000% 3.7500%
67 0 0 0 0.00 0.0000% 3.7500%
68 0 0 0 0.00 0.0000% 3.7500%
69 31,063 33,276 32,228 1.90 7.1243% 3.7500%
70 32,394 33,608 33,609 1.00 3.7472% 3.7500%
Page 6

Actual %Expected
General/COLA %
Ratio of Actual to
ExpectedAge
Increase %
City of Rockville
Salary Experience for Union EmployeesTable 2 Fiscal Years 2011 - 2015
Salary Experience of Active Employees Thrift and DB Plans
Total Salary BOY
Actual w/
General/COLA
Salary EOY
General Salary
EOY
71 33,041 34,280 34,280 1.00 3.7506% 3.7500%
72 33,702 34,966 34,966 1.00 3.7499% 3.7500%
73 0 0 0 0.00 0.0000% 3.7500%
74 0 0 0 0.00 0.0000% 3.7500%
75 0 0 0 0.00 0.0000% 3.7500%
76 0 0 0 0.00 0.0000% 3.7500%
77 0 0 0 0.00 0.0000% 3.7500%
78 0 0 0 0.00 0.0000% 3.7500%
79 0 0 0 0.00 0.0000% 3.7500%
80 0 0 0 0.00 0.0000% 3.7500%
81 0 0 0 0.00 0.0000% 3.7500%
82 0 0 0 0.00 0.0000% 3.7500%
83 0 0 0 0.00 0.0000% 3.7500%
84 0 0 0 0.00 0.0000% 3.7500%
85 0 0 0 0.00 0.0000% 3.7500%
Total 15,066,231 15,817,435 15,631,215 1.33 4.9860% 3.7500%
Page 7

Actual % Recommended %Total Salary BOY
Actual w/
General/COLA
Salary EOY
Recommended
Salary EOY
Ratio of Actual to
Recommended
City of Rockville
Salary Experience for Union EmployeesTable 2A (Recommended) Fiscal Years 2011 - 2015
Salary Experience of Active Employees Thrift and DB Plans
Increase %
Age
19 30,086 30,912 31,891 0.46 2.7471% 6.0000%
20 92,086 95,538 97,611 0.62 3.7490% 6.0000%
21 61,380 64,706 65,063 0.90 5.4194% 6.0000%
22 63,615 69,994 67,432 1.67 10.0269% 6.0000%
23 62,608 67,689 66,364 1.35 8.1152% 6.0000%
24 96,301 101,069 102,079 0.83 4.9509% 6.0000%
25 61,988 64,313 65,707 0.63 3.7504% 6.0000%
26 139,920 147,954 148,315 0.96 5.7417% 6.0000%
27 44,447 51,642 47,114 2.70 16.1880% 6.0000%
28 68,523 71,093 72,634 0.63 3.7512% 6.0000%
29 260,637 278,372 276,275 1.13 6.8044% 6.0000%
30 330,102 339,427 349,908 0.47 2.8248% 6.0000%
31 331,828 353,116 351,738 1.07 6.4154% 6.0000%
32 354,159 376,581 375,409 1.06 6.3311% 6.0000%
33 319,052 340,045 338,195 1.10 6.5799% 6.0000%
34 396,143 432,839 419,912 1.54 9.2633% 6.0000%
35 356,480 371,164 377,869 0.69 4.1191% 6.0000%
36 316,370 329,524 331,398 0.88 4.1579% 4.7500%
37 326,771 347,674 342,293 1.35 6.3970% 4.7500%
38 447,962 460,394 469,240 0.58 2.7752% 4.7500%
39 330,286 350,312 345,975 1.28 6.0634% 4.7500%
40 214,305 226,467 224,484 1.19 5.6751% 4.7500%
41 103,361 107,239 108,271 0.79 3.7515% 4.7500%
42 79,849 85,286 83,642 1.43 6.8085% 4.7500%
43 241,089 250,130 252,541 0.79 3.7500% 4.7500%
44 330,194 342,577 345,878 0.79 3.7503% 4.7500%
45 436,551 459,250 457,287 1.09 5.1995% 4.7500%
46 760,557 814,372 796,684 1.49 7.0757% 4.7500%
47 715,426 746,424 749,408 0.91 4.3328% 4.7500%
48 827,841 881,638 867,163 1.37 6.4984% 4.7500%
49 847,149 889,089 887,389 1.04 4.9507% 4.7500%
50 764,236 799,274 800,537 0.97 4.5847% 4.7500%
51 796,344 830,369 834,171 0.90 4.2727% 4.7500%
52 733,503 764,389 768,344 0.89 4.2108% 4.7500%
53 700,874 728,168 734,166 0.82 3.8943% 4.7500%
54 695,552 723,400 728,591 0.84 4.0036% 4.7500%
55 510,225 531,668 534,460 0.88 4.2027% 4.7500%
56 428,091 445,129 448,426 0.84 3.9800% 4.7500%
57 373,116 387,158 390,839 0.79 3.7634% 4.7500%
58 211,365 219,291 221,405 0.79 3.7498% 4.7500%
59 153,453 162,253 160,742 1.21 5.7346% 4.7500%
60 93,606 98,379 98,053 1.07 5.0986% 4.7500%
61 55,916 58,039 58,572 0.80 3.7967% 4.7500%
62 145,852 151,320 152,780 0.79 3.7492% 4.7500%
63 89,679 93,042 93,939 0.79 3.7505% 4.7500%
64 84,240 87,399 88,241 0.79 3.7506% 4.7500%
65 52,912 54,896 55,425 0.79 3.7498% 4.7500%
66 0 0 0 0.00 0.0000% 4.7500%
67 0 0 0 0.00 0.0000% 4.7500%
68 0 0 0 0.00 0.0000% 4.7500%
69 31,063 33,276 32,538 1.50 7.1243% 4.7500%
70 32,394 33,608 33,933 0.79 3.7472% 4.7500%
Total 15,066,231 15,817,135 15,820,878 1.00 4.9840% 5.0089%
Page 8
Actual % Expected %
Ratio of Actual to
ExpectedAge
Increase %
City of Rockville
Salary Experience for Police PlanTable 3 Fiscal Years 2011 - 2015
Salary Experience of Active Employees Police Employees
Total Salary BOY
Actual w/
General/COLA
Salary EOY
Expected Salary
EOY
23 52,278 54,369 56,602 0.48 3.9989% 8.2718%
24 153,342 170,866 165,719 1.42 11.4278% 8.0712%
25 164,314 173,901 177,266 0.74 5.8345% 7.8824%
26 170,013 182,427 183,113 0.95 7.3019% 7.7054%
27 275,576 291,968 296,453 0.79 5.9483% 7.5756%
28 389,237 407,511 418,035 0.63 4.6948% 7.3986%
29 386,967 436,542 415,141 1.76 12.8112% 7.2806%
30 646,659 675,540 692,977 0.62 4.4662% 7.1626%
31 280,690 297,361 300,497 0.84 5.9393% 7.0564%
32 166,777 176,344 178,368 0.83 5.7365% 6.9502%
33 252,927 265,817 270,207 0.75 5.0965% 6.8322%
34 373,626 388,571 398,756 0.59 3.9999% 6.7260%
35 552,005 579,598 588,547 0.76 4.9987% 6.6198%
36 639,746 671,346 681,567 0.76 4.9395% 6.5372%
37 823,719 856,669 876,789 0.62 4.0002% 6.4428%
38 821,131 860,115 873,260 0.75 4.7477% 6.3484%
39 729,794 758,983 775,349 0.64 3.9996% 6.2422%
40 854,579 891,483 907,218 0.70 4.3184% 6.1596%
41 661,359 695,786 701,550 0.86 5.2055% 6.0770%
42 597,278 625,976 633,152 0.80 4.8048% 6.0062%
43 443,792 464,344 470,080 0.78 4.6309% 5.9236%
44 330,927 344,163 350,256 0.68 3.9998% 5.8410%
45 552,079 577,120 583,935 0.79 4.5357% 5.7702%
46 468,494 487,233 495,195 0.70 3.9998% 5.6994%
47 853,291 902,254 901,319 1.02 5.7382% 5.6286%
48 990,694 1,038,947 1,045,872 0.87 4.8706% 5.5696%
49 592,126 615,808 624,756 0.73 3.9996% 5.5106%
50 662,497 688,997 698,614 0.73 4.0001% 5.4516%
51 240,412 250,028 253,376 0.74 3.9999% 5.3926%
52 245,220 255,029 258,299 0.75 4.0002% 5.3336%
53 439,795 468,066 463,044 1.22 6.4282% 5.2864%
54 191,567 199,229 201,581 0.77 3.9998% 5.2274%
55 195,398 203,214 205,497 0.77 4.0000% 5.1684%
56 323,412 336,347 339,898 0.78 3.9997% 5.0976%
57 125,346 130,375 131,632 0.80 4.0123% 5.0150%
58 224,334 233,395 235,373 0.82 4.0391% 4.9206%
59 233,487 242,738 244,673 0.83 3.9620% 4.7908%
60 104,006 108,166 108,792 0.87 3.9999% 4.6020%
Total 16,208,893 17,006,629 17,202,758 0.80 4.9216% 6.1316%
Page 9

Actual % Recommended %Total Salary BOY
Actual w/
General/COLA
Salary EOY
Recommended
Salary EOY
Ratio of Actual to
Recommended
City of Rockville
Salary Experience for Police PlanTable 3A (Recommended) Fiscal Years 2011 - 2015
Salary Experience of Active Employees Police Employees
Increase %
Age
23 52,278 54,369 55,415 0.67 3.9989% 6.0000%
24 153,342 170,866 170,210 1.04 11.4278% 11.0000%
25 164,314 173,901 174,994 0.90 5.8345% 6.5000%
26 170,013 182,427 181,064 1.12 7.3019% 6.5000%
27 275,576 291,968 292,111 0.99 5.9483% 6.0000%
28 389,237 407,511 408,699 0.94 4.6948% 5.0000%
29 386,967 436,542 435,338 1.02 12.8112% 12.5000%
30 646,659 675,540 677,375 0.94 4.4662% 4.7500%
31 280,690 297,361 294,023 1.25 5.9393% 4.7500%
32 166,777 176,344 174,699 1.21 5.7365% 4.7500%
33 252,927 265,817 264,941 1.07 5.0965% 4.7500%
34 373,626 388,571 391,373 0.84 3.9999% 4.7500%
35 552,005 579,598 578,225 1.05 4.9987% 4.7500%
36 639,746 671,346 670,134 1.04 4.9395% 4.7500%
37 823,719 856,669 862,845 0.84 4.0002% 4.7500%
38 821,131 860,115 860,135 1.00 4.7477% 4.7500%
39 729,794 758,983 764,459 0.84 3.9996% 4.7500%
40 854,579 891,483 895,172 0.91 4.3184% 4.7500%
41 661,359 695,786 692,774 1.10 5.2055% 4.7500%
42 597,278 625,976 625,649 1.01 4.8048% 4.7500%
43 443,792 464,344 464,872 0.97 4.6309% 4.7500%
44 330,927 344,163 346,646 0.84 3.9998% 4.7500%
45 552,079 577,120 578,303 0.95 4.5357% 4.7500%
46 468,494 487,233 490,747 0.84 3.9998% 4.7500%
47 853,291 902,254 893,822 1.21 5.7382% 4.7500%
48 990,694 1,038,947 1,037,752 1.03 4.8706% 4.7500%
49 592,126 615,808 620,252 0.84 3.9996% 4.7500%
50 662,497 688,997 693,966 0.84 4.0001% 4.7500%
51 240,412 250,028 251,832 0.84 3.9999% 4.7500%
52 245,220 255,029 256,868 0.84 4.0002% 4.7500%
53 439,795 468,066 460,685 1.35 6.4282% 4.7500%
54 191,567 199,229 200,666 0.84 3.9998% 4.7500%
55 195,398 203,214 204,679 0.84 4.0000% 4.7500%
56 323,412 336,347 338,774 0.84 3.9997% 4.7500%
57 125,346 130,375 131,300 0.84 4.0123% 4.7500%
58 224,334 233,395 234,990 0.85 4.0391% 4.7500%
59 233,487 242,738 244,578 0.83 3.9620% 4.7500%
60 104,006 108,166 108,946 0.84 3.9999% 4.7500%
Total 16,208,893 17,006,629 17,029,311 0.97 4.9216% 5.0615%
Page 10

Actual Expected Recommended Expected Recommended Actual Expected Recommended
Ratio of Actual to Retirement Rate
City of Rockville
Table 4 Fiscal Years 2011 - 2015
Retirement Experience of Active Members Admin & Union Employees
Age
Life Years
Exposed
Number of Retirements
Retirement Experience for Thrift and Defined Benefit (DB) Plans
50 43 1 0.0 1.1 0.00 0.93 2.3256% 0.0000% 2.5000%
51 42 1 0.0 1.1 0.00 0.95 2.3810% 0.0000% 2.5000%
52 51 1 1.3 1.3 0.78 0.78 1.9608% 2.5000% 2.5000%
53 45 1 1.1 1.1 0.89 0.89 2.2222% 2.5000% 2.5000%
54 42 2 1.1 2.1 1.90 0.95 4.7619% 2.5000% 5.0000%
55 36 3 0.9 1.8 3.33 1.67 8.3333% 2.5000% 5.0000%
56 32 0 0.8 1.6 0.00 0.00 0.0000% 2.5000% 5.0000%
57 34 2 1.0 1.7 1.96 1.18 5.8824% 3.0000% 5.0000%
58 34 2 1.4 1.7 1.47 1.18 5.8824% 4.0000% 5.0000%
59 30 7 1.5 7.5 4.67 0.93 23.3333% 5.0000% 25.0000%
60 35 7 4.2 7.0 1.67 1.00 20.0000% 12.0000% 20.0000%
61 40 5 8.0 8.0 0.63 0.63 12.5000% 20.0000% 20.0000%
62 31 6 6.2 6.2 0.97 0.97 19.3548% 20.0000% 20.0000%
63 25 5 5.0 5.0 1.00 1.00 20.0000% 20.0000% 20.0000%
64 20 5 6.0 5.0 0.83 1.00 25.0000% 30.0000% 25.0000%
65 14 3 3.5 3.5 0.86 0.86 21.4286% 25.0000% 25.0000%
66 6 3 1.5 1.5 2.00 2.00 50.0000% 25.0000% 25.0000%
67 3 0 0.8 0.8 0.00 0.00 0.0000% 25.0000% 25.0000%
68 2 0 0.5 0.5 0.00 0.00 0.0000% 25.0000% 25.0000%
69 3 0 0.8 0.8 0.00 0.00 0.0000% 25.0000% 25.0000%
70 3 0 3.0 3.0 0.00 0.00 0.0000% 100.0000% 100.0000%
Total 571 54 48.4 62.1 1.12 0.87 9.4571% 8.4816% 10.8800%
Page 11

Actual Expected Recommended Expected Recommended Actual Expected Recommended
<25 0 0 0.0 0.0 0.00 0.00 0.0000% 0.0000% 0.0000%
25-29 0 0 0.0 0.0 0.00 0.00 0.0000% 0.0000% 0.0000%
30-34 0 0 0.0 0.0 0.00 0.00 0.0000% 0.0000% 0.0000%
35-39 0 0 0.0 0.0 0.00 0.00 0.0000% 0.0000% 0.0000%
40-44 0 0 0.0 0.0 0.00 0.00 0.0000% 0.0000% 0.0000%
45-49 0 0 0.0 0.0 0.00 0.00 0.0000% 0.0000% 0.0000%
50-54 223 6 3.5 6.6 1.74 0.91 2.6906% 1.5471% 2.9709%
55-59 166 14 5.6 14.3 2.51 0.98 8.4337% 3.3614% 8.6145%
60-64 151 28 29.4 31.2 0.95 0.90 18.5430% 19.4702% 20.6623%
65-69 28 6 7.0 7.0 0.86 0.86 21.4286% 25.0000% 25.0000%
70-74 3 0 3.0 3.0 0.00 0.00 0.0000% 100.0000% 100.0000%
75-79 0 0 0.0 0.0 0.00 0.00 0.0000% 0.0000% 0.0000%
80-84 0 0 0.0 0.0 0.00 0.00 0.0000% 0.0000% 0.0000%
85-89 0 0 0.0 0.0 0.00 0.00 0.0000% 0.0000% 0.0000%
90-94 0 0 0.0 0.0 0.00 0.00 0.0000% 0.0000% 0.0000%
95-99 0 0 0.0 0.0 0.00 0.00 0.0000% 0.0000% 0.0000%
100 and over 0 0 0.0 0.0 0.00 0.00 0.0000% 0.0000% 0.0000%
Total 571 54 48.4 62.1 1.12 0.87 9.4571% 8.4816% 10.8800%
Table 4A Fiscal Years 2011 - 2015
City of Rockville
Retirement Experience of Active Members Admin & Union Employees
Age
Life Years
Exposed
Number of Retirements Ratio of Actual to Retirement Rate
Retirement Experience for Thrift and Defined Benefit (DB) Plans
Page 12

Actual Expected Recommended Expected Recommended Actual Expected Recommended
Ratio of Actual to Retirement Rate
City of Rockville
Table 5 Fiscal Years 2011 - 2015
Retirement Experience of Active Members Police Employees
Age
Life Years
Exposed
Number of Retirements
Retirement Experience for Police Plan
50 8 1 0.8 0.8 1.25 1.25 12.5000% 10.0000% 10.0000%
51 3 0 0.3 0.3 0.00 0.00 0.0000% 10.0000% 10.0000%
52 3 0 0.3 0.3 0.00 0.00 0.0000% 10.0000% 10.0000%
53 5 0 0.5 0.5 0.00 0.00 0.0000% 10.0000% 10.0000%
54 2 0 0.2 0.2 0.00 0.00 0.0000% 10.0000% 10.0000%
55 2 0 0.4 0.4 0.00 0.00 0.0000% 20.0000% 20.0000%
56 3 0 0.6 0.6 0.00 0.00 0.0000% 20.0000% 20.0000%
57 1 0 0.2 0.2 0.00 0.00 0.0000% 20.0000% 20.0000%
58 2 0 0.6 0.6 0.00 0.00 0.0000% 30.0000% 30.0000%
59 3 1 1.2 1.2 0.83 0.83 33.3333% 40.0000% 40.0000%
60 1 0 0.5 0.5 0.00 0.00 0.0000% 50.0000% 50.0000%
61 1 0 1.0 1.0 0.00 0.00 0.0000% 100.0000% 100.0000%
62 1 0 1.0 1.0 0.00 0.00 0.0000% 100.0000% 100.0000%
63 0 0 0.0 0.0 0.00 0.00 0.0000% 100.0000% 100.0000%
64 0 0 0.0 0.0 0.00 0.00 0.0000% 100.0000% 100.0000%
65 0 0 0.0 0.0 0.00 0.00 0.0000% 100.0000% 100.0000%
Total 35 2 7.6 7.6 0.26 0.26 5.7143% 21.7143% 21.7143%
Page 13

Actual Expected Recommended Expected Recommended Actual Expected Recommended
20-24 0 0 0.0 0.0 0.00 0.00 0.0000% 0.0000% 0.0000%
25-29 0 0 0.0 0.0 0.00 0.00 0.0000% 0.0000% 0.0000%
30-34 0 0 0.0 0.0 0.00 0.00 0.0000% 0.0000% 0.0000%
35-39 0 0 0.0 0.0 0.00 0.00 0.0000% 0.0000% 0.0000%
40-44 0 0 0.0 0.0 0.00 0.00 0.0000% 0.0000% 0.0000%
45-49 0 0 0.0 0.0 0.00 0.00 0.0000% 0.0000% 0.0000%
50-54 21 1 2.1 2.1 0.48 0.48 4.7619% 10.0000% 10.0000%
55-59 11 1 3.0 3.0 0.33 0.33 9.0909% 27.2727% 27.2727%
60-64 3 0 2.5 2.5 0.00 0.00 0.0000% 83.3333% 83.3333%
65-69 0 0 0.0 0.0 0.00 0.00 0.0000% 0.0000% 0.0000%
70-74 0 0 0.0 0.0 0.00 0.00 0.0000% 0.0000% 0.0000%
75-79 0 0 0.0 0.0 0.00 0.00 0.0000% 0.0000% 0.0000%
80-84 0 0 0.0 0.0 0.00 0.00 0.0000% 0.0000% 0.0000%
85-89 0 0 0.0 0.0 0.00 0.00 0.0000% 0.0000% 0.0000%
90-94 0 0 0.0 0.0 0.00 0.00 0.0000% 0.0000% 0.0000%
95-99 0 0 0.0 0.0 0.00 0.00 0.0000% 0.0000% 0.0000%
100 and over 0 0 0.0 0.0 0.00 0.00 0.0000% 0.0000% 0.0000%
Total 35 2 7.6 7.6 0.26 0.26 5.7143% 21.7143% 21.7143%
City of Rockville
Table 5A Fiscal Years 2011 - 2015
Retirement Experience of Active Members Police Employees
Age
Life Years
Exposed
Number of Retirements Ratio of Actual to Retirement Rate
Retirement Experience for Police Plan
Page 14

Actual Expected Recommended Expected Recommended Actual Expected Recommended
0 150 28 18.0 25.5 1.56 1.00 18.6978% 12.0000% 17.0000%
1 100 10 11.0 13.0 0.91 1.00 10.0000% 11.0000% 13.0000%
2 119 16 11.9 14.3 1.34 1.00 13.4172% 10.0000% 12.0000%
3 118 16 11.2 13.0 1.43 1.00 13.5593% 9.5000% 11.0000%
4 132 10 11.9 13.2 0.84 1.00 7.5758% 9.0000% 10.0000%
5 151 12 12.0 13.5 1.00 1.00 7.9734% 8.0000% 9.0000%
6 120 14 8.4 9.6 1.67 1.00 11.6667% 7.0000% 8.0000%
7 99 4 4.9 4.9 0.81 1.00 4.0506% 5.0000% 5.0000%
8 73 4 3.6 3.6 1.10 1.00 5.5172% 5.0000% 5.0000%
9 58 7 2.6 2.9 2.69 1.00 12.1212% 4.5000% 5.0000%
10 45 2 1.8 1.8 1.11 1.00 4.4444% 4.0000% 4.0000%
11 51 2 1.8 1.8 1.13 1.00 3.9604% 3.5000% 3.5000%
12 41 2 1.4 1.4 1.39 1.00 4.8780% 3.5000% 3.5000%
13 37 4 1.3 1.3 3.07 1.00 10.7383% 3.5000% 3.5000%
14 29 1 1.0 1.0 1.00 1.00 3.5088% 3.5000% 3.5000%
15 21 2 0.7 0.7 2.79 1.00 9.7561% 3.5000% 3.5000%
16 19 1 0.7 0.7 1.50 1.00 5.2632% 3.5000% 3.5000%
17 10 2 0.3 0.3 5.86 1.00 20.5128% 3.5000% 3.5000%
18 11 1 0.4 0.4 2.60 1.00 9.0909% 3.5000% 3.5000%
19 12 0 0.4 0.4 0.00 1.00 0.0000% 3.5000% 3.5000%
20 14 0 0.5 0.5 0.00 1.00 0.0000% 3.5000% 3.5000%
21 17 0 0.6 0.6 0.00 1.00 0.0000% 3.5000% 3.5000%
22 14 0 0.4 0.4 0.00 1.00 0.0000% 3.0000% 3.0000%
23 15 0 0.4 0.4 0.00 1.00 0.0000% 3.0000% 3.0000%
24 10 1 0.3 0.3 3.90 1.00 9.7561% 2.5000% 2.5000%
25 5 2 0.1 0.1 16.00 1.00 40.0000% 2.5000% 2.5000%
26 3 0 0.1 0.1 0.00 1.00 0.0000% 2.5000% 2.5000%
27 1 0 0.0 0.0 0.00 1.00 0.0000% 2.5000% 2.5000%
28 1 0 0.0 0.0 0.00 1.00 0.0000% 1.5000% 1.5000%
29 0 0 0.0 0.0 0.00 0.00 0.0000% 1.5000% 1.5000%
30 0 0 0.0 0.0 0.00 0.00 0.0000% 0.0000% 0.0000%
31 0 0 0.0 0.0 0.00 0.00 0.0000% 0.0000% 0.0000%
32 0 0 0.0 0.0 0.00 0.00 0.0000% 0.0000% 0.0000%
33 0 0 0.0 0.0 0.00 0.00 0.0000% 0.0000% 0.0000%
34 0 0 0.0 0.0 0.00 0.00 0.0000% 0.0000% 0.0000%
35 0 0 0.0 0.0 0.00 0.00 0.0000% 0.0000% 0.0000%
36 0 0 0.0 0.0 0.00 0.00 0.0000% 0.0000% 0.0000%
37 0 0 0.0 0.0 0.00 0.00 0.0000% 0.0000% 0.0000%
38 0 0 0.0 0.0 0.00 0.00 0.0000% 0.0000% 0.0000%
39 0 0 0.0 0.0 0.00 0.00 0.0000% 0.0000% 0.0000%
40 0 0 0.0 0.0 0.00 0.00 0.0000% 0.0000% 0.0000%
41+ 0 0 0.0 0.0 0.00 0.00 0.0000% 0.0000% 0.0000%
Total 1,474 141 107.9 125.8 1.31 1.12 9.5674% 7.3204% 8.5388%
ServiceLife Years
Exposed
Number of Terminations Ratio of Actual to Termination Rate
CITY OF ROCKVILLE
Termination Experience for Thrift and Defined Benefit (DB) PlansTable 6 Fiscal Years 2011 - 2015
Termination Experience of Active Employees Admin and Union Employees
Page 15

Actual Expected Recommended Expected Recommended Actual Expected Recommended
0-5 770 92 76 92 1.210 0.995 0.120 0.099 0.120
6-10 394 31 21 23 1.451 1.357 0.079 0.054 0.058
11-15 178 11 6 6 1.768 1.768 0.062 0.035 0.035
16-20 66 4 2 2 1.738 1.738 0.061 0.035 0.035
21-25 62 3 2 2 1.617 1.617 0.049 0.030 0.030
26-30 5 0 0 0 0.000 0.000 0.000 0.023 0.023
31-35 0 0 0 0 0.000 0.000 0.000 0.000 0.000
36-40 0 0 0 0 0.000 0.000 0.000 0.000 0.000
41-45 0 0 0 0 0.000 0.000 0.000 0.000 0.000
Total 1,474 141 108 126 1.307 1.120 0.096 0.073 0.085
Admin and Union Employees
Years of Service
Life Years
Exposed
Number of Terminations Ratio of Actual to Termination Rate
CITY OF ROCKVILLE
Termination Experience for Thrift and Defined Benefit (DB) PlansTable 6A Fiscal Years 2011 - 2015
Termination Experience of Active Employees
Page 16

Actual Expected Recommended Expected Recommended Actual Expected Recommended
0 11 2 2.1 2.1 0.95 0.95 19.0476% 20.0000% 20.0000%
1 9 0 1.9 1.9 0.00 0.00 0.0000% 20.0000% 20.0000%
2 8 0 0.8 0.8 0.00 0.00 0.0000% 10.0000% 10.0000%
3 10 0 0.6 0.6 0.00 0.00 0.0000% 6.0000% 6.0000%
4 14 1 0.7 0.7 1.40 1.40 7.0175% 5.0000% 5.0000%
5 12 0 0.5 0.5 0.00 0.00 0.0000% 4.0000% 4.0000%
6 15 3 0.5 0.5 6.56 6.56 19.6721% 3.0000% 3.0000%
7 11 1 0.3 0.3 3.03 3.03 9.0909% 3.0000% 3.0000%
8 8 0 0.2 0.2 0.00 0.00 0.0000% 2.0000% 2.0000%
9 12 2 0.1 0.1 17.39 17.39 17.3913% 1.0000% 1.0000%
10 9 0 0.1 0.1 0.00 0.00 0.0000% 1.0000% 1.0000%
11 11 1 0.1 0.1 9.30 9.30 9.3023% 1.0000% 1.0000%
12 12 0 0.1 0.1 0.00 0.00 0.0000% 1.0000% 1.0000%
13 12 0 0.1 0.1 0.00 0.00 0.0000% 1.0000% 1.0000%
14 10 0 0.1 0.1 0.00 0.00 0.0000% 1.0000% 1.0000%
15 6 0 0.1 0.1 0.00 0.00 0.0000% 1.0000% 1.0000%
16 7 0 0.1 0.1 0.00 0.00 0.0000% 1.0000% 1.0000%
17 6 0 0.1 0.1 0.00 0.00 0.0000% 1.0000% 1.0000%
18 5 0 0.1 0.1 0.00 0.00 0.0000% 1.0000% 1.0000%
19 4 0 0.0 0.0 0.00 0.00 0.0000% 1.0000% 1.0000%
20 2 0 0.0 0.0 0.00 0.00 0.0000% 1.0000% 1.0000%
21 4 0 0.0 0.0 0.00 0.00 0.0000% 1.0000% 1.0000%
22 6 0 0.1 0.1 0.00 0.00 0.0000% 1.0000% 1.0000%
23 7 0 0.1 0.1 0.00 0.00 0.0000% 1.0000% 1.0000%
24 6 0 0.1 0.1 0.00 0.00 0.0000% 1.0000% 1.0000%
25 0 0 0.0 0.0 0.00 0.00 0.0000% 0.0000% 0.0000%
26 0 0 0.0 0.0 0.00 0.00 0.0000% 0.0000% 0.0000%
27 0 0 0.0 0.0 0.00 0.00 0.0000% 0.0000% 0.0000%
28 0 0 0.0 0.0 0.00 0.00 0.0000% 0.0000% 0.0000%
29 0 0 0.0 0.0 0.00 0.00 0.0000% 0.0000% 0.0000%
30 0 0 0.0 0.0 0.00 0.00 0.0000% 0.0000% 0.0000%
31 0 0 0.0 0.0 0.00 0.00 0.0000% 0.0000% 0.0000%
32 0 0 0.0 0.0 0.00 0.00 0.0000% 0.0000% 0.0000%
33 0 0 0.0 0.0 0.00 0.00 0.0000% 0.0000% 0.0000%
34 0 0 0.0 0.0 0.00 0.00 0.0000% 0.0000% 0.0000%
35 0 0 0.0 0.0 0.00 0.00 0.0000% 0.0000% 0.0000%
36 0 0 0.0 0.0 0.00 0.00 0.0000% 0.0000% 0.0000%
37 0 0 0.0 0.0 0.00 0.00 0.0000% 0.0000% 0.0000%
38 0 0 0.0 0.0 0.00 0.00 0.0000% 0.0000% 0.0000%
39 0 0 0.0 0.0 0.00 0.00 0.0000% 0.0000% 0.0000%
40 0 0 0.0 0.0 0.00 0.00 0.0000% 0.0000% 0.0000%
41 0 0 0.0 0.0 0.00 0.00 0.0000% 0.0000% 0.0000%
Total 215 10 8.6 8.6 1.16 1.16 4.6566% 4.0268% 4.0268%
Termination Experience for Police Plan
ServiceLife Years
Exposed
Number of Terminations Termination Rate
CITY OF ROCKVILLE
Table 7 Fiscal Years 2011 - 2015
Termination Experience of Active Employees Police Employees
Ratio of Actual to
Page 17

Actual Expected Recommended Expected Recommended Actual Expected Recommended
0-5 64 3 7 7 0.459 0.459 0.047 0.102 0.102
6-10 55 6 1 1 5.195 5.195 0.110 0.021 0.021
11-15 50 1 1 1 2.000 2.000 0.020 0.010 0.010
16-20 24 0 0 0 0.000 0.000 0.000 0.010 0.010
21-25 22 0 0 0 0.000 0.000 0.000 0.010 0.010
26-30 0 0 0 0 0.000 0.000 0.000 0.000 0.000
31-35 0 0 0 0 0.000 0.000 0.000 0.000 0.000
36-40 0 0 0 0 0.000 0.000 0.000 0.000 0.000
41-45 0 0 0 0 0.000 0.000 0.000 0.000 0.000
Total 215 10 9 9 1.156 1.156 0.047 0.040 0.040
Police Employees
Years of Service
Life Years
Exposed
Number of Terminations Ratio of Actual to Termination Rate
CITY OF ROCKVILLE
Termination Experience for Police PlanTable 7A Fiscal Years 2011 - 2015
Termination Experience of Active Employees
Page 18
Top Related