


Languages
Pages
Legal

JB Malone, P Nieto, P Mischler, M Mar3ns, JC McCarroll Louisiana State University, USA
Penelope Vounatsou, Ronaldo Scholte Swiss TPH, Switzerland
ME Bavia Universidade Federal da Bahia, Brazil
Mapping and Modeling Neglected Tropical Diseases and Poverty in Brazil, Bolivia and Colombia
HyspIRI Symposium, NASA Goddard Space Flight Center , May 29-‐30, 2013

Objec3ves
• Data Portal – A resource data base accessible by FTP was developed for 6 NTD in Brazil, Bolivia and Colombia (Chagas disease, Leishmaniasis, Schistosomiasis, Leprosy, Lympha3c Filariasis and Soil-‐TransmiQed Helminths), with relevant clima3c, environmental, popula3on and poverty data
• Risk Modeling – Maximum Entropy, Bayesian and GIS methodologies were used to map and model environmental and socioeconomic risk of 6 NTD
• Course Development – A 4-‐day short course was developed for training use by PAHO on data portal access and geospa3al analysis using ArcGIS 9.3.1, Maximum Entropy (Maxent) and Bayesian modeling

Data Portal All data clipped to the country boundary; WGS84 projec3on, 1 km spa3al resolu3on; in ASCII format for Maxent or Bayesian modeling This example shows the data available for Colombia Worldclim (global coverage, Ikm resolu3on) used for ecological Niche modeling and by the climate change community MODIS EVI, LST annual composites for 2005-‐2009 Socioeconomic Data at the Municipality level

Worldclim Global Climate Data Tmin, Tmax, Precip, SRTM, Bioclim – 1 km resolu3on Bioclima3c variables are derived from the monthly temperature and rainfall values in order to generate more biologically meaningful variables. These are oben used in ecological niche modeling (e.g., BIOCLIM, GARP). BIO1 = Annual Mean Temperature BIO2 = Mean Diurnal Range (Mean of monthly (max temp -‐ min temp)) BIO3 = Isothermality (P2/P7) (* 100) BIO4 = Temperature Seasonality (standard devia3on *100) BIO5 = Max Temperature of Warmest Month BIO6 = Min Temperature of Coldest Month BIO7 = Temperature Annual Range (P5-‐P6) BIO8 = Mean Temperature of WeQest Quarter BIO9 = Mean Temperature of Driest Quarter BIO10 = Mean Temperature of Warmest Quarter BIO11 = Mean Temperature of Coldest Quarter BIO12 = Annual Precipita3on BIO13 = Precipita3on of WeQest Month BIO14 = Precipita3on of Driest Month BIO15 = Precipita3on Seasonality (Coefficient of Varia3on) BIO16 = Precipita3on of WeQest Quarter BIO17 = Precipita3on of Driest Quarter BIO18 = Precipita3on of Warmest Quarter BIO19 = Precipita3on of Coldest Quarter

MODIS Mean annual composites for 2005-‐2009: Enhanced Vegeta3on index (EVI), Normalized difference Vegeta3on Index (NDVI) Land surface temperature (LST) day and night and dT
Climate GRID Long term normal (LTN) climate grid (18x18 km cell size) – Precip, Tmax, Tmin, PET, PPE
Environmental World Wildlife Fund Ecoregions Loca3ons of springs, dams, rivers, small streams
Health Data Bolivia: Ministerio de Salud y Deportes/ Sistema Nacional de información en Salud
Brazil: Ministerio da Saude, SINAN Colombia: Ins3tuto Nacional de salud/Estadís3cas de la Vigilancia en Salud Pública
Ministerios de la protección Social (SIVIGILA) , literature reports. Infrastructure
Roads, airfields/airports, rail road lines layer, u3lity lines Poli<cal Boundaries
Coun3es, major ci3es, States/Departments, Municipali3es
Contents of Data Portal/FTP Site

Socioeconomical Variables at Municipality Level Used for Risk Analysis of NTDs in Colombia
Area of municipality Floors: carpet, marmol, hardwood, tablet Garbage: in the river, stream, lake, lagoon
Displacement (just COL) Floors: carpet, brick , vinyl, Garbage: in another way
Popula3on Floors: cement Drinking water from: running water service
Extension Km2 Floors: tough wood, other vegetal material Drinking water from: well, pump
Human development index Floors: soil, sand Drinking water: rain fall
Unsa3sfied basic needs * UBN Walls: block, brick, stones, hardwood Drinking water: public tank
Miseria ( 2 or more *UBN) Walls: adobe, bahareque Drinking water: car-‐tank
Un adequate housing * UBN Walls: rough wood Drinking water from: river, stream, lake , lagoon
Unsa3sfied services* UBN Wall: pre fabricated walls Drinking water from: boQles, bag
Overcrowding * UBN Walls: cane, bamboo, vegetal material Infant mortality
Educa3onal needs* UBN Walls: zinc, fabric, cardboard, plas3c Life expectancy
Economical dependency*UBN No walls AQendance educa3onal ins3tu3on YES
Sewage Electricity: yes AQendance /educa3onal ins3tu3on NO Running water Electricity: no Toilet connected to sewage Garbage collec3on services
Toilet connected to sep3c tank Burrow the garbage Latrine Burn the garbage No sanitary service Garbage: pa3o, back yard, ditch
Table 1. Socioeconomical variables (47) selected for risk analysis of NTDs in Colombia *UBN: hMp://www.dane.gov.co/files/inves<gaciones/bole<nes/censo/Bol_nbi_censo_2005.pdf

Steven J. Phillips, Robert P. Anderson, Robert E. Schapire. Maximum entropy modeling of species geographic distribu<ons. Ecological Modelling, 190:231-‐259, 2006.
Opennlp.maxent package is a mature Java package for training and using maximum entropy models. Check out the Sourceforge page for Maxent for the latest news. You can also ask ques3ons and join in discussions on the forums. Download the latest version of Maxent.

Sivigila (disease reports) 29 environmental variables
Mul3ple regression Significant variables
Variables VIF<10
Maxent
Re run Maxent
Final Model
Literature vector reports
29 Environmental variables
Logis3c regression
Variance Infla3on factor
Variable selec3on Pearson’s
Environmental Models

Chagas Disease Trypanosoma cruzi -‐ 20 million infected in
the Americas -‐ Chronic Cardiomyopathy
Circula3ng Trypomas3gote and Tissue Amas3gote forms in mammals
Triatomid ‘kissing’ bug vectors
Romana’s Sign
Tissue amas3gote form

Chagas Vector Distribu3on
Ü Rhodnius prolixusEnvironmental Model
9.3
.1
Triatoma dimidiataEnvironmental Model
8.7
.1 Ü

Chagas vectors -‐ Environmental Niche model

Chagas Environmental Niche Model

Socio-‐Economical Model
Hdi, ubn, disp Ifm , epz
Mis, viv, ser, hac, ins, dep
Acd, poz, llu, pub , tan, queb,
bot Acu, slu, ase, acl Ino, let, nos, insp, Ent, que, pat, rio Mar,bal,
cem,mad,3er, blo, tap, tan, pref, veg, zin
Mul<ple Regression and VIF
Choose variables for weighted models
Combined (Socio economical –environmental)
final model
41 socio economical variables divided in 8 groups
Weighted model:
SocioEc 1
SocioEc 2
SocioEc 3
Re-‐classify
Maxent Environ Model
weighted
SocioEc Final model
Re-‐classify
Re-‐classify
Reclassify Re-‐classify
weighted

Socioeconomic Factors – Municipality level
Chagas DiseaseCombined Model
9.6
.1Ü

Variable Percent contribu<on
prec02_brazil 75.3
bio14_brazil 13.1
alt01_brazil 5.4
lstnight_2008_brazil 4.5
brazil_ubn24 1.1
brazil_gdp1 0.7
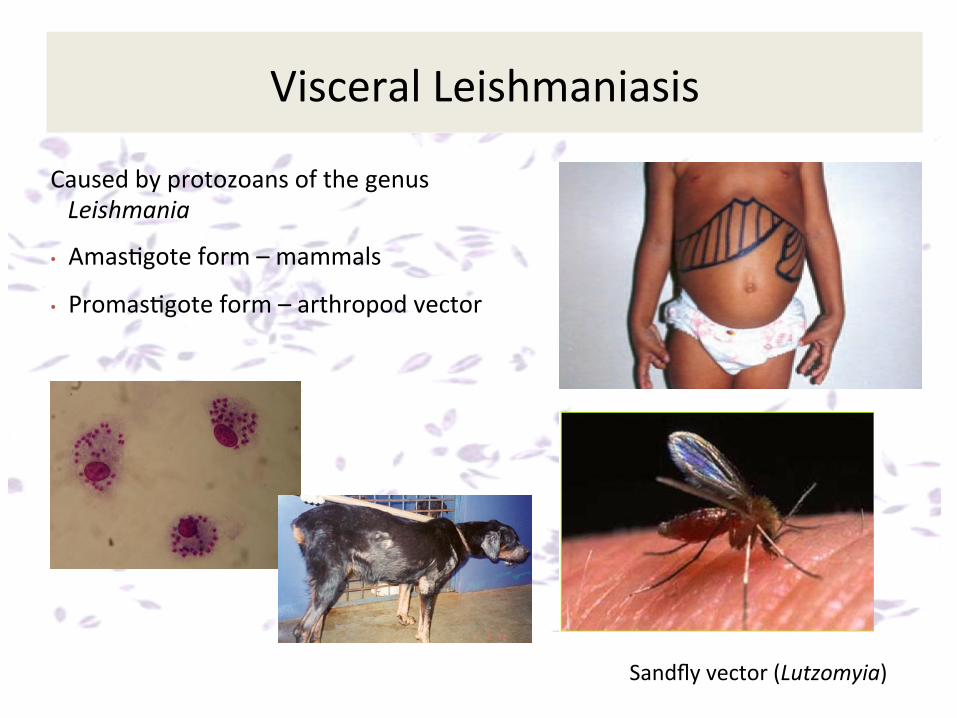
Visceral Leishmaniasis
Caused by protozoans of the genus Leishmania
• Amas3gote form – mammals
• Promas3gote form – arthropod vector
Sandfly vector (Lutzomyia)

Leishmania spp.
Maxent Environmental Model using Worldclim data Cutaneous Leishmaniasis
Maxent Environmental Model using Worldclim data Visceral Leishmaniasis
VL -‐ precipita3on of October (11.6%) ; mean temperature of warmest quarter
(14.5%) (AUC 0.948)
CL -‐ precipita3on of September (26.2%); annual precipita3on (17.3%)(AUC 0.80)
Leishmaniasis – Visceral and Cutaneous

The predicted risk map of leprosy overlaid with 2010 leprosy occurrence data.
Maxent predic3ve model showing the distribu3on probability of leprosy occurrence. Red indicates a higher probability of occurrence, while blue indicates a low probability of occurrence.
Leprosy in Brazil

Schistosomiasis

Hookworm in Bolivia
Conclusions and Recommenda3ons
1. Maxent Ecological Niche Modeling is a useful tool to guide surveillance and control programs for NTD, par3cularly where health surveillance data are scarce
2. Extrapola3on of risk surfaces is of limited validity where representa3ve survey data are absent in a given ecosystem
3. Socioeconomic data or poverty indicators should be at the census tract level; Municipality level data is typically too heterogeneous
4. Results of Maxent ecologic niche mapping and modeling should be validated by alterna3ve methods eg. biology based GDDxWB climate models
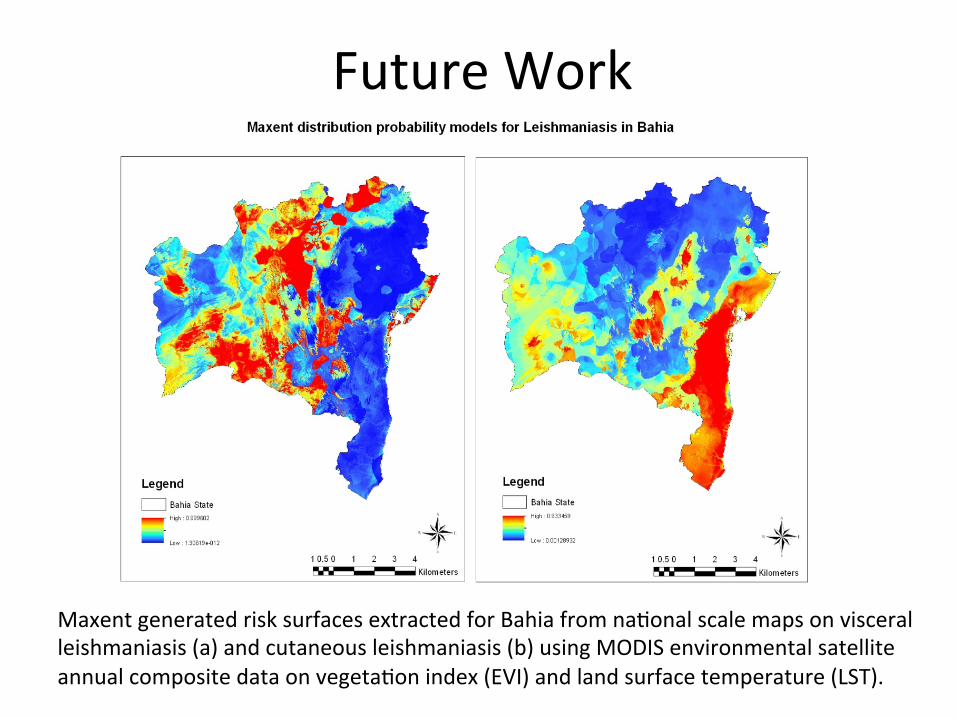
Future Work
Maxent generated risk surfaces extracted for Bahia from na3onal scale maps on visceral leishmaniasis (a) and cutaneous leishmaniasis (b) using MODIS environmental satellite annual composite data on vegeta3on index (EVI) and land surface temperature (LST).
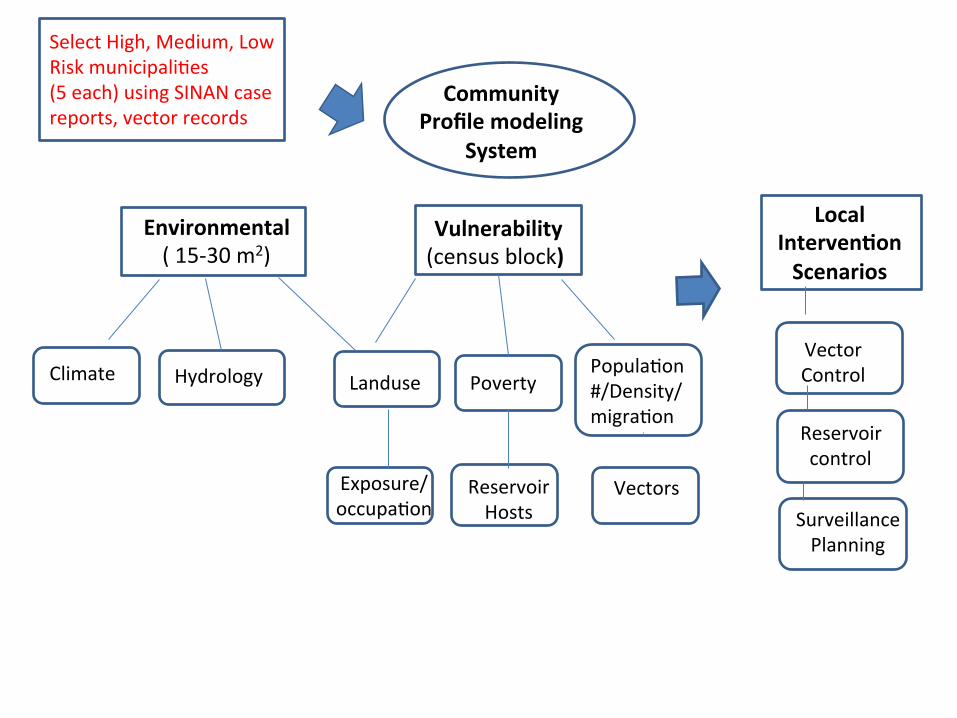
Local Interven<on Scenarios
Environmental ( 15-‐30 m2)
Vulnerability (census block)
Community Profile modeling
System
Climate
Hydrology Landuse Poverty
Popula3on #/Density/migra3on
Exposure/ occupa3on
Reservoir Hosts
Vectors
E
Vector Control
Select High, Medium, Low Risk municipali3es (5 each) using SINAN case reports, vector records
Reservoir control
Surveillance Planning
Top Related