


Languages
Pages
Legal


MAPPING OF FOLIAR DISEASE RESISTANCE GENES AND GENES FOR AGRO-
MORPHOLOGICAL TRAITS
IN Lens culinaris Medik.
By
GOPESH CHANDRA SAHA
A dissertation submitted in partial fulfillment of the requirements for the degree of
DOCTOR OF PHILOSOPHY
WASHINGTON STATE UNIVERSITY Department of Crop and Soil Sciences
DECEMBER, 2009

To the Faculty of Washington State University:
The members of the committee appointed to examine the dissertation of GOPESH CHANDRA SAHA find it satisfactory and recommend that it be accepted.
Weidong Chen
Stephen S. Jones
Steven E. Ullrich
Gary H. Thorgaard
Clarice Coyne
Fred J. Muehlbauer
ii
ACKNOWLEDGEMENTS I express my sincere thanks to my advisor and the committee chair Dr. Fred J. Muehlbauer for
his guidance, encouragement and support to achieve my long cherished desire for an advanced
degree in crop science. His kindness and affection will be remembered through out my life. I
would like to express my gratitude to Dr. Weidong Chen, Dr. Stephen S. Jones, Dr. Steve E.
Ullrich, Dr. Gary Thorgaard and Dr. Clarice Coyne for their inspiration and creative suggestions
to this dissertation.
I would like to give special thanks to Dr. Ashutosh Sarker for his kind effort to formulate the
USAID-ICARDA linkage project and introducing me to Dr. Muehlbauer for pursing my Ph.D.
research at Washington State University. Thanks are also extended to the Director of Pulse
Research Station, Ishurdi, Bangladesh and scientists for their sincere efforts in setting up the
experiments and taking good care of the research plots.
I would like to thank research leader of Grain Legume Genetics and Physiology Unit, USDA-
ARS, Dr. George Vandemark and the department of Crop and Soil Sciences for allowing me to
use laboratory, green house, field research facilities and office space. Special thanks to the lab
members and technician: Tony Chen, Sheri Rynearson, Sheri McGrew, Jarrod Pfaff, David
White, P.N. Rajesh, Evans Njambere, Renuka Attanayake for their help and for their friendship.
Heartfelt thanks to all the friends in the department of Crop and Soil Sciences for their
inspiration.
Finally, I would like to acknowledge USAID-ICARDA linkage project and Sclerotinia Initiative
for their funding support and financial assistance throughout my Ph.D. program.
I am indebted to my parents who have given me the vision and guidance on my way, and my
wife and kids for their sacrifice, encouragement and inspiration for the completion of the degree.
iii

MAPPING OF FOLIAR DISEASE RESISTANCE GENES AND GENES
FOR AGRO-MORPHOLOGICAL TRAITS IN Lens culinaris Medik.
Abstract
By Gopesh Chandra Saha, Ph.D. Washington State University
December 2009
Chair: Fred J. Muehlbauer `
Stemphylium blight (caused by stemphylium botryosum Wallr.) and rust (caused by
Uromyces fabae (Pers.) J. Schroet.) are important foliar diseases of lentil (Lens culinaris
Medik.). To map the genes for resistance to these two diseases, F6 derived F7 recombinant inbred
line (RIL) populations were developed by crossing ILL-5888 (susceptible to stemphylium blight
and rust) to ILL-6002 (resistant to stemphylium blight) and ILL-4605 (resistant to rust). One
population was used to map QTLs for resistance to stemphylium blight and genes for six agro-
morphological traits. The other population was used to map the gene for resistance to rust.
The genetic linkage map used to map QTL for resistance to stemphylium blight
comprised 139 markers distributed over 14 linkage groups. Three significant QTLs were
detected for stemphylium blight using data recorded at the Pulse Research Center (PRC), Ishurdi,
Bangladesh in 2009; whereas, one QTL was detected using 2007 data. QTL QLG480-81 was
common to both years and accounted for 25.2% and 46% of the phenotypic variation for blight
scores, respectively, for the two years.
iv
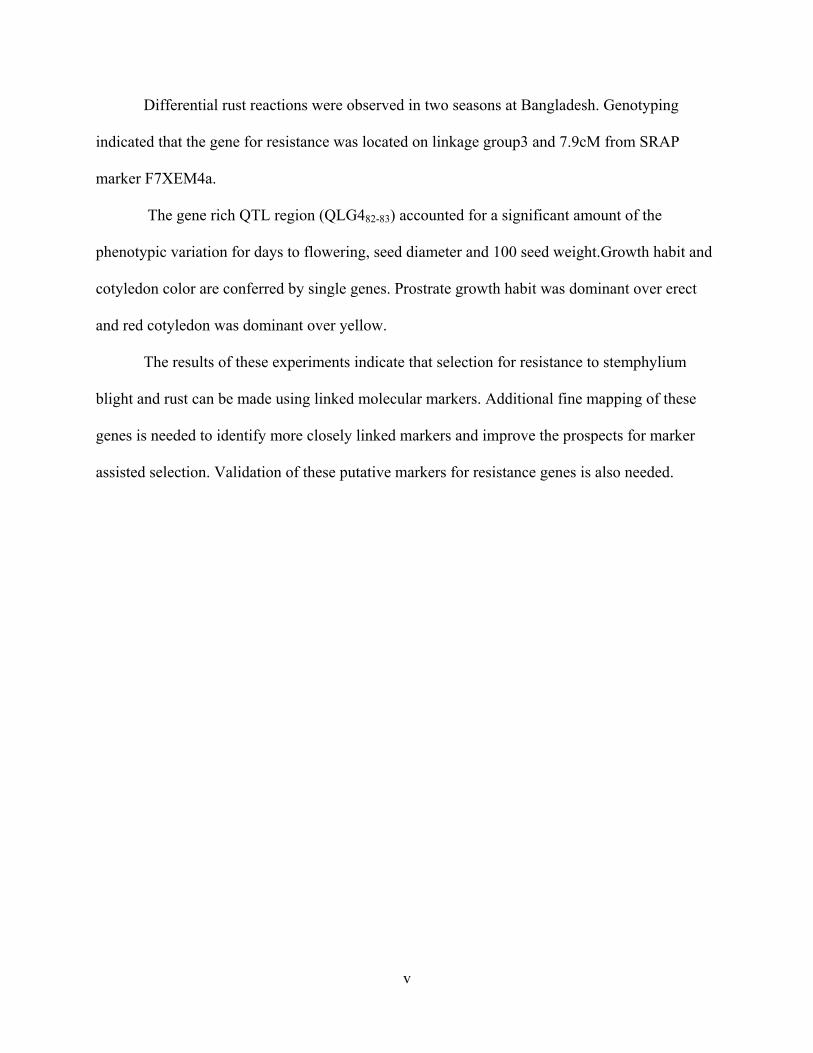
Differential rust reactions were observed in two seasons at Bangladesh. Genotyping
indicated that the gene for resistance was located on linkage group3 and 7.9cM from SRAP
marker F7XEM4a.
The gene rich QTL region (QLG482-83) accounted for a significant amount of the
phenotypic variation for days to flowering, seed diameter and 100 seed weight.Growth habit and
cotyledon color are conferred by single genes. Prostrate growth habit was dominant over erect
and red cotyledon was dominant over yellow.
The results of these experiments indicate that selection for resistance to stemphylium
blight and rust can be made using linked molecular markers. Additional fine mapping of these
genes is needed to identify more closely linked markers and improve the prospects for marker
assisted selection. Validation of these putative markers for resistance genes is also needed.
v
TABLE OF CONTENTS
ACKNOWLEDGEMENTS…………………………………………………….iii ABSTRACT……………………………………………………………………...iv LIST OF TABLES……………………………………………………………..viii LIST OF FIGURES……………………………………………………………...x 1. INTRODUCTION ……………………………………………………………1 2. REVIEW OF LITERATURE………………………………………………...4 3. REFERENCES……………………………………………………………… 24 CHAPTER ONE INHERITANCE AND LINKAGE MAP POSITIONS OF GENES CONFERRING
RESISTANCE TO STEMPHYLIUM BLIGHT IN LENTIL ABSTRACT…………………………………………………….. 37 INTRODUCTION……………………………………………... 38 MATERIALS AND METHODS……………………………… 40 RESULTS AND DISCUSSSION……………………………… 44 CONCLUSION………………………………………………… 49 ACKNOWLEDGEMENTS…………………………………… 50 REFERENCES………………………………………………… 50
CHAPTER TWO IDENTIFICATION OF MARKERS ASSOCIATED WITH GENES FOR RUST
RESISTANCE IN Lens culinaris Medik.
vi

ABSTRACT………………………………………………………62 INTRODUCTION……………………………………………… 63 MATERIALS AND METHODS……………………………..... 65 RESULTS AND DISCUSSSION………………………………. 66 CONCLUSION…………………………………………………. 69 ACKNOWLEDGEMENTS……………………………………. 69 REFERENCES…………………………………………………. 69
CHAPTER THREE
INHERITANCE AND LINKAGE MAP POSITIONS OF GENES CONFERRING
AGRO-MORPHOLOGICAL TRAITS IN Lens culinaris Medik.
ABSTRACT……………………………………………………....74 INTRODUCTION……………………………………………….75 MATERIALS AND METHODS……………………………......78 RESULTS AND DISCUSSSION……………………………......79 CONCLUSION………………………………………………….. 87 ACKNOWLEDGEMENTS…………………………………….. 88 REFERENCES………………………………………………….. 88
vii

LIST OF TABLES
1. Analysis of variance of stemphylium blight disease score of the lentil RILs
for the year 2006-2007, 2008-2009 and pooled for the crop years………………………………………………………………………..53
2. Markers used for the construction of linkage map of lentil………………..54
3. Distribution of markers on different linkage groups of lentil……………...54
4. QTLs with their additive effects and phenotypic variations……………….55
5. Epistatic effects, LOD value at the interaction point (LODA), epistatatic effect (LODAA) and phenotypic variance (PVE %) of different interacting QTL………………………………………………………………………...55
6. ANOVA of rust disease scores in RILs of lentil in 2006-2007 cropping year in Pulse Research Center, Ishurdi………………….....................................71
7. Six marker types showing different percentage of polymorphism between parents ILL-5888 and ILL-4605…………………………….......................71
8. Joint segregation of recombinant inbred lines from the ILL-4605 x ILL-5888 for reaction of rust and F7XEM4a SRAP marker……………………71
9. Statistical parameters of quantitative traits of RILs developed from the ILL-5888 x ILL-6002 cross grown at Pullman, WA……………………………91
10. Correlation between quantitative agro-morphological traits (days to flowering, plant height, seed diameter and 100- seed weight)…………………………91
viii

11. Chi square tests for goodness of fit to expected segregation ratios for cotyledon color (Yc/yc) and growth habit (Gh/gh) among RILs developed from the ILL-5888 x ILL-6002 cross grown at Pullman,WA.……………91
12. Summary of QTL analysis for days to flowering variation in RILs from the ILL-5888 x ILL-6022 cross………………………………........................92
13. Summary of QTL analysis for plant height variation in RILs from the ILL-5888 x ILL-6002 cross……………………………………………………92
14. Summary of significant QTLs, additive and epistatic effects for seed diameter in RIL population from the ILL-5888 x ILL-6002 cross…………………93
15. Summary of QTLs, additive and epistatic effects for 100 seed weight in RILs from the ILL-5888 x ILL- 6002 cross…………………………………….93
ix

LIST OF FIGURES
1. Frequency distribution (a1) 2006-2007 crop year, (b1) 2008-2009 crop
year and (c1) pooled data of the two crop years, and normality test (a2) 2006-2007 crop year, (b2) 2008-2009 crop year, (c2) ) pooled data of two crop years of stemphylium blight disease in lentil…………………….....56
2. Intraspecific linkage map of lentil at a LOD score of 4.0 and at maximum recombination fraction 0.25. The linkage groups are named (LG1-LG14). Loci names are indicated on the right side and genetic distances are on the left side of the vertical bar. SSR markers are named as SSR or GLLC-SSR, RAPDs are UBC and SRAP are F or ME as forward and R or EM as reverse primer……………………………………………………………57
3. Contour profile showing (a) additive effects: Add(LOD) and (b) interaction effect, epistatic effect: Epi(LODAA) for the 2006-2007 crop year………………………………………………………………………58
4. Contour profile showing (a) additive effects: Add(LOD), and (b) Interaction effect, epistatic effects: Epi(LODAA) and combined additive-epistatic effects: AddxEpi(LODA) for the 2008-2009 crop year………………….....59
6. QTL and associated markers that conferred resistance to stemphylium blight for the crop year 2006-2007………………...............................................60
7. QTL and associated markers confer resistance to stemphylium blight for the crop year 2008-2009……………………………………….......................60
8. Selective genotyping for identifying putative markers linked to rust resistance. Marker F7XEM4a, (indicated by the arrow at 600bp) is present in the resistant parent and also in the resistant RILs of the (ILL-5888 x ILL-6002)……………………………………………………………………..72
9. Location of rust resistance genes in lentil in linkage group3…….............72
x

10. The qualitative agro-morphological traits (a) The linkage group 8 (LG8) having cotyledon color gene (Yc) and (b) linkage group 9 (LG9) having Gh Gene………………………………….................................................94
11. Frequency distribution and normality test of RILs eveloped from the ILL-5888 x ILL-6002 cross for days to flowering (a1, b1), plant height (a2, b2)……………………………………………………..............................94
12. Contour profile showing significant QTLs for days to flowering (a1) additive effect: Add(LOD), (b1) interaction effect; epistatic effect: Epi(LODAA) and combined additive-epistatic effects:AddxEpi(LODA)……………………...95
Contour profile showing significant QTLs for plant height (a2) additive effect: Add(LOD), (b2) interaction effect; epistatic effect: Epi(LODAA) and combined additive-epistatic effects: AddxEpi(LODA)……………………..95
13. Frequency distribution and normality test of RILs developed from the ILL-5888 x ILL-6002 cross for days to seed diameter (a1, b1) and 100 seed weight (a2, b2)…………………………………………………………....96
14. Contour profile showing significant QTLs for seed diameter (a1) additive effect: Add(LOD), (b1) interaction effect; epistatic effect: Epi(LODAA) and combined additive-epistatic effects: AddxEpi(LODA)……………………..97 Contour profile showing significant QTLs for 100 seed weight (a2) additive effect: Add(LOD), (b2) interaction effect; epistatic effect: Epi(LODAA) and combined additive-epistatic effects: AddxEpi(LODA)……………………..97
xi

xii
To my parents, Who brought me to light and guided me towards light.

1. INTRODUCTION
Lentil (Lens culinaris Medikus subsp. culinaris) is a diploid (2n=2x=14 chromosomes)
self-pollinating annual species with a haploid genome size of an estimated 4063 Mbp
(Arumuganathan and Earle 1991). It is an important legume crop and an important source of
dietary protein in human diets and animal feed throughout West Asia and North Africa, the
Indian subcontinent, North America, South America and Australia (Webb and Hawtin 1981,
Erskine 1997). World production of lentil is estimated at 3.3 million metric tons from an
estimated 3.7 million hectares with an average yield of 887 kg/ha (FAOSTAT, 2009). It is an
important component of crop diversification in predominantly cereal based cropping systems in
South Asia and also an important legume rotational crop in the US Pacific Northwest. The lentil
crop can improve soil nutrient status through symbiotic nitrogen fixation, conserving soil
moisture and limiting soil erosion (Muehlbauer et al., 1992). Lentil stubbles that were left
standing overwinter and trap snow and reduce the rate of evaporation of soil moisture in spring
and prevents erosion (Anonymous, 2008). Moisture conservation is important to soil
conservation because the additional moisture improves crop growth in the following year.
Numerous factors limit yield and seed quality of lentil, including limited moisture availability,
salinity, weeds, insect pests and various diseases. Diseases are major factors that limit yields and
cause yield instability. Lentil rust caused by Uromyces vicia- fabae (Pers.) J. Schroet. and
stemphylium blight caused by Stemphylium botryosum Wallr. are the two most important
diseases of lentil in many lentil production regions worldwide.
Lentil rust is a wide spread disease in many parts of the world. The disease causes
substantial yield loses annually in Bangladesh, India, Ethiopia, Morocco and Pakistan. The
disease causes up to 70% yield loss, although occasional complete crop losses were observed
1

(Erskine and Ashutosh, 1997; Negussie et al., 2005). The incidence of disease varies
considerably from year to year depending upon environmental conditions. High humidity, cloudy
weather, and temperatures of 20-220 C favor disease development. The disease appears in areas
with dense crop canopies. The pathogen forms aecial cups on the stem late in the season. In
severe cases, the leaves are shed and plants dry prematurely.
Stemphylium blight of lentil is a serious threat to lentil cultivation in South Asia,
including Bangladesh, and in North America (ICARDA, 2004; Vandenberg and Morrall, 2002).
The pathogen has wide geographic distribution and infects plants in forty-three genera.
Symptoms of disease start as pinheaded light brown or colored spots on leaflets in plants in thick
populations. The spots enlarge rapidly and within 2-3 days they cover the entire leaflet resulting
in defoliation and death of young plants. In severe cases the crop may exhibit a blighted
appearance; however, the pods may remain green. To this day the disease is poorly understood
and no studies have been undertaken to elucidate the genetics of resistance (Kumar et al., 2004).
Agro-morphological traits have immense importance in breeding crops. Breeders select
breeding lines for specific purpose because of its market value and demand. Some of the traits
are easy to select due to its visual nature but its scientific understanding is important for its
manipulation. The timing of flowering is a very important determinant of crop duration. The
optimal flowering response differs between regions (Erskine et al., 1994b). Lentil is quantitative
long day plant and flowers in progressively longer days (Summerfield et al., 1984). It has been
reported that the flowering time is sensitive to photoperiod and temperature and the complete
understanding of genetic control of flowering time is limited (Sarker et al., 1999). Tall plant
height is a major breeding goal in the western hemispheres for the suitability of mechanical
harvest of lentil. Most lentils grown in the South Asia, Middle East and Africa are land races that
2
are typically short in plant stature, prostrate in growth habit, lack uniformity of pod maturation,
have a high incidence of pod shattering and are low yielding (Muehlbauer, 1981).Lower basal
pod position is a major hindrance to successful mechanical harvesting, so there is always need to
develop tall upright lentil cultivars with high basal pod positions. Uniformity of size, shape and
color is important for marketing of lentil. A wide range of lentil cultivars are used throughout the
world with the small diameter red cotyledon type accounting for most of the production followed
by the large and small yellow cotyledon type. Seed diameter and seed weight has direct
correlation with yield. So, understanding genetics of the agro-morphological characters has
immense importance in breeding for the yield and quality characters.
In recent years, application of DNA markers has improved the efficiency and
effectiveness of breeding for disease resistance and morphological traits in various crops (Baum
et al. 2000). The availability of molecular marker maps has facilitated gene tagging, marker-
assisted selection and the positional cloning of genes for disease resistance and other traits.
Comprehensive studies of the inheritance and molecular mapping of genes controlling resistance
to rust and stemphylium blight diseases of lentil are lacking. But sufficient sources of resistance
are available among material originating from West Asia and elsewhere. Therefore, genes that
confer resistance to rust and stemphylium blight of lentil need to be identified and used to
develop improved disease resistant cultivars.
My specific objectives are to:
i) determine the inheritance and linkage map positions of the genes for resistance to rust and
stemphylium blight in lentil,
ii) identify molecular markers for the resistance genes that can be used in marker assisted
selection,
3

iii) map the genes for agro-morphological traits to provide a better understanding of the genetics
of important traits.
2. REVIEW OF LITERATURE
2.1. Origin and distribution of lentil
Lentil (Lens culinaris Medik.) is a member of the Leguminosae family (Webb and
Hawtin, 1981) and is characterized as herbaceous annuals with slender stems and branches. The
Near East arc and Asia Minor are believed to be the center of origin of cultivated lentils and the
commonly accepted site of domestication which is estimated to have taken place over 8000 years
ago (Zohary, 1972, Williams et al., 1974). Although lentil originated the Mediterranean region, it
is well adapted and grown in temperate and semi-arid regions on all continents (Muehlbauer et
al., 2009). The crop is cultivated in West Asia and North Africa, the Indian subcontinent, North
America, South America and Australia (Webb and Hawtin 1981, Erskine, 1997).
2.2. Taxonomy and classification based on seed size
The Latin name of the species, Lens culinaris, was first published by Medikus in 1787
(Hanelt, 2001). Cultivated lentils belong to the genus Lens which is associated with other genera
of the tribe Vicieae (Kupricha, 1981). Davis and Plitmann (1970) describe Lens as intermediate
between Vicia and Lathyrus, but closer to Vicia. Lens is distinguished from Vicia by calyx
morphology and stylar characters, and the shape of the pods and seeds (Muehlbauer et al., 1980).
Lens orientalis is the presumed progenitor of cultivated L. culinaris and the two species are fully
crossable and produce fully fertile progenies. The genus Lens comprises seven taxa in five
species (L. culinaris, L. odemensis, L. nigricans, L. ervoides and L. lamottei). L. odemensis and
L. ervoides are crossable with L. culinaris and but there is a high percentage of sterility when L.
4

culinaris is crossed with L. odemensis. L. ervoides is crossable with L. culinaris but embryo
rescue is required to propagate the hybrid plants (Cohen et al., 1984; Ladizinsky et al., 1985;
Ferguson and Erskine, 2001; Ferguson et al., 2000). From the standpoint of crossability for use
in breeding, the Lens species can be divided into two gene pools whereby L. culinaris, L.
orientalis, and L. odemensis belong to primary gene pool while L. nigricans, L. ervoides and L.
lamottei comprise a secondary gene pool (Ladizinsky, 1999).
Lentil seeds are lens shaped and weight between 20 and 80mg with diameters that range
from 2 to 9 mm. Seed size differs according to genotype and researchers frequently follow the
classification of Barulina (1930) who grouped lentils as macrosperma with large seeds that range
from 6 to 9 mm diameter, and microsperma with smaller seeds that range from 2 to 6 mm in
diameter. The macrosperma types are common to the Mediterranean basin and in the western
hemisphere, while the microsperma predominate through the Indian subcontinent and in parts of
the Near East (Saxena and Hawtin, 1981).
2.3 Biotic and abiotic stresses of lentil:
Several biotic stresses such as fungal and viral diseases, parasitic pests and abiotic
stresses such as cold, drought, heat, salinity, nutrient deficiency and nutrient toxicity adversely
affect lentil yields worldwide (Monti et al., 1994; Saxena, 1993; Slinkard, 1994).
2.3.1. Biotic stresses of lentil:
Lentil is infected by a wide range of pathogens throughout its geographic distribution.
The most serious biotic constraints are foliar diseases such as ascochyta blight (caused by
Ascochyta fabae Speg. f. sp. lentis Gossen, Sheard, Beauchamp and Morrall ), rust (caused by
Uromyces vicia- fabae (Pers.) J. Schroet.), stemphylium blight (caused by Stemphylium
botryosum Wallr.), sclerotinia white mold (Sclerotinia sclerotiorum (Lib.) de Bary) and grey
5

mould (caused by Botrytis cinerea Pers.: Fr.). Rust is the key yield reducer of lentil in
Bangladesh, India, Nepal, Morocco, and Ethiopia while ascochyta blight is important in West
Asia, Canada and high rainfall areas of India. Stemphylium blight is a major problem in
Bangladesh and Nepal and has appeared in fields in North Dakota and Saskatchewan in recent
years (Kumar 2007, Holzgang and Pearse, 2001). Fusarium wilt (caused by Fusarium
oxysporum Schlecht: Fr. f. sp. lentis Vasudeva and Srinivasan) and collar rot (caused by
Sclerotium rolfsii Sacc.) are also important universally; the former is important in dry areas
where foliar diseases are of minor importance and the latter is more prominent under humid
conditions. Anthracnose caused by Colletotrichum truncatum (Schwein.) Andrus and Moore,
botrytis grey mould and sclerotinia white mold are major problems in North America (Chongo et
al., 2002). Recently, powdery mildew has also been reported on lentil in Canada and USA
(Attanayake et al., 2009; Banniza et al., 2004). Root rot caused by Aphanomyces euteiches C.
Drechsler, Phythium ultimum Trow, Rhioctonia solani Kühn are the other important fungal
pathogens of lentil. Bacterial diseases are unimportant on lentil although root rot caused by
bacteria has been reported in the former USSR (Javornokova, 1932). Some important viral
diseases, lentil yellows and pea seed borne mosaic virus, have been reported in North America,
Africa and South Asia (Boss et al., 1988). Pea enation mosaic virus was observed recently in the
exotic lentil lines in Bangladesh (Saha, 2009). The parasitic angiosperm weed, broomrape, is a
major threat to lentil production in parts of the Mediterranean region (Bayaa and Erskine 1994a).
2.3.2 Abiotic stresses of lentil:
Abiotic stresses that affect lentil production are cold, drought, heat, salinity, nutrient
deficiency and nutrient toxicity. Of these stresses, drought and heat are considered the most
important worldwide (Turner et al., 2001). Cold stresses are important in West Asia and North
6

Africa (WANA). Salinity is an important stress factor in Indian sub-continent and to some extent
in WANA. Nutrient deficiency and nutrient toxicity is of lesser importance worldwide but
important in localized regions (Buddenhagen and Richards, 1998).
2.4. Concept of disease resistance:
It has been reported that epidermal hairs, thickness of epidermis and cortical layer plays
an important role in disease resistance in lentil (Chowdhury et al., 1997). The genetic nature of
plant resistance to pathogens has been under study since the late 1800s and many genes
contributing to resistance have been identified and bred into crop plants. Disease resistance is
qualitatively or quantitatively inherited. Genes that confer qualitative resistance are thought to
function according to the gene –for –gene (GFG) model (Flor, 1947), where the resistance
phenotype is determined by the interaction between the product of resistant gene in the host and
an avirulence gene in the pathogen. The cloning and sequencing of several genes that confer
qualitative resistance has led to the belief that they govern the pathogen recognition and trigger
the pathway that ultimately causes resistance (Bent, 1996; Hammond –Kosack and Jones, 1997).
It has been shown theoretically that when host and pathogen interact through a strict GFG
mechanism, polymorphism at the resistance and avirulence loci is not maintained due to sexual
reproduction (Parker, 1994). However Parker’s model suggests that GFG genes are only part of a
larger set of genes making up the pathways leading to the resistance response (Robertson, 1989;
Warren et al., 1999). It has been observed that genes previously identified to confer qualitative
resistance have also been found to contribute to quantitative resistance (Li et al., 1999). Some
genes previously considered to be qualitative can vary their expression according to genetic
background (Dirlewanger et al., 1999). Thus there is support for the idea that resistance in plants
is determined by the combination of the products of many genes encompassing all sorts of
7

functions, including secondary compound production, phenology, physiology and other
structural features that might affect pathogen accessibility and growth in the host (Mutschler et
al., 1995; Lee et al., 1998).
2.5. Lentil Rust:
2.5.1. Taxonomy and morphology of pathogen:
“The causative pathogen of lentil rust is Uromyces vicia-fabae (Pers.) Schroet and is a
member of the Pucciniaceae and order Uredinales. It is an autoecious fungus that completes its
life cycle in lentil. Spermagonia are sub-epidermal and globoid. Aecia are sub-epidermal in
origin, erumpent later. Aeciospores are elliptical, yellowish brown, measuring 14-22 μm in
diameter and with a finely warty wall. Uredia are first sub-epidermal, then erumpent.
Urediospores are borne singly on pedicels, mostly echinuate, with three to four germination
pores and measure 22-28 μm X 19-22 μm. Telia are sub-epidermal with origin, then erumpent on
leaves but remain covered by the epidermis on stems for an extended period. Teliospores are
borne singly on pedicels, are globose to sub-globose, very rarely ellipsoid or ovoid, one celled,
measuring 25-40 μm X 18-26 μm, with a single germination pore; the wall is obviously
pigmented” (Bayaa and Erskine, 1998; Viennot-Bourgin, 1949).
2.5.2. Pathogenic race of rust:
Singh and Sokhi (1980) identified six pathotypes of rust on the basis of their differential
reactions on different cutivars of lentil, pea and sweet pea. Singh et al. (1995) have reported five
races, and Conner and Berrier (1982) detected 11 races of U. viciae-fabae. Conner and Berrier,
(1982) speculated that Vicia, Lathyrus and Pisum could be another important source of inoculum
and perhaps pathogenic variants due to race specific resistance and selection pressure on the
pathogen.
8

2.5.3. Lentil germplasm sources for rust resistance:
ICARDA developed 90 lentil lines resistant to rust, and some of them have combined
resistance against a range of biotic and abiotic stresses (Sarker et al., 2002). For breaking the
“bottleneck” of narrow genetic base of lentil in South Asia and combating two major diseases of
lentil, rust and stemphylium, ICARDA scientists are working with Bangladesh counterparts to
introgress desirable genes to improve Bangladeshi land races. These Bangladeshi land races
belong to the glex pilosae as described by Barulina (1930) as one of the microsperma types. This
approach will help to improve resistance to pulse diseases in Bangladesh (ICARDA, 2004).
Negussie et al., (2005) reported four cultivars ‘Gudo’, R-186, FLIP-87-66L and FLIP-89-60L
with different levels of rust resistance. Based on final rust severity, area under disease progress
curve (AUDPC), area under the pustule density curve (ADPC) and apparent infection rate (rG)
values, Gudo and R-186 were grouped as having a high level of resistance, FLIP-89-60L as
moderately susceptible and FLIP-87-66L as intermediate between susceptible and moderately
susceptible lines.
2.5.4. Genetics of lentil rust resistance:
Lentil rust is caused by an obligately biotrophic fungal pathogen that infects only a
narrow range of living plant hosts for growth and reproduction. For host colonization, the rust
pathogen requires the induction of a subset of fungal genes essential for infection. The infection
mechanisms are sophisticated, and include the ability to detect stomata, the entry portal for many
rust fungi, and to suppress host resistance responses. Genes of the plant host are also induced in
response to infection, but the role and expression of the host gene is difficult to dissect because
molecular tools such as protocol for transformation and sequenced genomes are lacking for the
rusts (Ayliffe, 2002).
9

Most studies on genetics of rust resistance in lentil have revealed that resistance is
monogenic and dominant (Sinha and Yadav, 1989; Singh and Singh, 1992). Kumar et al. (1997)
reported that resistance to Uromyces fabae in five lentil genotypes (L 2991, L 2981, L 1534, L
178 and HPLC 8868) was governed by single dominant genes; whereas in one genotype, Precoz,
it was conditioned by two dominant genes. Chahota et al. (2002) reported that resistance to rust
is controlled by duplicate, non-allelic and non linked dominant genes. Although a breakdown of
rust resistance in lentil has not been reported, the likelihood of such an event in varieties with
monogenic resistance cannot be ruled out (Negussiee et al., 2005). Expression of fis1 was
localized exclusively in leaf mesophyll cells closely surrounding the rust infection sites during
the first hour of infection and before the start of the hypersensitive response in the resistant host.
Gene expression was correlated within the amount of fungal growth. Fis 1 encodes pyrroline -5-
carboxylate dehydrogenase, an enzyme in the pathway that degrades proline to glutamate. This
mechanism not only protects from proline toxicity, but also provides other roles in glutamate and
glutamine in rust metabolism (Ayliffe, 2002).
Continuous cultivation of varieties with race specific resistance in large areas increases
selection pressure on the pathogen that may lead to the formation of new races capable of
infecting the previously resistant varieties. There are several strategies for developing varieties
with durable resistance. These include multilines (Marshall, 1977), partial resistance/ slow
rusting (Wilcoxson et al., 1975) and gene pyramiding (Green, 1975; Pederson and Leath, 1988).
2.5.5. Disease rating and assessment:
Khare et al. (1993) developed a 9-point disease severity scale. The scale was then
categorized according to Singh and Sandhu (1988) as: 1= resistant (no infection), 3= moderately
resistant (10% leaf area infected), 5= moderately susceptible (10.1-25% leaf area infected), 7=
10

susceptible (25.1-50% leaf area with stems also infected), 9= highly susceptible (>50% leaf area
with stem and pods heavily infected). Chen, 2007 modified Khare et al.(1993) scale of the
disease severity based on field conditions, where 1 = 0-10% leaf area infected, 3 = 11-30% leaf
area infected, 5 = 31-50% leaf area infected, 7 = 51-70% leaf area infected, 9 = More than 70%
leaf area infected.
2.6. Stemphylium blight:
2.6.1. Taxonomy and morphology of the pathogen:
The asexual stage of the causal organism of stemphylium blight is Stemphylium
botryosum Wallr.; whereas, Pleospora herbarum is the sexual stage. The fungus is commonly
referred as anmorph. Stemphylium blight is a ubiquitous, dematiaceous filamentous fungus that
belongs to the kingdom Fungi, phylum Ascomycota, class Ascomycetes, order Pleosporales,
family Pleosporacea (Inderbitzin et al., 2009). In medical science, the fungus is considered as
allergen (Larone, 2002).
Morphological and developmental characters such as size and shape of the conidia,
conidiophores, ascospores and the size and time of maturation of pseudothecia were useful for
diagnosing species (Camara et al., 2002). “Conidiophores are short, arise singly or in groups and
are aseptate and swollen at the apex. After a conidium is produced, the end of the conidiophore
grows out and produces a new cell and a new conidium. The conidiophore may grow to a
considerable length and have a nodulose appearance. Conidia are olive brown, muriform and
echinulate measuring 24-40 μm.X 14-25 μm. Conidia are oblong with three to four septae and
often constricted at the center by a medium cross walls. Perithecia are globose, membranous and
black, and sometimes have a slender neck. Asci (183-267 μm X 27-37μm) are oblong to clavate
with outer and inner walls. Ascospores (32-48 μm X 12-21 μm) are elongate to ovate,
11
characteristically with seven cross walls and three to five longitudinal septa, and yellowish to
brown in color and muriform when mature” (Bayaa and Erskine, 1998). Estimates of the
numbers of described Stemphylium species vary from around 20 to 30 (Caˆmara et al 2002, Kirk
et al 2001) to up to 150 (Wang and Zhang 2006). The phylogenetic relationships of 43 isolates
representing 16 species of Stemphylium were inferred from ITS and glyceraldehyde-3-phosphate
dehydrogenase (gpd) gene sequence data (Marcos et al., 2002).
2.6.2. Disease prevalence, development and environment requirements:
Stemphylium blight is a serious problem in some parts of the world especially in West
Asia and South Asia, North Africa and widely distributed in Saskatchewan, Canada where it was
considered to be a minor disease of lentil. With the increase of lentil production and deployment
of resistance to ascochyta blight and anthracnose in new cultivars, stemphylium blight has
become a more serious problem (Vandenberg and Morrall, 2002).
The disease has been reported in Bangladesh by Erskine and Sarker (1997) and it was
mentioned that it can cause 70% yield loss up to total crop failure in epidemic years.
Stemphylium botryosum is reportedly spread by air borne conidia. It overwinters on seed and as
mycelium on dead stems and leaves in many crops. Limited information is available on whether
the pathogen is seed-borne in lentil or not (Bayaa and Erskine, 1998). In alfalfa, it spreads by
airborne and water-borne conidia (conidia and ascospore) and by sowing infected seed (Malvick,
1998).
Environment plays a major role in stemphylium blight disease development and that is
why understanding the environmental role in disease development is important for effectively
controlling the disease. The diverse host range S. botryosum that includes leguminous and non
leguminous crops in different parts of the world indicates the adaptability of the pathogen to
12

different environmental conditions (Du Toit and Derie, 2001). Most of the research on infection
by Stemphylium spp. of different hosts has confirmed that temperature and moisture are the two
most important environmental factors. In South Asia, temperatures of 18°-20°C and relative
humidity of over 85% have been reported to favor the development of disease (Erskine and
Sarker, 1997). The pathogen requires at least 8 hr of wetness at low temperatures (10°C) for
successful infection and infection increases with increased leaf wetness for 24h (Mwakutuya
2006). Bashi and Rotem (1974) indicated that S. botryosum on tomato has the ability to infect
even in dry periods of 24 h, although it is associated with lower disease severity. The leaf
wetness requirements and response to interrupted leaf wetness are expected to vary from region
to region as the pathogen adapts to prevailing environmental conditions (Jhorar et al., 1998).
2.6.3. Media requirements for laboratory growth:
Stemphylium botryosum colonies grow rapidly on a variety of media and mature with in 5
days at 25°C on potato dextrose agar (Hashemi et al., 2005). On most media, it produces velvety
to cottony gray, brown or brownish-black or black colonies (Larone, 2002). The production of
conidia in abundance under laboratory conditions is difficult, even when it is grown on PDA and
or V8 juice agar under alternate cycle of 12h light and 12h darkness (Chowdhury et al., 1996;
Mehta,1998). The use of mycelial suspensions in disease screening has been found to be as
efficient as spore suspensions (Hashemi et al., 2005).
2.6.4. Resistant germplasm sources:
It has been reported that Barimasur-4 (developed from a local cultivar of Bangladesh,
Utfala) shows significant resistance against rust and stemphylium blight (Erskine and Sarker,
1997). Preliminary screening at the Crop Development Center (CDC) of University of
13
Saskatchewan showed that ‘Crimson’, ‘Eston’ and ILL 4605-2 and ILL-8008 have good
resistance against stemphylium blight.
2.6.5. Genetics of stemphylium blight resistance:
Genetics and inheritance of resistance to stemphylium blight of lentil have not been
completely elucidated. Based on the frequency distribution of a recombinant inbred line (RIL)
population developed from the cross Barimasur-4 X CDC Milestone, Kumar (2007) reported that
resistance was quantitatively inherited. Stemphylium botryosum resistance in lettuce is reportedly
(Netzer et al., 1985) controlled by two genes Sm1 and sm2, one of which is dominant and the
other recessive.
2.6.6. Disease ratings and assessments:
Horsfall-Barrat’s logarithmic scale had unequal intervals in disease scores and is difficult
to use for quantitatively inherited traits. To overcome this problem Hashemi, (2005b) modified
this scale to a 0-10 linear semi-quantitative scale. This scale considered disease development
pattern consisting of the appearance of chlorotic spots followed by gradual defoliation of plants
(0= free of disease, 1= a few tiny tan spots, 2= few small to large chlorotic spots, 3=expanding
lesions on leaves to defoliation started, 4=20% nodes on main stem showing necrotic symptoms
and defoliation, 5= 40% nodes on main stem showing necrotic symptoms and defoliation, 6=
60% nodes on main stem showing necrotic symptoms and defoliation, 7=80% nodes on main
stem showing necrotic symptoms and defoliation, 8=100% leaves defoliate but small green tip
recovering, 9=100% leaves defoliate but stem still green, 10= Completely dead). Kumar, (2007)
used this scale (0-10) for stemphylium blight screening. A disease rating scale from 1 to 5 was
used for scoring leaf spots in alfalfa caused by S. botryosum (Salter and Leath, 1991).
14
Koike et al. (2001) used a sign scale (-= no disease; +=small leaf spot<5mm; ++=medium leaf
spot) for scoring spinach leaf spot disease caused by S. botryosum.
2.7. Genetics of some important diseases of lentil:
2.7.1. Ascochyta blight
Ascochyta blight, caused by Ascochyta fabae Speg. f. sp. lentis Gossen, Sheard,
Beauchamp and Morrall, is one of the most globally important diseases of lentil. It causes leaf,
stem and pod lesions resulting in reductions in seed yield and seed quality (Morrall and Sheppard
1981). Despite extensive agronomic and chemical control studies, no efficient method has been
found to control ascochyta blight in lentil. Breeding for resistance is the most effective and
efficient method to control this disease (Erskine et al., 1994a, Ye et al., 2000a). Genetic studies
of resistance to A. lentis demonstrated that either a dominant or a recessive gene controls
resistance (Ahmad et al., 1997, Andrahennandi, 1994, 1997; Ford et al., 1999; Nguyen et al.,
2001; Tay and Slinkard, 1989; Ye et al., 2000). Andrahennandi (1994) reported that a recessive
gene ral2 conditioned resistance to A. lentis in ‘Indian head’. Chowdhury et al. (2001) confirmed
this finding and identified two random amplified polymorphic DNA (RAPD) markers linked to
the ral2 gene. These two RAPD markers, UBC 227 1290 and OPD 10 870, flanked and were linked
in repulsion phase to the gene ral2 at 12 cm and 16cm, respectively. Tay and Slinkard (1989)
and Ford et al. (1999) reported major dominant gene AbR 1 that control the resistance to
ascochyta blight in line ILL5588. Closely linked RAPD markers (RB 18 and RV 01) were
identified as markers for the AbR1 gene (Ford et al., 1999).
2.7.2. Fusarium wilt
Fusarium wilt is a major constraint to lentil production in West Asia and North Africa
and is caused by the soil borne fungus, Fusarium oxysporum Schlecht: Fr. f. sp. lentis Vasudeva
15

and Srinivasan. Komboj et al. (1990). Abbas (1995) reported that inheritance of resistance to
vascular wilt is controlled by the monogenic dominant gene, Fw.
2.7.3. Anthracnose
Anthranose caused by Colletotrichum truncatum (Schwein.) Andrus and Moore is one of
the major diseases of lentil on the Canadian prairies. The disease first discovered in Manitoba in
1987 (Morrall 1988), Saskatchewan in 1990 (Morrall and Pedersen 1991) and North Dakota in
1992 (Venette et al., 1994). The disease is wide spread in Western Canada and lentil growing
region of northern plains of the U.S. The disease induces greenish water soaked lesions on the
lower stems. In the early flowering stage, necrotic lesions develop on leaves and as a result
leaves shed. Limited information is available regarding genetics of resistance to anthracnose in
lentil. Chongo and Bernier (1999) reported partial resistance to anthracnose in PI 320937, PI
345629, breeding line 458-57 and cultivar Indianhead of lentil. Buchwaldt (2001) reported two
dominant genes and one recessive gene for resistance to anthracnose based on the segregating F3
population in three crosses where PI 320937 was used as one of the resistant parents. Tullu et al.
(2003) reported that a major dominant gene, LCt-2 was responsible for resistance to race Ct1 and
the minor genes influence variations in resistance level. Tullu et al. (2003) also reported that PI
320937 and Indianhead are resistant to race Ct1 but no available cultivars with resistance to race
Ct0 were found. To incorporate higher levels of resistance to both races, Fiala et al. (2009) made
a cross between susceptible ‘Eston’ and a resistant accession of L. ervoides germplasm, L-01-
827A (resistant for Ct0 and Ct1 races) and stated that two recessive genes might be responsible
for resistance to anthracnose but conclusive results could not be achieved due to loss of lines in
the population due to sterility.
16
2.8. Agro-morphological traits:
2.8.1. Days to flowering, growth habit and plant height:
“Four developmental phases of flowering were identified: pre-emergence, pre-inductive,
inductive and post-inductive. When lentil plants were transferred from short days (either 8 or 10
h) to long days (16 h), or vice versa, the first two phases and the last phase are insensitive to
photoperiod, but are probably sensitive to temperature. The duration of the inductive phase can
be predicted by assuming that its reciprocal is a linear function of both photoperiod and
temperature. Critical photoperiod decreases with increase in temperature and that the duration of
the inductive phase can be calculated from a summation of the amounts by which successive day
lengths exceed the critical photoperiod until a value (‘the photoperiodic sum’) characteristic of
the genotype is reached” (Roberts et al. 1986)
Growth habit has received a great deal of attention from breeders attempting to develop
cultivars with more upright stature that are also lodging resistant and adaptable to mechanized
harvest. In F2s from the crosses of L. culinaris with L. orientalis, Ladizinsky (1979) found erect,
intermediate, and prostrate types in a ratio that indicated a single gene with incomplete
dominance. The gene symbol of prostrate canopy type is Gh Gh and the erect type is gh gh.
Plant height usually ranges from 25 to 30 cm for a majority of genotypes, but may vary from
extremes of 15 to 75 cm depending on genotype and environmental conditions (Saxena and
Hawtin, 1981). Most lentils grown in the South Asia, Middle East and Africa are land races that
generally have short plant stature, prostrate in growth habit, lack uniformity of pod maturation,
have a high incidence of pod shattering, and are low yielding. Lower basal pod position is a
major hindrance to successful mechanical harvesting, so there is a need to develop tall upright
lentil cultivars with high basal pod positions (Muehlbauer, 1981). Sakar (1983) reported three
17

genes were responsible for variation in plant height in the cross of two lentil cultivars, Laird and
Precoz.
2.8.2. Cotyledon color, seed diameter, seed weight:
Cotyledon color in lentil can be red/orange, yellow or green. No truly green cotyledon
lentils are being marketed at the present time although genetic stocks with green cotyledons are
available. “Lentils with yellow cotyledons and testa without mottling or other forms of coloration
are called “green lentils”, a term that is a common market jargon in developed countries. This
expression is not used in major lentil producing and consuming region of South Asia. Large
green lentils are marketed to countries of southern Europe, particularly Spain, Italy and Greece
and small red type is exported to South Asia and the Middle East” (Muehlbauer et al., 2009).
Knowledge of the genetics of cotyledon color has progressed significantly with the identification
of the genes involved and linked molecular markers. The first report of genetics of lentil were
the studies of cotyledon color by Tschermak (1928) and by Wilson et al., (1970) and showed that
red/orange cotyledon color was dominant to yellow cotyledons and controlled by a single gene.
Singh (1978) and Slinkard (1978) reported that red cotyledon color is completely dominant over
green and yellow. Sharma and Emami (2002) detected monogenic and digenic control of
cotyledon coloration in lentil. In their study they discovered that crosses between orange and
green cotyledon parents showed monogenic segregation with complete dominance of orange
over green cotyledons but digenic segregation was observed between light green and dark green
cotyledons. Double recessive homozygous condition (yy bb) is responsible for light green
coloration and the presence of Dg gene causes dark green coloration irrespective of homozygous
dominant or recessive Y or B genes. It has been reported that seed wt. of lentil is controlled by
two genes (Sakar, 1983).
18

2.8.3. Seed coat, flower and epicotyl color:
Monogenic inheritance of seed coat coloration was reported by Kumar et al. (2005).
Mottled testa is dominant over non-mottled testa and brown testa over tan. Background color of
lentil seed coats is reportedly controlled by two genes (Vandenberg and Slinkard, 1990).
Dominant Ggc determines grey ground color while the dominant Tgc gene produces tan ground
color. When both dominant genes are present (Ggc Tgc), brown seed coat color is produced. The
double recessive (ggc tgc) has green seed coat color.
Kumar et al. (2005) reported flower color is controlled by a single gene and purple is
dominant over white. Lal and Srivastova (1975) reported that two genes, each with complete
dominance, control the flower color of lentil, but Wilson and Hudson (1978) found additive gene
action in the inheritance of flower color. Ladizinsky (1979) reported the involvement of three or
more genes for the expression of flower color and also mentioned that seed coat color is
controlled by several genes with pleotropic effects for epicotyl and flower color.
Epicotyl color was shown by Lanizinsky (1979) to be simply inherited with purple
dominant to green epicotyl.
2.8.4. Flowering pattern, leaf tendril and pod characters:
Gill and Malhotra (1980) reported that the flowering pattern is controlled by single
dominant gene and obtained two flowered racemes and three flowered racemes in a 3:1 ratio in
an F2 population.
Leaves without tendrils are reportedly controlled by a single recessive gene (Vandenberg
and Slinkard, 1989).
Genes that are expressed in the pods are Glp and Grp (Vandenberg and Slinkard, 1989).
The dominant allele of Glp produces pod pubescence, while the homozygous recessive allele
19

(glp) produces glabrous pods. The dominant Grp gene produces red pods, while the homozygous
recessive grp allele produces green pods. Ladizinsky (1979) found that pod indehiscence was
controlled by a single recessive gene (pi).
2.9. Genetic Mapping:
Genetic maps have been developed in almost all the agricultural crops (O’Brien 1993).
The first genetic maps of lentil consisted of a small number of markers, mainly isozymes,
restriction fragment length polymorphisms (RFLPs) and some morphological markers that
covered a relatively small portion of the genome (Havey and Muehlbauer 1989; Weeden et al.,
1992; Tahir et al., 1993). In order to maximize the polymorphism for map construction,
interspecific mapping populations have been used in Lens (Havey and Muehlbauer 1989;
Muehlbauer et al., 1989; Weeden et al., 1992; Tahir et al., 1993; Valliancourt and Slinkard 1993;
Tahir and Muehlbauer 1994; Eujayl et al., 1998). However, Causse et al. (1994) and Lefebvre et
al. (1995) expressed their opinion that maps based on interspecific populations may not represent
the true recombination distances of the cultivated species. Genetic maps based on intraspecific
crosses have been recommended for mapping of QTL due to minimal segregation distortion
(Havey and Muehlbauer 1989).
The first Lens map incorporating RFLPs was developed by Havey and Muehlbauer
(1989) and was sparsely covered with markers spanning 330 cM of the genome with average
marker distances of 12.8± 3.2 cM. Weeden et al. (1992) constructed an expanded linkage map
having ten linkage groups covering 560 cM of the genome with average marker distance of 8.75
cM. Tahir et al. (1993) reviewed morphological and molecular markers to develop a preliminary
linkage map of lentil that included 7 morphological, 25 isozyme, 38 RFLPs and 6 other loci, in
seven tentative linkage groups. The first map of Lens involving RAPD markers were developed
20

by Eujayl et al. (1997) and spanned 206 cM and an extensive linkage map was constructed by
Eujayl et al. (1998) based on 86 recombinant inbred lines (RILs) and consisted primarily of 89
RAPDs and 79 AFLPs (Amplified Fragment Length Polymorphisms) with six co-dominant
markers, most of the latter being RFLPs. The map covered 1073 cM of the lentil genome with an
average distance of 6 cM between adjacent markers. They observed 15 linkage groups, eight of
which were small segments. The first intraspecific linkage map developed by Rubeena et al.
(2003) was based on an F2 population and was comprised of 100 RAPDs, 11 ISSRs (Inter Simple
Sequence Repeats) and 3 RGA (Resistance Gene Analogs) markers, and revealed nine linkage
groups varying in length from 34.9 cM to 134.8 cM. The map spanned a total length of 784.1 cM
with an average distance of 6.9 cM between adjacent markers. The Lens sp. map developed by
Duran et al. (2004) containing 62 RAPDs, 29 ISSRs, 65 AFLPs and 4 morphological and 1
microsatellite marker. The map consisted of ten linkage groups covering 2171.4 cM with an
average distance between markers of 15.9 cM. Most recently, a total of 41 microsatellite and 45
AFLP markers were mapped on 86 recombinant inbred lines of lentil (Hamwieh et al. 2005).
2.10. QTL analysis:
Quantitative traits have been a major area of genetic study for over a century (Fisher,
1918; Wright, 1934; Mather, 1949; Falconer, 1960). Early studies of quantitative traits were
focused on inferring numbers of genes from the mean, variance, and covariance of progenies,
with no knowledge of location of the genes that underlie these traits (Kearsey and Farquhar
1998). PCR-based molecular markers and powerful statistical techniques have allowed the
development of methods to investigate the genetic architecture of traits. Based on statistical
associations between markers and phenotypes, it is possible to identify many QTL that contribute
to the expression of a given trait, their relative magnitude and their location in the genome.
21
Estimates of the effects of individual QTL and the interaction between them are possible along
with their placement on a linkage map. QTL analysis does not imply only polygenic traits, but
can also be used to reveal the location of genes for qualitative traits. QTL analysis requires traits
under investigation to have a continuous distribution. Continuous variation observed in any trait
can be due to environmental or genetic effects.
The simple or multiple regressions could be used for association between phenotype and
genotype based on genetic model. So, QTL mapping is modeled as
y = μ +ΣG i ai+ e i
Where, y is the phenotype, μ the overall mean of the phenotype, Gi the genotype of gene i, ai the
effect of gene i, and e residual error following a normal distribution
e ~ N(0, σ2).
A number of statistical methods have been developed for QTL detection and affect
estimation. From a statistical perspective, methods for QTL mapping are based on three broad
classes: regression, maximum likelihood, and Bayesian models (Li, 2007). The simplest single
marker analysis identifies QTL based on the difference between the mean phenotypic values of
different marker groups but can’t separate the estimates of recombination fractions and QTL
effect. Simple interval mapping (SIM) based on the maximum likelihood parameter and provides
a likelihood ratio test for QTL position (Lander and Botstein, 1989). “Regression interval
mapping was proposed to approximate maximum likelihood interval; mapping to save
computational time at one or multiple genomic positions. The major disadvantage of SIM is that
the estimates of location and effects of QTL may be biased when QTL are linked. Composite
interval mapping (CIM) combines SIM with multiple marker regression analysis, which controls
22

effects of QTL on other intervals or chromosomes on to the QTL that is being tested, and thus
increase the precision of QTL detection” (Li et al., 2007, Zeng 1993, 1994; Jansen 1993). CIM is
one of the most commonly used methods for mapping quantitative trait loci (QTL) with
populations derived from biparental crosses. QTL effects at the current testing position and
regression coefficients of the marker variables used to control genetic background were
estimated simultaneously in an expectation and conditional maximum likelihood algorithm.
Thus, the same marker variable may have different coefficient estimates as the testing position
moves along the chromosomes. “The algorithm used can not completely ensure that the effect of
QTL at current testing interval is not absorbed by the background marker variables, and may
result in biased estimation of the QTL effect. In addition, different background marker selection
methods may give very different mapping results and the nature of the preferred method is not
clear” (Li et al., 2007).
CIM cannot be extended for mapping epistasis (Zeng et al., 1999). It has been recognized
that non-allelic interaction plays an important role in genetic control of quantitative traits. The
interacting genes that influence the phenotype of quantitative traits follow a complex
phenomenon. Statistical methodology for epistasis mapping is still developing. The interval
mapping and regression interval mapping may be extended for mapping epistasis, but the
mapping power is low due to not well controlled background genetic variation. “Multiple
interval mapping (MIM) fits multiple putative QTL effects and associated epistatic effects
simultaneously in one model. However, it requires determining the number of models (main
effect and epistasis). As this is usually unknown, various models of different complexities have
to be tested. Different MIM model selection method implemented in popular software of QTL
cartographer give different, sometimes controversial results. Bayesian models in QTL mapping
23

have been widely studied in recent years. It estimates the locations and effect of parameters for a
pre-specified number of QTL, which is unknown before mapping. To solve this problem,
Bayesian method uses reversible jump Markov Chain Monte Carlo (MCMC) algorithm. It is
widely accepted due to difficulty and arbitrary in choosing intensive computing requirements and
lack of user friendly software”.
Li et al. (2007 and 2008) proposed a model to resolve all the problems in QTL mapping.
The model is called inclusive composite interval Mapping (ICIM). Marker variables were
considered in linear model in ICIM for additive mapping, and both marker variables and marker
pair multiplications were simultaneously considered for epistasis mapping. “Two steps were
included in ICIM. In the first step, stepwise regression was applied to identify the most
significant regression variables but with different probability label for entering and removing
variables. In second step, a one dimensional scanning or interval mapping was conducted for
mapping additive and a two dimensional scanning was conducted for mapping digenic epistasis.
ICIM provides intuitive statistics for testing additive and epistasis, and can be successfully used
on experimental population derived from inbred lines. ICIM increase the detection power and
reduces false detection and less biased estimate of QTL” (Li et al., 2008).
REFERENCES
Ahmad, M., A.C. Russell and D.L. McNeil. 1997. Identification and genetic characterization of different resistance sources to Aschochyta blight within the genus Lens. Euphytica 97: 311 -315.
Andrahennadi, C.P. 1997. RAPD markers for Aschochyta blight resistance, phylogenetic studies
and cultivar identification in lentil. Ph.D. Thesis, Univ. of Saskatchewan, Saskatoon, Canada.
Andrahennadi, C.P. 1994. Genetics and linkage of isozyme markers and resistance to seed borne
Aschochyta infection in lentil. M.Sc. Thesis, Univ. of Saskatchewan, Saskatoon, Canada.
24

Anonymous, 2008. Agriculture knowledge centre. Saskatchewan agriculture.
http://www.agriculture.gov.sk.ca/Default.aspx?DN=1a2fc0cd-ddb4-47b6-8d29-91dff9dde90a
Arumuganathan, K., and E.D. Earle. 1991. Nuclear DNA content of some important plant
species. Plant Mol Biol 9: 208-218.
Attanayake, R.N., D.A. Glawe, F.M. Dugan, and W. Chen. 2009. Erysiphe trifolii causing powdery mildew of lentil (Lens culinaris). Plant Dis 93: 797-803.
Ayliffe, M.A., J.K. Roberts, H.J. Mitchell, R. Zhang, G.J. Lawrence, J.G. Ellis, and J.P. Tony.
2002. A plant gene up-regulated at rust infection sites. Plan Physiol 129: 1–12.
Banniza, S., J.A. Parmelee, R.A.A. Morrall, A. Tullu, and C.J. Beauchamp. 2004. First record of powdery mildew on lentil in Canada. Can Plant Dis Surv 84: 102-103.
Barulina, H. 1930. Lentils of the USSR and other counties. Bull Appl Bot Gen Plant Breed 40:
225-238.
Bashi, E., and J. Rotem. 1974. Adaptation of four pathogens to semi-arid habitats as conditioned by penetration rate and germinating spore survival. Phytopathology 64: 1035-1039.
Baum, M., N.F. Weeden, F.J. Muehlbauer, G. Kahl, S.M. Udupa, I. Eujayl, F. Weigand, M.
Harrabi and Z. Bouznad. 2000. Marker technology for plant breeding. In: Knight R (ed) Linkage research and marketing opportunities for pulses in the 21st century. Kluwer, Dordrecht, 421-427.
Bayaa, B., and W. Erskine. 1994: Response of wild lentil to Ascochyta fabae f. sp. lentis from
Syria. Genet Crop Evol 41: 61-65.
Bayaa, B., and W. Erskine. 1998. Lentil Pathology. Pathology of Food and Pasture Legumes (eds D. Allen and J. Lenné), Commonwealth Agricultural Bureaux International, U.K in association with: International Crop Research Center for the Semi-Arid Tropics, Patancheru 502 324. Andhra Pradesh, India. p. 423-472.
Bent, A. 1996. Function meets structure in the study of plant disease resistance genes. Plant Cell
8: 1757-1771.
Boss, L., R.O. Hampton and K.M. Makkouk. 1988. Virus and virus diseases of pea, lentil, faba bean, and chickpea.: In World Crops: Cool Season Food Legumes. (Ed.): R.J. Summerfield, Kluwar Academic Publishers. p. 591-615.
Buddenhagen, I.W., and R.A. Richards. 1988. Breeding cool season food legumes for improved
performance in stress environments. In: World Crops: Cool Season Food Legumes, (Summerfield, R.J., Ed.) Dordrecht, Kluwer Academic. p. 81–95.
25

Buchwaldt, L., A. Vandenberg, A. Tullu, and C.C. Bernier. 2001. Genetics of resistance to
anthracnose (Colletotrichum truncatum) in lentil. 4th European Conference on Grain Legumes. Cracow, Poland. p. 242.
Caˆmara, M.P.S., N.R. O’Neill, P. van Berkum. 2002. Phylogeny of Stemphylium spp. based on ITS and glyceraldehyde-3-phosphate dehydrogenase gene sequences. Mycologia 94: 660–672.
Causse, M.A., T.M. Fulton, Y.G. Cho, S.N. Ahn, J. Chunwongse, K.W,J. Xiao, Z. Yu, P.C.
Ronald, S.E. Harrington, G. Second, S.R. McCouch, and S.D. Tanksley. 1994. Saturated molecular map of the rice genome based on interspecific backcross population. Genetics 138: 1251-1274.
Chahota, P.K., V.P. Gupta and S.K. Sharma. 2002. Inheritance of rust resistance in lentil. Indian
J Genet Plant Breed 62: 226-227.
Chongo, G., S. Banniza, and T.Warkentin. 2002. Occurrence of Ascochyta blight and other diseases in Saskatchewan in the 2001 drought year. Can Plant Dis Surv. 83:85–89.
Chongo, G., and C.C. Bernier. 1999. Field and growth chamber evaluation of components of
partial resistance to Colletotrichum truncatum in lentil. Can J Plant Pathol 21: 58-63.
Chowdhury, M.A., C.P. Andrahennadi, A.E. Slinkard, and A. Vandenberg. 2001. RAPD and SCAR markers for resistance to Ascochyta blight in lentil. Euphytica 118: 331-337.
Chowdhury, A.M., A. Ahmed and M. Zaman. 1997. Studies on the defence structural factors of
some susceptible and resistant varieties of lentil plants. Journal of Mycopath Res 35: 35-39.
Chowdhury, A. M., A. Ahmed, M. Zaman and M.A. Bakr. 1996. Sporulation of Stemphylium
botryosum Wallr. Journal of Mycopath Res 34: 69-71.
Cohen, D., G. Ladizinsky, M. Ziv, and F.J. Muehlbauer. 1984: Rescue of interspecific Lens hybrids by means of embryo culture. Plant Cell Tiss.Org. Cult. 3: 343-347.
Conner, R.L., and C.C. Bernier. 1982. Race identification of in Uromyces vicia-fabae.
Phytopathology 72: 687-689.
Davis, P.E., and U. Plitmann. 1970. Lens MILLER, In: (Ed Davis P.E.) Flora of Turkey. Edinburgh Univ. Press, Edinburgh. 3: 325-328.
Dirlewanger, E., A. Moing, C. Rothan, L. Svanella, V. Pronier, A. Guye, C. Plomion, and R.
Monet. 1999. Mapping QTLs controlling fruit quality in peach [Prunus persica (L.) Batsch]. Theor Appl Genet 98: 18–31.
26

Duran, Y., R. Fratini, P. Garcia, and M.V Perez de la, 2004. An intersubspecific genetic map of Lens. Theor Appl Genet 108: 1265-1237.
du Toit, L.J., and M.L. Derie. 2001. Stemphylium botryosum pathogenic on spinach seed crops in
Washington. Plant Dis 85: 920.
Erskine, W., and A. Sarker. 1997. Lentil: the Bangladesh breakthrough. ICARDA, Carvan No. 6.
Erskine, W. 1997. Lessons for breeders from land races of lentil. Euphytica 93: 107-112.
Erskine, W., M. Tufail, A. Russell, M.C. Tyagi, M.M. Rahman and M.C. Saxena. 1994a. Current and future strategies in breeding in lentil for resistance to biotic and abiotic stresses. Euphytica 73: 127-135.
Erskine, W., A. Hussain, M. Tahir, A. Bahksh, R.H. Ellis, R.J. Summerfield, and E.H. Roberts.
1994b. Field evaluation of a model phototermal responses in a world lentil collection. Theor Appl Genet 88: 423–428.
Eujayl, I., M. Baum, W. Powell, W. Erskine and E. Pehu. 1998. A genetic linkage map of lentil
(Lens sp.) based on RAPD and AFLP markers using recombinant inbred lines. Theor Appl Genet 97: 83-89.
Eujayl, I., M. Baum, W. Erskine, E. Pehu and F.J. Muehlbauer. 1997. Use of RAPD markers for
genetic mapping and evaluation of segregation distortion in lentil (Lens culinaris Medik.). Euphytica 96: 405-412.
Falconer, D.S. 1960. Introduction to Quantitative Genetics, 1st edn. Oliver and Boyd: Edinburgh. FAOSTAT, 2009.http://faostat.fao.org/
Ferguson, M., and Erskine, W. 2001. Lentils (Lens L). In: Maxted N and Bennett SJ (eds) Plant
Genetic Resources of Legumes in the Mediterranean. Dordrecht: Kluwer Academic Publishers, 125–131.
Ferguson, M.E., M. Maxted, M. van Slageren, and L.D. Robertson. 2000. A re-assessment of the
taxonomy of Lens Mill. (Leguminosae, Papilionoideae, Vicieae). Bot J Linn Soc 133: 41–59.
Fiala, J.V., A. Tullu, S. Banniza, G. Séguin-Swartz, and A. Vandenberg. 2009. Interspecies
Transfer of Resistance to Anthracnose in Lentil (Lens culinaris Medic.). Crop Sci 49: 825-830.
Fisher, R.A. 1918. The correlation between relatives on the supposition of Mendelian
inheritance. Trans R SOC Edinb 52: 399-433.
Flor, H.H. 1947. Inheritance of reaction to rust in flax. J Agric Res 74: 241-262.
27

Ford, R., E.C.K. Pang, and P.W.J. Taylor, 1999. Genetics of resistance to ascochyta blight
(Ascochyta lentis) of lentil and the identification of closely linked RAPD markers. Theor Appl Genet 98:93-98.
Gill, A.S., and R.S. Malhotra. 1980. Inheritance of flower color and flower number per
inflorescence in lentils. Lens l 7: 15-19.
Green, G.J. 1975. Virulence changes in Puccinia graminis f. sp. Tritici in Canada. Can J Bot 53: 1377-1386.
Hammond-Kosack, K.E., and D.G.J. Jonathan. 1997. Plant disease resistance genes. Plant Mol
Biol 48: 575–607.
Hamwieh, A., S.M. Udupa, W. Choumane, A. Sarker, F. Dreyer, C. Jung, and M.Baum. 2005. A genetic linkage map of Lens sp. based on microsatellite and AFLP markers and the location of fusarium vascular wilt resistance. Theor Appl Genet 110: 669-677.
Hanelt, P.2001. Lens Mill. In: Hanelt P (ed). Mansfeld’s Encyclopedia of Agricultural and
Horticultural Crops. Vol. 2: 849–852. Lens culinaris Medicus Vorl. Churpf. Phys.-Ökon. Ges. 2: 361 (1787).
Hashemi, P., A. Vandenberg, and S. Banniza. 2005. Developing a protocol for large scale
inoculation of lentil germplasms with Stemphylium botryosum. Abstract: In Proceedings of Plant Canada 2005. Edmonton, AB, June 15-18.
Havey, M.H., and F.J. Muehlbauer. 1989. Linkages between restriction fragment length, isozyme
and morphological markers in lentil. Theor Appl Genet 77: 839-843.
Holzgang, G., and P Pearse. 2001. Diseases diagnosed on crop samples submitted to the Saskatchewan Agriculture and Food Crop Protection Laboratory in 2000. Can Plant Dis Surv 81: 21-27.
ICARDA, 2004. Celebration as Bangladesh produces more lentil. Caravan 20/21: 11-12.
Inderbitzin, P., J.Y.R. Mehta, and M.L. Berbee. 2009. Pleospora species with Stemphylium anamorphs: a four locus phylogeny resolves new lineages yet does not distinguish among species in the Pleospora herbarum clade. Mycologia. 101(3): 329–339.
Jansen, R.C. 1993. Maximum likelihood in a generalized linear finite mixture model by using the
EM algorithm. Biometrics 49: 227–231.
Javornokova, I.P.1932. Bacterial root rot of red clover, lucern and lentils caused by Bacterium radiciperda n.sp. Bulletin of Plant Potection (Leningrad) 5: 161-172.
28

Jhorar, O.P., D.R. Butler, and S.S Mathauda. 1998. Effects of leaf wetness duration, relative humidity, light and dark on infection and sporulation by Didymella rabiei on chickpea. Plant Pathol. 47: 586-594.
Kearsey, M.J., and A.G.L. Farquhar. 1998. QTL analysis in plants: where are we now? Heredity
80: 137-142.
Khare, M.N., B. Bayaa and S.P.S. Beniwal. 1993. Selection methods for disease resistance in lentil. In: K.B. Singh and M.C. Saxena (Eds.), Breeding for Stress Tolerance in Cool-Season Food Legumes.Wiley, Chichester, U.K. p.107-121.
Kirk, P.M., P.F. Cannon, J.C. David, and J.A. Stalpers. 2001. Ainsworth and Bisby’s Dictionary
of the Fungi. Wallingford, Oxon,UK: CABI Publishing. P. 655.
Koike, S.T., D.M. Henederson and E.E. Butler. 2001. Leaf spot disease of spinach in California caused by Stemphylium botryosum. Plant Dis. 85:126-130.
Kumar, P. 2007. Genetics of resistance to stemphylium leaf blight of lentil (Lens culinaris) in the
cross Barimasur-4 × CDC Milestone. M.S. Thesis, University of Saskatchewan, Canada.
Kumar Y., S.K. Mishra, M.C. Tyagi, S.P. Singh, B. Sharma. 2005. Linkage between genes for leaf colour, plant pubescence, number of leaflets and plant height in lentil (Lens culinaris Medik.). Euphytica 145: 41-48.
Kumar, P., S. Banniza, and A.Vandenberg. 2004. Stemphylium blight of lentil: finding sources
of resistance. In Proceedings of the 5th Canadian Pulse Research Workshop. London, ON. 28-30 November, 2004.
Kumar, V., B.M. Singh and S. Singh. 1997. Genetics of lentil resistance to rust. Lens 24(1/2):
23-25.
Kew, Richmond, UK. Advances in legume systematics, part 1: 377–381.
Ladizinsky, G., D. Cohen, and F.J. Muehlbauer. 1985. Hybridization in the genus Lens by means of embryo culture. Theor Appl Genet 70: 97–101.
Ladizinsky, G. 1999. Identification of lentil’s wild genetic stock. Genetic resources and Crop
Evolution 46: 115-118.
Ladizinsky, G. 1979. The genetics of several characteristics in lentil as indicated by crosses between Lens culinaris and Lens orientalis. J. Hered 70: 135-137.
Lal, S., and R.S. Srivastova. 1975. Inheritance of flower color in lentils. Indian Journal of
Genetics and Plant Breeding. 35: 29-30.
29

Lander, E., and D. Botstein. 1989. Mapping Mendelian factors underlying quantitative traits using RFLP linkage maps. Genetics 121: 185-199.
Larone, D.H. 2002. Medically Important Fungi: a Guide to Identification, 4th edn. Washington,
DC: American Society for Microbiology.
Lee, E.A., P.F. Byrne, M.D. McMullen.1998. Genetic mechanisms underlying apimaysin and maysin synthesis and corn earworm antibiosis in maize (Zea mays L.). Genetics 149: 1997–2006.
Lefebvre, V., A. Palloix, C. Caranta and E. Pochard. 1995. Construction of an intraspecific
integrated linkage map of pepper using molecular markers and double-haploid progenies. Genome 38: 112-121.
Li, H., G .Ye, and J .Wang. 2007. A modified algorithm for the improvement of composite
interval mapping. Genetics 175: 361–374.
Li, H., J-M. Ribaut, Z. Li, and J. Wang. 2008. Inclusive composite interval mapping (ICIM) for digenic epistasis of quantitative traits in biparental populations. Theor Appl Genet 116: 243–260.
Li, Z.K., L.J. Luo, R.M.H. Tabien, A.H. Paterson.1999. A‘defeated’ resistance gene acts as a
QTL against a virulent strain of Xanthonomas oryzae pv oryzae. Mol Gen Genet 261: 58–63.
Malvick, D.K. 1998. Leaf and stem diseases of alfalfa. Report on Plant Disease No.301: April
1988. Dept. of Crop Sciences, University of Illinois at Urbana-Champaign. Marcos, P.S.C., N.R. O'Neil, and P. van Berkum. 2002. Phylogeny of Stemphylium
spp. based on ITS and glyceraldehyde-3-phosphate dehydrogenase gene sequences. Mycologia 94: 660–672.
Marshall, D.R. 1977. The advantages and hazards of genetic homogeneity. In: P.R. Day (Ed.),
The Genetic Nasis of Epidemics in Agriculture. New York Academy of Sciences, New York, USA. 1-20.
Mather, K. 1949. The genetical theory of continuous variation. P Int Gen C. 8: 376–401.
Mehta, Y. R. 1998. Severe outbreak of Stemphylium leaf blight, a new disease of cotton in
Brazil. Plant Dis 82: 333–336. doi:10.1094/PDIS.1998.82.3.333.
Monti, L., A.J. Biddle, M.T. Moreno, and P. Plancquaert. 1994. Biotic and abiotic stresses of pulse crops in Europe. In: F.J. Muehlbauer and K.J. Kaiser (Eds.), Expanding the Production and Use of Cool Season Food Legumes. Kluwer Academic Publishers, Dordrecht, The Netherlands. p. 204–218.
30

Morrall, R.A.A., and E.A. Pedersen. 1991. Discovery of lentil anthracnose in Saskatchewan in 1990. Can. Plant Dis. Surv. 71: 105–106.
Morrall, R.A.A. 1988. A new disease of lentil induced by Colletotrichum truncatum in
Manitoba. Plant Dis Rep 72: 994.
Morrall, R.A.A., and J.W. Sheppard. 1981. Ascochyta blight of lentils in western Canada: 1978-1980. Can Plant Dis Sur 61: 7-12.
Muehlbauer, F.J. 2009. Lentil: Improvement in developing countries. Erskine, W., F.J.
Muehlbauer, A. Sarker, and B. Sharma. The Lentil: Botany, production and uses. CAB International.137-154.
Muehlbauer, F.J., R.J. Summerfield, W.J. Kaiser, C.M. Boerboom, M.M. Welsh-Maddux, and
R.W. Short. 1992. Principles and practice of lentil production. Electronic publication at http://www.ars.usda.gov/is/np/lentis/lentils.htm
Muehlbauer, F.J., N.F. Weeden, and D.L. Hoffman. 1989. Inheritance and linkage relationships
of morphological and isozyme loci in lentil (Lens Miller). J Hered 80: 298-303.
Muehlbauer F.J., D.G. Burnell, T.P. Bogyo, and M.T. Bogyo. 1981. Simulated comparisons of single seed descent and bulk population breeding methods. Crop Sci 21: 572-577.
Muehlbauer, F.J., A.E. Slinkard, and V.E. Wilson. 1980. Lentil. In: W. R. Fehr, and H. H.
Hadley (eds), Hybridization of Crop Plants. American Society of Agronomy and Crop Science Society of America, Madison, USA. p. 417-426.
Mutschler, E., H. Derendorf, M. Schafer, K. Elrod, and K. Estes. 1995. Drugs Actions. CRC
Press, Germany. p. 434-436. Mwakutuya, E. 2006. Epidemiology of Stemphylium Blight of Lentil (Lens culinaris)in
Saskatchewan. M.Sc. Thesis. Department of Plant Sciences, University of Saskatchewan, Saskatoon, Saskatchewan.
Negussie, T., Z.A. Pretorius, and C.M. Bender. 2005. Component of rust resistance in lentil.
Euphytica 142: 55-64. Netzer, D., D. Globerson, C. Weintal, and R. Elyassi. 1985. Sources and inheritance of resistance
to stemphylium leaf spot of lettuce. Euphytica 34: 393-396
Nguyen, T.T., P.W.J. Taylor, J.B. Brouwer, E.C.K. Pang, and R. Ford, 2001. A novel source of resistance in lentil (Lens culinaris spp. Culinaris) to ascochyta blight caused by Ascochyta lentis. Aust Plant Pathol 30: 211-215.
O’ Brien, S.J. 1993. Genetic maps: locus map of complex genomes, 6th edn. Cold Spring Harbor
Laboratory Press, Cold Spring Harbor.
31

Parker, M. A. 1994. Pathogens and sex in plants. Evol. Ecol 8:560–584. Pederson, W.L., and S. Leath. 1988. Pyrimiding major genes for resistance to maintain residual
effects. Annu Rev Phytopathol 26:369-378.
Robertson, D.S. 1989. Understanding the relationship between qualitative and quantitative genetics. In: Development and Application of Molecular Markers to Problems in Plant Genetics (eds Helentjaris T, Burr B). Cold Spring Harbor Press, Cold Spring Harbor, NY. p.81–88.
Roberts E.H., R.J. Summerfield, F.J. Muehlbauer, and R.W. Short. 1986. Flowering in Lentil
(Lens culinaris Medic.): The Duration of the Photoperiodic Inductive Phase as a Function of Accumulated Daylength above the Critical Photoperiod. Ann Bot 58: 235-248.
Rubeena, R. F., and P.W.J. Taylor. 2003. Construction of an intraspecific linkage map of lentil
(Lens culinaris ssp. culinaris).Theor Appl Genet 107: 910–916. Saha, G.C. 2009. Research fields visit of PRC, Ishurdi, Pabna, Bangladesh. Ph.D. dissertation,
Dept. of Crop and Soil Sciences, Washington State University. Salter, R., and K. Leath. 1991. Spring blackstem and leafspot resistance. In: Fox, C.C., R.
Berberet, F.A. Gray, C.R. Grau, D.L. Jesse, and M.A. Peterson (eds), Standard tests to characterize alfalfa cultivars.) North American Alfalfa Improvement Conference, Beltsville, MD. p.11.
Sakar, D. 1983.Breeding behaviour of characters related to yield and adaptation to mechanical
harvesting in lentil (Lens culinaris Medik.). Ph.D. dissertation, Dept. of Agronomy and Soils, Washington State University.
Sarker, A., R.S. Malhotra, S. Khalil, and W. Erskine. 2002. Food legume improvement at
ICARDA, ICARDA Annual Report, Aleppo, Syria.
Sarker, A., W. Erskine, B. Sharma, and M.C. Tyagi. 1999. Inheritance and linkage relationship of days to flower and morphological loci in lentil (Lens culinaris Medikus subsp. culinaris) The Journal of Heredity 90 (2): 270-275.
Saxena, M.C. 1993. The challenge of developing biotic and abiotic stress resistance in cool-
season food legumes. In: Singh, K.B., and M.C. Saxena (Eds.), Breeding for StressTolerance in Cool-Season Food Legumes. Wiley, Chichester, United Kingdom. 3–14.
Saxena, M.C., and G.C. Hawtin, 1981. Morphology and growth patterns. In: C. Webb and G.
Hawtin (Eds), Lentils. Commonwealth Agricultural Bureaux, Slough, UK. p.39–52.
32

Sharma, B., and M.K. Emami. 2002. Discovery of anew gene causing dark green cotyledons and pathway of pigment synthesis in lentil (Lens culinaris Medik). Euphytica 124: 349-353.
Sinha, R.P., and B.P. Yadav.1989. Inheritance of resistance to rust in lentil. Lens 16: 41.
Singh, J.P., and I.S. Singh. 1992. Genetics of rust resistance in lentil (Lens Culinaris). Indian J
Agric Sci 62: 337-338.
Singh, S.J., and S.S. Sokhi. 1980. Pathogenic variability in Uromyces viciae-fabae. Plant Dis 64: 671-672.
Singh, K., H.S. Rawal, S. Singh, and R.K. Gumber. 1995. Physiological specialization in
Uromyces fabae causing rust of lentil. Lens 22: 46-47. Singh, T.P. 1978. Inheritance of cotyledon colour in lentil. Indian J Genet 38: 11–12. Singh, K., and T.S. Sandhu. 1988. Screening of cultivars of lentil for resistance to rust. Lens 15:
28-29.
Slinkard, A.E., G. Bascur, and G. Hernandez-Bravo. 1994. Biotic and abiotic stresses of cool season food legumes in the western hemisphere. In: Muehlbauer, F.J., and K.J. Kaiser (Eds.). Expanding the production and use of cool season food legumes. Kluwer Academic Publishers, Dordrecht, The Netherlands. p.195–203.
Slinkard, A.E. 1978. In heritance of cotyledon color in lentils. J Hered 69: 139-140. Summerfield, R.J., F.J. Muehlbauer, and E.H. Roberts.1984. Controlled environments as an
adjunct to field research on lentils (Lens culinaris). III. Photoperiodic lighting and consequences for flowering. Exp Agric 20: 1-18.
Tahir, M., and F.J. Muehlbauer. 1994. Gene mapping in lentil with recombinant inbred lines. J
Hered 85: 306-310.
Tahir, M., C.J. Simon, and F.J. Muehlbauer. 1993. Gene map of lentil: a review. Lens 20: 3-10.
Tay, J., and A.E. Slinkard. 1989. Transgressive segregation of Ascochyta resistance in lentil. Can J Plant Sci 69: 547.
Tschemak-Seysenegg, E. 1987. Lentil and field bean crosses. Sityringsber Akad Wiss Wien
Math Nat R1 I Abs. 137(3/4):171-181 (cf. Muehlbauer, F.J. and A.E. Slinkard, 1987. BreedingMethodology. In: C. Webb and G. Hawtin (Eds.), Lentils. CAB-ICARDA, Farnham, England. p.69-90.
Tullu, A., L. Buchwaldt, T. Warketin, B. Taran, and A. Vandenberg. 2003. Genetics of resistance
to anthracnose and identification of AFLPand RAPD markers linked to the resistance
33

gene in PI 320937 germplasm of lentil (Lens culinaris Medikus). Theor Appl Genet 106: 428-434.
Turner, N.C., G.C. Wright, and K.H.M. Siddique. 2001. Adaptation of grain legumes (pulses) to
water-limited environments. Adv Agron 71: 193–231.
Vaillancourt, R.E., and A.E. Slinkard. 1993. Linkage of morphological and isozyme loci in lentil. Lens culinaris L. Can J Plant Sci 73: 917-926.
Vandenberg, A., and R.A.A. Morrall. 2002. Pulse crop variety development strategies in
Saskatchewan. Saskatchewan Pulse Growers Pulse Days 2002, Saskatoon.
Vandenberg, A., and A.E. Slinkard. 1989. Inheritance of four new quantitative genes in lentil. J Hered 80: 320–322.
Vandenberg, A., and A.E. Slinkard. 1990. Genetics of seed coat color and pattern in lentil. J.
Hered 81: 484-488.
Venette, J.R., H.A. Lamey, R.L. Lamppa. 1994. First report of lentil anthracnose (Colletotrichum truncatum) in the United States. Plant Dis 78: 1216.
Viennot-Bourgin, G. 1949. Les champignons parasites des plantes cultive´es, Masson and Cie,
France, p.1850. Wang, Y., and X.G. Zhang. 2006. Three new species of Stemphylium from China. Mycotaxon
96: 77–81. Warren, R.F., P.M. Merritt, E. Holub, R.W. Innes.1999. Identification of three putative signal
transduction genes involved in R gene-specified disease resistance in Arabidopsis. Genetics 152: 401–412.
Webb, C., and G. Hawtin. 1981. Lentils. Commonwealth Bureau, Page Bros, Norwich.
Weeden, N.F., F.J. Muehlbauer, G. Ladizinsky. 1992. Extensive conservation of linkage
relationships between pea and lentil genetic maps. J Hered 83: 123–129
Wilcoxson, R.D., B. Skovmand, and A.A. Atif. 1975. Evaluation of wheat cultivars for the ability to retard development of stem rust. Ann Appl Biol 80: 275-281.
Williams, J.T., A.M.C. Sanchez, and M.T. Jackson. 1974. Studies on lentils and their variation.
The taxonomy of the species. Sabrao Journal 6: 133-145.
Wilson, V.E., and L.W. Hudson. 1978. Inheritance of lentil flower color. J Hered 69: 129-130.
Wilson, V.E., A.G. Law, and R.L. Warner. 1970. Inheritance of Cotyledon Color in Lens Culinaris (Medic.). Crop Sci 10: 205-207.
34

Wright, S. 1934. An analysis of variability in number of digits in an inbred strain of guinea pigs.
Genetics 19: 506–536.
Ye, G., D.L. McNeil, and G.D. Hill. 2000. Two major genes confer ascochyta blight resistance coming from Lens orientalis. NZ Plant Prot 53:109.
Zeng, Z.-B., C.-H. Kao, and C. J. Basten. 1999. Estimating the genetic architecture of
quantitative traits. Genet Res 74: 279–289.
Zeng, Z.-B. 1994. Precision mapping of quantitative trait loci. Genetics 136: 1457-1468.
Zeng, Z.-B. 1993. Theoretical basis for separation of multiple linked gene effects in mapping quantitative trait loci. Proc. Natl. Acad. Sci. USA 90:10972-10976.
Zohary, D. 1972. The wild progenitor and place of origin of the cultivated lentil. Lens culinaris.
Econ Bot 26: 326–332.
35

CHAPTER ONE
INHERITANCE AND LINKAGE MAP POSITIONS OF GENES CONFERRING RESISTANCE TO STEMPHYLIUM BLIGHT IN LENTIL
36

ABSTRACT
Stemphylium blight (caused by Stemphylium botryosum Wallr.) is one of the major diseases of
lentil (Lens culinaris Medik.) in South Asia and North America. In order to determine the
inheritance and map the genes for resistance a population of recombinant inbred lines (RILs) was
developed from a cross between ILL-6002 (resistant) and ILL-5888 (susceptible). Progeny were
advanced from F2 to F7 by single seed descent. The resulting 206 F7 derived RILs were planted
in disease screening plots at Ishurdi, Bangladesh in the 2006-2007 and 2008-2009 winter
cropping seasons. The results indicated significant variation among the RILs for disease scores
and frequency distributions of disease scores indicated complex inheritance. An intraspecific
linkage map was constructed that comprised 139 markers; 21 simple sequence repeats (SSR), 27
random amplified polymorphic DNA (RAPD), 89 sequence related amplified polymorphism
(SRAP) markers and 2 morpho-physiological markers distributed over 14 linkage groups. One
significant QTL was detected based on stemphylium blight disease scores from the 2006-2007
experiment while three significant QTLs were detected from the 2008-2009 experiment. The
QTL QLG480-81 was common in both the years and accounted for 25.2% and 46% variation in
2006-2007 and 2008-2009 experiments, respectively. The other two QTLs of based on 2008-
2009 blight scores were QLG249 and QLG33 and accounted for 6.3% and 5.0 % of the variation,
respectively. Two SRAP markers, ME5XR10 and ME4XR16c, and one RAPD marker, UBC34
were significantly associated with the common QTL (QLG480-81) for both crop years which
reside on linkage group 4. ME5XR10, ME4XR16c and UBC34 markers were 1.8-2.8cM, 0.4-
0.6cM and 0.6-1.6cM from the common QTL, respectively. After validation, the more tightly
linked ME4XR16c marker can be used for marker assisted selection for stemphylium blight
resistance.
37

Key words: Stemphylium blight resistance, SRAP markers, additive and epistatic effect.
INTRODUCTION
Stemphylium blight (caused by Stemphylium botryosum Wallr.) is a serious threat to
lentil (Lens culinaris Medik.) cultivation in some parts of the world, especially in South Asia
including Bangladesh, Northeast India and Nepal. This disease has also been reported in Egypt,
Syria and North America (Erskine and Sarker, 1997, Bayaa and Erskine, 1998; ICARDA, 2004;
Vandenberg and Morrall, 2002).The disease results in yield losses that exceed 60% in severely
infected fields. Historically it has been considered a disease of minor importance in the US
northern plains (MT and ND) and in Saskatchewan, Canada, but with the increase of lentil
production and deployment of new cultivars with resistance to ascochyta blight (caused by
Ascochyta rabiei Pass. Lab) and anthracnose (caused by Colletotrichum truncatum (Schwein.)
Andrus and Moore), stemphylium blight has become a more serious problem (Vandenberg and
Morrall, 2002).
The pathogen has a wide geographic distribution and infects plants in 43 genera. The
diverse host range of Stemphylium botryosum, which includes leguminous and non leguminous
species in different parts of the world, demonstrates its adaptability to different genotypes and
environments (du Toit and Derie, 2001). Symptoms of disease start as pinhead-sized light brown
or colored spots on leaflets of plants in dense populations. The spots enlarge rapidly and within
2-3 days they cover the entire leaflet resulting in defoliation and death of young plants. In severe
cases the crop may exhibit a blighted appearance causing large scale defoliation; however, the
pods may remain green (Erskine and Sarker, 1997).
38

Environment plays a major role in stemphylium blight disease development. In South
Asia temperatures of 18-20ºC with relative humidity over 85% favors disease development
(Erskine and Sarker, 1997). High temperatures favor spore germination and presumably
infection. Warm and humid weather that prevails in Bangladesh in January also favors disease
development (Erskine and Sarker 1997). Occasional rain in winter in Bangladesh may increase
the severity of the disease. Jhorar et al. (1998) reported that infection increased with increased
leaf wetness up to 24h duration. Leaf wetness requirements and response to interrupted leaf
wetness are expected to vary from region to region as the pathogen adapts to prevailing
environmental conditions. Studies showed that structural defense factors such as hairs, thickness
of the epidermis and cortical layers of lentil contribute significantly to stemphylium blight
resistance (Chowdhury et al., 1997).
There has been limited study on genetics of stemphylium blight in lentils. The frequency
distribution within a lentil RIL population developed from the cross Barimasur-4 x CDC
Milestone in both field and controlled environments revealed quantitative inheritance (Kumar,
2007). Resistance to S. botryosum in lettuce is reportedly controlled by a dominant gene, Sm1,
and one recessive gene, sm2 (Netzer et al., 1985).
Non-allelic interaction plays an important role in genetic control of quantitative traits.
The interacting genes that influence the phenotype of quantitative traits follow a complex
phenomenon. The inclusive composite interval mapping (ICIM) provides intuitive statistics for
testing additive and digenic epistatic effects and increase the power of detecting QTL, reduces
the false positives of QTL, and provides a less biased estimate of QTL effects (Li et al., 2008).
So, ICIM model was used to identify the QTL in our mapping population.
39

The objectives of the present study were (i) to determine the inheritance and linkage map
positions of the genes for resistance to stemphylium blight in lentil and (ii) to identify molecular
markers for the resistance genes that can be used in marker assisted selection.
MATERIALS AND METHODS
Inheritance study
Crosses were made between resistant line ILL-6002, a pure line selection from Precoz,
and ILL-5888, a highly susceptible germplasm line. ILL-5888 named ‘Uthfola’ was the first
lentil cultivar released by the Bangladesh Agricultural Research Institute (BARI), Gazipur in
1991. In addition, backcrosses were made between the F1s and the parents (F1x ILL-5888 and
F1x ILL-6002) in order to determine whether resistance was dominant or recessive.
The two parents were screened in a growth chamber (22°C day and 16°C night
temperature with 85% RH) at 2 wks, 4 wks, 6 wks, and 8 wks of age against three isolates (I1, I2
and I3) collected from USA. The isolates were cultured in PDA and V8 juice and the mycelium
was transferred to potato dextrose broth for 10 days. The mycelium grown on PDA and V8 juice
was blended and three replicates of the parents were inoculated. Chowdhury et al. (1996) used
similar methods to produce a mycelial suspension and Hashemi et al. (2005) reported that
mycelial suspensions for disease screening was as reliable as spore suspension inoculum. The
isolate and plant age that showed differential disease reactions between parents were chosen for
the study of the inheritance of disease resistance. Eight wk old parents (ILL-5888, ILL-6002), F1
(ILL-5888 x ILL-6002) and backcross progenies (F1x ILL-5888 and F1x ILL-6002) were
inoculated with the I3 isolate and their disease reactions were evaluated. Three replications were
used for this evaluation.
40

Developing recombinant inbred lines
A recombinant inbred line (RIL) genetic mapping population was developed from a cross
of ILL-6002 and the susceptible line ILL-5888 by advancing the F2 population to the F7 by single
seed descent. The resulting 206 F7 derived RILs were used for phenotyping.
Phenotyping
The F7 derived RILs were planted in disease plots at the Pulse Research Center (PRC) of
Ishurdi, Bangladesh for the 2006-2007 and 2008-2009 cropping seasons using a randomized
complete block design with three replications. The individual plots were single rows 1m long
and spaced 40cm apart. Debris of stemphylium blight infected lentil plants was collected the
previous year and was spread throughout the field and served as the source of primary inoculum.
Phenotyping for disease reaction was done using the 1-9 scale developed by Chen (2007)
(personal communication) during the late flowering stage where 1 = 0-10% leaf area infected, 3
= 11-30% leaf area infected, 5 = 31-50% leaf area infected, 7 = 51-70% leaf area infected, 9 =
More than 70% leaf area infected. The analysis of variance of disease scores for the RILs was
conducted using SAS 9.1.
Genotyping
DNA was isolated from the young leaf tissue of the parents and their RILs. DNA was
isolated by chloroform- iso-amyl alcohol (24:1) extraction method and precipitated by 95%
ethanol and washed in 70% ethanol (Doyle and Doyle 1987). DNA was dissolved in TE buffer
for long term storage and use. The two parents were tested for polymorphism using for 156
SSR, 270 SRAP and 181 RAPD markers. Out of 206 inbred lines, 169 lines were randomly
chosen for genotyping using the polymorphic markers.
41

a) SSR markers:
Of the 156 SSR markers used, 30 were obtained from ICARDA and the rest were
developed in our laboratory (GLLC-SSR: Grain Legume Lens Culinaris-SSR) using the
magnetic bead method (Kijas et al. 1994, Kijas et al.1995). PCR reactions consisted of 20μl
PCR reaction contained 40ng genomic DNA, 10pmol of each forward and reverse primer, 0.2 M
dNTP, 1X Promega PCR buffer and 1U Taq DNA polymerase (Promega). PCR was carried out
in a thermocycler with an initial denaturation of 94ºC for 3 min, followed by 35 cycles of 94ºC
for 30s, 55ºC for 35s, and 72ºC for 60s, was followed by a final extension at 72ºC for 5 min.
The PCR products were electrophoresed on 6% polyacralimide and visualized through silver
staining (Tegelstrom, 1992). The LI-COR 4300 DNA analyzer was used for detecting
microsatellite polymorphism, primers were labeled with IRDye 700 and IRDye 800 and the
amplicons were separated with 6% polyacralimide gel. The band sizes were analyzed using
SagaGT software.
b) RAPD PCR
RAPD markers were generated from genomic DNA in 25 μl reactions containing 50 ng
DNA, 2.5μl 10X buffer, 1.5μl MgCl2, 0.4μl primer, and 0.2μl Taq DNA polymerases. The
thermocycling profile consisted of an initial step of 94°C for 5 min, followed by 40 cycles of
94°C for 20 s, 36°C for 60 s and 72° C for 60 s, and the final elongation was performed at 720C
for 8 min. PCR products were resolved on 2% agarose gels in 1X TBE buffer (tris, boric acid and
0.5M EDTA at pH=8.0), stained with ethidium bromide, and visualized under ultraviolet light.
c) SRAP markers
Each 20μl reaction contained 50 ng DNA, 4 ul dNTPs @1.25mM each dNTP, 1.5 mM
MgCl2 , 5μl 5X promega buffer, 2.5μl forward and primer each @15ng/μl, 0.5μl Taq DNA
42

polymerase (5 units/μl) . The initial denaturation temperature 95º for 60 s followed by 10 cycles
of temperature 94ºC, 35ºC and 72ºC respectively for 60 s each. This was followed by 30 cycles
of 94ºC for 60 s, 50ºC for 60 s, and 72ºC for 60 s, and a final extension for 7 min at 72ºC.
Amplicons were resolved using 2% agarose gels in Tris-borate EDTA (TBE) buffer and stained
with ethidium bromide. Parents were initially screened to detect polymorphisms and primer pairs
that produced reliable polymrophisms were used to screen 169 RILs.
Linkage analysis
The markers were analyzed by chi-square goodness of fit to the 1:1 expected Mendelian
segregation ratio. Linkage analysis was performed using Mapmaker Macintosh V2.0 (Lander et
al., 1987). Linkage groups were developed at a LOD score threshold of 4 and a maximum
recombination fraction (θ) of 0.25 by two point analysis using group command. The best marker
order was identified using the ‘compare’ function and sets of more than eight markers were
ordered using a combination of the ‘compare’ and ‘try’ functions. The Kosambi mapping
function (Kosambi, 1944) was used to calculate genetic distance.
QTL analysis
QTL analysis was conducted using QTL IciMapping v2.2 and Q gene 4.2.3 software. In
the first step, stepwise regression was applied to identify the most significant regression variables
with different probability label by entering and removing variables. In the second step, a one
dimensional scanning or interval mapping analysis was conducted to detect additive effects and a
two dimensional scanning was then conducted to detect digenic epistatic effects (Li et al., 2008).
43

RESULTS AND DISCUSSION
Analysis of variance of disease reaction
Phenotyping of the 206 RILs at Ishurdi, Bangladesh indicated variation (P=0.001) in
blight scores in both crop years (2006-2007 and 2008-2009) with block effects significant in
2008-2009 only (Table 1). The pooled variance showed highly significant variation among RILs.
The pooled analysis also demonstrated that line x year effects were significant as was the year
effect on disease expression. It has been observed that 2006-2007 and 2008-2009 stemphylium
blight score showed significant correlation (r=0.317, P=0.001).
Trait analysis
The mean disease score of the RILs in the two cropping years, 2006-2007 and 2008-2009, were
4.2 ± 2.5 and 4.6 ± 2.4, respectively. The distribution of disease score was partitioned into four
different groups, 1-3.1, 3.7-5.1, 5.7-7.1, 7.9-9.0. Most of the RILs in the two cropping years
showed disease score that ranged 1-3.1. The resistant parent ILL-6002 and susceptible parent
ILL-5888 showed consistent disease reactions in both years, in 2006-2007 they were 1.7 ± 1.2
and 8.3 ± 1.2, respectively, while in 2008-2009 the mean disease score were 1.7 ± 1.2 and 7.7 ±
1.2, respectively.
The frequency distribution of stemphylium blight disease rating of RILs in 2006-2007
and 2008-2009 cropping years (Fig.1:a1, b1) doesn’t fall only the resistant (1.0-3.1 disease
rating) and susceptible classes (7.7-9.0 disease rating), there are moderately resistant (3.7-5.0
disease rating) and moderately susceptible classes (5.7-7.1 disease rating) present which suggests
that more than one gene is involved in conditioning resistance / susceptibility to stemphylium
blight. Normality test (Fig.1:a2, b2) showed absence of normal distribution which suggests
44
involvement of some major and minor genes for disease resistance. Complex inheritance of
resistance is also indicated by frequency distributions (Fig.1:c1) and normality test (Fig.1:c2)
based on the pooling of data from both cropping years. The higher number RILs were resistant to
stemphylium blight in both the cropping years suggest that the resistance is controlled by
dominant genes. The inheritance study also confirmed that F1 moderately resistant and among
the backcross progenies F1x ILL-6002 showed moderately resistant in disease reaction where as
F1x ILL-5888 showed moderately resistant to susceptible reactions.
Genetic Mapping
An intraspecific lentil (L. culinaris ssp. culinaris x L. culinaris ssp. culinaris) map was
constructed using 21 SSR, 22 RAPD and 60 SRAP primers that generated 161 polymorphic
markers including 23 SSRs, 30 RAPDs and 108 SRAPs (Fig.2). The size of the markers varied
from approximately 200 to1400 bp. SRAP primers produced the highest number of polymorphic
markers (1.8 markers/primer) followed by RAPDs and SSRs. Two morpho-physiological
markers, plant type and cotyledon color, were distinctive between the parents and these were also
used to construct the linkage map (Table 2).
Marker distortion was detected by chi-square analysis and it was found that 36 markers
did not segregate according to the expected Mendelian ratio of 1:1 at P>0.05 i.e. about 22% of
the total markers. Approximately 43.5% of SSR markers, 20% of RAPD and 18.5% of SRAP
markers showed marker distortion. Rubeena et al. (2003) reported 14% segregation distortion
[RAPD, ISSR (Inter Simple Sequence Repeat) and RGA (Resistance Gene Analogs)] in F2
populations of lentil and Hamwieh et al. (2005) observed that 9.5% of 41 SSR markers and
17.8% of 45 AFLP (Amplified Fragment Length Polymorphism) markers showed marker
distortion in lentil 86 RILs. In this study, 24 distorted unlinked markers were discarded and the
45
lentil linkage map was constructed based on 139 markers. The constructed linkage map
comprised 14 linkage groups that spanned 1565.2cM (Table 3).
Linkage groups varied in length from 38.4 to 256.2cM and the average number of marker
loci in each linkage group was 11.6cM. Six linkage groups (LG1, LG2, LG3, LG4, LG5 and
LG6) were greater than 100cM. LG1 covered the longest distance (256.2cM) among the linkage
groups detected and also was composed of the most markers (22), while LG14 represented the
smallest linkage group in terms of length (38.4cM). The highest marker density was observed for
LG14 (5.5cM/marker), whereas the lowest marker density was observed for LG9
(19.5cM/marker).
Rubeena et al. (2003) detected 100 RAPDs, 11 ISSRs and 3 RGA markers in an F2 lentil
(L. culinaris ssp. culinaris x L. culinaris ssp. culinaris) population, and revealed nine linkage
groups varying in length from 34.9cM to 134.8cM. The map spanned a total length of 784.1cM
with an average distance of 6.9cM between adjacent markers. The Lens sp. (L. culinaris ssp.
culinaris x L. culinaris ssp. orientalis) map developed by Duran et al. (2004) has 62 RAPDs, 29
ISSRs, 65 AFLPs, 4 morphological and 1 microsatellite marker. The map consisted of ten
linkage groups covering 2171.4cM with an average distance between markers of 15.9cM. Most
recently, a total of 41 SSR and 45 AFLP markers were mapped on 86 lentil RILs (Hamwieh et al.
2005).
Most of the markers detected in this study were clustered near the central regions of each
linkage group. The SSR204a mapped to LG1, agreed with Hamwieh et al. (1995), while the
other locus of this primer, SSR204b, was located in LG8. Marker SSR48 was positioned on LG2
in our map; however, it was located on LG3 on the map of Hamwieh et al. (1995). Most of the
GLLC-SSR markers were at the termini of linkage groups. It has been speculated that AT rich
46
SSRs are frequently evolving from the poly A tail of the Alu retrotransposon in plants (Gortner et
al., 1998). The localization of microsatellites varies among genomes and sometimes shows non-
random distribution in eukaryotes (Gortner et al., 1998). In this study the RAPD and SRAP
markers were distributed evenly across the genome.
The curved map (Fig. 2) could be supplemented with additional markers to reduce the
number of linkage groups to 7 so that linkage groups can be assigned to individual
chromosomes. SSRs are co-dominant markers that are very useful as anchors to transfer
information between different maps within a species. Accordingly, in using SSR markers
developed by Hamwieh et al. (2005), only two SSRs were polymorphic in the ILL-5888 x ILL-
6002 map resulting in the resolution of three additional loci. A lack of shared polymorphic SSR
markers between the two populations limited the ability to join the two maps.
QTL analysis
The LOD in contour profiles and the table showing additive effect clearly indicate the
presence of significant QTL for stemphylium blight disease score. The genomic regions with
QTLs were observed by light bands in both the axes (Table 4, Fig 3a and 4a). LODA in contour
profile and interaction table demonstrated combined additive and epistatic effects between
digenic QTLs (Table 5, Fig 3b and 4b), whereas LODAA in contour profile excluded the
influence of additive effects and clearly indicated the presence of epistatic effects (Table 5, Fig
3b and 4b). Some of the combined additive and epistatic effect, LODA and epistatic effects
excluding additivity, LODAA were significant and showed values >3.
(a) QTL with additive effect
A QTL on the LG4 near to the 80-81cM position was detected from the 2006-2007 and
2008-2009 crop season analysis. This QTL (QLG480-81) accounted for 25% (with LOD value of
47

9.6) and 46% (with LOD value 25.4) of the phenotypic variance with additive effect of 1.24 and
1.60 to the disease scores respectively (Table 4, Fig. 5 and 6).
The closest markers in that location are ME5XR10 at the locus 78.2cM, ME4XR16c at
the locus 80.4cM and UBC34 at the locus 81.6cM. Two other QTLs, one (QLG33) located at
position 3cM on LG3 and another (QLG249) located at position 49cM on LG2 accounted for 5.0
and 6.3% of the variation in disease scores, respectively.
(b) QTL with interaction effect
In 2006-2007 crop year, the QLG1190 x QLG1146 interaction resulted in a significant
negative epistatic effect (epistatic value= -0.886) that accounted for 12.8% of the total
phenotypic variation where as QLG4124 x QLG1030 had a significant positive epistatic effect
(epistatic value=0.727) that accounted for 10% of the variation for disease score (Table 5, Fig 3b
and 4b).
Significant epistatic interactions between QTLs were also detected for the 2008-2009
crop year (Table 5). QLG920 x QLG930 (epistatic effect = -1.074) and QLG2202 x QLG3104
(epistatic effect = 0.650) accounted for 9.7% and 10.3% of phenotypic variation respectively
where as QLG194 x QLG1138 (epistatic effect = 0.493) accounted 3.6% of the total phenotypic
variation, i.e lowest significant variation (Table 5, Fig 3b and 4b).There is a trend that individual
QTL with larger effects will show higher LOD scores than QTL that have lesser effects.
However, this is not always the case, especially when multiple QTLs are linked. In this study, the
QLG2202 x QLG3104 interaction had a larger effect (10.3%) but a lower LOD value than the
following interactions: QLG194 x QLG1138, QLG1206 x QLG316, QLG1208 x QLG318, QLG1210 x
QLG320, QLG1212 x QLG324, QLG4140 x QLG5104, QLG5104 x QLG96, QLG834 x QLG936, QLG834
x QLG946 and QLG920 x QLG930 (Table 5). This suggests that the interaction of QLG2202 x
48

QLG3104 had a repulsion effect with other QTLs and had lower chance of detection, although it
accounted for a larger amount of the total phenotypic variation. Interactions between QTLs,
QLG1206 x QLG316, QLG1208 x QLG318 and QLG1210 x QLG320 had LODA value of 6.61, 6.18
and 5.71 respectively, while the respective LODAA values for these interactions were 3.13, 3.15
and 3.12 indicating that these loci had both significant additive and epistatic effects. Epistatic
interactions were significant while individual additive effects were smaller for the following
interactions: QLG194 x QLG1138, QLG1212 x QLG324, QLG4140 x QLG5104, QLG5104 x QLG96,
QLG834 x QLG936, QLG834 x QLG946 and QLG920 x QLG930 (Table 5).
Stemphylium blight disease score for the two years of evaluation showed different
epistatic interaction effects. This suggests that tri or tetragenic locus interactions may more
effectively explain these observed epistatic effects than digenic interactions.
CONCLUSION
We have identified significant QTLs associated with stemphylium blight resistance based
field data of two cropping seasons. The QTL, QLG480-81 is very closely linked to the disease
resistance genes. ME5XR10, ME4XR16c, and UBC34 are about 1.8-2.8cM, 0.4-0.6cM and 0.6-
1.6cM respectively, from the identified QTL for stemphylium blight resistance. Marker
ME4XR16c could be used for marker assisted selection for resistance/ susceptibility after
validation. Marker information may be transferable to other populations and will be used for
marker assisted selection. So, we need to increased marker density in the vicinity of the QTL that
would permit a more precise placement of the QTL in the genome and in future, we will be able
to clone the genes with chromosome walking using BAC libraries. Additive and digenic epistatic
effects could explain the QTL more effectively and reduce the detection of false QTL. The
49
introduction of tri or tetra epistatic locus interaction model can improve the efficiency of the
QTL detection and the epistatic QTL effects should be brought under consideration along with
additive effects during marker assisted selection.
Acknowledgements: This work was supported by USAID-ICARDA linkage project. We are
grateful to Director of Pulse Research Center, Ishurdi, Bangladesh for setting up field experiment
in their station. We are also indebted to David White and P.N. Rajesh for providing us GLLC-
SSR markers and Sheri Rynearson, Tony Chen and Tracie Anderson for laboratory support.
REFERENCES
Bayaa, B., and W. Erskine. 1998. Lentil Pathology. Pages 423-472, in: Pathology of Food and Pasture Legumes (eds D. Allen and J. Lenné), Commonwealth Agricultural
Bureaux International, U.K in association with: International Crop Research Center for the Semi-Arid Tropics, Patancheru 502 324. Andhra Pradesh, India.
Chen, W. 2007. Stemphylium blight disease scoring in field condition. Research Geneticist,
USDA-ARS, Washington State University, Pullman, WA-99164.
Chowdhury, A.M., A. Ahmed and M. Zaman 1997. Studies on the defence structural factors of some susceptible and resistant varieties of lentil plants. Journal of Mycopathological Research 35: 35-39.
Chowdhury, A. M., A. Ahmed, M. Zaman and M.A. Bakr. 1996. Sporulation of Stemphylium
botryosum Wallr. Journal of Mycopathological Research 34: 69-71.
Dempster, A.P., N. M. Laird, and D. B. Rubin. 1977. Maximum likelihood from incomplete data via the EM algorithm. Journal of the Royal Statistical Society, Series B, 34:1-38.
Doyle, J.J., and J.L. Doyle. 1987. A rapid DNA isolation procedure for small quantities of fresh
leaf tissue. Phytochemical Bulletin 19:11–15.
du Toit, L.J., and M.L.Derie. 2001. Stemphylium botryosum pathogenic on spinach seed crops in Washington. Plant Disease 85:920.
Duran, Y., R. Fratini, P. Garcia, and M.V Perez de la , 2004. An intersubspecific genetic map of
Lens. Theor Appl Genet 108:1265-1237.
Erskine, W. and A. Sarker. 1997. Lentil: the Bangladesh breakthrough. ICARDA Carvan No. 6.
50

Gortner, G., M. Nenno, K. Weising, D. Zink, W. Nagl, and G. Kahl.1998. Chromosomal localization and distribution of simple sequence repeats and the Arabidopsis-type telomere sequence in the genome of Cicer arietinum L. Chrom. Res. 6: 97–104.
Hamwieh, A., S. M. Udupa, W. Choumane, A. Sarker, F. Dreyer, C. Jung, and M.Baum. 2005. A
genetic linkage map of Lens sp. based on microsatellite and AFLP markers and the location of fusarium vascular wilt resistance. Theor Appl Genet 110:669-677.
Hashemi, P., A. Vandenberg and S. Banniza. 2005b. Developing a protocol for largescale
inoculation of lentil germplasms with Stemphylium botryosum. In Proceedings of Plant Canada 2005. Edmonton, AB, June 15-18. (Abstract)
ICARDA, 2004. Celebration as Bangladesh produces more lentil. Caravan 20/21:11-12. Jhorar, O.P., D.R. Butler, and S.S Mathauda. 1998. Effects of leaf wetness duration, relative
humidity, light and dark on infection and sporulation by Didymella rabiei on chickpea. Plant Pathol. 47: 586-594.
Kijas, J.M.H., J.C.S.Fowler, and M.R.Thomas.1995. An evaluation of sequence tagged
microsatellite site markers for genetic analysis within citrus and related species. Genome 38:349-355.
Kijas, J.M.H., J.C.S.Fowler, C.A.Garbett and M.R.Thomas.1994. Enrichment of microsatellites
from the citrus genome using biotinylated oligonucleotide sequences bound to streptavidin coated magnetic particles. Biotechniques 16:656-662.
Kosambi, D. 1944. The estimation of map distances from recombination values. Ann. Eugen.,
12, 172–175.
Kumar, P. 2007. Genetics of resistance to stemphylium leaf blight of lentil (Lens culinaris) in the cross Barimasur-4 × CDC Milestone. M.S. Thesis, University of Saskatchewan, Canada.
Lander, E. S., P. Green, J. Abrahamson, A. Barlow, M. J. Daly, S. E. Lincoln, and L. Newburg. 1987. MAPMAKER: An interactive computer package for constructing primary genetic linkage maps of experimental and natural populations. Genomics 1:174- 181.
Li, H., J-M. Ribaut, Z. Li, and J. Wang. 2008. Inclusive composite interval mapping (ICIM) for digenic epistasis of quantitative traits in biparental populations. Theor Appl Genet 116:243–260.
Netzer, D., D. Globerson, C. Weintal, and R. Elyassi. 1985. Sources and inheritance of resistance
to stemphylium leaf spot of lettuce. Euphytica 34: 393-396.
Rubeena, R. Ford, and P.W.J. Taylor. 2003. Construction of an intraspecifi c linkage map of lentil (Lens culinaris ssp. culinaris).Theor. Appl. Genet. 107: 910–916.
51
Tegelstrom H. 1992. Detection of mitochondrial DNA fragments. In: Hoelzel AR (ed) Molecular genetic analysis of populations: a practical approach. IRL Press, Oxford, pp 89–114.
Vandenberg, A., and R.A.A. Morrall. 2002. Pulse crop variety development strategies in
Saskatchewan. Saskatchewan Pulse Growers Pulse Days 2002, Saskatoon.
52
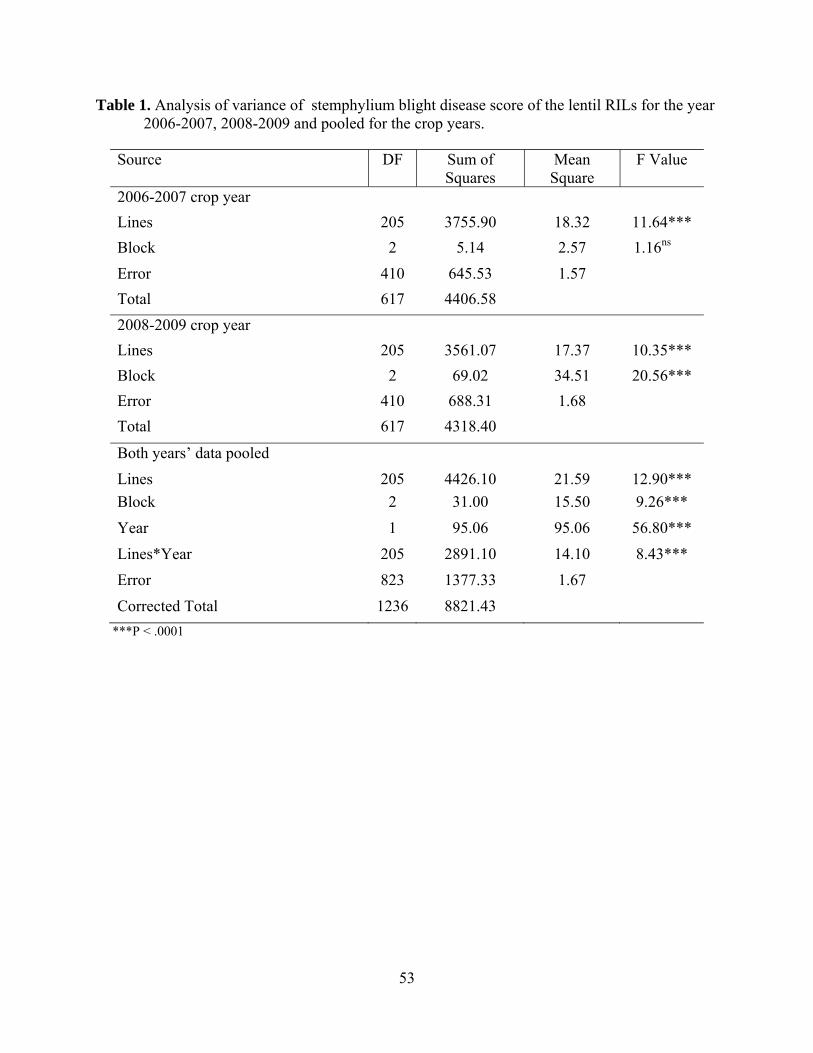
Table 1. Analysis of variance of stemphylium blight disease score of the lentil RILs for the year 2006-2007, 2008-2009 and pooled for the crop years.
***P < .0001
Source DF Sum of Squares
Mean Square
F Value
2006-2007 crop year Lines 205 3755.90 18.32 11.64*** Block 2 5.14 2.57 1.16ns Error 410 645.53 1.57 Total 617 4406.58 2008-2009 crop year Lines 205 3561.07 17.37 10.35*** Block 2 69.02 34.51 20.56*** Error 410 688.31 1.68 Total 617 4318.40
Both years’ data pooled Lines 205 4426.10 21.59 12.90*** Block 2 31.00 15.50 9.26*** Year 1 95.06 95.06 56.80*** Lines*Year 205 2891.10 14.10 8.43*** Error 823 1377.33 1.67 Corrected Total 1236 8821.43
53
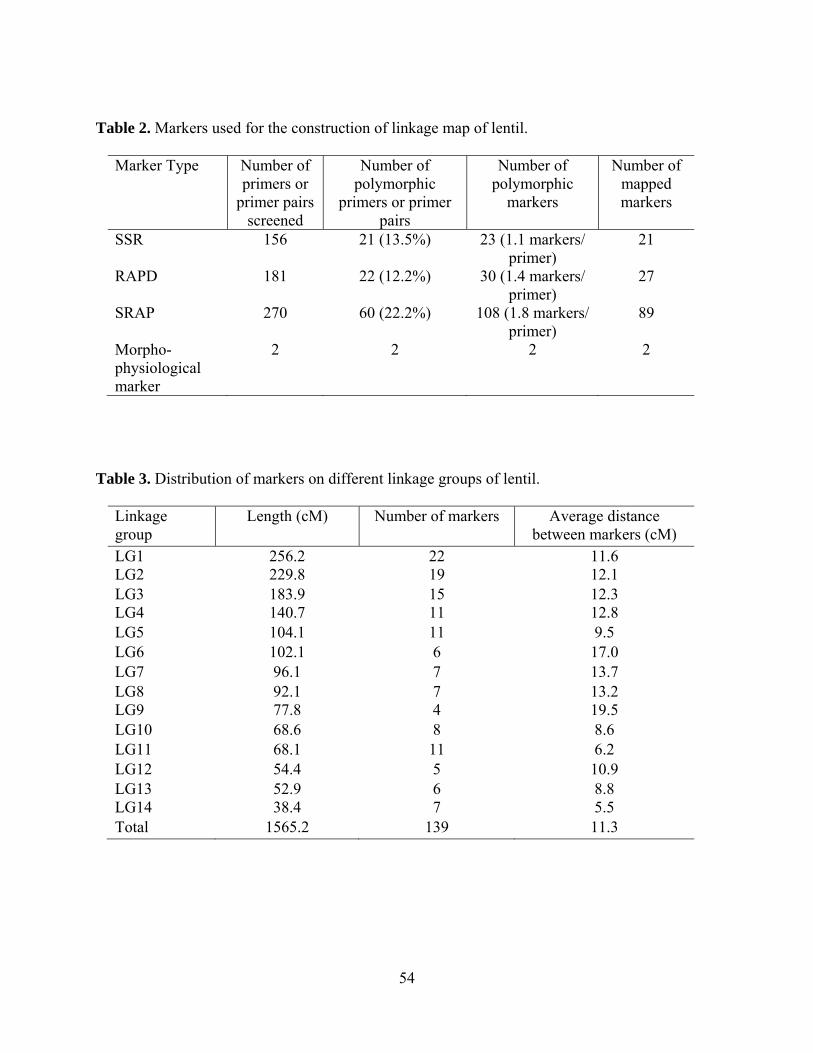
Table 2. Markers used for the construction of linkage map of lentil.
Marker Type Number of primers or
primer pairs screened
Number of polymorphic
primers or primer pairs
Number of polymorphic
markers
Number of mapped markers
SSR 156 21 (13.5%) 23 (1.1 markers/ primer)
21
RAPD 181 22 (12.2%) 30 (1.4 markers/ primer)
27
SRAP 270 60 (22.2%) 108 (1.8 markers/ primer)
89
Morpho-physiological marker
2 2 2 2
Table 3. Distribution of markers on different linkage groups of lentil.
Linkage group
Length (cM) Number of markers Average distance between markers (cM)
LG1 256.2 22 11.6 LG2 229.8 19 12.1 LG3 183.9 15 12.3 LG4 140.7 11 12.8 LG5 104.1 11 9.5 LG6 102.1 6 17.0 LG7 96.1 7 13.7 LG8 92.1 7 13.2 LG9 77.8 4 19.5 LG10 68.6 8 8.6 LG11 68.1 11 6.2 LG12 54.4 5 10.9 LG13 52.9 6 8.8 LG14 38.4 7 5.5 Total 1565.2 139 11.3
54

Table 4. QTLs with their additive effects and phenotypic variations.
Stemphylium blight disease in cropping years QTL EstAdd LOD PVE + (%) Stemphylium blight (2006-2007) QLG480 1.239 9.63 25.23
Stemphylium blight (2008-2009)
QLG249 0.595 3.21 6.35 QLG33 0.528 3.71 5.04 QLG481 1.603 25.4 45.96
+ phenotypic variation explained
Table 5. Epistatic effects, LOD value at the interaction point (LODA), epistatatic effect (LODAA) and phenotypic variance (PVE%) of different interacting QTL.
+ phenotypic variation explained
Interacting QTL Epistatic effects
LODA LODAA PVE + (%)
Stemphylium blight (2006-2007) QLG1190 x QLG1146 -0.886 3.37 3.20 12.78 QLG4124 x QLG1030 0.727 3.72 3.14 9.99 Stemphylium blight (2008-2009) QLG194 x QLG1138 0.439 3.48 3.30 3.58 QLG1206 x QLG316 -0.465 6.61 3.13 8.08 QLG1208 x QLG318 -0.487 6.18 3.15 7.74 QLG1210 x QLG320 -0.486 5.71 3.12 6.98 QLG1212 x QLG324 -0.495 3.68 3.57 4.33 QLG2202 x QLG3104 0.650 2.64 2.50 10.25 QLG4140 x QLG5104 -0.585 6.88 6.57 6.33 QLG5104 x QLG96 0.469 3.21 3.03 4.16 QLG834 x QLG936 0.555 4.71 4.51 5.68 QLG834 x QLG946 0.497 4.02 3.81 4.59 QLG920 x QLG930 -1.074 3.63 3.35 9.67
55
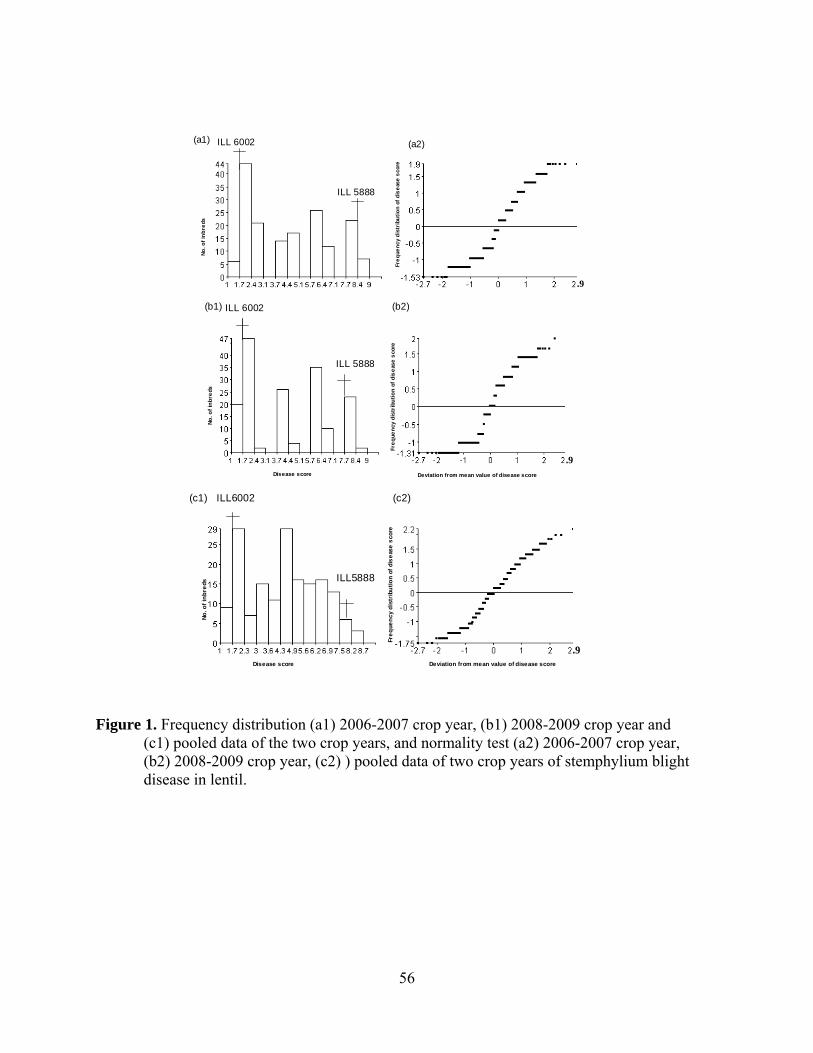
ILL 6002
ILL 5888
Disease score
No. o
f inb
reds
(a1)
.9Deviation from mean value of disease score
(a2)
Freq
uenc
y di
stri
butio
n of
dis
ease
sco
re
56
ILL 6002
Disease score
No. o
f inb
reds
ILL6002
ILL5888
(c1)
Deviation from mean value of disease score
Freq
uenc
y di
stri
butio
n of
dis
ease
sco
re
(c2)
.9
ILL 5888
Disease score
No. o
f inb
reds
(b1)
Deviation from mean value of disease score
Freq
uenc
y di
stri
butio
n of
dis
ease
sco
re
(b2)
.9
Figure 1. Frequency distribution (a1) 2006-2007 crop year, (b1) 2008-2009 crop year and (c1) pooled data of the two crop years, and normality test (a2) 2006-2007 crop year, (b2) 2008-2009 crop year, (c2) ) pooled data of two crop years of stemphylium blight disease in lentil.

LG2LG1 LG3
LG8
LG4 LG5 LG6
LG7 LG9 LG10 LG11 LG12
LG13 LG14
Figure 2. Intraspecific linkage map of lentil at a LOD score of 4.0 and at maximum
recombination fraction 0.25. The linkage groups are named (LG1-LG14). Loci names are indicated on the right side and genetic distances are on the left side of the vertical bar. SSR markers are named as SSR or GLLC-SSR, RAPDs are UBC and SRAP are F or ME as forward and R or EM as reverse primer.
57

LOD
LOD
LOD
Add(LOD)=1.239
Epi(LODAA)=0.727
Epi(LODAA)=-0.886
(a)
(b)
Figure 3. Contour profile showing (a) additive effects: Add(LOD) and (b) interaction effect, epistatic effect: Epi(LODAA) for the 2006-2007 crop year.
58

LOD
LOD
LOD
Add(LOD)=1.603
Add(LOD)=0.595
Epi(LODAA)=-1.074
Epi(LODAA)=-0.585
Epi(LODAA)=0.650
AddxEpi(LODA)=-0.465
(a)
(b)
Add(LOD)=0.528
Figure 4. Contour profile showing (a) additive effects: Add(LOD), and (b) Interaction effect,
epistatic effects: Epi(LODAA) and combined additive-epistatic effects: AddxEpi(LODA) for the 2008-2009 crop year.
59

GLLC
556
UBC
36U
BC7b
UBC
34U
BC1
UBC
119
UBC
38c
ME1XE
M6b
ME4XR
16cM
E5XR10
UBC
7a
LOD
LG4
Figure 5. QTL and associated markers that conferred resistance to stemphylium blight for the
crop year 2006-2007.
GLLC
556
UB
C36
UBC
7b
UBC
34U
BC1
UB
C119
UBC
38c
ME
1XE
M6b
ME
4XR16c
ME
5XR10
UBC
7aLO
D
LG4
Figure 6. QTL and associated markers confer resistance to stemphylium blight for the crop year
2008-2009.
60

CHAPTER TWO
IDENTIFICATION OF MARKERS ASSOCIATED WITH GENES FOR RUST
RESISTANCE IN Lens culinaris Medik.
61

ABSTRACT
Lentil rust caused by Uromyces vicia-fabae (Pers.) Schroet is one of the most important
diseases of lentil in South Asia, North Africa and East Africa. This disease is usually observed
during late flowering and early podding stages. Early infection accompanied by favorable
environmental conditions can result in complete crop failure and huge economic losses. The
losses impact human nutrition by reducing the availability of a major protein source in
developing countries. Yield losses of 30 to 70% have been reported in some years in research
plots. Therefore, breeding for resistance against this pathogen is one of the major challenges for
the breeders in those regions. It is important to identify resistance sources and to determine the
location of the genes for resistance in the lentil genome. Since field screening is often difficult
due to the unpredictable nature of the disease, selectable molecular markers can be useful tools to
assist lentil breeding and complement field screening and selection for resistance. To map the
genes for resistance, a recombinant inbred line (RILs) population composed of 220 RILs was
developed from a cross between a rust resistant line, ILL-4605, and a susceptible line from
Bangladesh, ILL-5888. Phenotyping of the RIL population was carried out during 2006-2007
and 2008-2009 cropping seasons at the Pulse Research Center, Ishurdi, Bangladesh. There was a
lack of uniformity of disease pressure in the 2006-2007 cropping year causing inconsistencies
between replicates. Nevertheless, we were able to choose clearly resistant and clearly susceptible
RILs for selective genotyping using markers previously placed on our lentil genetic map. One of
the 62 markers used for selective genotyping proved to be linked to the gene for resistance. The
identified sequence related amplified polymorphism (SRAP) marker, F7XEM4a, was estimated
to be 7.9cm from the gene for resistance. The F7XEM4a marker could be used for marker
assisted selection for resistance; however, additional markers closer to the resistance gene are
62

needed. Also, definitive placement of the resistance gene on the lentil genetic linkage map will
require additional mapping using markers transferable from existing lentil linkage maps.
Key words: Rust, Selective genotyping, Linkage, Marker assisted selection.
INTRODUCTION
Lentil rust caused by Uromyces vicia-fabae (Pers.) Schroet, an obligate biotrophic fungal
pathogen that infects a narrow range of living plant hosts and causes substantial yield losses
annually in Bangladesh, India, Ethiopia, Morocco and Pakistan. Erskine and Sarker (1997) report
that lentil rust causes up to 70% yield loss, although occasional complete crop losses were
observed in epidemic years. The disease appears during the flowering and early podding stages
in areas with dense crop canopies. In severe infections the leaves are shed and plants dry
prematurely without producing seed or by having shriveled seed.
Lentil seed contaminated with pieces of rust infected debris with teliospores or infested
grasses that surrounding fields appear to be sources of primary infection (Khare 1981, Agrawal
et al., 1993). The amount of primary inoculum and the degree of buildup of secondary inoculum
are important for disease development and severity. In some years, low disease severity was
observed due to an environment unfavorable for inoculum growth. Yellow– white pycnidia and
aecial cups develop on the lower surface of the leaflet and on pods singly or groups of circular
forms. From the aceial cup, aceciospores germinate at 17-22°C and infect plants followed by the
formation of secondary aecia or uredia when temperatures increase to about 25°C. Brown uredial
pustules circular or oval shaped and 1mm in diameter develop on either surface of the leaves,
stems or pods and later coalesce to form larger pustules. Late in the season, dark brown to black
63

telia develop on the stems and branches and the teliospore can survive at higher temperatures in
summer and on dried lentil trash and become a source of infection the following cropping
season.
For host colonization, rust requires the induction of a subset of fungal genes essential for
infection. The infection mechanisms are sophisticated, and include the ability to detect stomata,
the entry portal for many rust fungi, and to suppress host resistance responses. Genes of the plant
host are also induced in response to infection, but the role and expression of the host gene is
difficult to dissect because molecular tools such as a protocol for transformation and sequenced
genomes are lacking for the rusts (Ayliffe, 2002).
Singh and Sokhi (1980) identified six pathotype s of rust on the basis of their differential
reactions on different cutivars of lentil, pea and sweet pea. Singh et al. (1995) reported five races,
and Conner and Berrier (1982b) detected 11 races of U. viciae-fabae. Conner and Berrier,
(1982b) speculated that Vicia, Lathyrus and Pisum could be important sources of inoculum and
perhaps pathogenic variants due to race specific resistance and selection pressure on the
pathogen.
Most studies on genetics of rust resistance in lentil have revealed that resistance is
monogenic and dominant (Sinha and Yadav, 1989; Singh and Singh, 1992). Kumar et al. (1997)
reported that resistance to Uromyces fabae in five lentil genotypes (L 2991, L 2981, L 1534, L
178 and HPLC 8868) was governed by a single dominant gene; whereas in one genotype,
Precoz, it was conditioned by two dominant genes. Chahota et al. (2002) reported that resistance
to rust is controlled by duplicate, non-allelic and non linked dominant genes. Although a
breakdown of rust resistance in lentil has not been reported, the likelihood of such an event in
varieties with monogenic resistance cannot be ruled out (Negussiee et al. 2005). The objective of
64

this study was to determine the genetics of rust resistance in lentil, to locate the resistance genes
on the lentil genetic linkage map, and to identify molecular markers that can be used in marker
assisted selection for resistance.
MATERIALS AND METHODS
a) Recombinant inbred line development
A population of 220 recombinant inbred lines (RILs) was developed from a cross
between a rust resistant line, ILL-4605 from ICARDA, and a susceptible line, ILL-5888, from
Bangladesh. Initially, F1 seeds were planted in pots to produce F2 seeds which were then planted
in flats (51cm X 36cm X 9cm) and advanced to F7 by single seed descent. Plants were grown
with a sandy loam soil mixed in equal proportions with an organic potting mix on a greenhouse
bench using a controlled temperature (22°C day and 15°C night), humidity 25-30% and a 17
hour day length. The F7 RILs were planted at Spillman Agronomy Farm of Washington State
University, near Pullman for seed increase. 206 RILs produced a sufficient amount of seeds for
phenotyping for rust resistance in Bangladesh at the Pulse research station, Ishurdi, Bangladesh
in the 2006- 2007 and 2008-2009 cropping seasons.
b) Phenotyping
The RILs were scored for disease reaction according to qualitative and quantitative scale.
The qualitative scale had two distinct classes, resistant and susceptible whereas the quantitative
scale developed by Chen (2007) had 1-9 scale, whereby 1 = 0-10% leaf area infected, 3 = 11-
30% leaf area infected, 5 = 31-50% leaf area infected, 7 = 51-70% leaf area infected, 9 = More
than 70% leaf area infected. The F7 derived RILs were planted in high Ganges river flood plain
calcareous soil at the Pulse Research Station (PRC) , Ishurdi, Bangladesh for phenotyping in
65

2006-2007 and 2008-2009 crop years using a randomized complete block design with three
replications. The individual plots were single rows 1m long and spaced 40cm apart.
c) Markers in identifying putative genes
Six types markers; 16 gene specific markers (EFGC, CysPr1, CTP, 6DCS, UDPGD,
CYB6, tRALS, Histone, ATPsynth, Trypinhi, Vicillin, RGA (Resistance Gene Analogs), Lectin,
RGA23Q1, isoflasynth1), 156 lentil SSRs (Simple Sequence Repeats) (ICARDA SSRs and
GLLC SSRs), 14 pea SSRs (PSMPs), 14 CAPS (Cleaved Amplified Polymorphic Sequence) and
dCAPS (Derived Cleaved Amplified Polymorphic Sequence) PCR based RFLP (Restriction
Fragment Length Polymorphism) markers (C3, C6, C41, C65, C71, E8, E14, E25, E29, E30,
E,31, P14, P57 and P68), 181 RAPD (Random Amplified Polymorphic DNA) and 270 SRAP
markers were used to determine polymorphism between parents.
d) Selective genotyping
RILs with clear resistant and susceptible reactions were chosen and genotyped using
markers that were polymorphic between the parents. Markers that were clearly associated with
resistance in the selective genotyping experiment were used to genotype 196 RILs. The marker
segregation between RILs and qualitatively phenotyped disease data were analyzed by chi-
square for goodness of fit to the 1:1 expected Mendelian segregation ratio. Linkage between the
putative markers and the putative resistance gene was estimated using Mapmaker Macintosh
V2.0 (Lander et al., 1987).
RESULTS AND DISCUSSION
Phenotyping of the RILs in the 2006-2007 crop year disease using quantitative scale
showed non-significant variation and block effect was also non-significant (Table 1). Some of
66
the lines escaped infection resulting in inconsistencies in disease score among replicates and the
variation among RILs were not detected due to the average effect of the replicates.
Some of the RILs had consistent disease scores among replicates in the 2006-2007 season
and those lines were used for selective genotyping to identify markers associated with putative
genes for rust resistance. RILs 20, 33, 85, 153, 183, and 188 showed consistent disease reaction
across replicates and were similar to the resistant parent, while RILs 51, 61, 92,125,174, 187
showed a consistent susceptible reaction similar to the susceptible parent. The experiment was
repeated in 2008-2009 growing season at the same spot at the Pulse Research Center, Ishurdi,
Bangladesh, but disease was not wide spread and only a few plants were infected; however, RIL
51, 92 and 187 had disease symptoms but the remaining RILs were free of the disease. Since
Uromyces fabae is an obligate biotroph, it was speculated that the inoculum was not available in
near proximity and inoculum build up was not sufficient to cause wide spread disease.
Teliospores in the seed sample mixed with debris might be the cause of disease in 51, 92 and 187
inbred lines.
Six types of markers were used in finding polymorphism between parents. The gene
specific markers and RFLPs did not show polymorphism between the parents. Pea SSRs showed
the highest number of polymorphism (64%) followed by lentil SSRs (17.3%), SRAP (14.8%)
and RAPD (12%) respectively (Table 2). RAPD and SRAP markers were used to identify
putative markers and SSRs were used as anchor markers with previously reported lentil linkage
maps.
Six consistent resistant and susceptible RILs described previously segregated clearly for
the presence or absence of bands, respectively, for marker F7XEM4a. This marker, F7XEM4a is
considered as putative marker for the rust disease resistance gene (Fig.1).
67

After selective genotyping and the identification of F7XEM4a as a possible marker
linked to the rust resistance gene, a qualitative assessment of 2006-2007 disease score of the
RILs was used to determine the linkage map location of the rust resistance gene. RILs were
scored qualitatively as susceptible based on presence of disease in at least one replicate and
resistant if there was no disease in any of the replicates. The justification for this scoring
procedure was the likelihood of escape from the disease due to uneven inoculum dispersal.
The 196 RILs segregated in the expected 1:1 ratio (93:103) of presence: absence of the
F7XEM4a marker (χ2=0.51*). The RILs segregated in the expected 1:1 ratio (104:92) for rust
scores (χ2=0.73*) (Table 3). The ratio of resistant to susceptible lines is consistent with reports of
monogenic control of resistance reported by Negussiee et al. (2005). The linkage analysis
between the marker and rust resistance showed that rust resistance gene is located 7.9cM from
the F7XEM4a marker (Fig. 2). All resistant RILs had bands at the 600bp region; however, 11
resistant RILs did not have the marker. These latter RILs may actually be susceptible but
escaped disease infection in all replicates and were scored as resistant. Additional phenotyping
under a more complete rust infection is needed to verify the scoring of the RILs for infection.
The F7XEM4a marker is located on our linkage group 3 (Ref. Chapter1) with adjacent and
flanking markers F12XR14b and UBC9a. These latter markers were not polymorphic in the rust
mapping population.
The F7XEM4a marker may be useful in a marker assisted selection program to facilitate
breeding for resistance to rust. However, additional markers in the vicinity of F7XEM4a are
needed to confirm the position on the lentil linkage map and to provide additional markers closer
to the resistance gene for use in breeding. Confirmation of the F7XEM4a marker for resistance
68

breeding is needed as well as additional phenotypic data to confirm these results. Placement of
the rust resistance gene on a composite linkage map of lentil is also needed.
CONCLUSION
Selective genotyping identified a SRAP marker, F7XEM4a, closely linked to a gene for
rust resistance. The marker is located 7.9cM from the resistance gene on our linkage group 3.
This marker could be utilized for marker assisted breeding. The linkage map, specifically linkage
group 3, should be saturated with co-dominant markers to identify additional markers more
closely linked to the gene for resistance. Markers used in other linkage studies of lentil that are
polymorphic in our population are possibly a good source of potential markers. Markers
identified through selective genotyping will be considered as putative markers and used to
increase marker density in the region of the resistance gene. The F7XEM4a SRAP marker can be
used for marker assisted selection in a breeding program provided that the breeding populations
segregate concurrently for resistance and the marker. Also, increased marker density in the
region of the resistance gene will provide additional marker choices for use in a wide range of
lentil crosses.
Acknowledgements: This work was supported by USAID-ICARDA linkage project. We are
indebted to Sheri Rynearson, Tony Chen and Tracie Anderson for laboratory support and the
Director of Pulse Research Center, Ishurdi, Bangladesh for setting up field experiment in their
station.
REFERENCES
Ayliffe, M.A., J.K. Roberts, H.J. Mitchell, R. Zhang, G.J. Lawrence, J.G. Ellis, and J.P. Tony. 2002. A plant gene up-regulated at rust infection sites .Plant Physiology 129: 1–12.
69

Chahota, P.K., V.P. Gupta and S.K. Sharma. 2002. Inheritance of rust resistance in lentil. Indian
J Genet Plant Breeding 62: 226-227.
Conner, R.L., and C.C. Bernier. 1982. Race identification of in Uromyces vicia-fabae. Phytopathology 72: 687-689.
Erskine, W., and A. Sarker. 1997. Lentil: the Bangladesh breakthrough. ICARDA
Carvan No. 6. Khare, M.N., B. Bayaa and S.P.S. Beniwal. 1993. Selection methods for disease resistance in
lentil. In: K.B. Singh and M.C. Saxena (Eds.), Breeding for Stress Tolerance in Cool-Season Food Legumes.Wiley, Chichester, U.K. 107-121.
Kumar, V., B.M. Singh and S. Singh. 1997. Genetics of lentil resistance to rust. Lens Newsl
24(1/2):23-25.
Lander, E. S., P. Green, J. Abrahamson, A. Barlow, M. J. Daly, S. E. Lincoln, and L. Newburg. 1987. MAPMAKER: An interactive computer package for constructing primary genetic linkage maps of experimental and natural populations. Genomics 1:174- 181.
Negussie, T., Z.A. Pretorius, and C.M. Bender. 2005. Component of rust resistance in lentil. Euphytica 142: 55-64.
Sarker, A., R.S. Malhotra, S. Khalil, and W. Erskine. 2002. Food legume improvement at
ICARDA, ICARDA Annual Report, Aleppo, Syria.
Singh, K., H.S. Rawal, S. Singh, and R.K. Gumber. 1995. Physiological specialization in Uromyces fabae causing rust of lentil. Lens Newsl 22: 46-47.
Singh, J.P., and I.S. Singh. 1992. Genetics of rust resistance in lentil (Lens Culinaris). Indian J
Agric Sci 62:337-338.
Singh, K., and T.S. Sandhu. 1988. Screening of cultivars of lentil for resistance to rust. Lens Newsl 15:28-29.
Singh, S.J., and S.S. Sokhi. 1980. Pathogenic variability in Uromyces viciae-fabae. Plant Dis 64:
671-672.
Sinha, R.P., and B.P. Yadav.1989. Inheritance of resistance to rust in lentil. Lens Newsl 16: 41.
70
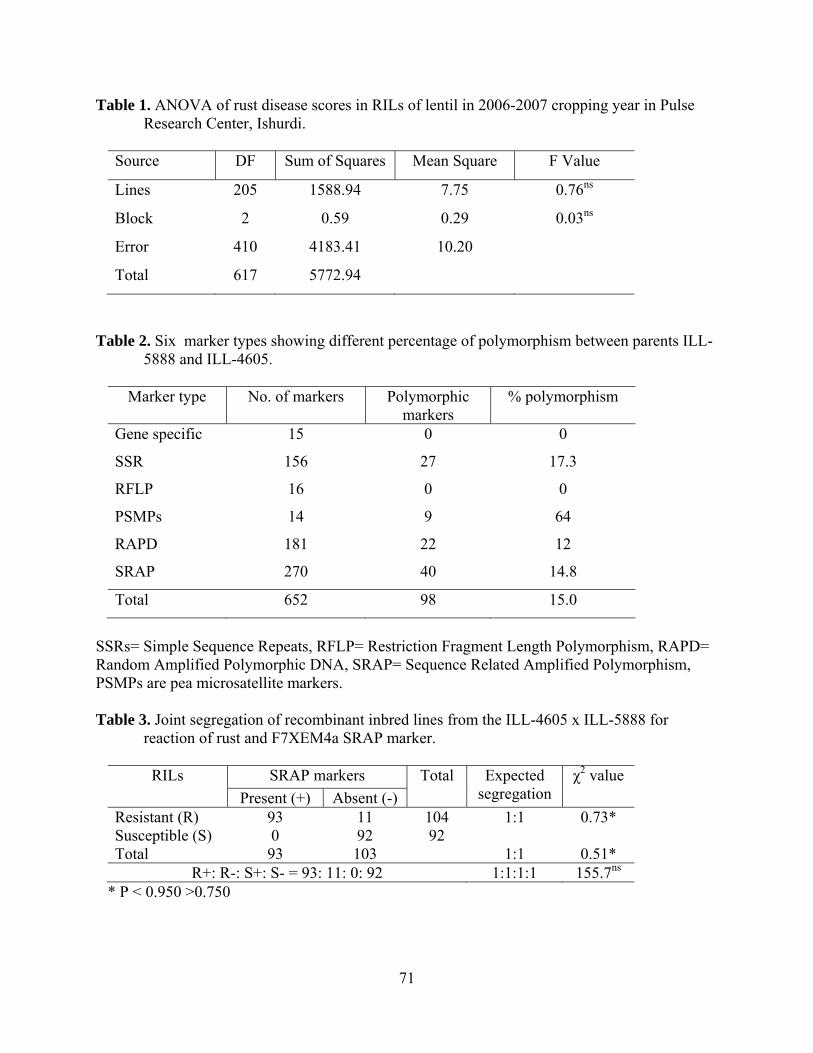
Table 1. ANOVA of rust disease scores in RILs of lentil in 2006-2007 cropping year in Pulse Research Center, Ishurdi.
Source DF Sum of Squares Mean Square F Value
Lines 205 1588.94 7.75 0.76ns
Block 2 0.59 0.29 0.03ns
Error 410 4183.41 10.20
Total 617 5772.94
Table 2. Six marker types showing different percentage of polymorphism between parents ILL-
5888 and ILL-4605.
Marker type No. of markers Polymorphic markers
% polymorphism
Gene specific 15 0 0
SSR 156 27 17.3
RFLP 16 0 0
PSMPs 14 9 64
RAPD 181 22 12
SRAP 270 40 14.8
Total 652 98 15.0
SSRs= Simple Sequence Repeats, RFLP= Restriction Fragment Length Polymorphism, RAPD= Random Amplified Polymorphic DNA, SRAP= Sequence Related Amplified Polymorphism, PSMPs are pea microsatellite markers. Table 3. Joint segregation of recombinant inbred lines from the ILL-4605 x ILL-5888 for
reaction of rust and F7XEM4a SRAP marker.
RILs SRAP markers Total Expected segregation
χ2 value Present (+) Absent (-)
Resistant (R) 93 11 104 1:1 0.73* Susceptible (S) 0 92 92 Total 93 103 1:1 0.51*
R+: R-: S+: S- = 93: 11: 0: 92 1:1:1:1 155.7ns * P < 0.950 >0.750
71

ILL5
888
ILL4
605
LRIL
21-2
0
LRIL
21-8
5
LRIL
21-1
53
LRIL
21-3
3
LRIL
21-1
83
LRIL
21-1
88
LRIL
21-5
1
LRIL
21-6
1
LRIL
21-9
2
LRIL
21-1
25
LRIL
21-1
74
LRIL
21-1
87
DN
A L
adde
r
600bp
Resistant lines (R) Susceptible l ines ( S)
(S P
aren
t)
(R P
aren
t)
R= Resistant
S= Susceptible
Figure 1. Selective genotyping for identifying putative markers linked to rust resistance. Marker
F7XEM4a, (indicated by the arrow at 600bp) is present in the resistant parent and also in the resistant RILs of the (ILL-5888 x ILL-6002).
LG3
7.9cM
Figure 2. Location of rust resistance genes in lentil in linkage group 3.
72

CHAPTER THREE
INHERITANCE AND LINKAGE MAP POSITIONS OF GENES CONFERRING AGRO-MORPHOLOGICAL TRAITS IN Lens culinaris Medik.
73

ABSTRACT
Lentil (Lens culinaris Medikus subsp. culinaris) is an important legume crop and an
important source of dietary protein in human diets and animal feed. Agro-morphological traits
have immense importance in breeding lentils for higher yield and yield stability. In order to
identify and map the genes for stemphylium blight (caused by Stemphylium botryosum Wallr.)
resistance, an F6 derived F7 RIL population composed of 206 lines was developed by crossing
ILL-5888 (Uthfola cultivar name and described as a pilosae type) and ILL-6002 (pure line
selection from ‘Precoz’). The parents contrasted for agro-morphological traits including days to
flowering, plant height, seed diameter, 100 seed weight, and cotyledon color and growth habit.
Three QTLs for days to flowering were detected with additive and epistatic effects on the trait.
One QTL for days to flowering, QLG483, accounted for an estimated 20.2% of the phenotypic
variation, while QLG124 x QLG1352 and QLG484 x QLG138 accounted for 15.6% and 24.2% of
the variation through additive and epistatic effects. For plant height, epistatic effects accounted
for most of the phenotypic variation but the main effect of one QTL, QLG84, accounted for
15.3% of the phenotypic variation. For seed diameter, three QTLs were detected and one QTL,
QLG482, accounted for 32.6% of the phenotypic variation through additive effects. For 100 seed
weight, five QTLs were identified with significant additive effects and four with significant
interaction effects. The main effect of one QTL, QLG482, also accounted for 17.5% of the
phenotypic variation in seed diameter. Therefore, the QTL region at the 82-83cM position of
linkage group 4 (QLG482-83) accommodates three QTLs accounting for 20.2%, 32.6% and 17.5%
of the phenotypic variation for days to flowering, seed diameter and 100 seed weight,
respectively. In addition, these traits are correlated (r values of days to flowering with seed
diameter and 100 seed weight are 0.393 and 0.411, respectively, seed diameter with 100 seed
74

weight is 0.884). The gene rich QTL region (QLG482-83) was flanked by two random amplified
polymorphic DNA (RAPD) markers UBC 34 and UBC1 at 0.4-1.4 and 1.6-2.6cM, respectively.
Further, growth habit and cotyledon color are controlled by single genes and prostrate is
dominant to erect plant type and red cotyledon was dominant to yellow cotyledon. The QTL
information presented here will assist in the selection of breeding lines for early maturity, upright
growth habit and improved seed quality.
Key words: Agromorphological traits, epistasis, additive effect, QTL analysis
INTRODUCTION
Agro-morphological traits have immense importance in crop breeding. Crop adaptation,
field performance, market value and demands for specific uses are major factors that drive
breeding goals. Linkage maps and QTL analysis are valuable tools for plant breeders to improve
breeding efficiency by tagging genes with markers and analyzing the association between
markers and traits. The inheritance of quantitative traits and tagging genes such as days to
flowering, plant height, seed diameter and seed weight, and qualitative trait genes such as growth
habit and cotyledon color in lentil (Lens culinaris Medikus subsp. culinaris) will help breeders in
the selection process and understanding interrelationships among traits.
Lentil is quantitative long day plant flowering in progressively longer days (Roberts, et
al.1986). It is often hard to determine days to maturity at or near the end of a crop season due to
weather conditions. In the Canadian prairies, one of the important breeding goals is to develop
varieties that flower within an optimum period of time to provide improved and stable seed
production (Tullu et al. 2008). It has been reported that soybean (Glycine max) breeders select
lines for optimum maturity based on days to flowering (Tulmann and Alves, 1997). Sarker et al.
75

(1999) reported that flowering time is sensitive to photoperiod and temperature and that a more
complete understanding of genetic control of flowering time in lentil is needed. Roberts et al.
(1986) proposed four developmental phases of flowering as: pre-emergence, pre-inductive,
inductive and post-inductive. When lentil plants were transferred from short days (either 8 or 10
h) to long days (16 h), or vice versa, the first two phases and the last are insensitive to
photoperiod, but are probably sensitive to temperature. So, it is evident that a complex
phenomenon controls the days to flowering in lentil.
Plant height of lentil usually ranges from 25 to 30cm for the majority of genotypes, but
may vary from extremes of 15 to 75cm depending on genotype and environment (Saxena and
Hawtins, 1981). Most lentils grown in South Asia, Middle East and Africa are land races. These
are generally short in plant stature, prostrate in growth habit, lack uniformity in pod maturation,
have a high incidence of pod shattering and are low yielding. Tall upright lentil cultivars with
high basal pod positions are always preferred by farmers for mechanical harvesting (Muehlbauer,
1981). Sakar (1983) reported three genes were responsible for variation in plant height from the
cross of the two lentil cultivars, Laird and Precoz. Tullu et al. (2008) reported that both ‘Eston’
and PI 320937 have genes that contribute to reduced plant height in lentil. QTL for plant height
detected from the data of one geographical location was different from the QTLs of another
location, though there was non-significant genotype x location interaction. They concluded that
more powerful statistical methods are required for the detection of minor QTLs.
Growth habit has received a great deal of attention from breeders attempting to develop
cultivars with more upright stature that are also lodging resistant and adaptable to mechanized
harvest. Ladizinsky (1979) indicated that a single gene with incomplete dominance controls
growth habit in lentil.
76

Uniformity of seed size, shape and color is important for marketing of lentil. A wide
range of lentil cultivars are used throughout the world. Small diameter red cotyledon types
accounts for most of the lentil production followed by the large-seeded and small-seeded yellow
cotyledon types. Lentil seeds are lens shaped and generally weigh between 20 and 80 mg. Their
diameter generally ranges from 2 to 9 mm. Seed size differs according to genotype and
researchers frequently follow the classification of Barulina (1930) who grouped lentils as
macrosperma with large seeds that range from 6 to 9mm diameter, and microsperma with smaller
seeds that range from 2 to 6mm in diameter. The macrosperma types are common to the
Mediterranean basin and in the western hemisphere, while the microsperma predominate through
the Indian subcontinent and in parts of the Near East (Saxena and Hawtin, 1981). It has been
reported that dry seed wt of lentil is controlled by two genes (Sakar, 1983); whereas polygenic
control of seed weight was reported by Abbo et al. (1992). Cotyledon color of lentil can be
red/orange, yellow or green. Large green lentils with yellow cotyledons are marketed to
countries of southern Europe, particularly Spain, Italy and Greece and small red cotyledon type
is exported to South Asia and the Middle East (Muehlbauer et al. 2009). The first report of
genetics of lentil cotyledon color were studied by Tschermak (1928) and by Wilson et al. (1970)
and confirmed that cotyledon color is controlled by a single gene and red/yellow cotyledon is
dominant over yellow. Singh (1978) and Slinkard (1978) reported that red cotyledon color is
completely dominant over green and yellow. Sharma and Emami (2002) detected monogenic and
digenic control of cotyledon coloration in lentil. In their study they discovered that crosses
between orange and green cotyledon parents showed monogenic segregation with complete
dominance of orange over green pigment but digenic segregation was observed between light
green and dark green cotyledon. Double recessive homozygous condition (yy bb) is responsible
77

for light green coloration and the presence of the Dg gene causes dark green coloration
irrespective of homozygous dominant or recessive Y or B genes.
The objectives of the present study were to identify regions of the lentil genome
associated with agro-morphological traits including days to flowering, plant height, growth habit,
seed diameter, seed weight and cotyledon color that could be utilized in marker assisted breeding
and to improve our understanding of the genetics of these traits.
MATERIALS AND METHODS
Development of inbred lines:
In order to identify and map the agro-morphological trait genes, a lentil mapping
population [F6 derived F7 recombinant inbred lines (RILs)] that was previously developed to
determine the genomic locations of the genes for stemphylium blight (caused by Stemphylium
botryosum Wallr.) resistance were used. The mapping population is comprised of 206 RILs from
the cross ILL-5888 (‘Uthfola’ the popular name and described as a pilosae type, short stature
with prostrate growth habit) by ILL-6002 (developed as a pure line selection from Precoz, tall
and erect in growth habit). These parents were contrasting for the agro-morphological traits
(quantitative and qualitative traits) under study.
Phenotyping:
The parents and the mapping population of 206 RILs were grown at the Washington State
University Spillman Agronomy Farm near Pullman, Washington (46º73' N latitude and 117º73'
W longitude) in the 2008 cropping year and at Ishurdi, Bangladesh (24º8' N latitude 92º5 ' E
longitude) in the 2008-2009 cropping year. Soil at the Spillman Farm is a silt loam and the soil at
Ishurdi, Bangladesh is a high Ganges river flood plain calcareous soil. The experimental design
78

was a Randomized Complete Block with three replications. Individual plots were single rows 1
meter long and spaced 60cm apart and within row plant spacing of approximately 3cm.
Flowering was recorded as number of days from planting to 50% of the plants in the plot with at
least one open flower. Plant height was taken at the 50% flowering stage and measured from the
soil surface to the tip of the central axis. Seed diameter was measured by using a sliding calipers
and 100 seed weight was taken using a Mettler digital balance. Growth habit data were taken
based on plant canopy spreading and cotyledon color was determined visually. All the qualitative
and quantitative trait data taken in the Spillman farm were used for statistical analysis. The
analysis of variance (ANOVA) of the quantitative traits was done using SAS 9.1.
Genotyping, Linkage analysis and QTL mapping:
DNA extraction and genotyping were performed following protocols described in chapter
1. Mapmaker Macintosh V2.0 was used for linkage analysis and QTL analysis for quantitative
traits were conducted following inclusive composite interval mapping (ICIM) method with the
following software, QTL ICIMapping v2.2 (Li et al., 2008) and Q gene 4.2.3.(Nelson, 1997).
RESULTS AND DISCUSSION
The agro-morphological data of two parents (ILL-5888 and ILL-6002) and 206 RILs
were collected at Spillman Agronomy Farm near Pullman in 2008 cropping year and in 2008-
2009 at Ishurdi, Bangladesh. It is observed that environment played a major role in flowering at
the two test locations. Out of 206 RILs, 44 did not flower at the Ishurdi, Bangladesh; whereas all
the RILs flowered at Pullman, WA. Parents and RILs also showed significant differences in
flowering time between the two locations (data not shown). The ANOVA showed highly
significant differences between the parents and among RILs for the four quantitative traits
79
analyzed (Table 1). Highly significant (P<0.001) correlations exist between seed diameter and
100 seed weight, and days to flowering and seed diameter and 100 seed weight (Table 2). Plant
height was highly significantly correlated with 100 seed weight (P<0.001) and significantly
correlated with days to flowering and seed diameter (P<0.05).
To map the genes, an intra-specific lentil map of 14 linkage groups consisted of 23 SSRs
(Simple Sequence Repeats), 30 RAPDs and 108 SRAPs (Sequence Related Amplified
Polymorphisms) and two morpho-physiological markers (cotyledon color and growth habit) were
developed (Ref. Chapter 1). The QTLs and epistatic interactions were identified in different
linkage groups, but one of the QTL, QLG482-83 accounted significant phenotypic variation for
days to flowering, seed diameter and 100 seed weight.
I. Qualitative trait loci
a) Cotyledon color:
ILL-5888 and ILL-6002 have red and yellow cotyledon color, respectively. The RILs
segregated into a 1:1 ratio of red to yellow (Table-3). The clear 1:1 segregation ratio of the RILs
was consistent with reports of the inheritance of cotyledon color by Tschermak (1928) and
Wilson et al. (1970) i.e. cotyledon color is controlled by a single gene. In F1, all the seeds were
red and the F2 segregated in a 3:1 ratio of red to yellow (99:32), indicating that red cotyledon is
completely dominant over yellow cotyledon.
Singh (1978) and Slinkard (1978) also reported that red cotyledon color is completely
dominant over green and yellow. The cotyledon color gene (Yc) was positioned on LG8 and
flanked by RAPD marker UBC40b and SSR marker GLLC511a at 16.4cM and 13cM from Yc,
respectively (Fig. 1a).
80

b) Growth habit:
ILL-5888 is a prostrate variety while ILL-6002 has an erect growth habit. The RILs
segregated in a 1:1 ratio (Table 3). Based on segregation of the RILs, it can be inferred that a
single gene controls plant growth habit in this population. The F1s (ILL-5888 x ILL-6002) had a
prostrate growth habit indicating that prostrate is dominant over erect. The gene for growth habit
(Gh) is positioned on LG9 at the 77.8cM position and 35.1cM apart from the F18XR9b SRAP
marker, which is considered as loosely linked with the gene (Fig. 1b).
Ladizinsky (1979) made crosses within and between lines of L. culinaris and L.
orientalis that differed for growth habit: erect tall with few branches, erect bushy with many
branches, and prostrate. He reported that prostrate growth habit was incompletely dominant over
erect growth habit. Emami and Sharma (1999) also showed that prostrate is dominant over erect
growth habit. On the contrary, Kumar (2002) and Mishra (2004) reported erect growth habit as
completely dominant over prostrate type. It is our speculation that multiple alleles may confer
growth habit, so different inheritance patterns may be observed in different crosses.
II. Quantitative traits and QTLs
a) Days to flowering:
ILL-5888 flowered in 53 days compared to 60 days for ILL- 6002. The range for days to
flowering among RILs was 47 to 58 days with a mean of 51.4±3.4 days (Table-1). The frequency
distribution of the RILs and the normality test of days to flowering showed two discrete classes
and the absence of a normal distribution pattern (Fig. 2 a1, b1). Based on the distribution it could
be inferred that one major and some minor genes and interactions were important for
determining days to flowering in this population.
81

The ICIM analysis for days to flowering (Table 4, Fig. 3 a1 b1) showed the presence of
additive and epistatic interaction effects that accounted for a significant amount of phenotypic
variation. Three significant QTLs were detected with two on linkage group 4 and one on linkage
group13. The QTL detected at the 83cM position of linkage group 4 (QLG483) showed
significant additive effects (1.506) that accounted for 20.2% of the phenotypic variation. The
flanking markers, UBC34 and UBC1, were 1.4 and 1.6cM from QLG483. The other two QTLs,
QLG47 and QLG1350, accounted for 14.4% and 10.4% of the phenotypic variation, respectively.
QTL, QLG47 was 7cM from the GLLC 556 marker on linkage group 4 and QLG1350 was
flanked by two SRAP markers, ME5XR7b and F8XEM58b on linkage group 13 separated by
2.9cM and 7.2cM, respectively.
LODA determines the significance of total variation at the interaction data point whereas;
the LODAA value indicates epistatic effects between QTLs. The QLG484 x QLG138 and QLG124
x QLG1352 interactions accounted for 24.2% and 15.6% of the phenotypic variation,
respectively, and were due to combined additive and epistatic effects. Five other QTL interaction
pairs had significant epistatic effects that accounted for 4.6 to 8.0% phenotypic variation each
but the additive effects of the individual QTLs were non-significant (Table 4, Fig. 3 b1). It
should be noted that the QLG484 x QLG138 interaction probably involves the main effect QTL
QLG483 and the QLG124 x QLG1352 interaction probably involves the QTL QLG1350.
Erskine et al. (1990 a, 1994) found that lentil germplasm of Indian origin are more
sensitive to temperature and less responsive to photoperiod in flowering and so, temperature
fluctuations may affect the flowering in Bangladesh experiment. Study of the inheritance of
flowering in Precoz under both Indian and Syrian environments determined that a dominant gene
Sn played a major role in early flowering (Sarker et al. 1999b).
82

Tahir et al. (1994) identified four QTLs on different linkage groups and Sarker et al.
(1999) reported single and polygenic systems of control of days to flowering based on F2
segregation in different lentil crosses. Tullu et al. (2008) identified two QTLs (LG4 and LG12)
from one location data and five QTLs (LG1, LG4, LG5, LG9 and LG12) from another location
data for days to flowering.
We could not compare our QTLs for days to flowering with the QTLs identified by Tullu
et al. (2008) because the UBC and SSR markers they were using were not polymorphic in our
population. But all the QTL mapping studies on lentil indicate the presence of more than two
QTLs for days to flowering. In our study, three significant QTLs were detected, QLG483, QLG47
and QLG1350, that have additive effects and accounted for 45% of the phenotypic variation, and
one QTL, QLG483, alone accounted for 20% of the phenotypic variation. The QLG484 x QLG138
and QLG124 x QLG1352 interactions accounted for 24.2 and 15.6%, respectively, of the variation
through combined additive and epistatic effects. We found that the 83-84cM position on linkage
group LG 4 and the 50-52cM position on LG 13 were the major regions and accounted for
significant phenotypic variation for days to flowering.
b) Plant height:
The RILs varied in height from 15.7cm to 34.3cm with a mean of 25±3.8 (Table 1).
Frequency distribution and the normality test for plant height showed the presence of a normal
distribution (Kolmogorov-Smirnov = 0.049) and indicated polygenic control (Fig. 2 a2, b2).
A significant QTL (LOD= 4.9) was detected on linkage group 8 at the 4cM position
(QLG84) and the closest marker, SSR204b, was 4cM away. QTL QLG84 accounted for an
estimated 15.3% of the phenotypic variation for plant height (Table 5, Fig. 3 a2).
83

The epistatic effects of QLG376 x QLG836, and QLG382 x QLG46 accounted for 17.6 and
17.3% phenotypic variation, respectively, but additive effects of the interacting QTLs were
insignificant (Table 5, Fig. 3 b2). The interaction of QLG144 x QLG814 accounted for an
estimated 14.6% of phenotypic variation by combined additive and epistatic gene action. Six
other pairs of QTLs displayed epistatic interactions each affecting 6.8 to 10.7% of the phenotypic
variation.
Epistatic effects of QTLs accounted for a major portion of the phenotypic variation for
plant height in our population. Genes close to F13XR8 and Yc markers played a major role for
the QLG376 x QLG836 interactions, whereas, for the QLG382 x QLG46 interactions, genes close to
the same SRAP marker F13XR8 and GLLC 556 accounted for a significant portion of the
variation. This raises the question as to whether QLG376 and QLG382 are really separate or
distinct QTLs.
Tahir et al. (1994) reported that a gene linked to the Aat-p locus was responsible for
increased plant height. Tullu et al. (2008) reported that PI 320937 is taller than ‘Eston’ but both
contributed to reduced height of lentil plants and they identified different QTLs of plant height at
two locations, though there is a non-significant genotype x environment interaction. They
concluded that the chance of simultaneous detection of QTLs at both environments were small
due to lack of powerful statistical methods to detect minor QTLs.
c) Seed diameter:
The parents, ILL-5888 and ILL-6002, had seed diameters of 3.7mm and 6.5mm,
respectively, and all the RILs were intermediate to the parents. The highest and the lowest seed
diameter of the inbred lines were 4.0 and 6.3mm, respectively, with a mean of 4.9±0.5mm (Table
1). Frequency distribution of seed diameter of the RILs is bimodal but continuous (Fig.4 a1, b1)
84

indicating that a single major gene or QTL along with minor QTLs was involved in determining
seed diameter. Three different QTLs, QLG1112, QLG482, QLG598, were detected for seed
diameter on LG1, LG4 and LG5, respectively (Table 6). QLG482, at the 82cM position of linkage
group 4, accounted for 32.6% of the phenotypic variation through large additive effect of 0.293
with a LOD score of 22.2. The QLG482 QTL has the most significant effect by far, and may be
responsible for the bimodal frequency distribution of the mapping population observed for this
trait (Fig. 4 a1). Two flanking markers, UBC34 and UBC1, were 0.4cM and 2.6cM from the
QTL, respectively. The other two QTLs, QLG1112 and QLG598 accounted for 4.5 and 3.6% of the
phenotypic variation for seed diameter, respectively. Significant epistatic interactions of QLG262
x QLG2132, QLG262 x QLG2136 and QLG130 x QLG140 with relatively minor effects were
observed (Table 6, Fig. 5 a1, b1).
Cubero, (1984) reported that a polygenic system governs seed shape and size in faba bean
(Vicia faba). In chickpea (Cicer arietinum), small seed size was found to be dominant in desi x
kabuli crosses (Smithson et al., 1985), but Niknejad et al. (1971) found polygenic control of seed
size and partial dominance for large seededness. Davis et al., 1985 reported three genes control
the seed size in peas (Pisum sativum). In our study, one major QTL with two minor QTLs and
three minor epistatic interactions indicates that genetic control of seed diameter in lentil is
controlled by a combination of genetic effects. Dominant/recessive relationships cannot be
determined from our data.
d) 100 seed weight:
Seed weight is a major yield component. The 100 seed weight of ILL-5888 was 2.16 g
and ILL-6002 was 5.59 g. The range of 100 seed weight of the RILs was 2.0 to 4.9 g with a
mean of 3.2±.06g (Table 1). As with seed diameter, the 100 seed weight of the RILs were
85

intermediate to the two parents. The frequency distribution showed a skewed distribution toward
light seed (Fig 4 a2, b2). Five QTLs for 100 seed weight were identified on four linkage groups
(LG1, LG4, LG5 and LG8) that through additively accounted 5.6 to 17.5% of the phenotypic
variation. Two QTLs, QLG482 and QLG1113 accounted for 17.5% and 12.8% of the phenotypic
variation with a LOD score of 15.3 and 11.5, respectively. QLG482 was flanked by UBC34 and
UBC1 at 0.4 and 2.6cM, respectively, and QLG1113 was flanked by UBC38b and UBC 24a at
1cM and 7cM, respectively. The epistatic interactions of QLG2158 x QLG2210, QLG422 x QLG456,
QLG574 x QLG578 and QLG576 x QLG584 accounted for a significant portion of the phenotypic
variation, each accounting for about 9% of the variation (Table 7, Fig. 5 a2, b2).
Genetics of seed weight of common bean (Phaseolus vulgaris) has been under
investigation since the early studies of Johannsen (1903). According to Motto et al. (1978) based
on classical quantitative genetics study, seed weight of common bean is quantitatively inherited
and affected by at least ten genes with additive effects . In mungbean (Vigna radiate), seed
weight is controlled by genes with additive and non-additive action and low seed weight is
dominant (Imrie et al., 1985). ). It has been reported that dry seed weight of lentil is controlled by
two genes (Sakar, 1983). Abbo et al. (1992) found that seed weight of lentil is under polygenic
control with additive and dominant gene action and partial dominance of low seed weight alleles.
In our study, two QTLs accounted for relatively high levels of variation supporting Sakar’s
(1983) findings and the frequency distribution was skewed toward low seed weight and
indicated the polygenic nature of the control of seed weight and partial dominance for low seed
weight supporting Abbo et al.’s (1992) findings.
86
CONCLUSION
Agro-morphological traits have immense importance in breeding lentils for high yields,
yield stability and market acceptability. The ICIM (Inclusive Composite Interval Mapping)
method opens the door for understanding quantitative inheritance with epistatic interactions.
Now, it is possible to identify digenic interactions while developing polygenic interaction models
to improve the efficiency and accuracy of QTL detection. Taking these interactions into account,
it will be possible to formulate breeding and selection procedures for important agronomic and
market value traits.
We report here the detection of three significant QTLs (QLG47, QLG483 and QLG1350)
for days to flowering, one significant QTL (QLG84) for plant height, three significant QTLs
(QLG1112, QLG482 and QLG598) for seed diameter and five significant QTLs (QLG1107,
QLG1113, QLG482, QLG555 and QLG834) for 100 seed weight.
QLG482-83 accounted for 20.2%, 32.6%, and 17.5% of the phenotypic variation for days
to flowering, seed diameter and 100 seed weight, respectively. QLG482-83 was flanked by two
RAPD markers UBC 34 and UBC1 at 0.4-1.4 and 1.6-2.6cM, respectively. The three traits
involved are all positively correlated with each other indicating the possibility for linkage or
pleiotrpic effect in this LG 4 QTL region.
Some interacting QTLs accounted for significant phenotypic variation for quantitative
traits through additive or epistatic interactions or both. QLG124 x QLG1352 and QLG484 x
QLG138 accounted for 15.6% and 24.2% through additive and epistatic effects for days to
flowering. For plant height, QLG376 x QLG836, QLG382 x QLG46, QLG466 x QLG1416 and
QLG572 x QLG1168 interactions accounted for 17.6%, 17.3%, 10.6% and 10.7% of the
87
phenotypic variation, respectively. QLG144 x QLG814 both additively as well as epistatically
accounted for 14.6% of the phenotypic variation for plant height.
Growth habit and cotyledon color were each controlled by single genes with prostrate
growth dominant over erect plant type and red cotyledon dominant over yellow cotyledon.
Understanding genetics of the quantitative traits will help to develop the breeding
strategy for selection. The significant correlations among days to flowering, seed diameter, and
100 seed weight and the association between the gene rich QTL region (QLG482-83) will help the
breeders selecting plants for early maturity and improved seed quality. The putative QTLs will
be useful to locate the genes in the genome that are important for the traits and provide the
guidance for marker assisted selection and cloning the genes.
Acknowledgements: We are indebted to Sheri McGrew, Tony Chen, Jarrod Pfaff and Lorna
Burns and Tracie Anderson for the field and lab support.
REFERENCES
Abbo, S., G. Ladizinsky, and N.F.Weeden. 1992. Genetic analysis and linkage study of seed weight in lentil. Euphytica 58: 259-266.
Barulina, H. 1930. Lentils of the USSR and other counties. Bull Appl Bot Gen Plant Breed 40:
225-238.
Cubero, J.I. 1984. Taxonomy, distribution and evolution of faba bean and its wild relative. In: Witcombe, J.R., and W. Erskine, (Eds), Genetic Resources and their explotation: chickpeas, faba beans and lentils. 131-144.
Davies, D.R., G.J. Berry, M.C. Health, and T.C.K. Dawkins. 1985. Pea (Pisum sativum L.). In:
Grain Legume Crops. Summerfield R.J., and E.H. Roberts (Eds.). Williams Collins Sons and Co. Ltd, London, UK. 147-198.
Emami, M. K., and B. Sharma. 1999. Linkage between three morphological markers in lentil.
Plant Breeding. Dec. 118(6): 579-581.
88

Erskine, W., A. Hussain, M. Tahir, A. Bahksh, R.H. Ellis, R.J. Summerfield, and E.H. Roberts. 1994. Field evaluation of a model phototermal responses in a world lentil collection. Theor Appl Genet 88: 423-428.
Erskine, W., Ellis, R. H., R. J. Summerfield, E. H. Roberts, and A.Hussain.1990.
Characterization ofresponses to temperature and photoperiod for time to flowering in a world lentil collection. Theor Appl Genet 80: 193-199.
Imrie, B.C., Z.U. Ahmed, J.P.J. Eerens. 1985. Heritability of seed weight in mungbean. SABRAO J. 17, 173–175.
Johannsen, W. 1903. Om Arvelighed i Samfund ogrene Linier (On the inheritance in populations
and pure lines). K. Danske Videnskah. Sr1 skahs Forh 3: 235-294.
Kumar, Y. 2002. Inheritance and linkage of genes for morphological traits in lentil (Lens culinaris. Medik.). Ph.D. Thesis, CCS University, Meerut, India.
Ladizinsky, G., 1979. The genetics of several characteristics in lentil as indicated by crosses
between Lens culinaris and Lens orientalis. J. Hered 70: 135-137.
Li, H., J-M. Ribaut, Z. Li, and J. Wang. 2008. Inclusive composite interval mapping (ICIM) for digenic epistasis of quantitative traits in biparental populations. Theor Appl Genet 116:243–260.
Mishra, S.K. 2004. Final technical report on development of comprehensive genetic linkage map
in lentil (Lens culinaris Medik.). Submitted to ICAR, Krishi Bhawan, New Delhi, India.
Motto, M., G.P. Soressi, and F. Salamini. 1978. Seed size inheritance in a cross between wild and cultivated common beans (Phaseolus vulgaris L.).Genetica 49: 31-36.
Muehlbauer, F.J. 2009. Lentil: Improvement in developing countries. Erskine, W., F.J.
Muehlbauer, A. Sarker, and B. Sharma. The Lentil: Botany, production and uses. CAB International.137-154.
Muehlbauer, F.J., R.W. Short, R.J. Summerfield, K.J. Morrison and D.G. Swan. 1981.
Description and culture of lentils. Cooperative Extension, College of Agriculture, Washington State University and USDA-ARS.
Nelson, J.C., 1997. QGENE: software for marker-based genomic analysis and breeding. Mol
Breed 3: 239–245.
Niknejad, M., M. Khosh-khui, and S.R. Ghorashy.1971.Inheritance of seed size in chickpeas (Cicer arietinum L.) Crop Sci 11: 768-769.
89

Roberts E.H., R.J. Summerfield, F.J. Muehlbauer, and R.W. Short. 1986. Flowering in Lentil (Lens culinaris Medik.): The Duration of the Photoperiodic Inductive Phase as a Function of Accumulated Daylength above the Critical Photoperiod. Ann Bot 58: 235-248.
Sarker, A., and W. Erskine. 2006. Recent developments in ancient lentil. J Agric Sci 144: 1-11.
Sarker A., W. Erskine, B. Sharma, and M.C. Tyagi. 1999.Inheritance and linkage relationship of
days to flower and morphological loci in lentil (Lens culinaris Medikus subsp. culinaris). J Hered: 90(2).
Sakar, D. 1983.Breeding behaviour of characters related to yield and adaptation to mechanical
harvesting in lentil (Lens culinaris Medik.). Ph.D. dissertation, Dept. of Agronomy and Soils, Washington State University.
Saxena, M.C., and G.C. Hawtin, 1981. Morphology and growth patterns. In: C. Webb and G.
Hawtin (Eds), Lentils. Commonwealth Agricultural Bureaux, Slough, UK. 39–52.
Sharma, B., and M.K. Emami. 2002. Discovery of anew gene causing dark green cotyledons and pathway of pigment synthesis in lentil (Lens culinaris Medik). Euphytica 124: 349-353.
Singh, T.P. 1978. Inheritance of cotyledon colour in lentil. Indian J Genet 38: 11–12.
Slinkard, A.E., 1978. Inheritance of cotyledon color in lentils. J Hered 69:139-140.
Smithson, J.B., J.A. Thompson, and R.J. Summerfield. 1985. Chickpea (Cicer arietinum L.). In:
R.J. Summerfield and E.H. Roberts (eds.), Grain Legume Crops. Collins, London, UK. 312-390.
Tahir, M., and F.J. Muehlbauer. 1994. Gene mapping in lentil with recombinant inbred lines. J
Hered 85:306-310.
Tschermak-Seysenegg, E. 1928. Lentil and fieldbean crosses. Sityringsbe Akad Wiss Wien Math Nat R1 I Abs 137(3/4): 171–181 (cf. Muehlbauer, F.J. and A.E. Slinkard, 1987. Breeding Methodology. In: C. Webb and G. Hawtin (Eds.), Lentils, pp. 69–90. CAB-ICARDA, Farnham, England.
Tullu, A., B. Tar'an, T. Warkentin, and A. Vandenberg. 2008. Construction of an Intraspecific
Linkage Map and QTL Analysis for Earliness and Plant Height in Lentil. Crop Sci 48: 2254-2264.
Tulmann-Neto, A., M.C. Alves. 1997. Induction of mutations for earliness in the soybean
cultivar Paraná. Braz J Genet 20: 45-50.
Wilson, V. E., A.G. Law, and R. L. Warner. 1970. Inheritance of Cotyledon Color in Lens
Culinaris (Medic.). Crop Sci 10: 205-207.
90

Table 1. Statistical parameters of quantitative traits of RILs developed from the ILL-5888 x ILL-6002 cross grown at Pullman, WA.
Statistical parameters
Days to Flowering ( Days)
Plant height (cm)
Seed diameter (mm)
100 seed weight (g)
MSE 32.62*** 38.609*** 0.825*** 1.778*** Mean ± sd 51.4±3.4 25.1±3.8 4.9±0.5 3.2±0.6 Range 47-58 15.7-34.3 4.0-6.3 2.0-4.9 ILL-5888 53 18.2 3.7 2.16 ILL-6002 60 27.8 6.5 5.59 MSE= Mean sum of squares and *** P < .001
Table: 2. Correlation between quantitative agro-morphological traits (days to flowering, plant
height, seed diameter and 100- seed weight). Trait Days to
Flowering Plant height
Seed diameter
100 seed weight
Days to Flowering 1.0 0.217* 0.393*** 0.411*** Plant height 1.0 0.207* 0.261*** Seed diameter 1.0 0.885*** 100 seed weight 1.0 *** P < 0.001, * P<0.05
Table 3. Chi square tests for goodness of fit to expected segregation ratios for cotyledon color (Yc/yc) and growth habit (Gh/gh) among RILs developed from the ILL-5888 x ILL-6002 cross grown at Pullman, WA.
RILs/ Parents Traits and gene symbol No. of
RILs
Expected Segregation
ratio
χ2 value
F6 derived F7 RILs Red cotyledon (Yc) 94 1:1 2.14 * Yellow cotyledon (yc) 75 Parents: ILL-5888 Red cotyledon (Yc) ILL-6002 Yellow cotyledon (yc) F6 derived F7 RILs Prostrate growth habit (Gh) 92 1:1 1.73* Erect growth habit (gh) 75 Parents: ILL-5888 Prostrate growth habit (Gh) ILL-6002 Erect growth habit (gh)
* P < 0.250 >0.100
91

Table 4. Summary of QTL analysis for days to flowering variation in RILs from the ILL-5888 x ILL-6022 cross.
Trait QTL Additive effect LOD PVE+(%) Days to flowering
QLG47
-1.262
4.84
14.38
QLG483 1.506 10.24 20.18 QLG1350 1.078 4.99 10.40 Interacting QTLs Epistatic effect LODA LODAA PVE+(%) QLG124 x QLG1352 0.637 13.25 3.48 15.57 QLG20 x QLG1224 -0.914 6.74 6.59 7.26 QLG230 x QLG892 0.858 6.09 5.89 6.39 QLG282 x QLG3150 -0.937 7.01 6.56 7.98 QLG2132 x QLG818 0.731 4.73 4.43 5.07 QLG350 x QLG794 0.744 3.81 3.74 4.56 QLG484 x QLG138 0.912 19.22 6.57 24.16
+ phenotypic variation explained
Table 5. Summary of QTL analysis for plant height variation in RILs from the ILL-5888 x ILL-6002 cross.
Trait QTL Additive effect LOD PVE,+(%) Plant height QLG84 -1.478 4.93 15.33 Interacting QTLs Epistatic effect LODA LODAA PVE+(%) QLG144 x QLG814 -0.958 8.42 4.12 14.57 QLG144 x QLG822 -0.976 4.39 4.36 6.84 QLG186 x QLG776 1.114 3.26 3.21 8.65 QLG1224 x QLG530 1.21 7.19 7.06 9.92 QLG376 x QLG836 -1.590 11.52 11.34 17.61 QLG382 x QLG46 -1.557 6.64 6.58 17.29 QLG3164 x QLG1052 -1.103 6.17 5.93 8.84 QLG466 x QLG1416 -1.232 6.48 6.42 10.56 QLG572 x QLG1168 1.267 7.98 6.66 10.69
+ phenotypic variation explained
92

Table 6. Summary of significant QTLs, additive and epistatic effects for seed diameter in RIL population from the ILL-5888 x ILL-6002 cross.
Trait QTL Additive effect LOD PVE+(%) Seed diameter QLG1112 -0.097 3.21 3.64 QLG482 0.293 22.23 32.63 QLG598 0.109 3.25 4.51 Interacting QTLs Epistatic effect LODA LODAA PVE+(%) QLG262 x QLG2132 0.113 3.58 3.139 3.48 QLG262 x QLG2136 0.120 3.59 3.14 3.97 QLG130 x QLG140 0.100 4.47 4.24 3.72
+ phenotypic variation explained
Table7. Summary of QTLs, additive and epistatic effects for 100 seed weight in RILs from the
ILL-5888 x ILL- 6002 cross. Trait QTL Additive effect LOD PVE+(%) 100 seed weight QLG1107 0.146 5.47 5.63 QLG1113 -0.219 11.45 12.83 QLG482 0.258 15.25 17.52 QLG555 0.150 5.40 5.83 QLG834 -0.166 7.20 7.32 Interacting QTLs Epistatic effect LODA LODAA PVE+(%) QLG2158 x LG2210 -0.183 3.47 3.06 9.19 QLG422 x QLG456 -0.159 3.43 2.63 8.67 QLG574 x QLG578 -0.278 3.58 3.58 9.54 QLG576 x QLG584 -0.237 3.01 2.93 9.26
+ phenotypic variation explained
93

LG8 LG9 Figure 1. The qualitative agro-morphological traits (a) The linkage group 8 (LG8) having
cotyledon color gene (Yc) and (b) linkage group 9 (LG9) having Gh gene.
Days to flowering
Plant height (cm)
No.
of R
ILs
No.
of R
ILs
Deviation from mean of days to flowering
Freq
uenc
y di
strib
utio
n of
day
s to
flow
erin
gFr
eque
ncy
dist
ribut
ion
of p
lant
hei
ght
Deviation from mean of plant height
ILL-5888 ILL-6002
ILL-5888 ILL-6002
(a1)
(a2)
(b1)
(b2)
.9
.9
Figure 2. Frequency distribution and normality test of RILs developed from the ILL-5888 x
ILL-6002 cross for days to flowering (a1, b1), plant height (a2, b2).
94
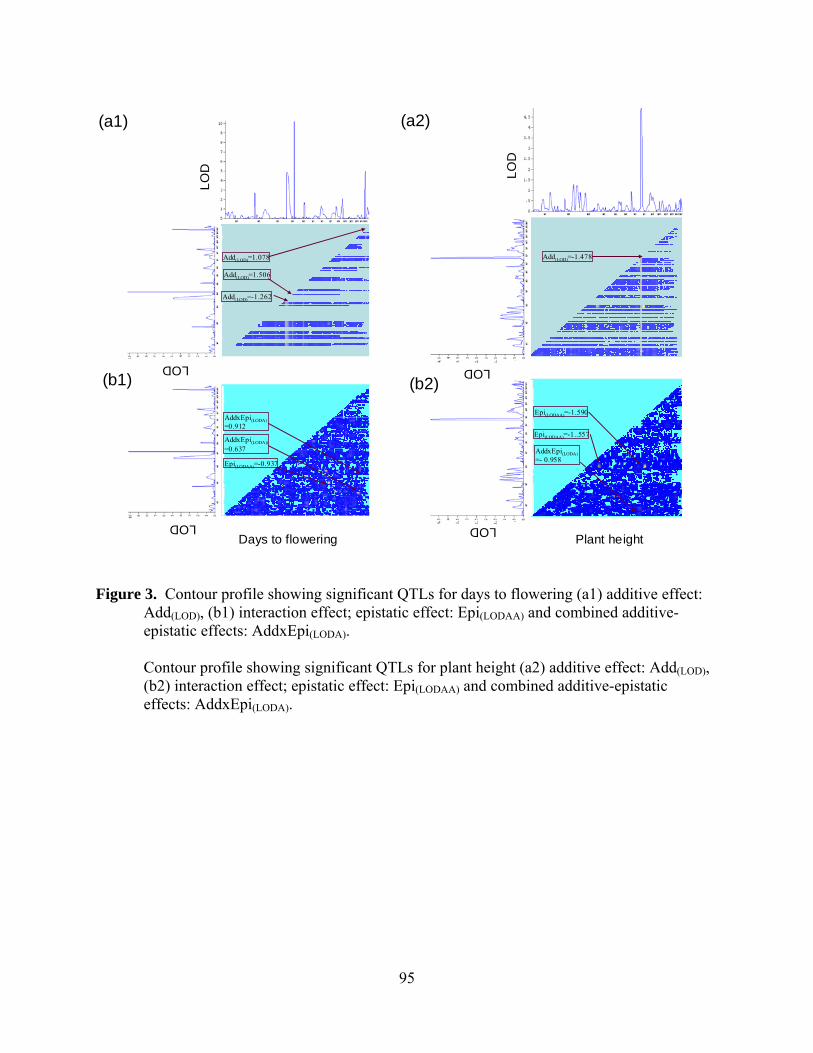
LOD
LOD
Days to flowering Plant height
(a1)
(b1)
(a2)
(b2)
Add(LOD)=1.078
Add(LOD)=1.506
Add(LOD)=-1.262
AddxEpi(LODA)=0.912
AddxEpi(LODA))=0.637
LOD
LOD
LODLO
D
Epi(LODAA)=-0.937
Add(LOD)=-1.478
AddxEpi(LODA)=- 0.958
Epi(LODAA)=-1.590
Epi(LODAA)=-1..557
Figure 3. Contour profile showing significant QTLs for days to flowering (a1) additive effect: Add(LOD), (b1) interaction effect; epistatic effect: Epi(LODAA) and combined additive-epistatic effects: AddxEpi(LODA).
Contour profile showing significant QTLs for plant height (a2) additive effect: Add(LOD), (b2) interaction effect; epistatic effect: Epi(LODAA) and combined additive-epistatic effects: AddxEpi(LODA).
95

Seed diameter (mm)
No.
of R
ILs
ILL-5888 ILL-6002(a1)
Deviation from mean of seed diameter
Freq
uenc
y di
strib
utio
n of
see
d di
amet
er
.9
(b1)
100 seed weight (g)
No.
of R
ILs
ILL-5888 ILL-6002(a2)
Deviation from mean of 100 seed weight
Freq
uenc
y di
strib
utio
n of
100
see
d w
eigh
t
.9
(b2)
Figure 4. Frequency distribution and normality test of RILs developed from the ILL-5888 x
ILL-6002 cross for days to seed diameter (a1, b1) and 100 seed weight (a2, b2).
96

Seed diameter 100 seed weight
LOD
LOD
(a1)
LOD
LOD
LOD
LOD
(b1)
(a2)
(b2)
Add(LOD)=0.109
Add(LOD)=0.293
Add(LOD)=-0.097
Add(LOD)=-0.166
Add(LOD)=0.150
Add(LOD)=0.258
Add(LOD)=-0.219
Epi(LODAA)=0.100
Epi(LODAA)=0.120
Epi(LODAA)=0.113
Epi(LODAA)=-0.278
Epi(LODAA)=-0.159
Epi(LODAA)=-0.183
Figure 5. Contour profile showing significant QTLs for seed diameter (a1) additive effect:
Add(LOD), (b1) interaction effect; epistatic effect: Epi(LODAA) and combined additive-epistatic effects: AddxEpi(LODA).
Contour profile showing significant QTLs for 100 seed weight (a2) additive effect: Add(LOD), (b2) interaction effect; epistatic effect: Epi(LODAA) and combined additive-epistatic effects: AddxEpi(LODA).
.
97
Top Related