


Languages
Pages
Legal


MAPIC 2015 Retailing USA. Opportunity awaits. Trust our retailntelligence.

Trust our retailntelligence.
MAPIC 2015
Retailing USA. Opportunity awaits.
David Zoba Global SVP Retail Real Estate, Gap Inc.
(Recently Retired)
Panelist
Dana Telsey CEO and Chief Research Officer
Telsey Advisory Group
Panelist
Michael Hirschfeld Executive VP
National Retail Tenant Services, JLL
Panelist
Naveen Jaggi President, Retail Brokerage JLL Americas
Moderator
Nigel Jobson Head of Group Property
Superdry
Panelist

Trust our retailntelligence.
The U.S. is a huge and fragmented consumer market
It is made up of a handful of international cities, and hundreds more markets large and small

Trust our retailntelligence.
Country Shopping Center GLA SF Per 100 Inhabitants
USA 2,357 SF
Canada 1,536 SF
UK 384
France 382
Denmark 380
Finland 355
Portugal 352
Spain 312
Poland 293
Italy 273
Germany 235
Greece 89
Source: ICSC Country Fact Sheets, 2014 (US, France, Germany, Poland, Portugal, Spain), 2013 (Canada, Italy, UK), 2012 (Denmark, Greece), 2011 (Finland).
Understanding the U.S. Market
Vastly more shopping options
§ The U.S. has over six times more square feet of retail space per person than the UK

Trust our retailntelligence.
Understanding the U.S. Market
Retail is low density
§ Malls and high streets play a role, but most retail is spread out across suburban shopping centers and freestanding buildings
49%General Retail
34%Shopping Center
7%Power Center
9%Malls
1%Specialty Center
Retail SF by type in major U.S. markets
Source: Q3 2015 Retail Market Inventory, JLL, Costar.

Trust our retailntelligence.
Source: Q3 2015 Retail Market Inventory, JLL, Costar.
Greater New York 7%
Greater Los Angeles 6%
Chicago 4%
Philadelphia 4%
Dallas/Ft Worth 3%
Houston 3%
Atlanta 3%
Boston 3%
Understanding the U.S. Market
Retail geography is fragmented
§ The top 8 U.S. markets only make up 33% of the nation’s retail space
§ Major retailers open hundreds of stores across many markets before their presence is truly felt nationally
12.8B SF of retail space spread across
137 U.S. markets

Trust our retailntelligence.
Understanding the U.S. Market
Primary markets the world over
§ Major retailers generally begin U.S. entry in one of the top 13 U.S. markets
USA Asia Pacific Europe
New York Hong Kong London
Los Angeles Shanghai Paris
Las Vegas Singapore Moscow
Miami Beijing Milan
Chicago Tokyo Madrid
San Francisco Taipei Istanbul
Washington DC Seoul Rome
Boston Bangkok Munich
Dallas Osaka Barcelona
Atlanta Chengdu Berlin
Honolulu Kuala Lumpur Brussels
San Diego Tianjin Amsterdam
Houston Shenyang Hamburg
Top Retail Markets: U.S., APAC, Europe

Trust our retailntelligence.
Understanding the U.S. Market
Multiple markets combine for big impact
The state of California, by itself, is the world’s eighth largest economy. It’s about the same size as Brazil.
The economy of Texas is roughly the same as all of Scandinavia, including Sweden, Norway and Denmark combined. If it were a nation, it would have the 11th largest GDP.
Source: 2014 GDP Estimates, U.S. Bureau of Economic Analysis and International Monetary Fund
New York’s GDP is roughly the same size as Spain. If it were a nation it would be ranked #15.

Trust our retailntelligence.
It’s not just about malls and high streets Foreign entrants have found success (and failure) in a variety of retail property types.

Trust our retailntelligence.
Fifth Avenue, New York City
Understanding U.S. Retail Types
High streets are a small percent of retail
§ Downtown shopping with a mix of specialty, department store and luxury – often a first choice for foreign retailers new to the market

Trust our retailntelligence.
Understanding U.S. Retail Types
High streets like 5th Avenue in NY are home to many foreign retailers

Trust our retailntelligence.
§ Malls have remained much the same for decades: department stores anchors, specialty retailers – often with an emphasis on fashion
King of Prussia Mall King of Prussia, PA
Simon Property Group
Understanding U.S. Retail Types
For most Americans, malls are still tops for clothing and general merchandise

Trust our retailntelligence.
Sephora entered U.S. in New York
Launched JCPenney in-store shops
360 North American stores; 485 JCPenney in-store shops; Sephora owns 12% of U.S. Beauty & Cosmetics market share, according to IBISWorld
Understanding U.S. Retail Types
France’s Sephora encounters most Americans in a mall setting
2015
2006
1998

Trust our retailntelligence.
Understanding U.S. Retail Types
Sephora has been less aggressive with new stores than domestic rival Ulta since 2014
103 98
75
122
98
16
42
63
42
125 121
94
0.0
20.0
40.0
60.0
80.0
100.0
120.0
140.0
2010 2011 2012 2013 2014 2015
New U.S. Sephora Stores (Includes JCP in-store) New U.S. Ulta Stores

Trust our retailntelligence.
§ Sephora’s 485 JCPenney in-store shops are ~1,500 SF, compared with the ~5,000 SF stand-alone stores
§ Britain's Topshop is found in 94 of Nordstrom’s 121 full-line stores
§ Nordstrom launched 14 Topshop (~2,500 SF) and 14 Topman (~1,500 SF) in-stores in 2012
§ Topshop/Topman has 3 American flagships at 20,000 SF each
Understanding U.S. Retail Types
Store-within-store strategy

Trust our retailntelligence.
§ Upscale national tenants in an urban setting
§ Department stores anchors, specialty retailers – often emphasizing aspirational and luxury brands
§ Similar tenant mix to traditional mall
Understanding U.S. Retail Types
For many, lifestyle centers are the new high street
The Americana at Brand Glendale, CA
Caruso Affiliated

Trust our retailntelligence.
§ Sweden’s H&M came to the U.S. in 2000 with a Fifth Avenue 57,000 SF flagship
§ Most of H&M’s 381 U.S. stores are in malls; 17 are in lifestyle centers
§ H&M opened 51 stores in the U.S. last year
Understanding U.S. Retail Types
H&M demonstrates patient steady growth
85%Malls
3%Neighborhood/Community
2%Power6%
Lifestyle
4%Outlet

Trust our retailntelligence.
Understanding U.S. Retail Types
H&M averaged 32 new stores per year since 2011
200 218 240 269 310
361
0.0
50.0
100.0
150.0
200.0
250.0
300.0
350.0
400.0
2010 2011 2012 2013 2014 2015
# of stores

Trust our retailntelligence.
§ Centers focused on convenience in areas of high car traffic
§ Tenanted with goods and services retailers, often grocery-anchored
Understanding U.S. Retail Types
Neighborhood and strip centers are daily destinations for grocery and services
Berry Town Center Davenport, FL Phillips Edison

Trust our retailntelligence.
§ Aldi entered the country in 1976 in Iowa
§ Currently 1,400 stores (~16,000 SF) in 32 states in the Eastern half of the U.S.
§ 29 West Coast locations opening soon in California
§ 130 locations per year (through 2018)
Understanding U.S. Retail Types
Germany’s Aldi has blanketed much of the U.S. in neighborhood centers

Trust our retailntelligence.
§ Expected to open 500 U.S. locations
§ Broke ground on a distribution center in Virginia (October 2015), and will soon open its national HQ in the state
§ No stores currently open
Understanding U.S. Retail Types
Germany’s Lidl is hot on Aldi’s heels

Trust our retailntelligence.
§ Big boxes of home improvement, discount department and off-price “category killers”
§ Few foreign retailers have made it to power centers
Understanding U.S. Retail Types
Power centers offer big boxes, category killers

Trust our retailntelligence.
§ 41 Outlet centers will have opened from 2012 – 2015
§ 60 new projects and expansions are planned
Understanding U.S. Retail Types
Outlet centers offer fashion brands at a discount
Source:VRN
U.S. Outlet Centers 202
Average Outlet Size 395,381 SF
Average Occupancy Over 95%
Average Sales PSF $546.33
Source: VRN.

Trust our retailntelligence.
Pay attention to the differences in the U.S. consumer Millennials have a unique set of shopping habits and their purchasing power is growing. e-commerce is less mature in U.S. than Europe.

Trust our retailntelligence.
Understanding the U.S. Consumer
Top 4 consumer spending growth trends Americans love their pets § U.S. pet industry expenditures will grow to $67.6 billion by 2018
Athleisure explosion § U.S. apparel, footwear and accessories spend grew by $2 billion in 2014 –
driven by active wear, athletic performance footwear and bags § Yoga pant sales have skyrocketed
Foodie nation § Consumers are choosing higher end “fast casual options,” many retailers are adding
food components, shopping centers are devoting more feet to food uses
Healthy nation § With the increasing availability of data from health trackers, health awareness
seems to be rising along with health-retail: fitness centers, juice bars, healthy food, exercise wear

Trust our retailntelligence.
Understanding the U.S. Consumer
Stocking up for the week
§ Many Americans value time over money – one-stop-shopping is important
§ Americans often do all their grocery shopping in one weekly trip
- 60% of Americans say they grocery shop to “stock up”
- Only 37% of Europeans said the same thing

Trust our retailntelligence.
Understanding the U.S. Consumer
Auto driven nation
§ Europeans think 100 km is a far distance to drive for a purchase – many Americans call 100 km their daily commute
§ Retailers must pay close attention to parking ratios
§ Trade areas (catchment areas) are often defined by drive time

Trust our retailntelligence.
Understanding the U.S. Consumer
Millennials are making a major impact
§ At ~80 million strong, millennials1 represent 25% of the U.S. population
§ Responsible for $600 billion in spending, which is expected to grow to $1.4 trillion by 2020
CONSUMER EXPENDITURE SURVEY COMPARISON – MILLENNIALS IN 2013 VS. 2003 2003 2013 '13vs.'03(bps)
Under25yearsold
25-34yearsold Millennials
Under25yearsold
25-34yearsold Millennials
Under25yearsold
25-34yearsold Millennials
Food 15% 13% 15% 16% 13% 15% 30 (20) 16Alcoholicbeverages 2% 1% 2% 1% 1% 1% (110) (10) (82)Housing 32% 36% 33% 34% 36% 35% 250 30 188Apparelandservices 5% 5% 5% 5% 4% 5% 0 (80) (22)Transportation 21% 20% 21% 19% 19% 19% (220) (90) (184)Healthcare 2% 4% 3% 3% 5% 4% 70 100 78Entertainment 4% 5% 4% 4% 5% 4% (10) (20) (13)Personalcareproductsandservices 2% 1% 1% 1% 1% 1% (40) (10) (32)Reading 0% 0% 0% 0% 0% 0% 0 (10) (3)Education 7% 2% 5% 7% 2% 5% 10 40 18Tobaccoproductsandsmokingsupplies 1% 1% 1% 1% 1% 1% (30) (10) (24)Miscellaneous 1% 1% 1% 1% 1% 1% (40) (10) (32)Cashcontributions 2% 2% 2% 2% 2% 2% (10) 10 (4)Personalinsuranceandpensions 6% 10% 7% 7% 11% 8% 110 80 102
TOTAL 100% 100% 100% 100% 100% 100%
Prepared by Telsey Advisory Group
Source: Bureau of Labor Statistics, Accenture, Berglass+Associates/WWD study titled “What happens when millennials get the wallet”. (1) Definitions of age range varies but typically include 18 – 34 year olds. Note: Reflects latest available data. Note: Cash contributions represent donations to charities and other entities in cash form. Note: Millennial category represents weighted average between Under 25 and 25 – 34 year old segments.
Trust our retailntelligence.
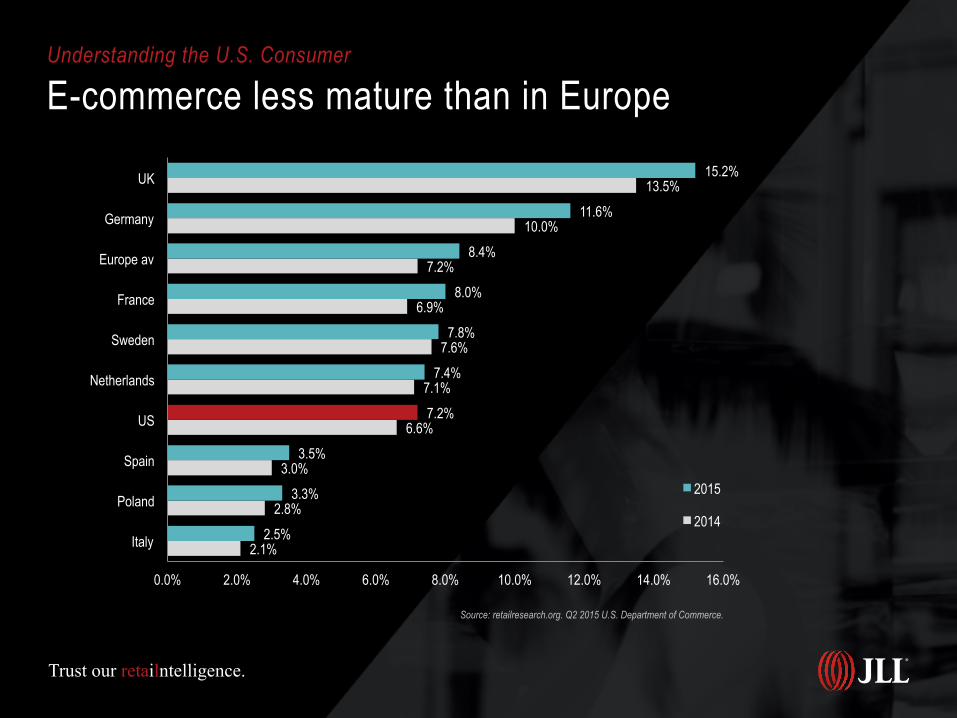
Understanding the U.S. Consumer
E-commerce less mature than in Europe
Source: retailresearch.org. Q2 2015 U.S. Department of Commerce.
2.1%
2.8%
3.0%
6.6%
7.1%
7.6%
6.9%
7.2%
10.0%
13.5%
2.5%
3.3%
3.5%
7.2%
7.4%
7.8%
8.0%
8.4%
11.6%
15.2%
0.0% 2.0% 4.0% 6.0% 8.0% 10.0% 12.0% 14.0% 16.0%
Italy
Poland
Spain
US
Netherlands
Sweden
France
Europe av
Germany
UK
2015
2014

Trust our retailntelligence.
Understanding the U.S. Consumer
Mobile commerce is gaining traction
§ Mobile devices are causing consumers to spend more time online
§ Mobile commerce is a significant opportunity for brick-and-mortar retailers who can successfully broaden their distribution channels
Source: eMarketer. Note: Retail m-Commerce sales includes products or services ordered using the internet via mobile devices, regardless of the method of payment or fulfillment; excludes travel and event ticket sales.
Prepared by Telsey Advisory Group
$24.8
$42.1$57.8
$76.4
$98.1
$114.5
$132.7
11.0%
16.0%
19.0%
22.0%
25.0% 26.0% 27.0%
2012 2013 2014E 2015E 2016E 2017E 2018E
Retail m-Commerce Sales ($bn) % of Retail e-Commerce Sales
USRETAILM-COMMERCESALESANDSHAREOFRETAILE-COMMERCESALES

Trust our retailntelligence.
Understanding the U.S. Consumer
E-commerce concentrated in few categories
§ Categories conducive to e-commerce are commodity-like, have low shipping costs relative to the value of product, and are generally not needed for immediate use
§ 51% of online sales are concentrated in just three major categories - Consumer electronics1 (22%); Apparel and accessories (16%); Pre-recorded media2 (13%)
Source: eMarketer. Note: Retail m-Commerce sales includes products or services ordered using the internet via mobile devices, regardless of the method of payment or fulfillment; excludes travel and event ticket sales.
0%
10%
20%
30%
40%
50%
60%
70%
80%
90%
100%
Pene
tratio
n Ra
te
2013E 2017E
e-Commerce Penetration > 20%
e-Commerce Penetration <10% Categories
expected to increase to
more than 20% penetration by
2017.
Prepared by Telsey Advisory Group
ONLINEPRODUCTPENETRATIONRATES
Trust our retailntelligence.
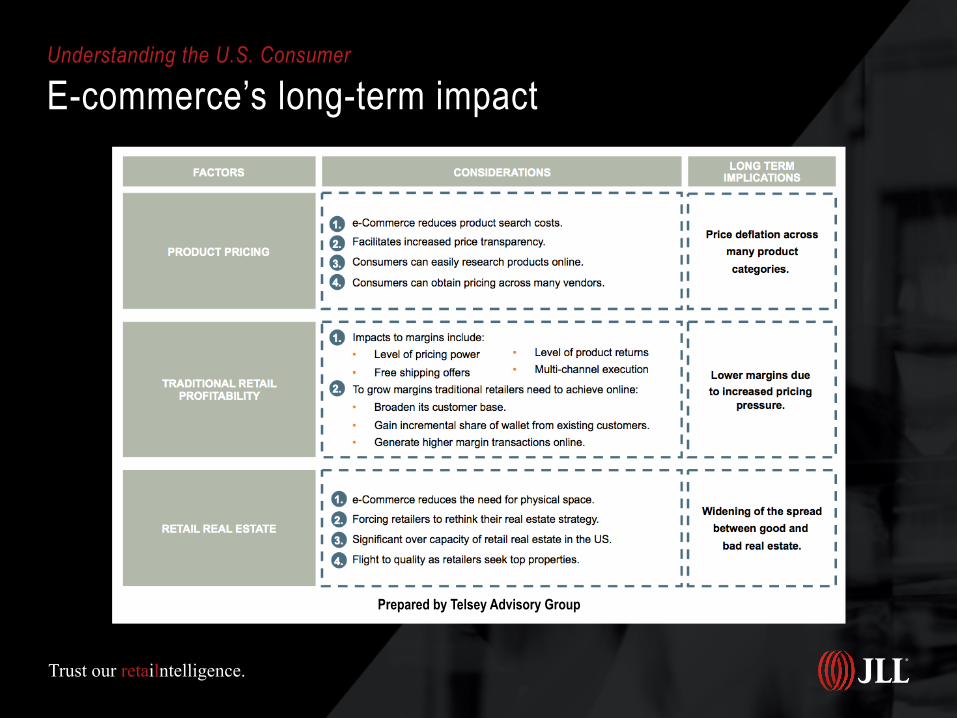
Understanding the U.S. Consumer
E-commerce’s long-term impact
Prepared by Telsey Advisory Group


Trust our retailntelligence.
Prepared by Telsey Advisory Group

Trust our retailntelligence.
Prepared by Telsey Advisory Group

Trust our retailntelligence.
Prepared by Telsey Advisory Group

Trust our retailntelligence.
Prepared by Telsey Advisory Group

Top Related