


Languages
Pages
Legal

0
Management Interim Report of AD Plastik Group and the company AD Plastik Inc. Solin for the first half of 2015
Solin, July 2015
1
Contents
page
a) Managment Interim Report of AD Plastik Group and the Company AD Plastik Inc. Solin for the period 01.01.-30.06.2015
2
b) Financial reports of AD Plastik Group 6
1. Balance sheet 8
2. Profit and loss account 10
3. Cash flow (indirect method) 12
4. Report on changes to capital 13
c) Financial reports of the Company AD Plastik Inc. Solin 14
5. Balance sheet 16
6. Profit and loss account 18
7. Cash flow (indirect method) 20
8. Report on changes to capital 21
d) Statement of the person responsible for drafting the financial reports 22
2
a) Managment Interim Report of AD Plastik Group and the Company AD Plastik Inc. Solin for the period 01.01.-30.06.2015
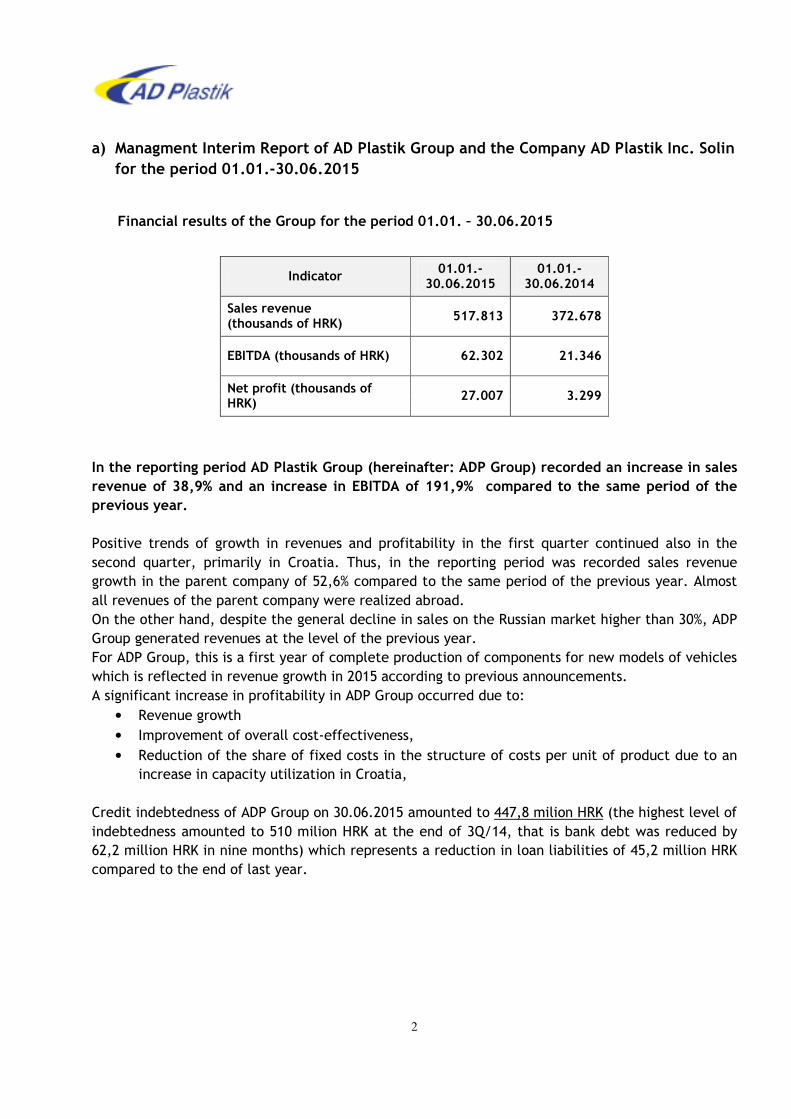
Financial results of the Group for the period 01.01. – 30.06.2015
In the reporting period AD Plastik Group (hereinafter: ADP Group) recorded an increase in sales
revenue of 38,9% and an increase in EBITDA of 191,9% compared to the same period of the
previous year.
Positive trends of growth in revenues and profitability in the first quarter continued also in the
second quarter, primarily in Croatia. Thus, in the reporting period was recorded sales revenue
growth in the parent company of 52,6% compared to the same period of the previous year. Almost
all revenues of the parent company were realized abroad.
On the other hand, despite the general decline in sales on the Russian market higher than 30%, ADP
Group generated revenues at the level of the previous year.
For ADP Group, this is a first year of complete production of components for new models of vehicles
which is reflected in revenue growth in 2015 according to previous announcements.
A significant increase in profitability in ADP Group occurred due to:
• Revenue growth
• Improvement of overall cost-effectiveness,
• Reduction of the share of fixed costs in the structure of costs per unit of product due to an
increase in capacity utilization in Croatia,
Credit indebtedness of ADP Group on 30.06.2015 amounted to 447,8 milion HRK (the highest level of
indebtedness amounted to 510 milion HRK at the end of 3Q/14, that is bank debt was reduced by
62,2 million HRK in nine months) which represents a reduction in loan liabilities of 45,2 million HRK
compared to the end of last year.
Indicator 01.01.-
30.06.2015 01.01.-
30.06.2014
Sales revenue (thousands of HRK)
517.813 372.678
EBITDA (thousands of HRK) 62.302 21.346
Net profit (thousands of HRK)
27.007 3.299

3
Expectations in 2015
Results of the first half of year confirm the planned revenue growth of ADP Group in 2015 and we
still expect a revenue growth of at least 12% this year. As for profitability, we expect the EBITDA
margin of at least 11% in 2015 in total.
With the aim of getting a clearer picture of bussines of ADP Group, we prepared abbreviated
consolidated profit and loss account of ADP Group for the first half of 2014 and 2015 with
consolidated profit and loss account of associated companies Euro APS, Romania and FADP, Russia,
in which AD Plastik Inc. has 50% that is 40% of ownership.
Table 2. Profit and loss account of AD Plastik Group with consolidation of belonging part of
ownership in Euro APS and FADP for the first hal of 2014 and 2015 in thousands of HRK
As seen from Table 2., operating revenues of ADP Group with the consolidated correspoding part of
ownership in Euro APS and FADP recorded a growth of 17,5% in the first half this year compared to
the same period of the previous year. In the same period EBITDA recorded a qrowth of 55,2%
compared to the same period of the previous year and amounted in total 89,2 milion HRK.
Total loan liabilities of ADP Group with the corresponding part of ownership in Euro APS and FADP
are equal to total loan liabilities of ADP Group without consolidation of associated companies.
Associated companies do not have financial loan liabilities to outside entities, except liabilities per
loans obtained from the owners (Faurecia and AD Plastik).
POSITIONS
AD Plastik Group with
consolidation of
belonging part of
ownershipin EURO APS
and FADP
AD Plastik Group with
consolidation of
belonging part of
ownershipin EURO APS
and FADP
1H/2015 1H/2014
OPERATING REVENUES 761.729 648.048
OPERATING EXPENSES 715.235 626.911
Material expenses 473.417 373.803
Staff costs 121.059 118.617
Amortization 42.695 36.319
Other expenses 78.064 98.173
FINANCIAL INCOME 65.009 23.081
FINANCIAL EXPENSES 79.812 36.476
TOTAL REVENUE 826.738 671.129
TOTAL EXPENSES 795.047 663.387
Profit before taxation 31.691 7.742
Profit tax 4.684 4.443
PROFIT FOR THE PERIOD 27.007 3.299

4
Below we are presenting the most important events for the first quarter of 2015 per companies of
AD Plastik Group.
AD Plastik Inc, Solin
In the reporting period, the company generated sales revenues growth of over 50% compared to the
previous year with a different range of products compared to the plan. In the observed period the
phase of production running in was completed and the costs were optimized. There is an ongoing
continuous improvement aimed at raising the profitability in cooperation with our customers.
High capacity utilization along with optimization of costs reflected positively on growth in
profitability compared to the same period last year.
ADP Mladenovac, Serbia
ADP Mladenovac has achieved a sales revenue growth of 97% compared to the same period of the
previous year.
Particular emphasis is placed on the growth of the program FCA (Fiat Chrysler) which has
significantly increased due to extension of the assortment on grab handles and the program Revoz
which was launched in second quarter of 2014.
During the reporting period started the production by using injection molding technology which
rounded up the complete grab handles production process for Fiat and Renault – from injection
molding to assembly.
AO AD Plastik (ZAO PHR, Russia)
In late June the company name ZAO PHR was changed to AO AD Plastik. The revenues generated in
the first half of the year are higher than the revenues realized in the same period last year. The
largest impact on growth in sales was achieved due to growth in sales regarding programs Avtovaz
and Renault. Monthly updating of sales prices in accordance with the exchange rate fluctuations is
still being applied. Along with revenue growth and improvements of cost efficiency, this effected
positively on the operating results of the company in the first half of 2015.
The Company has achieved positive financial results in the first half of 2015, in contrast to the same
period last year.
ADP Kaluga, Russia
In the first half there was a decline in revenues compared to the revenues realized in the same
period last year. The main reason for the decrease in revenues is low capacity utilization of the
plant, as the result of the delay in start of production of a vehicle Renault Duster phasis 2.
The company realized a negative financial result in the reporting period, but better than in the
same period last year.
EURO APS, Romania
In the reporting period was achieved a stable production and sales compared to the planned values
with a high share of serial deliveries of the models Sandero and Duster and deliveries to Morocco,
Algeria, Iran and other markets. At the same time, by optimizing the production, it was achieved a
result better than the planned one.
5
FADP Luga, Russia
Achieved sales has exceeded the plan by 7%, as a result of changes in exchange rates and
adjustments in selling prices. The activities of plant preparation for the acceptance of new projects
(interior positions for the vehicles Ford Fiesta an Ecosport, and Nissan X-trail) and the increase in
capacity utilization of the company are in process.
On 30.06.2015 the Group had 3.026 employees, out of that 1.239 in the parent company AD Plastik
Inc. Solin.
In the Group`s balance sheet positions relative to December 31st, 2014 the greatest changes were
recorded in these positions:
- (AOP 023) Participating interests (shares) (decrease of 30,0 milion HRK) – due to decision on the
payment of dividends;;
- (AOP 045) Trade receivables (decrease of 13,6 milion HRK) – mainly due to the finalization of
projects and charging of development activities from customers;
- (AOP 046) Receivables from participating companies (increase of 26,1 milion HRK) – mainly due
to the calculation of Euro APS dividend;
- (AOP 049) Other receivables (increase of 25 milion HRK) – largely because of advances given to
manufacturers of tools;
- (AOP 086 i 096) Short-term and long-term debts towards banks and other financial institutions
(net effect of reduction 45,2 milion HRK) - due to the closure of part of the loans that were
related to the financing of tool making and reprogramming of part of short-term loans into long-
term;
- (AOP 098) Accounts payable (decrease of 29,5 milion HRK) - due to a completion of a larger part
of investments;
Results of associated companies EAPS Romania and FADP Holding France are included in the Group
result under the equity method.

6
b) Financial reports of AD Plastik Group
7
01.01.2015. till 30.06.2015.
406
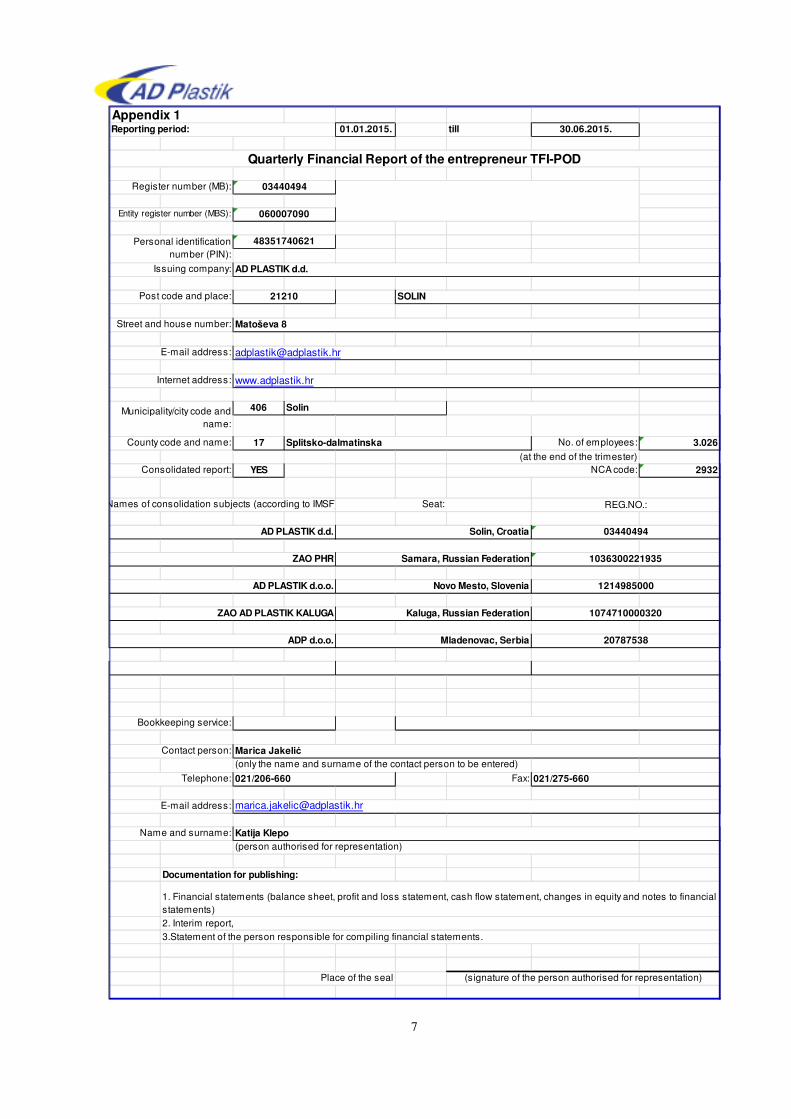
17 No. of employees: 3.026
(at the end of the trimester)
YES 2932
(only the name and surname of the contact person to be entered)
Fax:
Place of the seal
E-mail address: [email protected]
Name and surname: Katija Klepo
Documentation for publishing:
1. Financial statements (balance sheet, profit and loss statement, cash flow statement, changes in equity and notes to financial
statements)
2. Interim report,
3.Statement of the person responsible for compiling financial statements.
(signature of the person authorised for representation)
Contact person:
Bookkeeping service:
Telephone: 021/206-660 021/275-660
Appendix 1
(person authorised for representation)
Marica Jakelić
ADP d.o.o. Mladenovac, Serbia 20787538
AD PLASTIK d.o.o. Novo Mesto, Slovenia 1214985000
ZAO AD PLASTIK KALUGA Kaluga, Russian Federation 1074710000320
AD PLASTIK d.d. Solin, Croatia 03440494
ZAO PHR Samara, Russian Federation 1036300221935
Consolidated report: NCA code:
Names of consolidation subjects (according to IMSF): Seat: REG.NO.:
SolinMunicipality/city code and
name:
County code and name: Splitsko-dalmatinska
Street and house number: Matoševa 8
E-mail address: [email protected]
Internet address: www.adplastik.hr
Issuing company: AD PLASTIK d.d.
Post code and place: 21210 SOLIN
Personal identification
number (PIN):
48351740621
Reporting period:
Quarterly Financial Report of the entrepreneur TFI-POD
Register number (MB): 03440494
Entity register number (MBS): 060007090
8
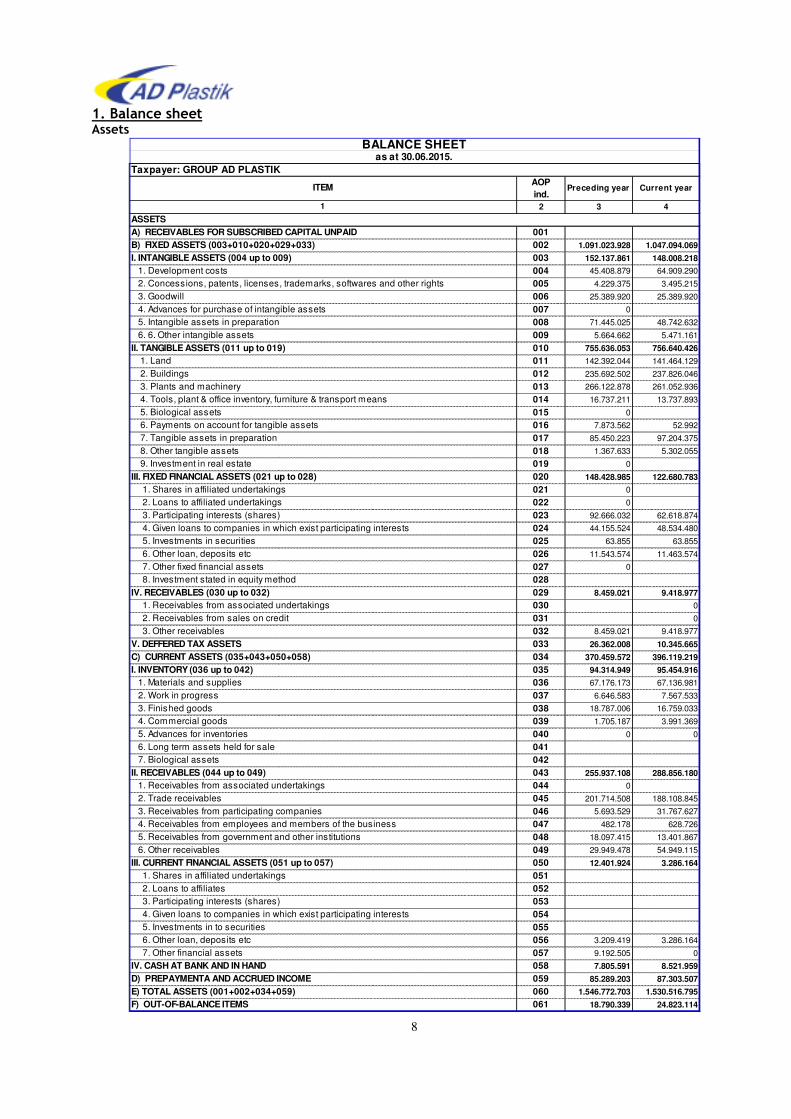
1. Balance sheet Assets
AOPind.
Preceding year Current year
2 3 4
001002 1.091.023.928 1.047.094.069
003 152.137.861 148.008.218
004 45.408.879 64.909.290
005 4.229.375 3.495.215
006 25.389.920 25.389.920
007 0
008 71.445.025 48.742.632
009 5.664.662 5.471.161
010 755.636.053 756.640.426
011 142.392.044 141.464.129
012 235.692.502 237.826.046
013 266.122.878 261.052.936
014 16.737.211 13.737.893
015 0
016 7.873.562 52.992
017 85.450.223 97.204.375
018 1.367.633 5.302.055
019 0
020 148.428.985 122.680.783
021 0
022 0
023 92.666.032 62.618.874
024 44.155.524 48.534.480
025 63.855 63.855
026 11.543.574 11.463.574
027 0
028029 8.459.021 9.418.977
030 0
031 0
032 8.459.021 9.418.977
033 26.362.008 10.345.665
034 370.459.572 396.119.219
035 94.314.949 95.454.916
036 67.176.173 67.136.981
037 6.646.583 7.567.533
038 18.787.006 16.759.033
039 1.705.187 3.991.369
040 0 0
041042043 255.937.108 288.856.180
044 0
045 201.714.508 188.108.845
046 5.693.529 31.767.627
047 482.178 628.726
048 18.097.415 13.401.867
049 29.949.478 54.949.115
050 12.401.924 3.286.164
051052053054055056 3.209.419 3.286.164
057 9.192.505 0
058 7.805.591 8.521.959
059 85.289.203 87.303.507
060 1.546.772.703 1.530.516.795
061 18.790.339 24.823.114
BALANCE SHEETas at 30.06.2015.
Taxpayer: GROUP AD PLASTIK
ITEM
4. Advances for purchase of intangible assets
5. Intangible assets in preparation
6. 6. Other intangible assets
II. TANGIBLE ASSETS (011 up to 019)
I. INTANGIBLE ASSETS (004 up to 009) 1. Development costs
2. Concessions, patents, licenses, trademarks, softwares and other rights
3. Goodwill
1
ASSETSA) RECEIVABLES FOR SUBSCRIBED CAPITAL UNPAIDB) FIXED ASSETS (003+010+020+029+033)
9. Investment in real estate
III. FIXED FINANCIAL ASSETS (021 up to 028) 1. Shares in affiliated undertakings
2. Loans to affiliated undertakings
5. Biological assets
6. Payments on account for tangible assets
7. Tangible assets in preparation
8. Other tangible assets
1. Land
2. Buildings
3. Plants and machinery
4. Tools, plant & office inventory, furniture & transport means
2. Receivables from sales on credit
3. Other receivables
V. DEFFERED TAX ASSETSC) CURRENT ASSETS (035+043+050+058)
7. Other fixed financial assets
8. Investment stated in equity method
IV. RECEIVABLES (030 up to 032) 1. Receivables from associated undertakings
3. Participating interests (shares)
4. Given loans to companies in which exist participating interests
5. Investments in securities
6. Other loan, deposits etc
II. RECEIVABLES (044 up to 049) 1. Receivables from associated undertakings
2. Trade receivables
3. Receivables from participating companies
4. Commercial goods
5. Advances for inventories
6. Long term assets held for sale
7. Biological assets
I. INVENTORY (036 up to 042) 1. Materials and supplies
2. Work in progress
3. Finished goods
5. Investments in to securities
6. Other loan, deposits etc
7. Other financial assets
IV. CASH AT BANK AND IN HAND
1. Shares in affiliated undertakings
2. Loans to affiliates
3. Participating interests (shares)
4. Given loans to companies in which exist participating interests
4. Receivables from employees and members of the business
5. Receivables from government and other institutions
6. Other receivables
III. CURRENT FINANCIAL ASSETS (051 up to 057)
D) PREPAYMENTA AND ACCRUED INCOMEE) TOTAL ASSETS (001+002+034+059)F) OUT-OF-BALANCE ITEMS
9
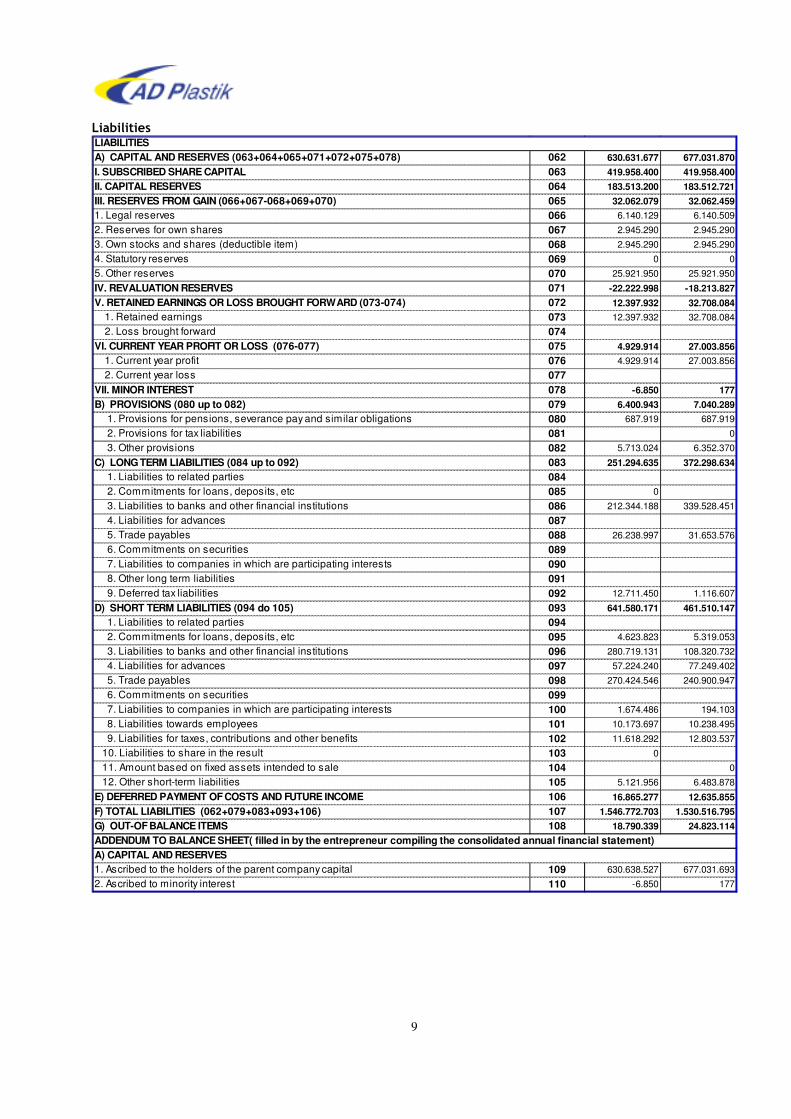
Liabilities
062 630.631.677 677.031.870
063 419.958.400 419.958.400
064 183.513.200 183.512.721
065 32.062.079 32.062.459
066 6.140.129 6.140.509
067 2.945.290 2.945.290
068 2.945.290 2.945.290
069 0 0
070 25.921.950 25.921.950
071 -22.222.998 -18.213.827
072 12.397.932 32.708.084
073 12.397.932 32.708.084
074075 4.929.914 27.003.856
076 4.929.914 27.003.856
077078 -6.850 177
079 6.400.943 7.040.289
080 687.919 687.919
081 0
082 5.713.024 6.352.370
083 251.294.635 372.298.634
084085 0
086 212.344.188 339.528.451
087088 26.238.997 31.653.576
089090091092 12.711.450 1.116.607
093 641.580.171 461.510.147
094095 4.623.823 5.319.053
096 280.719.131 108.320.732
097 57.224.240 77.249.402
098 270.424.546 240.900.947
099100 1.674.486 194.103
101 10.173.697 10.238.495
102 11.618.292 12.803.537
103 0
104 0
105 5.121.956 6.483.878
106 16.865.277 12.635.855
107 1.546.772.703 1.530.516.795
108 18.790.339 24.823.114
109 630.638.527 677.031.693
110 -6.850 177
1. Legal reserves
2. Reserves for own shares
3. Own stocks and shares (deductible item)
4. Statutory reserves
A) CAPITAL AND RESERVES (063+064+065+071+072+075+078)I. SUBSCRIBED SHARE CAPITALII. CAPITAL RESERVESIII. RESERVES FROM GAIN (066+067-068+069+070)
LIABILITIES
VII. MINOR INTERESTB) PROVISIONS (080 up to 082) 1. Provisions for pensions, severance pay and similar obligations
2. Provisions for tax liabilities
2. Loss brought forward
VI. CURRENT YEAR PROFIT OR LOSS (076-077)1. Current year profit
2. Current year loss
5. Other reserves
IV. REVALUATION RESERVESV. RETAINED EARNINGS OR LOSS BROUGHT FORWARD (073-074)
1. Retained earnings
7. Liabilities to companies in which are participating interests
8. Other long term liabilities
9. Deferred tax liabilities
D) SHORT TERM LIABILITIES (094 do 105)
3. Liabilities to banks and other financial institutions
4. Liabilities for advances
5. Trade payables
6. Commitments on securities
3. Other provisions
C) LONG TERM LIABILITIES (084 up to 092) 1. Liabilities to related parties
2. Commitments for loans, deposits, etc
9. Liabilities for taxes, contributions and other benefits
10. Liabilities to share in the result
11. Amount based on fixed assets intended to sale
12. Other short-term liabilities
5. Trade payables
6. Commitments on securities
7. Liabilities to companies in which are participating interests
8. Liabilities towards employees
1. Liabilities to related parties
2. Commitments for loans, deposits, etc
3. Liabilities to banks and other financial institutions
4. Liabilities for advances
G) OUT-OF BALANCE ITEMSADDENDUM TO BALANCE SHEET( filled in by the entrepreneur compiling the consolidated annual financial statement)A) CAPITAL AND RESERVES1. Ascribed to the holders of the parent company capital
E) DEFERRED PAYMENT OF COSTS AND FUTURE INCOMEF) TOTAL LIABILITIES (062+079+083+093+106)
2. Ascribed to minority interest
10
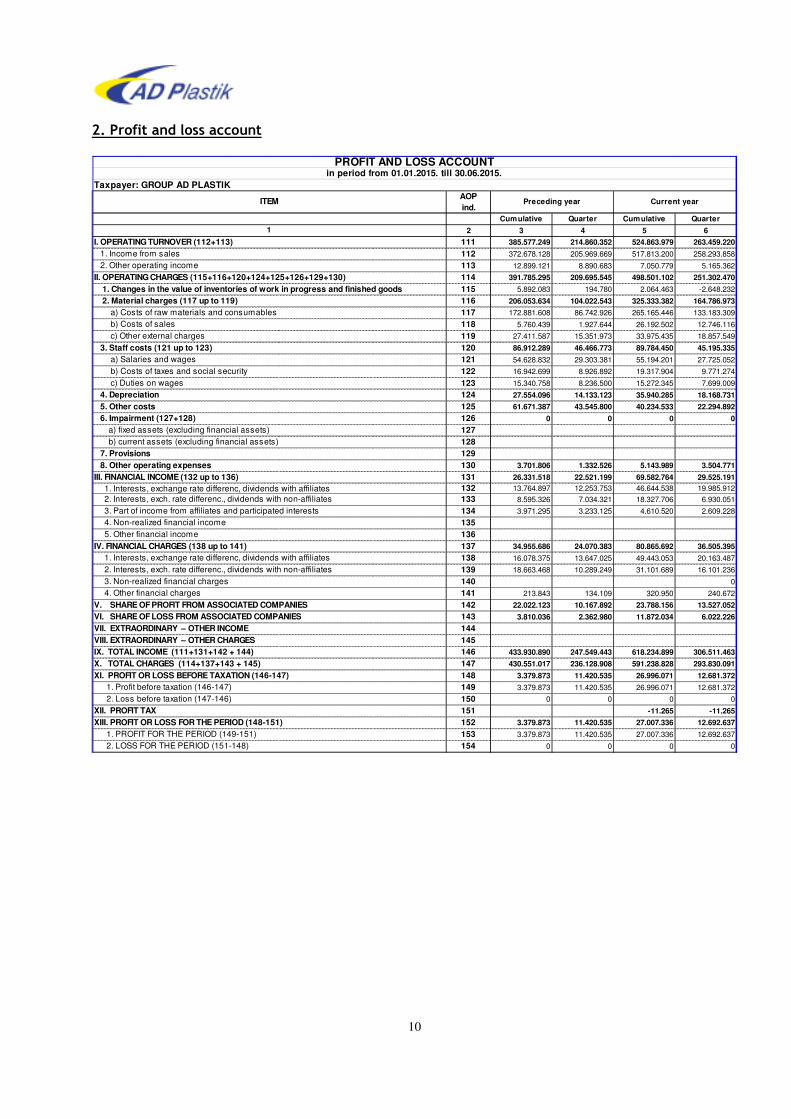
2. Profit and loss account
AOPind.
Cumulative Quarter Cumulative Quarter
2 3 4 5 6
111 385.577.249 214.860.352 524.863.979 263.459.220
112 372.678.128 205.969.669 517.813.200 258.293.858
113 12.899.121 8.890.683 7.050.779 5.165.362
114 391.785.295 209.695.545 498.501.102 251.302.470
115 5.892.083 194.780 2.064.463 -2.648.232
116 206.053.634 104.022.543 325.333.382 164.786.973
117 172.881.608 86.742.926 265.165.446 133.183.309
118 5.760.439 1.927.644 26.192.502 12.746.116
119 27.411.587 15.351.973 33.975.435 18.857.549
120 86.912.289 46.466.773 89.784.450 45.195.335
121 54.628.832 29.303.381 55.194.201 27.725.052
122 16.942.699 8.926.892 19.317.904 9.771.274
123 15.340.758 8.236.500 15.272.345 7.699.009
124 27.554.096 14.133.123 35.940.285 18.168.731
125 61.671.387 43.545.800 40.234.533 22.294.892
126 0 0 0 0
127128129130 3.701.806 1.332.526 5.143.989 3.504.771
131 26.331.518 22.521.199 69.582.764 29.525.191
132 13.764.897 12.253.753 46.644.538 19.985.912
133 8.595.326 7.034.321 18.327.706 6.930.051
134 3.971.295 3.233.125 4.610.520 2.609.228
135136137 34.955.686 24.070.383 80.865.692 36.505.395
138 16.078.375 13.647.025 49.443.053 20.163.487
139 18.663.468 10.289.249 31.101.689 16.101.236
140 0
141 213.843 134.109 320.950 240.672
142 22.022.123 10.167.892 23.788.156 13.527.052
143 3.810.036 2.362.980 11.872.034 6.022.226
144145146 433.930.890 247.549.443 618.234.899 306.511.463
147 430.551.017 236.128.908 591.238.828 293.830.091
148 3.379.873 11.420.535 26.996.071 12.681.372
149 3.379.873 11.420.535 26.996.071 12.681.372
150 0 0 0 0
151 -11.265 -11.265
152 3.379.873 11.420.535 27.007.336 12.692.637
153 3.379.873 11.420.535 27.007.336 12.692.637
154 0 0 0 0
2. Other operating income
Preceding year Current year
Taxpayer: GROUP AD PLASTIK
ITEM
1
I. OPERATING TURNOVER (112+113) 1. Income from sales
b) Costs of sales
c) Other external charges
3. Staff costs (121 up to 123) a) Salaries and wages
II. OPERATING CHARGES (115+116+120+124+125+126+129+130) 1. Changes in the value of inventories of work in progress and finished goods 2. Material charges (117 up to 119) a) Costs of raw materials and consumables
6. Impairment (127+128) a) fixed assets (excluding financial assets)
b) current assets (excluding financial assets)
7. Provisions
b) Costs of taxes and social security
c) Duties on wages
4. Depreciation 5. Other costs
3. Part of income from affiliates and participated interests
4. Non-realized financial income
5. Other financial income
IV. FINANCIAL CHARGES (138 up to 141)
8. Other operating expensesIII. FINANCIAL INCOME (132 up to 136) 1. Interests, exchange rate differenc, dividends with affiliates
2. Interests, exch. rate differenc., dividends with non-affiliates
V. SHARE OF PROFIT FROM ASSOCIATED COMPANIES VI. SHARE OF LOSS FROM ASSOCIATED COMPANIES VII. EXTRAORDINARY – OTHER INCOMEVIII. EXTRAORDINARY – OTHER CHARGES
1. Interests, exchange rate differenc, dividends with affiliates
2. Interests, exch. rate differenc., dividends with non-affiliates
3. Non-realized financial charges
4. Other financial charges
2. Loss before taxation (147-146)
XII. PROFIT TAXXIII. PROFIT OR LOSS FOR THE PERIOD (148-151)
1. PROFIT FOR THE PERIOD (149-151)
IX. TOTAL INCOME (111+131+142 + 144)X. TOTAL CHARGES (114+137+143 + 145)XI. PROFIT OR LOSS BEFORE TAXATION (146-147)
1. Profit before taxation (146-147)
2. LOSS FOR THE PERIOD (151-148)
in period from 01.01.2015. till 30.06.2015.PROFIT AND LOSS ACCOUNT
11
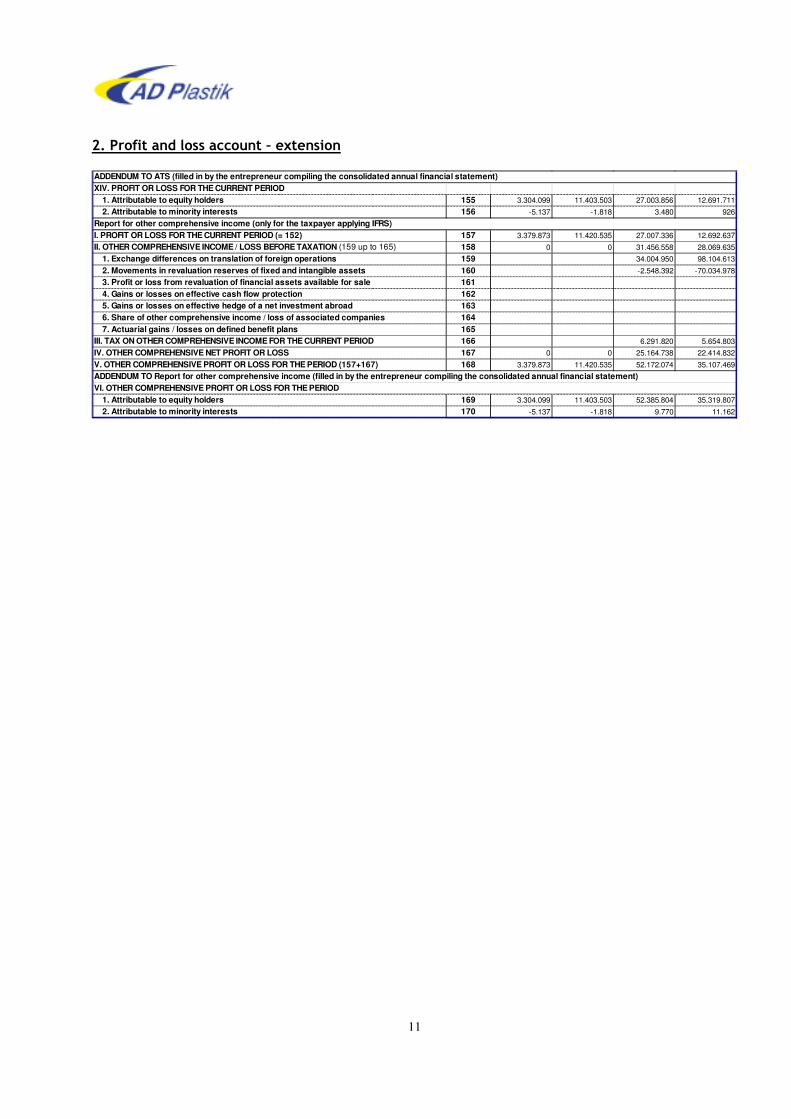
2. Profit and loss account – extension
155 3.304.099 11.403.503 27.003.856 12.691.711
156 -5.137 -1.818 3.480 926
157 3.379.873 11.420.535 27.007.336 12.692.637
158 0 0 31.456.558 28.069.635
159 34.004.950 98.104.613
160 -2.548.392 -70.034.978
161162163164165166 6.291.820 5.654.803
167 0 0 25.164.738 22.414.832
168 3.379.873 11.420.535 52.172.074 35.107.469
169 3.304.099 11.403.503 52.385.804 35.319.807
170 -5.137 -1.818 9.770 11.162
2. Attributable to minority interests
I. PROFIT OR LOSS FOR THE CURRENT PERIOD (= 152)Report for other comprehensive income (only for the taxpayer applying IFRS)
II. OTHER COMPREHENSIVE INCOME / LOSS BEFORE TAXATION (159 up to 165)
ADDENDUM TO ATS (filled in by the entrepreneur compiling the consolidated annual financial statement)XIV. PROFIT OR LOSS FOR THE CURRENT PERIOD
1. Attributable to equity holders
2. Attributable to minority interests
III. TAX ON OTHER COMPREHENSIVE INCOME FOR THE CURRENT PERIOD IV. OTHER COMPREHENSIVE NET PROFIT OR LOSSV. OTHER COMPREHENSIVE PROFIT OR LOSS FOR THE PERIOD (157+167)ADDENDUM TO Report for other comprehensive income (filled in by the entrepreneur compiling the consolidated annual financial statement)VI. OTHER COMPREHENSIVE PROFIT OR LOSS FOR THE PERIOD
5. Gains or losses on effective hedge of a net investment abroad 6. Share of other comprehensive income / loss of associated companies 7. Actuarial gains / losses on defined benefit plans
1. Attributable to equity holders
1. Exchange differences on translation of foreign operations 2. Movements in revaluation reserves of fixed and intangible assets 3. Profit or loss from revaluation of financial assets available for sale 4. Gains or losses on effective cash flow protection
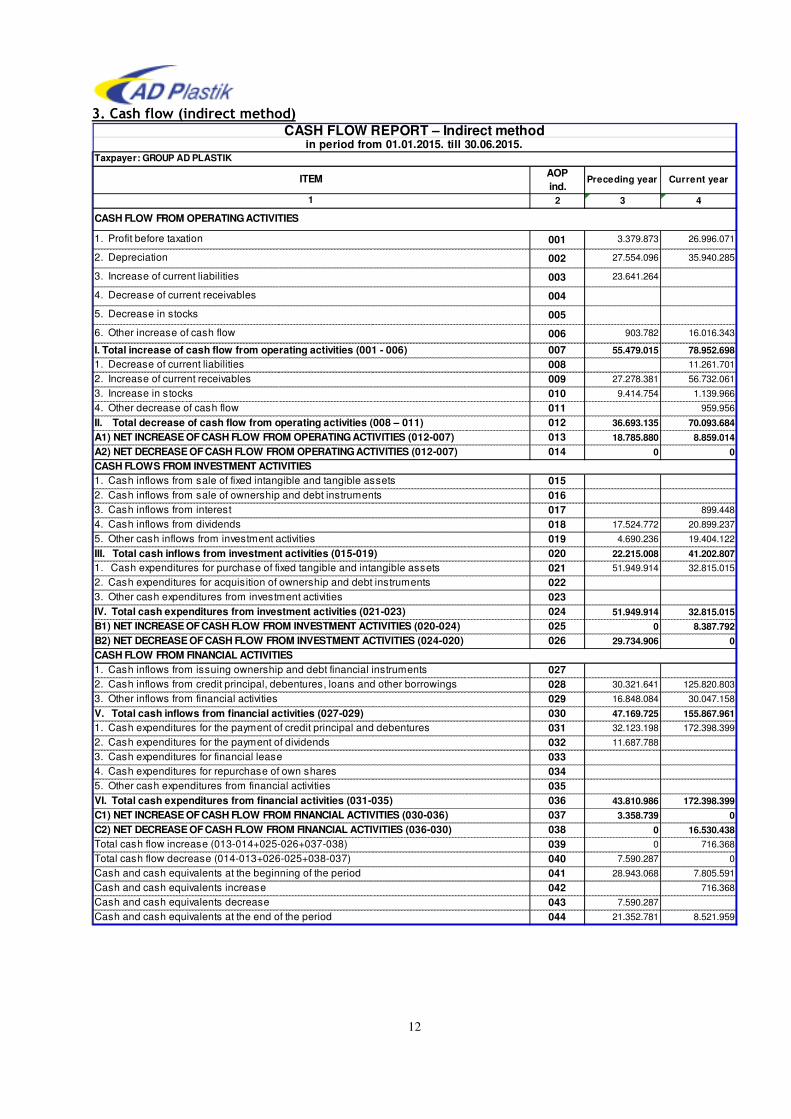
12
3. Cash flow (indirect method)
AOPind.
Preceding year Current year
2 3 4
001 3.379.873 26.996.071
002 27.554.096 35.940.285
003 23.641.264
004
005
006 903.782 16.016.343
007 55.479.015 78.952.698
008 11.261.701
009 27.278.381 56.732.061
010 9.414.754 1.139.966
011 959.956
012 36.693.135 70.093.684
013 18.785.880 8.859.014
014 0 0
015016017 899.448
018 17.524.772 20.899.237
019 4.690.236 19.404.122
020 22.215.008 41.202.807
021 51.949.914 32.815.015
022023024 51.949.914 32.815.015
025 0 8.387.792
026 29.734.906 0
027028 30.321.641 125.820.803
029 16.848.084 30.047.158
030 47.169.725 155.867.961
031 32.123.198 172.398.399
032 11.687.788
033034035036 43.810.986 172.398.399
037 3.358.739 0
038 0 16.530.438
039 0 716.368
040 7.590.287 0
041 28.943.068 7.805.591
042 716.368
043 7.590.287
044 21.352.781 8.521.959
Taxpayer: GROUP AD PLASTIK
CASH FLOW REPORT – Indirect methodin period from 01.01.2015. till 30.06.2015.
ITEM
3. Increase of current liabilities
5. Decrease in stocks
6. Other increase of cash flow
1
CASH FLOW FROM OPERATING ACTIVITIES
1. Profit before taxation
2. Depreciation
4. Decrease of current receivables
4. Other decrease of cash flow
II. Total decrease of cash flow from operating activities (008 – 011)A1) NET INCREASE OF CASH FLOW FROM OPERATING ACTIVITIES (012-007)A2) NET DECREASE OF CASH FLOW FROM OPERATING ACTIVITIES (012-007)
I. Total increase of cash flow from operating activities (001 - 006)1. Decrease of current liabilities
2. Increase of current receivables
3. Increase in stocks
4. Cash inflows from dividends
5. Other cash inflows from investment activities
III. Total cash inflows from investment activities (015-019)1. Cash expenditures for purchase of fixed tangible and intangible assets
CASH FLOWS FROM INVESTMENT ACTIVITIES1. Cash inflows from sale of fixed intangible and tangible assets
2. Cash inflows from sale of ownership and debt instruments
3. Cash inflows from interest
B2) NET DECREASE OF CASH FLOW FROM INVESTMENT ACTIVITIES (024-020)CASH FLOW FROM FINANCIAL ACTIVITIES1. Cash inflows from issuing ownership and debt financial instruments
2. Cash inflows from credit principal, debentures, loans and other borrowings
2. Cash expenditures for acquisition of ownership and debt instruments
3. Other cash expenditures from investment activities
IV. Total cash expenditures from investment activities (021-023)B1) NET INCREASE OF CASH FLOW FROM INVESTMENT ACTIVITIES (020-024)
3. Cash expenditures for financial lease
4. Cash expenditures for repurchase of own shares
5. Other cash expenditures from financial activities
VI. Total cash expenditures from financial activities (031-035)
3. Other inflows from financial activities
V. Total cash inflows from financial activities (027-029)1. Cash expenditures for the payment of credit principal and debentures
2. Cash expenditures for the payment of dividends
C1) NET INCREASE OF CASH FLOW FROM FINANCIAL ACTIVITIES (030-036)C2) NET DECREASE OF CASH FLOW FROM FINANCIAL ACTIVITIES (036-030)Total cash flow increase (013-014+025-026+037-038)
Cash and cash equivalents at the end of the period
Total cash flow decrease (014-013+026-025+038-037)
Cash and cash equivalents at the beginning of the period
Cash and cash equivalents increase
Cash and cash equivalents decrease
13
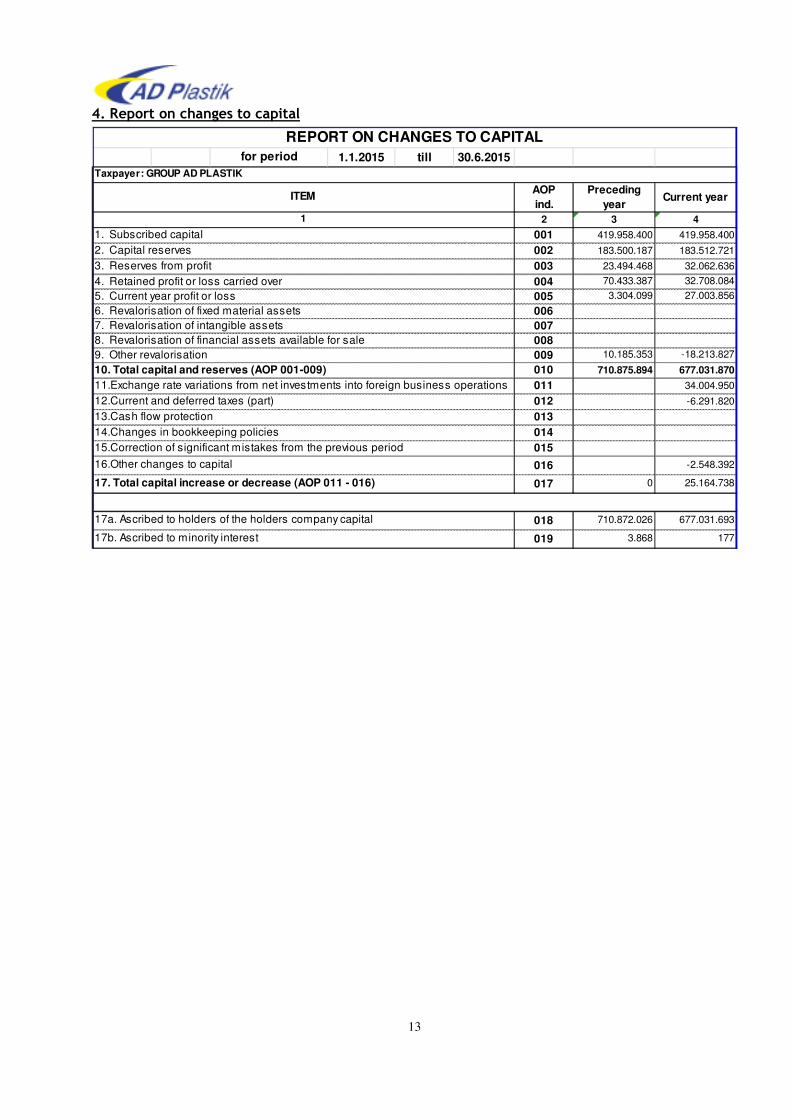
4. Report on changes to capital
1.1.2015 till 30.6.2015
AOPind.
Preceding year
Current year
2 3 4
001 419.958.400 419.958.400
002 183.500.187 183.512.721
003 23.494.468 32.062.636
004 70.433.387 32.708.084
005 3.304.099 27.003.856
006007008009 10.185.353 -18.213.827
010 710.875.894 677.031.870
011 34.004.950
012 -6.291.820
013014015
016 -2.548.392
017 0 25.164.738
018 710.872.026 677.031.693
019 3.868 177
17a. Ascribed to holders of the holders company capital
17b. Ascribed to minority interest
REPORT ON CHANGES TO CAPITAL
15.Correction of significant mistakes from the previous period
16.Other changes to capital
17. Total capital increase or decrease (AOP 011 - 016)
11.Exchange rate variations from net investments into foreign business operations
12.Current and deferred taxes (part)
13.Cash flow protection
14.Changes in bookkeeping policies
7. Revalorisation of intangible assets
8. Revalorisation of financial assets available for sale
9. Other revalorisation
10. Total capital and reserves (AOP 001-009)
2. Capital reserves
3. Reserves from profit
4. Retained profit or loss carried over
5. Current year profit or loss
6. Revalorisation of fixed material assets
for period
ITEM
1
1. Subscribed capital
Taxpayer: GROUP AD PLASTIK

14
c) Financial reports of the Company AD Plastik Inc. Solin

15
01.01.2015. till 30.06.2015.
406
17 No. of employees: 1.239
(at the end of the trimester)
NO 2932
(only the name and surname of the contact person to be entered)
Fax:
Place of the seal
Personal identification
number (PIN):
48351740621
Reporting period:
Quarterly Financial Report of the entrepreneur TFI-POD
Register number (MB): 03440494
Entity register number (MBS): 060007090
Issuing company: AD PLASTIK d.d.
Post code and place: 21210 SOLIN
Street and house number: MATOŠEVA 8
E-mail address: [email protected]
Internet address: www.adplastik.hr
SOLINMunicipality/city code and
name:
County code and name: SPLITSKO-DALMATINSKA
Consolidated report: NCA code:
Names of consolidation subjects (according to IMSF): Seat: REG.NO.:
Appendix 1
(person authorised for representation)
Marica JakelićContact person:
Bookkeeping service:
Telephone: 021/206-660 021/275-660
E-mail address: [email protected]
Name and surname: Katija Klepo
Documentation for publishing:
1. Financial statements (balance sheet, profit and loss statement, cash flow statement, changes in equity and notes to financial
statements)
2. Interim report,
3.Statement of the person responsible for compiling financial statements.
(signature of the person authorised for representation)
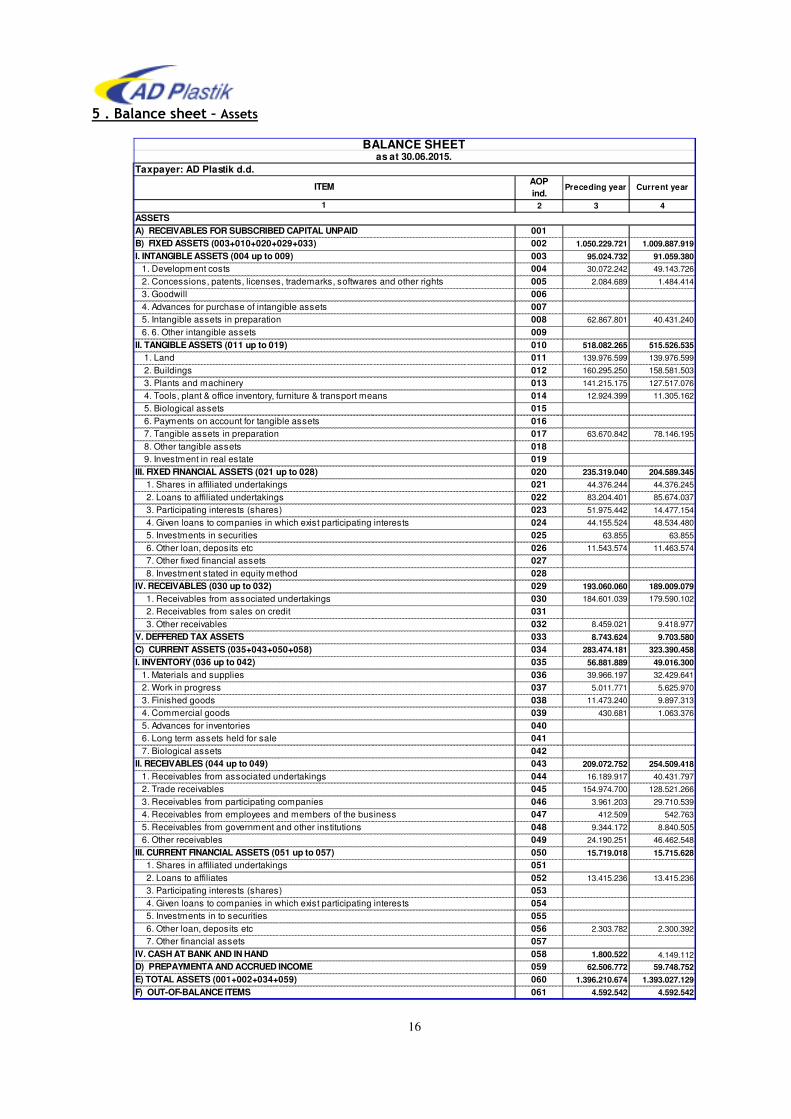
16
5 . Balance sheet – Assets
AOPind.
Preceding year Current year
2 3 4
001002 1.050.229.721 1.009.887.919
003 95.024.732 91.059.380
004 30.072.242 49.143.726
005 2.084.689 1.484.414
006007008 62.867.801 40.431.240
009010 518.082.265 515.526.535
011 139.976.599 139.976.599
012 160.295.250 158.581.503
013 141.215.175 127.517.076
014 12.924.399 11.305.162
015016017 63.670.842 78.146.195
018019020 235.319.040 204.589.345
021 44.376.244 44.376.245
022 83.204.401 85.674.037
023 51.975.442 14.477.154
024 44.155.524 48.534.480
025 63.855 63.855
026 11.543.574 11.463.574
027028029 193.060.060 189.009.079
030 184.601.039 179.590.102
031032 8.459.021 9.418.977
033 8.743.624 9.703.580
034 283.474.181 323.390.458
035 56.881.889 49.016.300
036 39.966.197 32.429.641
037 5.011.771 5.625.970
038 11.473.240 9.897.313
039 430.681 1.063.376
040041042043 209.072.752 254.509.418
044 16.189.917 40.431.797
045 154.974.700 128.521.266
046 3.961.203 29.710.539
047 412.509 542.763
048 9.344.172 8.840.505
049 24.190.251 46.462.548
050 15.719.018 15.715.628
051052 13.415.236 13.415.236
053054055056 2.303.782 2.300.392
057058 1.800.522 4.149.112
059 62.506.772 59.748.752
060 1.396.210.674 1.393.027.129
061 4.592.542 4.592.542
D) PREPAYMENTA AND ACCRUED INCOMEE) TOTAL ASSETS (001+002+034+059)F) OUT-OF-BALANCE ITEMS
5. Investments in to securities
6. Other loan, deposits etc
7. Other financial assets
IV. CASH AT BANK AND IN HAND
1. Shares in affiliated undertakings
2. Loans to affiliates
3. Participating interests (shares)
4. Given loans to companies in which exist participating interests
4. Receivables from employees and members of the business
5. Receivables from government and other institutions
6. Other receivables
III. CURRENT FINANCIAL ASSETS (051 up to 057)
II. RECEIVABLES (044 up to 049) 1. Receivables from associated undertakings
2. Trade receivables
3. Receivables from participating companies
4. Commercial goods
5. Advances for inventories
6. Long term assets held for sale
7. Biological assets
I. INVENTORY (036 up to 042) 1. Materials and supplies
2. Work in progress
3. Finished goods
2. Receivables from sales on credit
3. Other receivables
V. DEFFERED TAX ASSETSC) CURRENT ASSETS (035+043+050+058)
7. Other fixed financial assets
8. Investment stated in equity method
IV. RECEIVABLES (030 up to 032) 1. Receivables from associated undertakings
3. Participating interests (shares)
4. Given loans to companies in which exist participating interests
5. Investments in securities
6. Other loan, deposits etc
9. Investment in real estate
III. FIXED FINANCIAL ASSETS (021 up to 028) 1. Shares in affiliated undertakings
2. Loans to affiliated undertakings
5. Biological assets
6. Payments on account for tangible assets
7. Tangible assets in preparation
8. Other tangible assets
1. Land
2. Buildings
3. Plants and machinery
4. Tools, plant & office inventory, furniture & transport means
BALANCE SHEETas at 30.06.2015.
Taxpayer: AD Plastik d.d.
ITEM
4. Advances for purchase of intangible assets
5. Intangible assets in preparation
1
ASSETSA) RECEIVABLES FOR SUBSCRIBED CAPITAL UNPAIDB) FIXED ASSETS (003+010+020+029+033)
6. 6. Other intangible assets
II. TANGIBLE ASSETS (011 up to 019)
I. INTANGIBLE ASSETS (004 up to 009) 1. Development costs
2. Concessions, patents, licenses, trademarks, softwares and other rights
3. Goodwill
17
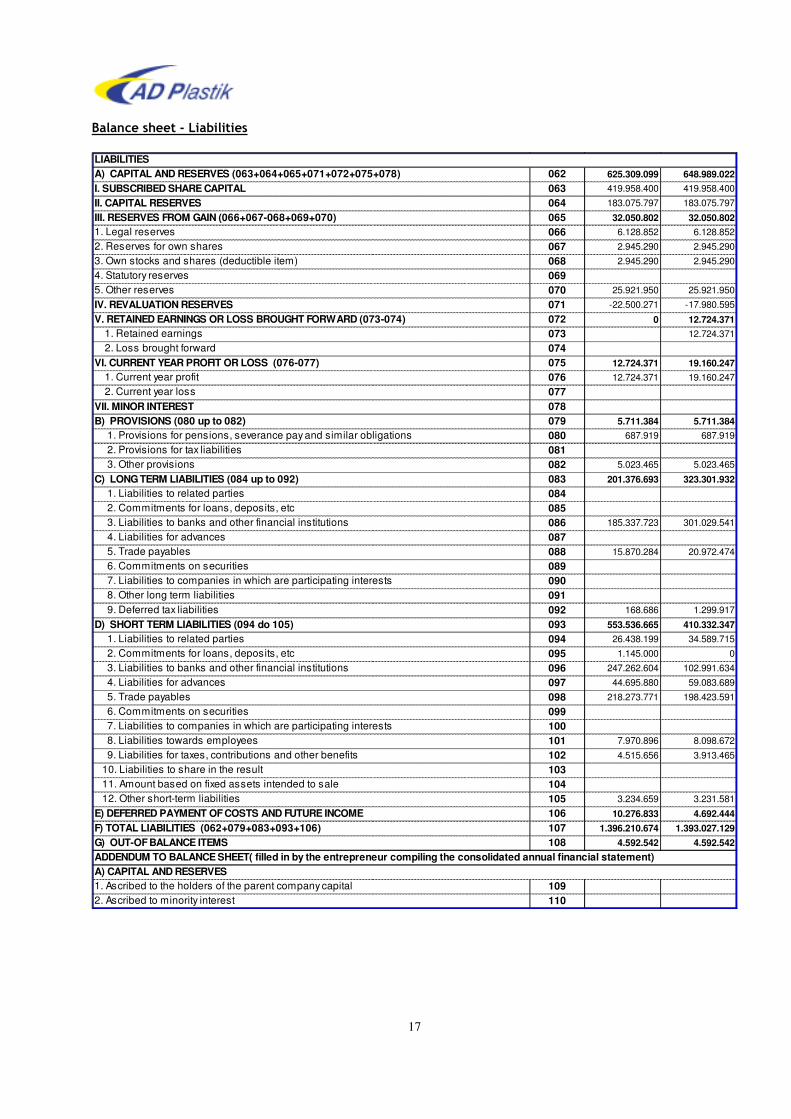
Balance sheet - Liabilities
062 625.309.099 648.989.022
063 419.958.400 419.958.400
064 183.075.797 183.075.797
065 32.050.802 32.050.802
066 6.128.852 6.128.852
067 2.945.290 2.945.290
068 2.945.290 2.945.290
069070 25.921.950 25.921.950
071 -22.500.271 -17.980.595
072 0 12.724.371
073 12.724.371
074075 12.724.371 19.160.247
076 12.724.371 19.160.247
077078079 5.711.384 5.711.384
080 687.919 687.919
081082 5.023.465 5.023.465
083 201.376.693 323.301.932
084085086 185.337.723 301.029.541
087088 15.870.284 20.972.474
089090091092 168.686 1.299.917
093 553.536.665 410.332.347
094 26.438.199 34.589.715
095 1.145.000 0
096 247.262.604 102.991.634
097 44.695.880 59.083.689
098 218.273.771 198.423.591
099100101 7.970.896 8.098.672
102 4.515.656 3.913.465
103104105 3.234.659 3.231.581
106 10.276.833 4.692.444
107 1.396.210.674 1.393.027.129
108 4.592.542 4.592.542
109110
G) OUT-OF BALANCE ITEMSADDENDUM TO BALANCE SHEET( filled in by the entrepreneur compiling the consolidated annual financial statement)A) CAPITAL AND RESERVES1. Ascribed to the holders of the parent company capital
E) DEFERRED PAYMENT OF COSTS AND FUTURE INCOMEF) TOTAL LIABILITIES (062+079+083+093+106)
2. Ascribed to minority interest
9. Liabilities for taxes, contributions and other benefits
10. Liabilities to share in the result
11. Amount based on fixed assets intended to sale
12. Other short-term liabilities
5. Trade payables
6. Commitments on securities
7. Liabilities to companies in which are participating interests
8. Liabilities towards employees
1. Liabilities to related parties
2. Commitments for loans, deposits, etc
3. Liabilities to banks and other financial institutions
4. Liabilities for advances
7. Liabilities to companies in which are participating interests
8. Other long term liabilities
9. Deferred tax liabilities
D) SHORT TERM LIABILITIES (094 do 105)
3. Liabilities to banks and other financial institutions
4. Liabilities for advances
5. Trade payables
6. Commitments on securities
3. Other provisions
C) LONG TERM LIABILITIES (084 up to 092) 1. Liabilities to related parties
2. Commitments for loans, deposits, etc
VII. MINOR INTERESTB) PROVISIONS (080 up to 082) 1. Provisions for pensions, severance pay and similar obligations
2. Provisions for tax liabilities
2. Loss brought forward
VI. CURRENT YEAR PROFIT OR LOSS (076-077)1. Current year profit
2. Current year loss
5. Other reserves
IV. REVALUATION RESERVESV. RETAINED EARNINGS OR LOSS BROUGHT FORWARD (073-074)
1. Retained earnings
1. Legal reserves
2. Reserves for own shares
3. Own stocks and shares (deductible item)
4. Statutory reserves
A) CAPITAL AND RESERVES (063+064+065+071+072+075+078)I. SUBSCRIBED SHARE CAPITALII. CAPITAL RESERVESIII. RESERVES FROM GAIN (066+067-068+069+070)
LIABILITIES
18
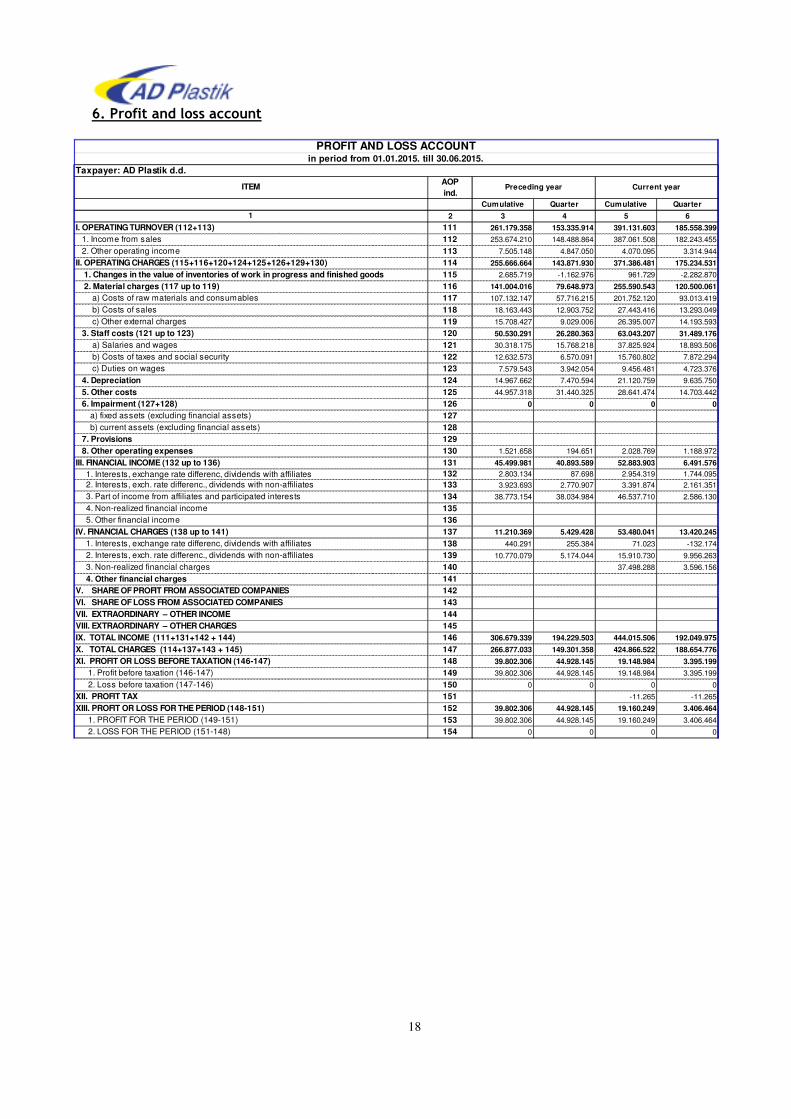
6. Profit and loss account
AOPind.
Cumulative Quarter Cumulative Quarter
2 3 4 5 6
111 261.179.358 153.335.914 391.131.603 185.558.399
112 253.674.210 148.488.864 387.061.508 182.243.455
113 7.505.148 4.847.050 4.070.095 3.314.944
114 255.666.664 143.871.930 371.386.481 175.234.531
115 2.685.719 -1.162.976 961.729 -2.282.870
116 141.004.016 79.648.973 255.590.543 120.500.061
117 107.132.147 57.716.215 201.752.120 93.013.419
118 18.163.443 12.903.752 27.443.416 13.293.049
119 15.708.427 9.029.006 26.395.007 14.193.593
120 50.530.291 26.280.363 63.043.207 31.489.176
121 30.318.175 15.768.218 37.825.924 18.893.506
122 12.632.573 6.570.091 15.760.802 7.872.294
123 7.579.543 3.942.054 9.456.481 4.723.376
124 14.967.662 7.470.594 21.120.759 9.635.750
125 44.957.318 31.440.325 28.641.474 14.703.442
126 0 0 0 0
127128129130 1.521.658 194.651 2.028.769 1.188.972
131 45.499.981 40.893.589 52.883.903 6.491.576
132 2.803.134 87.698 2.954.319 1.744.095
133 3.923.693 2.770.907 3.391.874 2.161.351
134 38.773.154 38.034.984 46.537.710 2.586.130
135136137 11.210.369 5.429.428 53.480.041 13.420.245
138 440.291 255.384 71.023 -132.174
139 10.770.079 5.174.044 15.910.730 9.956.263
140 37.498.288 3.596.156
141142143144145146 306.679.339 194.229.503 444.015.506 192.049.975
147 266.877.033 149.301.358 424.866.522 188.654.776
148 39.802.306 44.928.145 19.148.984 3.395.199
149 39.802.306 44.928.145 19.148.984 3.395.199
150 0 0 0 0
151 -11.265 -11.265
152 39.802.306 44.928.145 19.160.249 3.406.464
153 39.802.306 44.928.145 19.160.249 3.406.464
154 0 0 0 0
in period from 01.01.2015. till 30.06.2015.PROFIT AND LOSS ACCOUNT
2. LOSS FOR THE PERIOD (151-148)
2. Loss before taxation (147-146)
XII. PROFIT TAXXIII. PROFIT OR LOSS FOR THE PERIOD (148-151)
1. PROFIT FOR THE PERIOD (149-151)
IX. TOTAL INCOME (111+131+142 + 144)X. TOTAL CHARGES (114+137+143 + 145)XI. PROFIT OR LOSS BEFORE TAXATION (146-147)
1. Profit before taxation (146-147)
V. SHARE OF PROFIT FROM ASSOCIATED COMPANIES VI. SHARE OF LOSS FROM ASSOCIATED COMPANIES VII. EXTRAORDINARY – OTHER INCOMEVIII. EXTRAORDINARY – OTHER CHARGES
1. Interests, exchange rate differenc, dividends with affiliates
2. Interests, exch. rate differenc., dividends with non-affiliates
3. Non-realized financial charges
4. Other financial charges
3. Part of income from affiliates and participated interests
4. Non-realized financial income
5. Other financial income
IV. FINANCIAL CHARGES (138 up to 141)
8. Other operating expensesIII. FINANCIAL INCOME (132 up to 136) 1. Interests, exchange rate differenc, dividends with affiliates
2. Interests, exch. rate differenc., dividends with non-affiliates
6. Impairment (127+128) a) fixed assets (excluding financial assets)
b) current assets (excluding financial assets)
7. Provisions
b) Costs of taxes and social security
c) Duties on wages
4. Depreciation 5. Other costs
b) Costs of sales
c) Other external charges
3. Staff costs (121 up to 123) a) Salaries and wages
II. OPERATING CHARGES (115+116+120+124+125+126+129+130) 1. Changes in the value of inventories of work in progress and finished goods 2. Material charges (117 up to 119) a) Costs of raw materials and consumables
2. Other operating income
Preceding year Current year
Taxpayer: AD Plastik d.d.
ITEM
1
I. OPERATING TURNOVER (112+113) 1. Income from sales
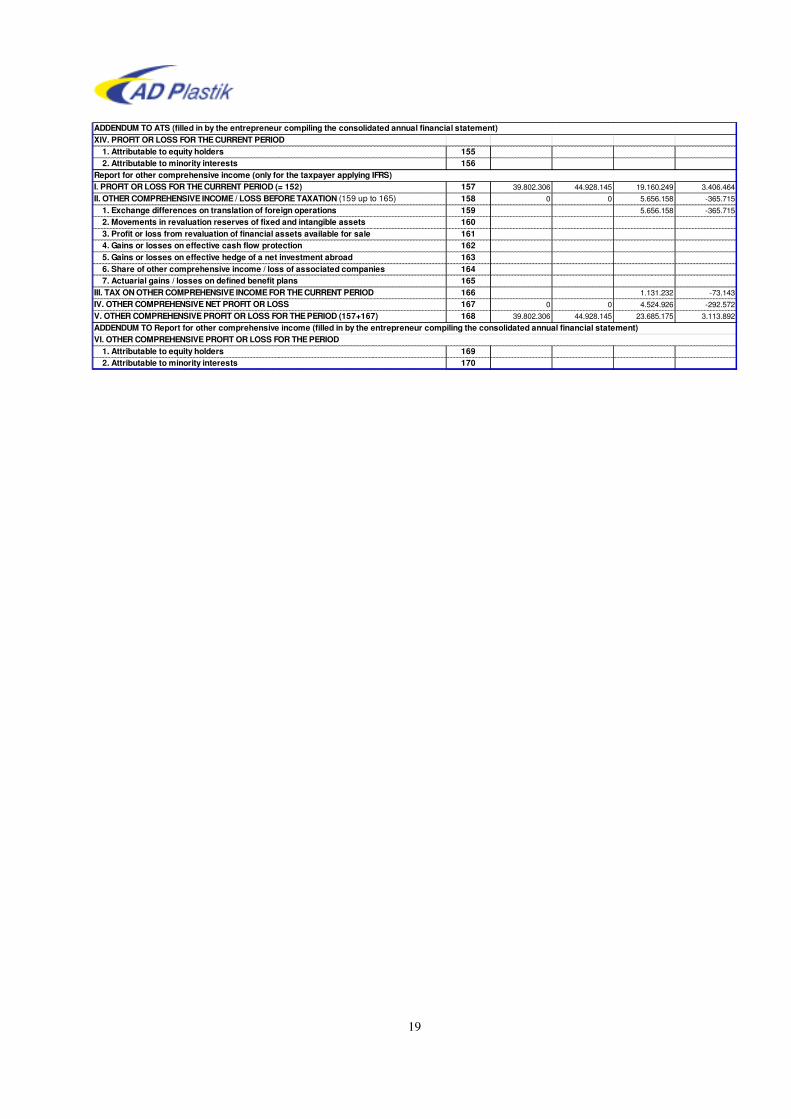
19
155156
157 39.802.306 44.928.145 19.160.249 3.406.464
158 0 0 5.656.158 -365.715
159 5.656.158 -365.715
160161162163164165166 1.131.232 -73.143
167 0 0 4.524.926 -292.572
168 39.802.306 44.928.145 23.685.175 3.113.892
1691702. Attributable to minority interests
III. TAX ON OTHER COMPREHENSIVE INCOME FOR THE CURRENT PERIOD IV. OTHER COMPREHENSIVE NET PROFIT OR LOSSV. OTHER COMPREHENSIVE PROFIT OR LOSS FOR THE PERIOD (157+167)ADDENDUM TO Report for other comprehensive income (filled in by the entrepreneur compiling the consolidated annual financial statement)VI. OTHER COMPREHENSIVE PROFIT OR LOSS FOR THE PERIOD
5. Gains or losses on effective hedge of a net investment abroad 6. Share of other comprehensive income / loss of associated companies 7. Actuarial gains / losses on defined benefit plans
1. Attributable to equity holders
1. Exchange differences on translation of foreign operations 2. Movements in revaluation reserves of fixed and intangible assets 3. Profit or loss from revaluation of financial assets available for sale 4. Gains or losses on effective cash flow protection
2. Attributable to minority interests
I. PROFIT OR LOSS FOR THE CURRENT PERIOD (= 152)Report for other comprehensive income (only for the taxpayer applying IFRS)
II. OTHER COMPREHENSIVE INCOME / LOSS BEFORE TAXATION (159 up to 165)
ADDENDUM TO ATS (filled in by the entrepreneur compiling the consolidated annual financial statement)XIV. PROFIT OR LOSS FOR THE CURRENT PERIOD
1. Attributable to equity holders
20
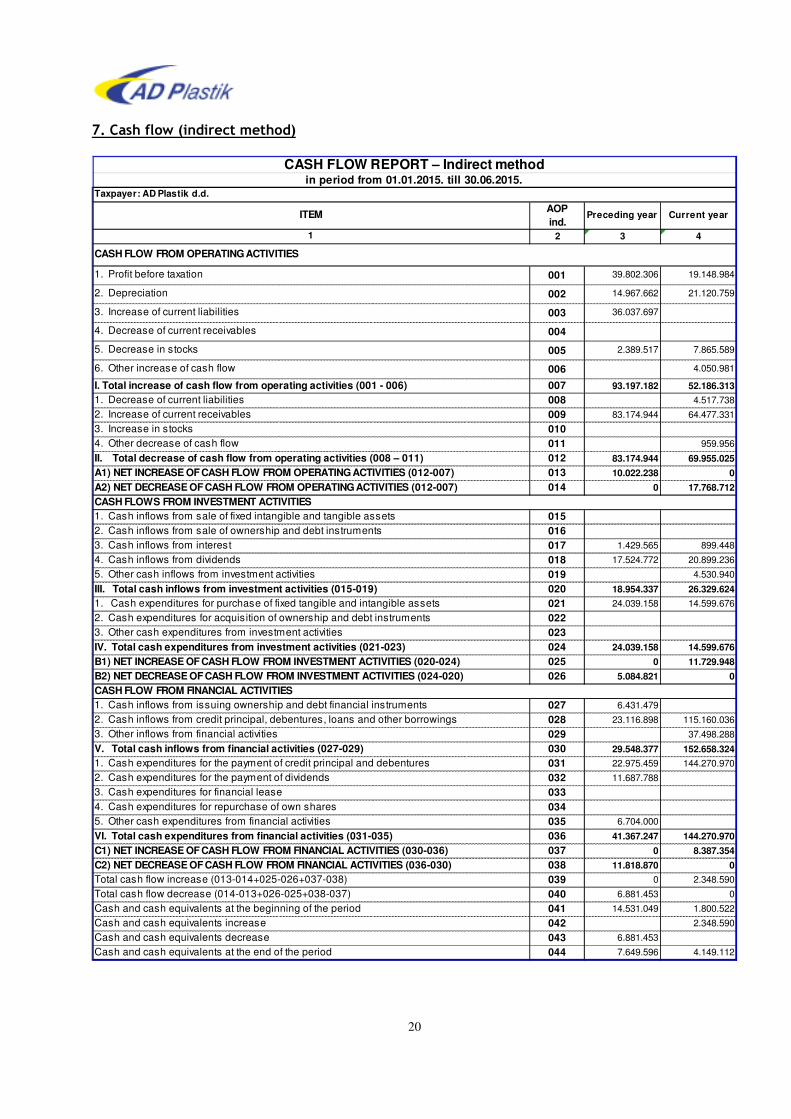
7. Cash flow (indirect method)
AOPind.
Preceding year Current year
2 3 4
001 39.802.306 19.148.984
002 14.967.662 21.120.759
003 36.037.697
004
005 2.389.517 7.865.589
006 4.050.981
007 93.197.182 52.186.313
008 4.517.738
009 83.174.944 64.477.331
010011 959.956
012 83.174.944 69.955.025
013 10.022.238 0
014 0 17.768.712
015016017 1.429.565 899.448
018 17.524.772 20.899.236
019 4.530.940
020 18.954.337 26.329.624
021 24.039.158 14.599.676
022023024 24.039.158 14.599.676
025 0 11.729.948
026 5.084.821 0
027 6.431.479
028 23.116.898 115.160.036
029 37.498.288
030 29.548.377 152.658.324
031 22.975.459 144.270.970
032 11.687.788
033034035 6.704.000
036 41.367.247 144.270.970
037 0 8.387.354
038 11.818.870 0
039 0 2.348.590
040 6.881.453 0
041 14.531.049 1.800.522
042 2.348.590
043 6.881.453
044 7.649.596 4.149.112
C1) NET INCREASE OF CASH FLOW FROM FINANCIAL ACTIVITIES (030-036)C2) NET DECREASE OF CASH FLOW FROM FINANCIAL ACTIVITIES (036-030)Total cash flow increase (013-014+025-026+037-038)
Cash and cash equivalents at the end of the period
Total cash flow decrease (014-013+026-025+038-037)
Cash and cash equivalents at the beginning of the period
Cash and cash equivalents increase
Cash and cash equivalents decrease
3. Cash expenditures for financial lease
4. Cash expenditures for repurchase of own shares
5. Other cash expenditures from financial activities
VI. Total cash expenditures from financial activities (031-035)
3. Other inflows from financial activities
V. Total cash inflows from financial activities (027-029)1. Cash expenditures for the payment of credit principal and debentures
2. Cash expenditures for the payment of dividends
B2) NET DECREASE OF CASH FLOW FROM INVESTMENT ACTIVITIES (024-020)CASH FLOW FROM FINANCIAL ACTIVITIES1. Cash inflows from issuing ownership and debt financial instruments
2. Cash inflows from credit principal, debentures, loans and other borrowings
2. Cash expenditures for acquisition of ownership and debt instruments
3. Other cash expenditures from investment activities
IV. Total cash expenditures from investment activities (021-023)B1) NET INCREASE OF CASH FLOW FROM INVESTMENT ACTIVITIES (020-024)
4. Cash inflows from dividends
5. Other cash inflows from investment activities
III. Total cash inflows from investment activities (015-019)1. Cash expenditures for purchase of fixed tangible and intangible assets
CASH FLOWS FROM INVESTMENT ACTIVITIES1. Cash inflows from sale of fixed intangible and tangible assets
2. Cash inflows from sale of ownership and debt instruments
3. Cash inflows from interest
4. Other decrease of cash flow
II. Total decrease of cash flow from operating activities (008 – 011)A1) NET INCREASE OF CASH FLOW FROM OPERATING ACTIVITIES (012-007)A2) NET DECREASE OF CASH FLOW FROM OPERATING ACTIVITIES (012-007)
I. Total increase of cash flow from operating activities (001 - 006)1. Decrease of current liabilities
2. Increase of current receivables
3. Increase in stocks
6. Other increase of cash flow
1
CASH FLOW FROM OPERATING ACTIVITIES
1. Profit before taxation
2. Depreciation
4. Decrease of current receivables
Taxpayer: AD Plastik d.d.
CASH FLOW REPORT – Indirect methodin period from 01.01.2015. till 30.06.2015.
ITEM
3. Increase of current liabilities
5. Decrease in stocks

21
8. Report on changes to capital
1.1.2015 till 30.6.2015
AOPind.
Preceding year
Current year
2 3 4
001 419.958.400 419.958.400
002 183.075.797 183.075.797
003 23.439.451 32.050.802
004 42.519.724 12.724.371
005 39.802.306 19.160.247
006007008009 10.185.353 -17.980.595
010 718.981.031 648.989.022
011 5.656.158
012 -1.131.232
013014015
016
017 0 4.524.926
018
019
for period
ITEM
1
1. Subscribed capital
Taxpayer: AD Plastik d.d.
2. Capital reserves
3. Reserves from profit
4. Retained profit or loss carried over
5. Current year profit or loss
6. Revalorisation of fixed material assets
17a. Ascribed to holders of the holders company capital
17b. Ascribed to minority interest
7. Revalorisation of intangible assets
8. Revalorisation of financial assets available for sale
9. Other revalorisation
10. Total capital and reserves (AOP 001-009)
REPORT ON CHANGES TO CAPITAL
15.Correction of significant mistakes from the previous period
16.Other changes to capital
17. Total capital increase or decrease (AOP 011 - 016)
11.Exchange rate variations from net investments into foreign business
12.Current and deferred taxes (part)
13.Cash flow protection
14.Changes in bookkeeping policies
22
d) Statement of the person responsible for drafting the financial reports
According to the best of my knowledge:
1. Unaudited financial reports of AD Plastik Group and the Company AD Plastik Inc. Solin for the
period of 01.01. - 30.06.2015, have been prepared in accordance with the application of
corresponding financial reporting standards, they give a complete and true view of the
assets and liabilities, profit and loss, a financial position and business of the issuer and the
companies included in the consolidation as a whole.
2. Managing report gives a true view of development of results and business and the position of
the issuer and companies included in the consolidation, with the description of key risks and
uncertainties to which the issuer and the company are exposed as a whole.
3. This report may contain certain statements concerning the future business of AD Plastik
Group and the Company. The above forward-looking statements reflect the current views of
the Company regarding future events and they are based on assumptions and they subject
to risks and uncertainties. A large number of factors can cause that the actual results,
performances or achievements of AD Plastik Group or the Company can be different from the
results or performances expressed or implied in these forward-looking statements.
Accounting Department Manager Board Member for Finance and
Accounting Marica Jakelić Katija Klepo
Top Related