


Languages
Pages
Legal

Malnutrition in Humanitarian
Emergencies
Bridget Fenn
1

Outline
• Nutrition in emergencies – Background
• Nutrition – Introduction
– Causes
– Main types of malnutrition in emergencies
• Macronutrient
• Micronutrient deficiency
• Burden of malnutrition and its contribution to mortality
• Malnutrition and infectious diseases
• Emergency rehabilitation – prevention & control
• Resources
2

Malnutrition and risk of illness and
death
• Not infectious disease……. Responsible for over 50%
of child deaths globally
• Some emergencies result in very high levels of severe
malnutrition
• „Cut-offs‟ for severe malnutrition is threshold where
mortality risk rises sharply
• Risk of death of malnourished associated with
infectious disease – malaria, diarrhoea, measles,
ARLI, HIV/AIDS3

Malnutrition and risk of illness and
death
• Nutritional status also affected by reduced food
intake due to worsening food security
• Malnutrition/mortality relationship is complicated
– Other factors affect mortality
• Important to interpret mortality data with nutrition
and health information
– Crude Mortality Rate (CMR): <1.0/10,000 individuals/day
– Under-five Mortality Rate (U5MR): <2.0/10,000 U5s/day
4

Mortality & Malnutrition
• Mortality and malnutrition data are both critical to define high-risk groups and to target programme during an emergency.
• Although...the utility of case-definitions for malnutrition are defined more by their ability to reflect mortality risk than their ability to reflect nutritional status
•But...Lancet malnutrition series missed out acute malnutrition. 5

EMERGENCIES
6
VULNERABILITY
CLIMATE
CHANGE
MALNUTRITION
EMERGENCIES
•Poverty•Chronic food insecurity•Poor infrastructure•Increase food prices
Increase in number of emergencies; famine, drought
INFECTIOUS DISEASE
HIV/AIDS
6

Malnutrition
7
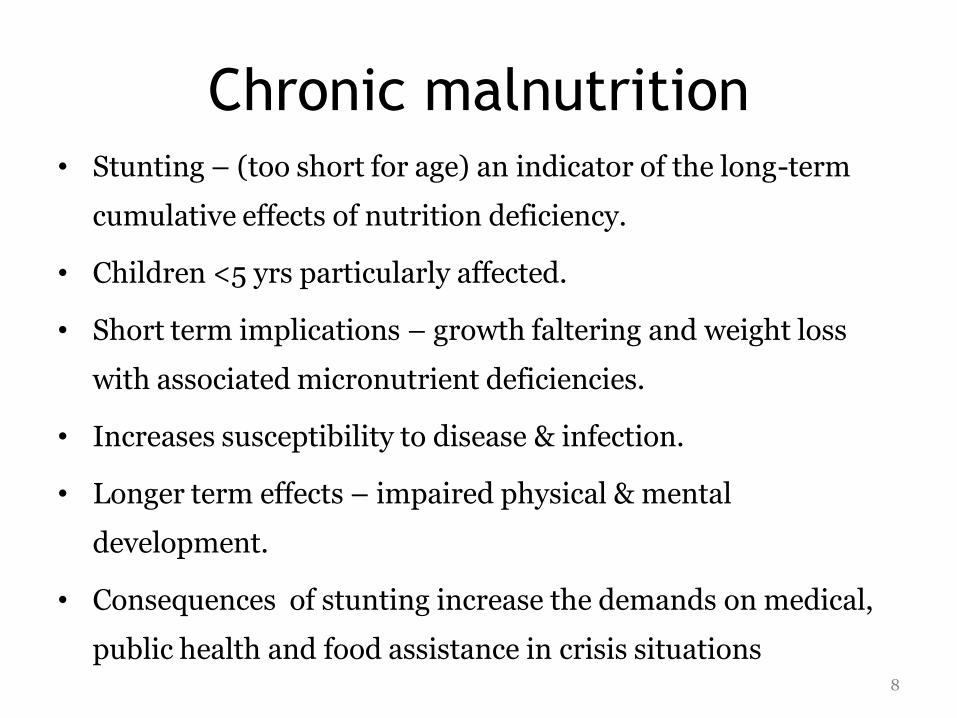
Chronic malnutrition• Stunting – (too short for age) an indicator of the long-term
cumulative effects of nutrition deficiency.
• Children <5 yrs particularly affected.
• Short term implications – growth faltering and weight loss
with associated micronutrient deficiencies.
• Increases susceptibility to disease & infection.
• Longer term effects – impaired physical & mental
development.
• Consequences of stunting increase the demands on medical,
public health and food assistance in crisis situations8
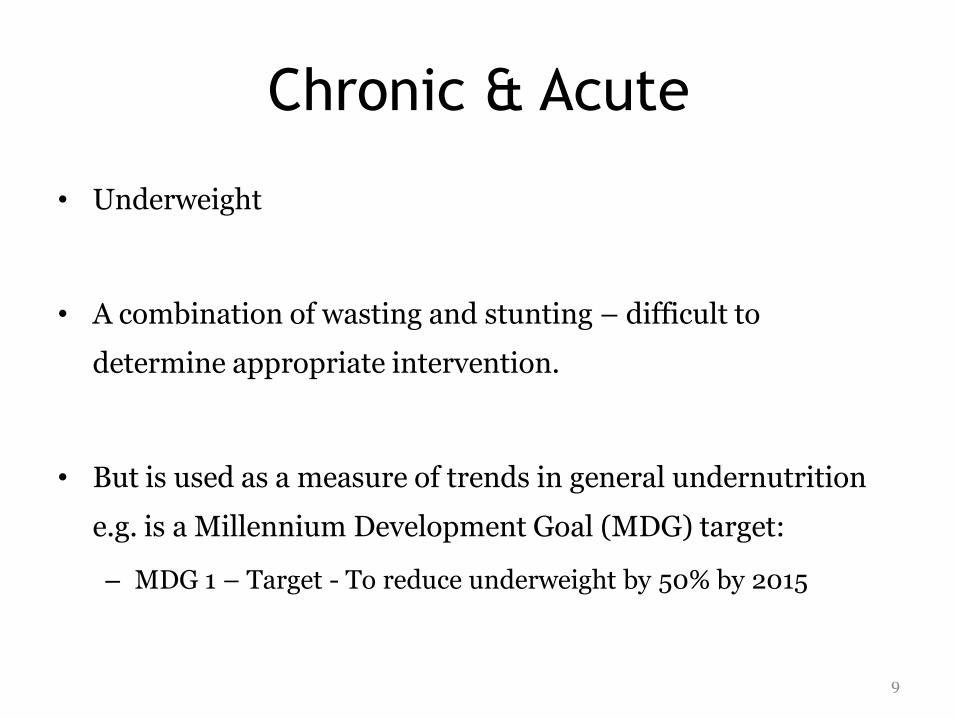
Chronic & Acute
• Underweight
• A combination of wasting and stunting – difficult to
determine appropriate intervention.
• But is used as a measure of trends in general undernutrition
e.g. is a Millennium Development Goal (MDG) target:
– MDG 1 – Target - To reduce underweight by 50% by 2015
9
Acute malnutrition• Wasting – (too thin for height) often an indicator of the
current or recent situation.
• Wasting results from an acute shortage of food, is reversible with re-feeding, and has a relatively high mortality rate.
• Poses more severe health risks than chronic malnutrition leading to weight loss and specific micronutrient deficiencies –resulting in impairment of bodily functions esp. resistance to disease.
• Increased levels of acute malnutrition in a population result in increased illness and death. These consequences often characterise nutrition emergencies and famine situations. 10

Severe Acute Malnutrition (SAM)
• Normal physiological mechanisms adapt– Mobilise energy & nutrient reserves
– Decrease energy & nutrient demands
• Initially beneficial and allow homoeostasis
• As severity increases these adaptations prevent body‟s ability to respond top stresses e.g. infection
11

Clinical forms of SAM
• Marasmus – severe weight loss leaving „skin
and bones‟
• Kwashiorkor – bloated appearance due to
water accumulation (oedema)
• Marasmic-kwashiorkor – a combination of
both
12

Marasmus
• Extremely emaciated (fat & muscle tissue grossly
reduced)
• Thin flaccid skin, hanging in loose folds; “baggy pants”,
“old man‟s appearance”
• Normal hair
• Frequent infections with minimal signs
• Electrolyte imbalance (no oedema)
• Frequent association with dehydration
• Alert & irritable13

Kwashiorkor • Bilateral pitting oedema, beginning in the lower legs and
feet, can become more generalized (hands and arms, “moon face”)
• Reduced fat muscle tissue (often masked by the oedema)
• Hair changes colour (yellow/reddish) and becomes sparse; curly hair becomes straight; dry & brittle, easily pluckable.
• Skin lesions and hypo-pigmentation:
-dark skin may become lighter esp. in the skin folds
-outer layers of skin may peel off ulceration
-the lesions may resemble burns prone to infection.
14

Kwashiorkor
• Frequent infections
• Electrolyte imbalance
• Frequent association with dehydration (often
masked by oedema)
• Generally apathetic, lethargic, miserable, and
irritable. They show no signs of hunger, and it is
difficult to persuade them to eat.
15

Marasmic kwashiorkor
• Marasmic kwashiorior: refers to marasmic
children with oedema but without other
signs of kwashiorkor.
16

Prevalence & distribution
17
• 32% stunted
• 146 million children underweight
• Malnutrition rates are higher in South & Central Asia ?

Indicators
• Wasting – Weight-for-Height (W/H)
• Stunting – Height-for-Age (H/A) or Length-for-Age
(L/A)if child <24 months or <85cm
• Underweight – Weight-for-Age (W/A)
• All of these indicators are measured in either Z-scores, percentiles or percentage of the median
• MUAC, MUAC/Age, MUAC/height 18

Nutritional assessment: sampling
and indicators
• Sampling:
– Children 6-59 mos
– Adolescents, adults
• Indicators:
– Acute emergency:
• wasting, oedema
– Stable emergency:
• wasting, oedema
• underweight
• stunting
• Reporting W/H, oedema, MUAC:
– Moderate wasting (MAM):
• <-2 to –3 Z scores ; >=70%-<80% W/H
– Severe wasting (SAM):
• <-3 Z scores ; <70%
– Moderate+severe wasting (GAM)
• <-2 Z scores ; <80% W/H
– Oedema:
• Nutritional oedema, regardless of
W/H
– MUAC19

MUAC
• Mid Upper Arm Circumference (MUAC):•MUAC <125mm >110mm
•MUAC < 110 mm OR the presence of bipedal oedema
• Still need consensus about whether to use MUAC as a measure of wasting prevalence.
20

Body Mass Index (BMI)Malnutrition in Adults
Type & level of malnutrition
BMI range(kg/m²)
Obese 30.0+
Overweight 25.0-29.9
Normal 18.5-24.9
CED* Mild 17.0-18.4
CED Moderate 16.0-16.9
CED Severe <16.0
* Chronic Energy Deficiency
21

Clinical & biochemical indicators
Micronutrient deficiency
Clinical indicator Biochemical indicator
Iron deficiency anaemia Pallor of palms or inside of eyelids or mouth
Haemoglobin estimation
Vitamin A deficiency Night blindness Haemoglobin measurement
Vitamin A deficiency Bitot‟s spots Serum Vitamin A level
Iodine deficiency Goitre Urinary iodine level
22

AnaemiaCategory of public health significance
Prevalence of anaemia (%)
Severe >= 40
Moderate 20.0-39.9
Mild 5.0-19.9
Normal < 5.0
23
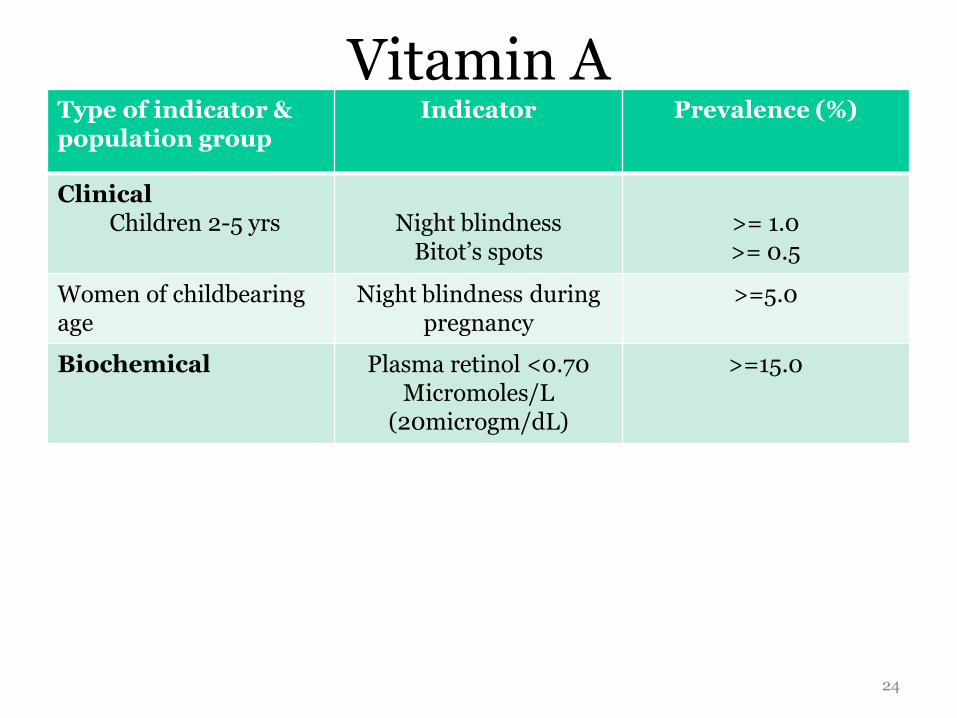
Vitamin AType of indicator & population group
Indicator Prevalence (%)
ClinicalChildren 2-5 yrs Night blindness
Bitot‟s spots>= 1.0>= 0.5
Women of childbearingage
Night blindness during pregnancy
>=5.0
Biochemical Plasma retinol <0.70Micromoles/L
(20microgm/dL)
>=15.0
24

IodinePopulation status Iodine intake Median (μg/l)
children 6+ yrs
Severe deficiency Insufficient <20
Moderate deficiency Insufficient 20-49
Mild deficiency Insufficient 50-99
Adequate Adequate 100-199
Likely to provide adequate intake for pregnant/lactating women – may pose slight risk of >adequate intake in overall population
Above requirements
200-299
Risk of adverse health consequences (iodine-induced hyperthyroidism,autoimmune thyroid diseases)
Excessive 300+
25

Malnutrition & Mortality
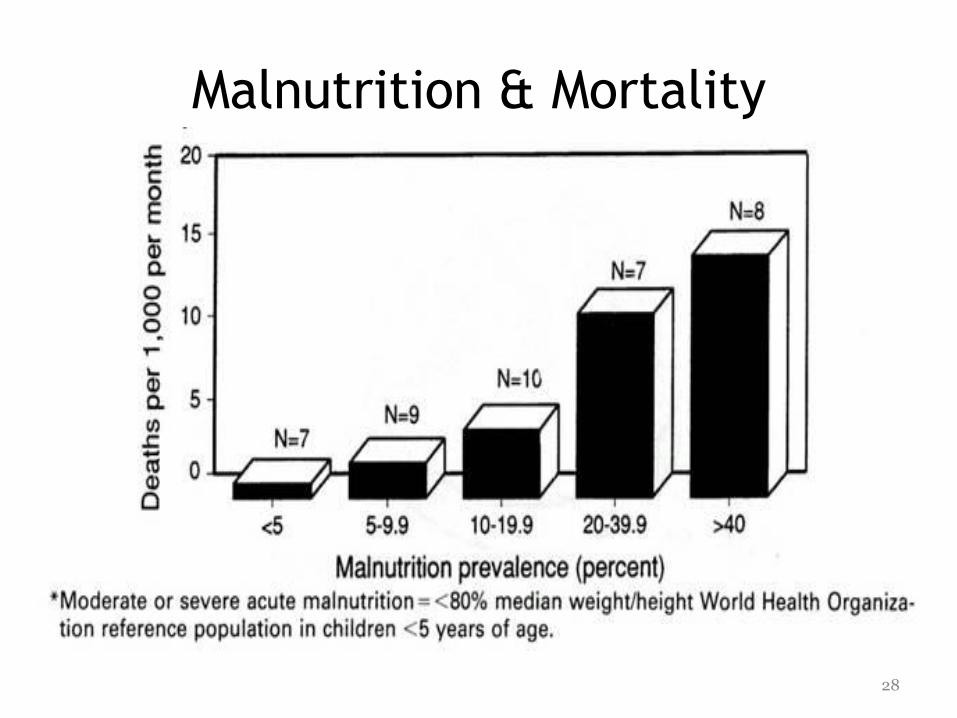
Ref: Checchi et al 200626

Malnutrition & Mortality
• acute malnutrition very high mortality rates.
• the mechanisms of food procurement and distribution often break down at the same time as basic public health and clinical treatment measures are eroded.
• exposure to disease-causing organisms more common and treatment for disease becomes less available.
• increases the mortality resulting from acute malnutrition.
27
Malnutrition & Mortality
28

Malnutrition & Mortality•Nutrition and mortality data should be collected, analyzed, and interpreted together during emergencies.
•Both may help identify the underlying public health causes of malnutrition in emergencies, e.g. measles or diarrhoea, that may interact with poor food security to increase mortality risk.
•Such data may also challenge the assumption that only children younger than 5 years are at a higher risk for malnutrition and mortality.
•The lack of anthropometric data on adults, particularly older persons, may result in groups at potentially high riskof mortality due to undernutrition not being targeted for selective feeding interventions. 29

Careful....A high mortality rate does not necessarily mean that SAM rate is low – especially when other risk factors for malnutrition exist within the population (& prevalence from pre-emergency surveys). Survivor bias.
If the mortality rate increases rapidly, the prevalence of malnutrition may plateau because the rate of death from malnutrition may = the rate at which children become newly malnourished.
But also consider...Situations where SAM is low and mortality high could suggest that malnutrition is not a public health problem in that population.
30

Malnutrition & infectious disease
31

Malnutrition & Infectious Disease• Malnutrition is particularly lethal in combination with infectious
diseases such as ARLI, malaria, measles, diarrhoeal diseases - the major killer diseases affecting children.
• Infection and micronutrient deficiencies can induceimmunodeficiency in otherwise healthy children, increasing susceptibility to diarrhoea and other infections.
• This can lead to a vicious cycle of repeated infections, reduced immunity, and deteriorating nutritional status
• Malnutrition magnifies the effect of disease.
• A malnourished person has more severe disease episodes, more complications, and spends more time ill for each episode.
32

Malnutrition/infection cycle
33

Undernutrition attributable deaths
• Among the primary causes of death in
young children:
– Diarrhoea 60.7%
– Measles 44.8%
– Pneumonia 52.3%
– Malaria 57.3%
34

Malnutrition & Infectious Disease
•Large supplementation trials show that routine vitamin A supplements (6-72 mo) can reduce overall mortality by at least 23% where vitamin A deficiency exists in a population.
•Effective
•Cheap
•Even more effective vitamin A & vaccines e.g. Vitamin & measles vaccine – given together at NIDs.
•Previous deaths (before vaccine) 7-8 million; now 900 000
35

Questions
Which disease:
1. depletes iron
2. is considered the most contagious in humans
3. is treated effectively with zinc supplements
4. can cause blindness
5. is the most common respiratory disease
36

Questions
1. when associated with undernutrition, is most common cause of death in young children
2. depletes vitamin A levels
3. could causes major obstetric problems if left untreated
4. is often complicated with ARLI and diarrhoea
5. only needs to have 1 case for it to become an epidemic
37
Measles
• The most contagious disease known to humans.
• Causes loss of vitamin A, frequently acute vitamin A deficiency and blindness.
• Half of children who become blind die within 1yr.
• May ultimately be responsible for more child deaths than any other single microbe - due to complications from pneumonia, diarrhoea and malnutrition.
38

Measles
• Post-measles diarrhoea is especially difficult to treat and has a very high mortality risk.
• Measles also in long-term complications including:
• deafness
• chronic lung disease
• poor growth
• recurrent infections.
39
Measles• Relationship between measles and malnutrition is complex
• Children with measles are generally more susceptible to wasting
• Children who have wasting are more likely to develop complications of measles and have higher case-fatality rates.
•Dose-response relationship between the degree of wasting and cumulative incidence of measles in the previous 2 weeks.
• A higher infectious dose of measles is associated with more severe disease
• Children contracting measles from siblings or in crowded places generally receive higher infectious doses.
40
Measles prevention
• Crowded emergency settings, large population displacements and high levels of malnutrition.
• Mass measles vaccination campaigns (EPI) –6mo-15yrs.
• If the vaccination coverage for the population is unknown, the campaign should be carried out on the assumption that the coverage is inadequate.
41

Measles & Vitamin A
• Measles is known to interact particularly with malnutrition and vitamin A.
• It is a common precipitating cause of potentially blinding eye lesions in young children, and of severe growth faltering and malnutrition.
• Risk of mortality from measles is reduced by 50% with Vitamin A supplementation.
42
Malaria
• 500 million people live in malaria-endemic areas.
• Major cause morbidity & mortality
• Often affects poor and malnourished populations -
vulnerable, children & pregnant women
• Malaria causes haemolysis, which in turn causes anaemia.
But...
• Conflicting evidence that undernutrition is an underlying
cause of malaria morbidity & mortality
43

Iron deficiency
•Uncorrected iron deficiency leads to:
– severe anaemia (major obstetric problem;
maternal mortality)
– lbw risk (2x as high in malaria-endemic area)
–Stillbirths, miscarriage
– reduced work capacity
– diminished learning ability
– increased susceptibility to infection
44
Reduce Malaria or supplement
iron?
• Conflicting information
• Iron supplementation protects a child who is at high risk of dying from severe anaemia in the first 2 years of life.
• The malaria parasite requires iron for its multiplication in blood, and thus may be less infective in the iron-deficient individual.
45

Roll-Back-Malaria
• However, antimalarial prophylaxis protects against severe anaemia much more.
• Evidence - Reducing malaria makes more of a difference than iron supplementation in preventing severe anaemia.
• Prevention
• Bednets
• Spraying
• Larvae control & environmental management46

Diarrhoeal diseases
• Diarrhoea associated with malnutrition is probably the commonest cause of death in young children worldwide.
• Every year around 10 million children under 5 die: 5 million from malnutrition - about 2 million with diarrhoea (out of a total of 2.5 billion episodes of diarrhoea)
• Most episodes of diarrhoea are infectious and are caused by a variety of bacteria, viruses, and parasites.
• Studies shown that 50% of deaths related to diarrhoea linked to persistent diarrhoea (>14 duration); about 10% of diarrhoea cases lead to persistent diarrhoea .
47
Diarrhoeal diseases
• Undernutrition increases the incidence and severity of diarrhoea
• Diarrhoea is detrimental to nutritional status (acute weight loss, malnutrition & stunting).
• Diarrhoeal diseases account for 10-80% of growth retardation in the first few years of life worldwide, affected by:
-aetiology and clinical type of diarrhoea, -the source and adequacy of dietary intake,
-treatment, -feeding practices.
• The case fatality rate is highest among children aged 6-12 months because:?
48

Diarrhoeal diseases• Dehydration is the most direct effect of diarrhoea,
accounting for the majority of deaths.
• The widespread adoption of oral rehydration therapy (ORT) has greatly reduced the mortality related to diarrhoea.
But...
• Diarrhoeal illnesses in young children continue to be aleading cause of morbidity and mortality worldwide treatments). Why?
49

Zinc
• Numerous RCTs – proven effectiveness
• WHO and Unicef recommend the therapeutic use of zinc for 10-14 days at a daily dose of:
– 10 mg in infants less than 6 months old and
– 20 mg daily in older children.
50

Diarrhoeal diseases-clinical
managementFour main components: • Replacement of ongoing losses of fluid and electrolytes (75 mmol/l
of sodium and 75 mmol/l of glucose and an osmolarity of 245 mmol/l.)
• Zinc therapy
• Antimicrobial therapy when indicated
• Continued feeding to provide enough nutrients to meet both the patient's usual maintenance requirements and the increased needs imposed by infection and malabsorption
51

Acute respiratory infection -
ARLI
• Pneumonia the most common
• Pneumonia often affects children with lbw or those whose immune systems are weakened by malnutrition or other diseases.
• Malnutrition and failure to thrive are known risk factors for ARLI.
• Symptoms accompanying pneumonia –breathing difficulties, fever, and anorexia weight loss.
• With SAM the symptoms may be less obvious52

ARLI prevention
• Maintain nutritional status
• Keep immunization rates against measles and pertussis high
• Control:– Overcrowding
– Smokey fires
– ventilation
• Early treatment for coughs & breathing difficulties
53

Co-morbidity
• Pneumonia and diarrhoea - A causal link between diarrhoeal disease and subsequent risk of ARLI is biologically plausible.
• Diarrhoea may also increase the risk of ARLI in the short term by causing: acute micronutrient loss, stress on the immune system, dehydration or immobilization, thereby creating a vulnerable period of increased risk of infections.
54

•There is some evidence that ARLI is a common finding and cause of death of malnourished children hospitalized for severe diarrhoea.
•However, in hospital case series it can be difficult to distinguish between cause, effect and co-occurrence due to common risk factors
55
Integrated Management of
Childhood Illness IMCI• IMCI is disease control through management
of the five most common causes of childhood deaths - pneumonia, diarrhoeal diseases, malaria, measles and malnutrition.
• The IMCI treatment guidelines have been developed to assist health workers to recognize easily signs of illness and take appropriate action, even if there are co-existing health conditions.
• IMCI also helps prevent illness through promoting improved nutrition and vaccination.
56

5757
58
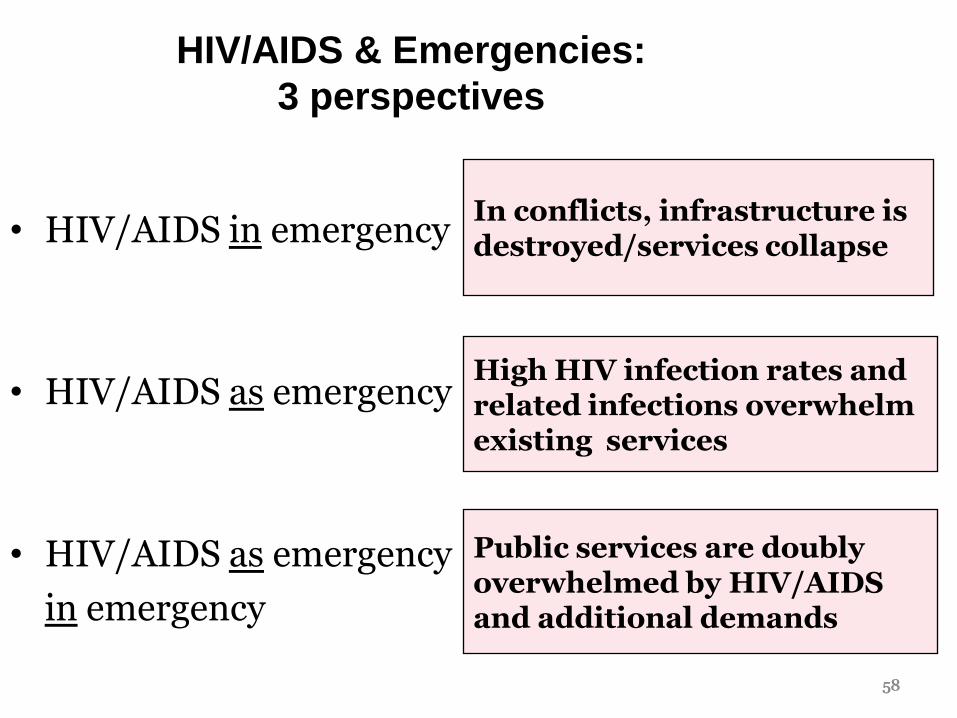
HIV/AIDS & Emergencies:
3 perspectives
• HIV/AIDS in emergency
• HIV/AIDS as emergency
• HIV/AIDS as emergency
in emergency
In conflicts, infrastructure isdestroyed/services collapse
High HIV infection rates and related infections overwhelm existing services
Public services are doubly overwhelmed by HIV/AIDS and additional demands
58

59
Disruption of social norms and care capacity
Services cannot manage HIV/AIDS related requirements
Assets and social safetynets deplete
Risk of HIV infection increases
How do emergencies increase HIV/AIDS related vulnerability?
• Reduce social stability/ support
• Overwhelm or destroy essential public services
• Reduce household and community resources
• Increase personal insecurity and risk of sexual assault.
How do emergencies increase HIV/AIDS related vulnerability?
59

60
Addressing HIV/AIDS in emergency settings:challenges and problems
• Collapsed/inadequate health and public services.
• Limited financial, social & economic resources.
• Lack of information (on infection levels, trends, target
populations, ...).
• Special situations of emergency-affected populations
(access, security, language, culture, stigma..)
• Institutional and human resource constraints.
60

61
Chronic livelihoodinsecurity.
Shocks such as drought or conflict tip situationinto acute emergency.
Acute crisis develops, with increased risks to lives and livelihoods.
HIV/AIDS undermines livelihood security.
HIV/AIDS increases vulnerabilityto shocks.
HIV/AIDS-affected people/householdshave less capacity to respond and sustain more severe losses/impacts.
The trajectory of a crisis:How does HIV/AIDS contribute?
61
62
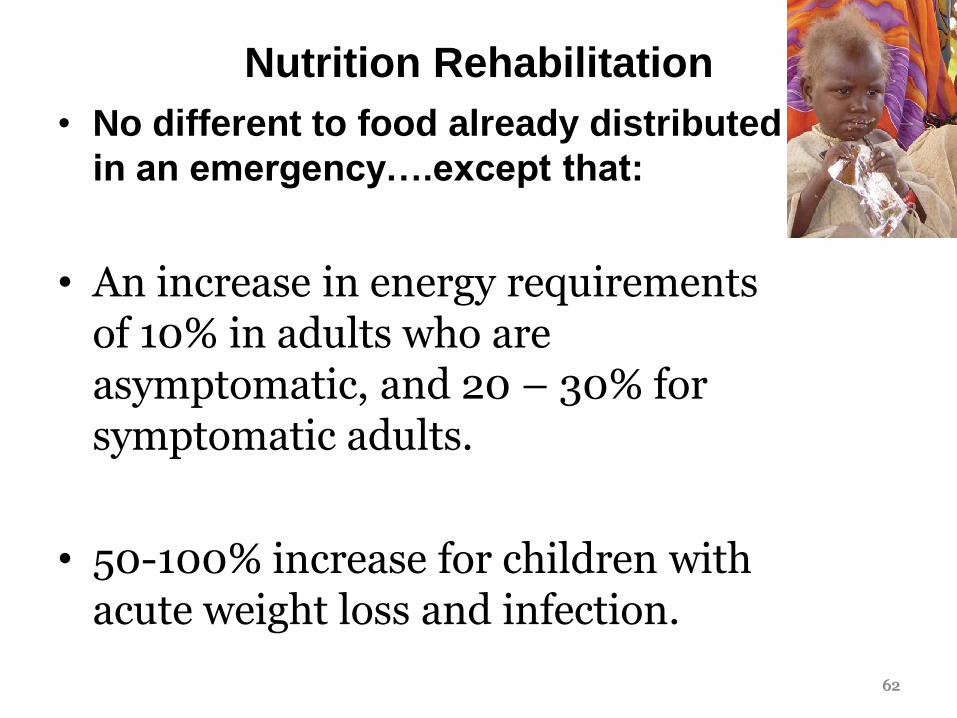
Nutrition Rehabilitation
• No different to food already distributed
inanemergency….exceptthat:
• An increase in energy requirements of 10% in adults who are asymptomatic, and 20 – 30% for symptomatic adults.
• 50-100% increase for children with acute weight loss and infection.
62

For children and adults with Severe malnutrition/oedema and HIV
RUTF Paste PLUMPY'NUT® BP100®
Weight (Kg) g/day g/wk sachet/day sachet/wk bars/day bars/wk
3-3.4 105 750 1¼ 8 2 14
3.5-4.9 130 900 1½ 10 2½ 17½
5-6.9 200 1400 2 15 4 28
7-9.9 260 1800 3 20 5 35
10-14.9 400 2800 4 30 7 49
15-19.9 450 3200 5 35 9 63
20-29.9 500 3500 6 40 10 70
30-39.9 650 4500 7 50 12 84
40-60 700 5000 8 55 14 98 63

64
Multivitamins and
HIV Disease Progression
• Studies from Africa suggest that a daily multivitamin:
– Reduces rate of decline on the immune system by one-third
– CD4 counts remain higher
– Viral loads are reduced
• It is suggested that multivitamins are a cheap and useful tool in delaying the need to commence HAART.
Fawzi et al, (2004) NEJM 351;1
64

TB• To make matters worse:
• infection with HIV weakens the immune system and can activate latent TB infection.
• multiplies the risk of initial infection with TB.
• About one-third of all AIDS deaths today are caused by TB.
• HIV & TB increase hospital workloads treating SAM both directly (infection) & indirectly (on food security, livelihoods)
• Inc. SAM
• Inc. mortality65
66
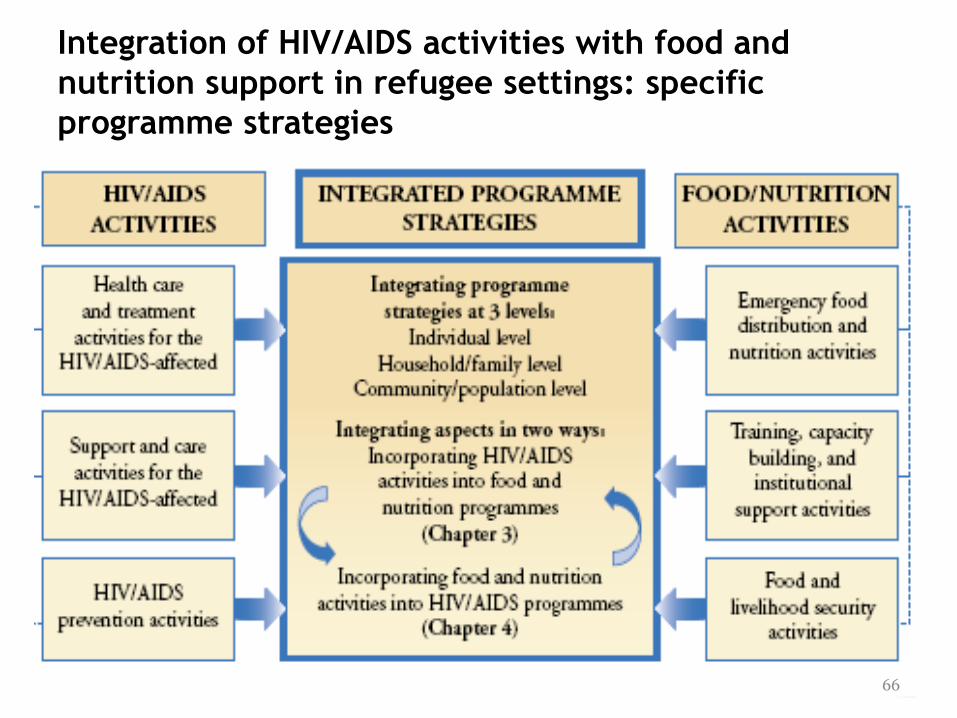
Integration of HIV/AIDS activities with food and
nutrition support in refugee settings: specific
programme strategies
66

Objectives of nutritional
programmes
• To ensure adequate food supply for entire affected
population and thereby prevent malnutrition and
other adverse health consequences
• To provide nutritional rehabilitation for
moderately and severely malnourished
• To prevent nutritional deterioration for „vulnerable
groups‟
67

TREATMENT
PREVENTION68

Potential strategies to address and prevent malnutrition
Supplementary Feeding
Therapeutic Feeding
Promotion and
support for breastfeeding
Income Generation
General Food Ration
Water
Fortification
NutritionEducation
Measlesvaccination
LivestockSanitation
Vitamin A distribution
Provide curative treatment for infectious disease
69
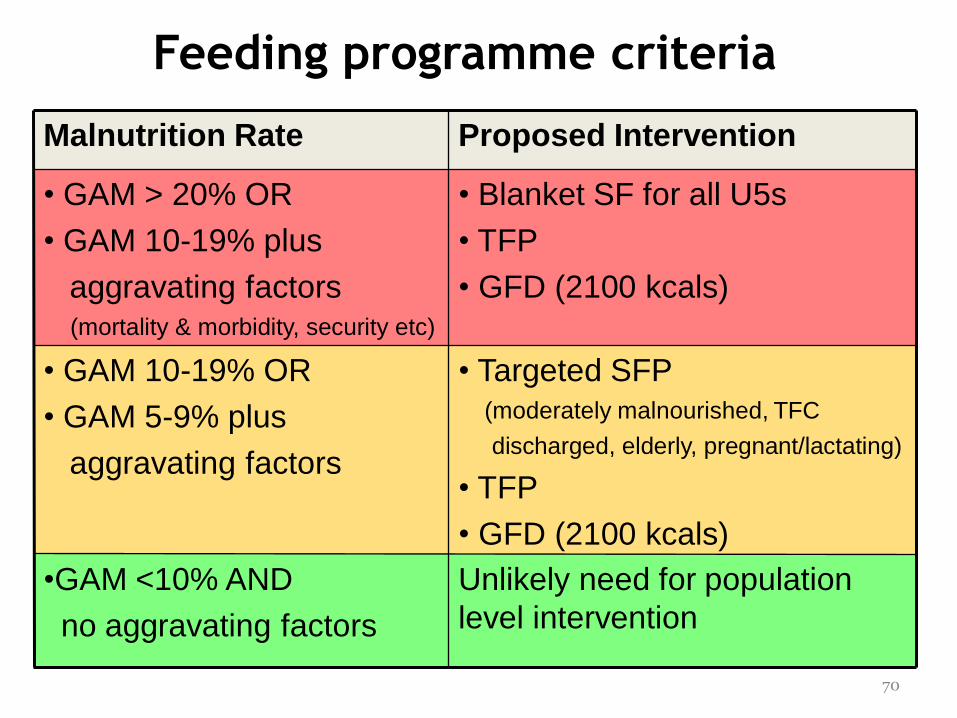
Malnutrition Rate Proposed Intervention
• GAM > 20% OR
• GAM 10-19% plus
aggravating factors(mortality & morbidity, security etc)
• Blanket SF for all U5s
• TFP
• GFD (2100 kcals)
• GAM 10-19% OR
• GAM 5-9% plus
aggravating factors
• Targeted SFP(moderately malnourished, TFC
discharged, elderly, pregnant/lactating)
• TFP
• GFD (2100 kcals)
•GAM <10% AND
no aggravating factors
Unlikely need for population
level intervention
Feeding programme criteria
70
General ration distribution
Objectives:
• To meet the immediate food needs
• Famine prevention OR livelihood protection
• Livelihood recovery
71

What is an adequate ration?
Meets minimum nutritional requirements for light activity
Includes a range of commodities
Is acceptable and broadly familiar
Fit for human consumption
Easily digestible for children, elderly, etc.
Maximises the use of available resources
Is economical (fuel requirement, preparation time & waste)
72

Calculation of ration
1. Estimate population‟s nutritional requirements
The age and sex structure
Health, nutritional and disease status
Physical activity level.
Environmental temperature
2. Review the types and quantities of different commodities.
3. Calculate the nutritional composition of the ration. 73
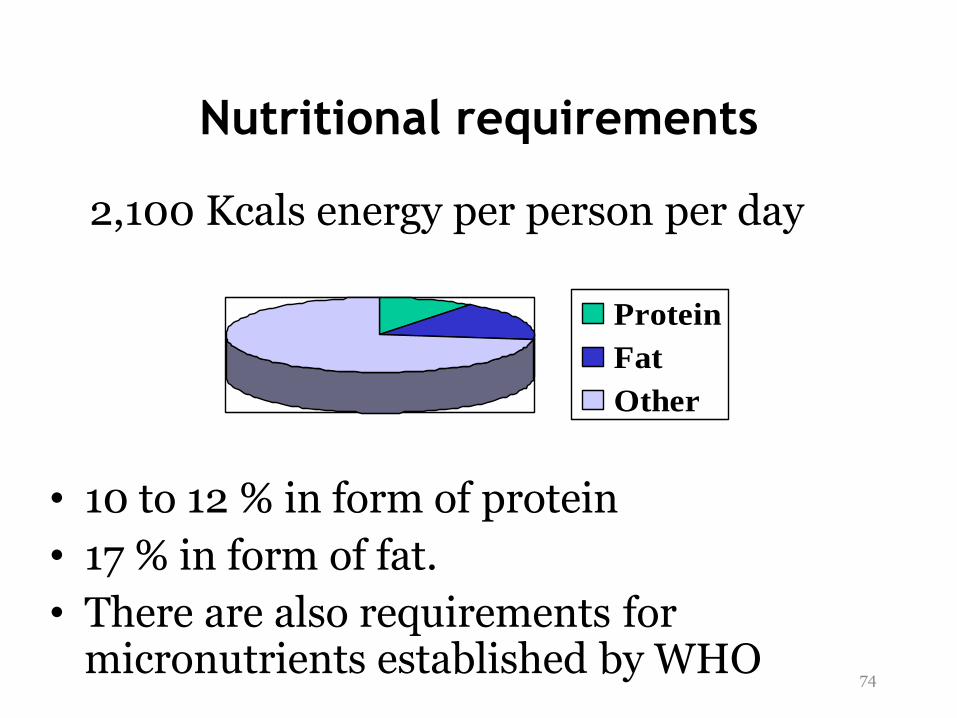
Nutritional requirements
• 10 to 12 % in form of protein
• 17 % in form of fat.
• There are also requirements for micronutrients established by WHO
Protein
Fat
Other
2,100 Kcals energy per person per day
74

Examples of general rations MCIC food parcel to refugees in Macedonia
May-October 1999
Food item Quantity Kcals
Wheat flour
1 kg
3,500
Pulses 0.5 kg 1,675
Vegetable oil 1 litre 8,850
Sugar 0.5 kg 2,000
Pasta 1 kg 3,700
Rice 1 kg 3,600
Honey 0.1 kg 304
Chocolate 0.2 kg 1,010
Turkish
delight
0.2 kg 772
Biscuits 0.2 kg 728
Goulash tin 0.4 kg 376
Gjuvec* 2 kg 1,180
Beef pate 0.3 kg 957
Sausage** 0.5 kg 1,560
Sardine tins 0.625 kg 1,300
Chicken pate 0.3 kg 603
Tea 0.1 kg -
Coffee 0.1 kg -
Total per day 1,070
WFP general ration to victims of drought in Ethiopia
April-December 2000
Food item Quantity Kcals
Cereals
(wheat or
sorghum)
15 kg
49,800
Blended food 4.5 kg 17,100
Total per day 2,230
75

Distribution methods
• Direct to households with ration cards
• By local government
• By local NGOs
• By traditional elders
• By community-based relief
committees
• Direct to individuals in form
of cooked food.76

Types of SFP
• Blanket – all under 5 year olds
• Targeted – malnourished / vulnerable
• Wet – ration eaten at the SF centre
• Dry – ration taken home
Consider: levels of malnutrition
access to affected population
77

Targeted SFPs
• Admission:70 to <80% or <–2 to –3 Z-score
MUAC 110mm to <125mm
• Discharge:>85% W/H over 2 to 4 consecutive weeks
In general, the target is children aged 6 to 59 months but can include older
children, pregnant women or the elderly
78

Examples of rations
Wet ration
Day
Maize 50g
DSM 30g
Oil 20g
Sugar 10g
Total 508 kcal
Protein 15.3g (12% ration)
Fat 21.6g (38% of ration)
Dry ration
Day Week
CSB 228g 1,600g
Oil 29g 200g
Sugar 29g 200g
Total 1000 kcal
Protein 41g (16.4% of ration)
Fat 42.6g (38% of ration)
In addition, other foods such as fruits and vegetables and high energy biscuits may be
distributed 79
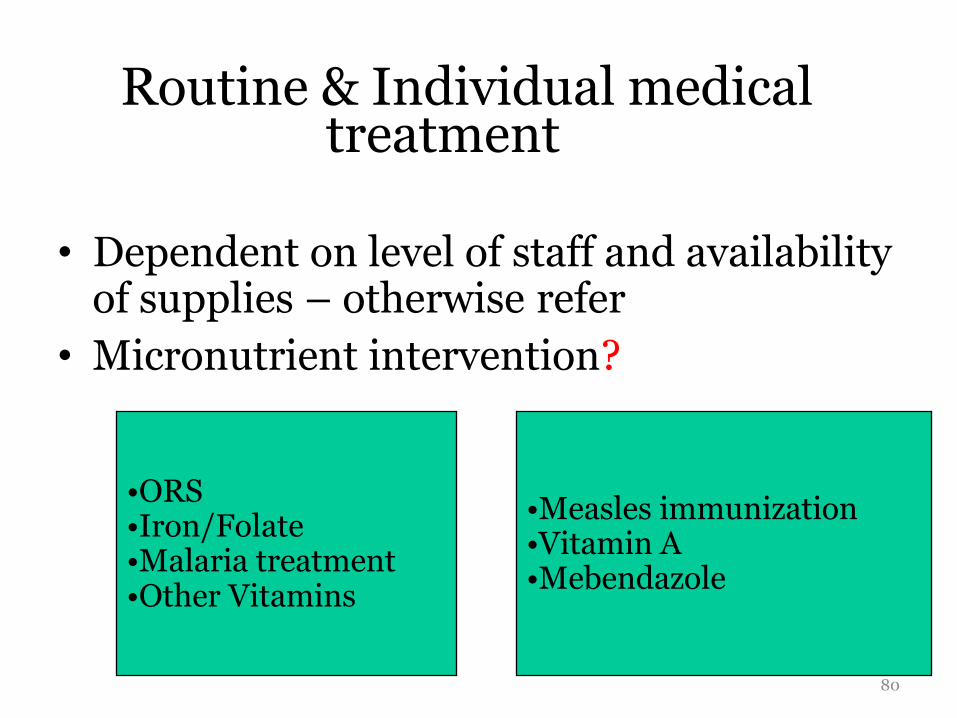
Routine & Individual medical treatment
• Dependent on level of staff and availability of supplies – otherwise refer
• Micronutrient intervention?
•Measles immunization•Vitamin A•Mebendazole
•ORS•Iron/Folate•Malaria treatment•Other Vitamins
80

Potential problems
Beneficiaries may not receive food:
• Underestimation of affected population
• Political priorities of donor and host governments
• Internal disputes
• Lack of agency resources
• Late delivery of food aid
• Poor access
81

Problems of implementation
• Theft
• Looting and pillage
• Attack
• Taxation
• Diversion
• Manipulation
• Coercion/extortion
82

Therapeutic feeding
Aimed at severely malnourished individuals:
• In-patient care („traditional‟ TFC)
• Two phases (10 steps – WHO management
protocol)– I Stabilisation
– II Rehabilitation
• But... Case-fatality still high why?83

How do bodily changes link with treatment?
Risk of heart failure and hypoglycaemia, problems absorbing and digesting food
Risk of dehydration
Risk of hypothermia
Risk of infectionand septic shock
Reduced ability to metabolize iron
• Special diet (low protein, adequate carbohydrate)
• Small frequent meals
• Rehydration
• Keep child warm
• Antibiotics, vitamin and mineral supplements, measles vaccination, malarial treatment
• Withhold iron (initially) 84

Inappropriate practices
• Too much energy and protein during Phase I.
• No distinction made between Phase I and II.
• Failure to monitor food intake.
• Lack of feeding at night.
• Lack of provision of blankets.
• Diuretic given to treat oedema.
• Anaemia treated at admission with iron.
85
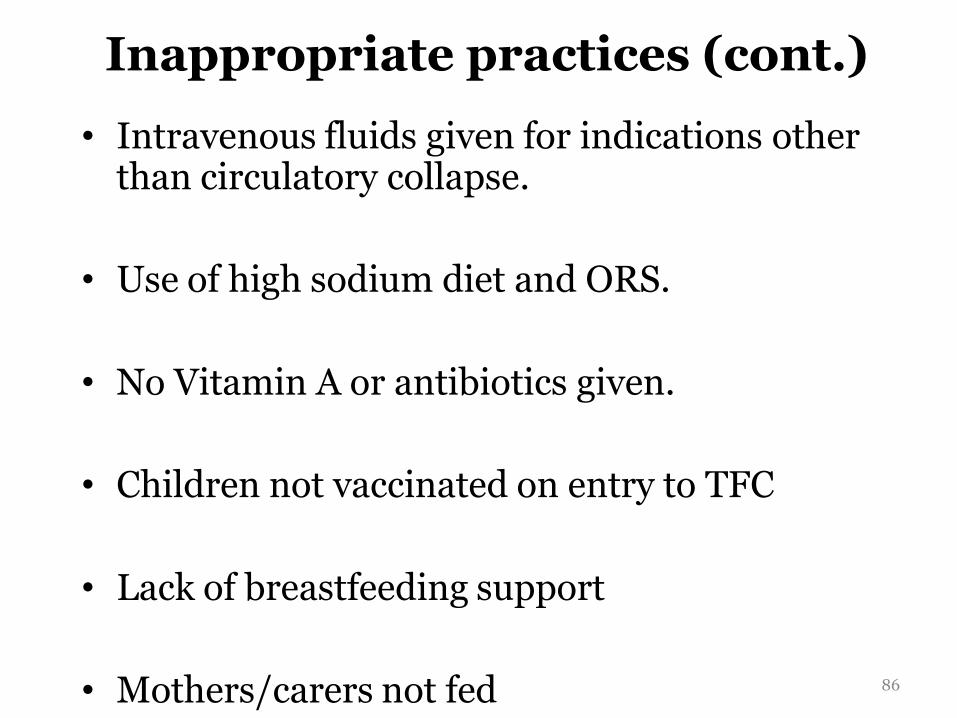
Inappropriate practices (cont.)
• Intravenous fluids given for indications other than circulatory collapse.
• Use of high sodium diet and ORS.
• No Vitamin A or antibiotics given.
• Children not vaccinated on entry to TFC
• Lack of breastfeeding support
• Mothers/carers not fed 86
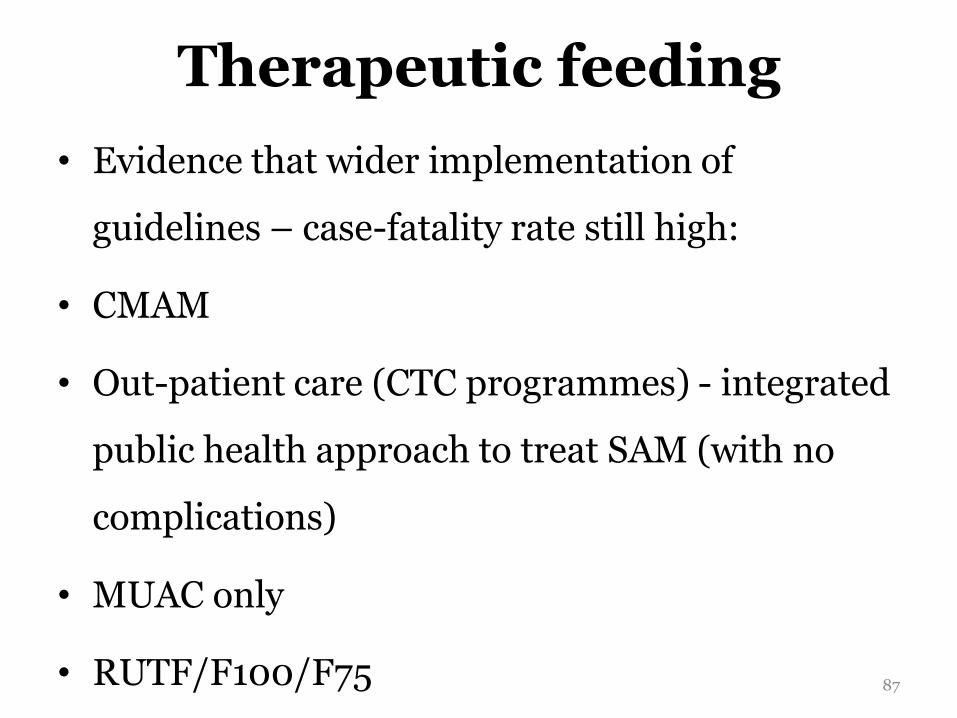
Therapeutic feeding
• Evidence that wider implementation of
guidelines – case-fatality rate still high:
• CMAM
• Out-patient care (CTC programmes) - integrated
public health approach to treat SAM (with no
complications)
• MUAC only
• RUTF/F100/F75 87

88

Resources• Online forum for those working in nutrition -
http://www.en-net.org.uk
• Toolkit for addressing nutrition in emergency situations: http://www.humanitarianreform.org/humanitarianreform/Default.aspx?tabid=74
• Online search facility: http://fex.ennonline.net
• The International Emergency and Refugee Health Branch CDC: http://www.cdc.gov/nceh/ierh/ResearchandSurvey/enasoftware.htm 89
References
• The Sphere Project (2004) Humanitarian Charter and Minimum Standards in Disaster Response.
• WHO (2000) Management of nutrition in major emergencies
• Synergism of nutrition, infection and immunity. Scrimshaw N & SanGiovanni S P. The American Journal of Clinical Nutrition. 1997; 66(2), 464s.
• Management of severe acute malnutrition in children. Collins S, dent N, Binns P et al. Lancet. 2006; 368:1992-2000
90
Top Related