


Languages
Pages
Legal


1 © BMI-BRSCU© BMI-BRSCU
TowardsMaking sense of the Building-, Construction- and Property-Industry
In the
VUCA ENVIRONMENT
Dr. Llewellyn B. LewisSF April 2013
THE STRATEGIC FORUMA place of assembly
for strategic conversations
THE STRATEGIC FORUMwww.strategicforum.co.za
BMI
Studium Ad Prosperandum
Voluntas in Conveniendum
BUILDING RESEARCHSTRATEGY CONSULTINGUNIT cc
Reg. No. 2002/105109/23
•
BMI
Studium Ad Prosperandum
Voluntas in Conveniendum
BUILDING RESEARCH
STRATEGY CONSULTING
UNIT cc
•
BMI•
BMI•
BMI•
BMI
Studium Ad Prosperandum
Voluntas in Conveniendum
BUILDING RESEARCHSTRATEGY CONSULTINGUNIT cc
Reg. No. 2002/105109/23
•
BMI
Studium Ad Prosperandum
Voluntas in Conveniendum
BUILDING RESEARCH
STRATEGY CONSULTING
UNIT cc
•
BMI•
BMI•
BMI•
BMI•
BMI•
BMI•

2
Across every sector of society, decision makers are struggling with the complexity and velocity of change in an increasingly interdependent
world.
The context for decision-making has evolved,
and in many cases has been altered in revolutionary ways. In the decade ahead, our lives will be more intensely shaped by
transformative forces, including economic, environmental, geopolitical, societal and technological seismic shifts.
The signals are already apparent with the
rebalancing of the global economy, the presence of over seven billion people and the societal and environmental challenges linked
to both.
The resulting complexity threatens to overwhelm countries, companies, cultures and communities.
Klaus SchwabFounder and Executive ChairmanWorld Economic Forum
THE VUCA ENVIRONMENTwww.strategicforum.co.za

3
Central Bank Governor Gill Marcus
The aftermath of the global financial crisis of 2008
has years to run, according to Reserve Bank
governor Gill Marcus.
Referring to the recession in Europe and its
impact on the rest of the world, she said: “The depth of the crisis is so profound that, even if nothing gets worse, it’s going to take a very long time to come out of it.”
And she noted: “We’re not yet in a situation where nothing gets worse. I only hope that in
seven year’s time we can say we are okay.” (Business Report: 23 April 2013)
THE VUCA ENVIRONMENTwww.strategicforum.co.za
4
THE VUCA ENVIRONMENTwww.strategicforum.co.za
The VUCA environment.
The transition to the new normal is a sea change for the global economy. The full impact will take years, if not decades, to become clear.
In the meantime, the world will face much greater uncertainty, as conflicting views of the world play out on a day-to-day basis. As a result, companies need to plan for a VUCA environment during the transition that is now underway.
Volatility, Uncertainty, Complexity and Ambiguity will be the order of the day.

5
DENIALCompanies - carry on past “tip”Policy makers – stimulus spending (or austerity, or both)
ANGERImplications of change becomes more obviousNeed to BLAME someone for the disaster
BARGAININGCompanies – Asset sales, closuresIndividuals – Stop borrowing, start saving
DEPRESSIONReality begins to be confrontedGrowing awareness of what has been lost
ACCEPTANCEFinally people accept what has happenedNew opportunities emerge out of extreme pessimism
THE NEW NORMAL
The paradigm of loss model: Elizabeth Kuler-Ross: Source International eChem
THE TIPPING POINT
THE VUCA ENVIRONMENT
2008 2012 2020
?
THE VUCA ENVIRONMENT: THE NEW NORMALwww.strategicforum.co.za

6
The New Normal values . . . And Strategic implicationsUnilever is an excellent example of a company that already lives by New Normal values. But the application of these
values needs to constantly evolve, as this extract from the Guardian’s Sustainable Living blog illustrates:
In November 2010 Unilever announced its Sustainable Living Plan, which sets out its sustainability commitments
and targets for the next decade. This plan is not just central to the company’s business strategy but, in the words of CEO
Paul Polman, is a “new business model”. It aims to decouple business growth from environmental impact, so that
while the company increases in size it will reduce its total environmental footprint across the value chain.
“Growth at any cost is not viable,” said Polman. “We have to develop new ways of doing business which increase the positive social benefits arising from Unilever’s activities, while reducing our environmental impacts. We want to be sustainable in every sense of the word.”
Unilever’s plan has three distinctive features: It covers social and economic, as well as environmental challenges.
All Unilever’s products and brands are included, not just a few. It also covers the company’s entire value chain, from sourcing raw materials to consumer use of its products and their disposal. With
thousands of products that are used 2 billion times a day in more than 280 countries, this represents a massive undertaking.
The company has also set itself some stretching targets. By 2020 it aims to help more than a billion people take action to improve their health and wellbeing, halve the environmental footprint of its products, source 100% of its agricultural raw materials sustainably, and link more than half a million smallholder farmers and small-scale distributors to its supply chain.
Halving the greenhouse gas footprint of Unilever products across their life cycle by 2020 represents an equally
big challenge. Only 5% of these impacts come from manufacturing and transport. By far, the largest contribution comes from consumer use which accounts for 68% of the total, most of it caused by people showering, washing their hair and
doing laundry. To achieve its goal Unilever will have to provide consumers with more products that use less water.
THE VUCA ENVIRONMENT: THE NEW NORMALwww.strategicforum.co.za

7
Looking over the edge of a cliff (November 2012)
With the Marikana tragedy ushering in a period of industrial turmoil
which, aggravated by the lack of service delivery, can escalate into afull-blown South African version of the Arab Spring, we haverevised the probability yet again.
While we are keeping Premier League at 50%, we now have
amended the chances of a peaceful versus violent, anarchicdecline from 40:10 to 50:50 and therefore accord the Second
Division and Failed State scenarios each a 25% probability.(www.mindofafox.com
Clem Sunter
THE VUCA ENVIRONMENT: THE NEW NORMALwww.strategicforum.co.za

8
Looking over the edge of a cliffSince writing the column about South Africa looking over the edge of a cliff,
we have had plenty of responses from: "you should have said teeteringon the edge" to: "anywhere but South Africa if you're thinking of
investing in the continent of Africa.“
Nevertheless, the two comments we want to respond to are from
respected members of the political and business establishments. Neither
said it to us face to face; we read about their opinion in the media. Thefirst stated that there was no crisis and there was no cliff, basicallydismissing the idea of a 25% probability on a "Failed State". The
second one said that South Africa has always lurched from one extreme to
another, but we have always managed to right the ship and survive. Havea glass of nice red South African wine and think more hopefully about the
future!
We put the cat among the pigeons precisely because we believe thechances of a real crisis have risen dramatically (though we still give a50% probability to South Africa staying in the "Premier League").(www.mindofafox.com)
THE VUCA ENVIRONMENT: THE NEW NORMALwww.strategicforum.co.za

9
50%
25% 25%
THE VUCA ENVIRONMENT: THE NEW NORMALwww.strategicforum.co.za

10
Matamela Cyril
Ramaphosa was elected
as Deputy President of the African National
Congress at the ANC
National Conference in
Mangaung in December 2012.
Cyril is a flagBy Clem Sunter, originally published on News24.com on 28 November 2012
When I was told earlier this week that Cyril
Ramaphosa might be nominated as Jacob Zuma's
deputy and there might be a chance that the deputy position could be changed into that of Prime
Minister, something went ping in my mind. This
could signal a major shift in ANC strategy. Zumawould become the equivalent of non-executive chairman of the country with Cyril as CEO.
Cyril's nomination to a key ANC position would be a
very positive flag and would make the conference in December a much more important affair for the
immediate future of the country. Overnight, it would transform foreign perceptions of South Africa being on a downward slide to nowhere.Instead, people might even talk of a second miracle being close at hand - the one that has to take place in the economic sphere.
THE VUCA ENVIRONMENT: THE NEW NORMALwww.strategicforum.co.za

11
LegendAlert
WarningModerate
SustainableNo Information / Dependent Territory
THE VUCA ENVIRONMENT: FAILED STATE DYNAMICSwww.strategicforum.co.za

12
THE VUCA ENVIRONMENT: FAILED STATE DYNAMICSwww.strategicforum.co.za

13
Indicators of a failed state12 factors are used by Fund For Peace to ascertain the status of a country.[7]
Social• Mounting demographic pressures.
• Massive displacement of refugees, creating severe
humanitarian emergencies.• Widespread vengeance-seeking group grievance.• Chronic and sustained human flight.
Economic• Uneven economic development along group lines.• Severe economic decline.Political• Criminalization and/or delegitimization of the state.• Deterioration of public services.
• Suspension or arbitrary application of law;
widespread human rights abuses.
• Security apparatus operating as a "state within a state".
• Rise of factionalized elites.• Intervention of external political agents.
THE VUCA ENVIRONMENT: FAILED STATE DYNAMICSwww.strategicforum.co.za

14
There are some disquieting signs. State failure occurs along a continuum: dysfunctional institutions, popular protests (such as the regular service delivery
protests), illegal and often violent strikes and the evident growing alienation of young, urban blacks, who face a lifetime of unemployment.
There are other danger signals of threats to key institutions: cadre deployment, which has already played havoc with the efficient running of the government in all spheres; the weakness of parliamentary oversight; and the reluctance to answer
probing parliamentary questions. The list of manifestations of a reluctance to heed
the constitutional requirement of transparency is long.
The quest for hegemonic control of all the levers of power has gone far. Increasingly, independent sources of information will be shackled, with
consequences for the freedom of the press. Obstreperous civil society organisations will feel the heat — remember: a strong civil society is one of the best guarantors of a democratic political system. Our democratic institutions
have survived, but longer-term threats are apparent. Endemic corruption is having a corrosive effect. Whether Planning Minister Trevor Manuel’s stirring calls
for public servants to mend their ways will have any effect is debatable. (David Welsh, retired Professor of Political Science; Paul Hoffman, Director, Institute for Accountability in Southern Africa; Business Day, 7 March 2013)
THE VUCA ENVIRONMENT: FAILED STATE DYNAMICSwww.strategicforum.co.za

15
While it is true that the complex of factors that lead to the failed state mutate into a vicious cycle, there is nothing inevitable about failure. But strong corrective
measures are required and those require strong leadership, which is precisely what we lack. The ANC is faction-ridden and its alliance with the South African
Communist Party and Congress of South African Trade Unions makes it difficult to
take decisive steps.
Many African nationalist parties begin to fragment after 20-25 years in office. The period of fragmentation is also a time of huge danger to democratic
institutions, as threatened politicians flail about in search of scapegoats and other
imagined causes.
Of the 10 countries least likely to fail, only three come from the English-speaking
world — New Zealand, Canada and Australia. South Africa at present ranks a lowly 66 and falling, but stands well away from the tail-enders, Somalia, South Sudan, the Democratic Republic of Congo and Pakistan, to name a
few.(David Welsh, retired Professor of Political Science; Paul Hoffman, Director,
Institute for Accountability in Southern Africa; Business Day, 7 March 2013)
THE VUCA ENVIRONMENT: FAILED STATE DYNAMICSwww.strategicforum.co.za
16
There are four social indicators.
Demographic pressures, such as those created by disputes over the ownership
and occupancy of land, redistribution of land and environmental issues, such as access to water and food, count. So, too, the presence of refugees in the border
and urban areas of South Africa is considered, as are internal migrations. The internal displacement of people who live in squalor in informal settlements for long periods is regarded as a symptom of failure. A 'legacy of vengeance-seeking
group grievances', such as those harboured by locals against foreigners
(xenophobic attacks) and locals against Afrikaner farmers (farm murders), as well as nationalistic political rhetoric ('the land was stolen from us') feature.
Flight from the country under scrutiny, by its intellectuals and its middle class, is the last of the social factors. The shrinking size of the 'white' population and its
own demographic profile bear testimony to this factor.
(David Welsh, retired Professor of Political Science; Paul Hoffman, Director,
Institute for Accountability in Southern Africa; Business Day, 7 March 2013)
THE VUCA ENVIRONMENT: FAILED STATE DYNAMICSwww.strategicforum.co.za
17
Then there are economic factors that are regarded as relevant —a high Gini co-efficient such as South Africa’s and disparity in the development of
groups. In short, high levels of inequality contribute to failure. Education levels and the state of the education system are vital to economic
success and are considered, together with the rate of economic decline of the country being assessed. Poverty, unemployment and inequality nurture failure while prosperity, full
employment and the achievement of equality in a sustainable fashion through
proper education and long-term job creation are the conditions for success.
Measures such as the infant mortality rate, gross national product, per-capita
income, devaluation of the currency, commodity prices, foreign investment, the size of the drug trade and, of course, the prevalence of corruption are relevant to
economic health.
There are six political indicators that bear mention:
the delegitimisation or criminalisation of the state; the progressive deterioration of
public services; the widespread violation of human rights; the security apparatus as a 'state within a state'; the rise of factionalised elites; and intervention of other
states and external factors.(David Welsh, retired Professor of Political Science; Paul Hoffman, Director, Institute for Accountability in Southern Africa; Business Day, 7 March 2013)
THE VUCA ENVIRONMENT: FAILED STATE DYNAMICSwww.strategicforum.co.za

18
Overall, our picture is not a pretty one, and Sunter’s scenario-planning prognostication appears chillingly accurate.
The legitimacy of the state depends on the wholehearted embrace of its value
system as reflected in the constitutional dispensation in place.
Our constitution is sound, but it is constantly being undermined or hollowed out by the tenets of the 'national democratic revolution', which is being pursued by
those in the ANC who do not genuinely subscribe to the National Development
Plan embraced by the ANC in Mangaung.
Without genuine fealty to constitutionalism, our slide down the ratings is likely to continue.(David Welsh, retired Professor of Political Science; Paul
Hoffman, Director, Institute for Accountability in Southern Africa; Business Day, 7 March 2013)
THE VUCA ENVIRONMENT: FAILED STATE DYNAMICSwww.strategicforum.co.za

19
“WHATEVER you do, don’t employ or house anyone,"
said local farmers when Don Rush, a foreign industrialist,
bought his farm. "If you do, they won’t work and you’llnever get rid of them. Unions will torment you. You’ll
fund extra benefits. You’ll waste time and money in
the Commission for Conciliation, Mediation andArbitration. They’ll take some of your land. It’s a
nightmare.“
This, he explained, was why he would not give full-time
jobs or housing to workers encountered during a hike up
the escarpment. "Elsewhere," he said, "we co-operate
with workers. Here, we avoid them. Elsewhere, wethink about how to motivate and keep them; we
arrange medical, savings, housing, training and
pension schemes, even scholarships for their kids.Here we minimise employment.“ (Business Day, 6
March 2013)
Leon Louw,Executive Director of the Free Market Foundation.
THE VUCA ENVIRONMENT: THE NEW NORMALwww.strategicforum.co.za

20
Minister in the Presidency Trevor Manuel(Picture: Beeld)
It is time for government to take
responsibility for its actions, Minister in the Presidency Trevor Manuel said on
Wednesday.
"We [government] should no longer say
it's apartheid's fault," Manuel told
reporters at the government leadership summit in Pretoria.
"We should get up every morning and recognise we have responsibility. There
is no longer the Botha regime looking
over our shoulder, we are responsible
ourselves."
Manuel: Time to stop blaming apartheid
THE VUCA ENVIRONMENT: THE NEW NORMALwww.strategicforum.co.za

21
ZUMA: A mistake to stop blaming apartheid
Zuma said it was impossible to see complete change in just 20 years. The damage done by apartheid would be with the country for some time, he said.
"To suggest we cannot blame apartheid for what is
happening in our country now, I think is a mistake to
say the least.
"We don't need to indicate what it is apartheid did. The
fact that the country is two in one, you go to any city
there is a beautiful part and squatters on the other
side, this is not the making of democracy and we can't stop blaming those who caused it," said Zuma.
THE VUCA ENVIRONMENT: THE NEW NORMALwww.strategicforum.co.za

22
Presidency denies Zuma-Manuel clash over legacy of apartheid
"Stating that the apartheid legacy and impact still exist and will
linger on for a long time does not mean that the
president is saying that public servants should
use it to excuse laziness
and incompetence," spokesman Mac Maharajsaid in a statement. "The
point President Zuma
made is that it is impossible to reverse the
legacy of apartheid in only 20 years."
THE VUCA ENVIRONMENT: THE NEW NORMALwww.strategicforum.co.za

23
When Ramphele launched Agang earlier this year she said she intended to contest
the national elections next year.
She said South Africans she had been talking to were conscious that changing the
country would take time.
"People are resonating with Agang."
She said she was looking forward to the parliamentary process of getting to the
bottom of how the country got to this point.
Most people complained about housing, health and education.
"People feel they have been lied to about
what to expect," Ramphele said.
"They tell stories which are very sad."
THE VUCA ENVIRONMENT: THE NEW NORMALwww.strategicforum.co.za

24 © BMI-BRSCU
Available on Amazon.com
“This economic crisis
doesn’t represent the
cycle, it represents a
reset. It’s an emotional,
raw, social, economic
reset.” (General Electric
CEO Jeffrey Immelt)
“People who understand
that, will prosper; those
who don’t will be left
behind.”
THE VUCA ENVIRONMENT: THE NEW NORMALwww.strategicforum.co.za

25 © BMI-BRSCU
�The bubble was so big in the 1920s, that after it popped during the Great Depression, it would take 22 years for non-residential construction investment to regain its precrash peak and 24 years for real spending on residential construction to recover to its pre-crisis highs.
THE VUCA ENVIRONMENT: THE NEW NORMALwww.strategicforum.co.za

26 © BMI-BRSCU
Stage 1Hubris bornOf success
Stage 2Undisciplined
Pursuit of More
Stage 3Denial of Risk
and Peril
Stage 4Grasping for
Salvation
Stage 5Recovery and
Renewal
WELL FOUNDED HOPE
?
What will it take?
(Source: Based on Collins: How the Mighty Fall: 2009)
New mortgage loans and readvances by
THE NEW NORMAL ?
THE VUCA ENVIRONMENT: THE NEW NORMALwww.strategicforum.co.za
27 ©27© BMI-BRSCU
� It appears that the limits to growth have been
reached and the Industry is once again on the
cusp of change and standing on the burning platform. � It is a time of discomfort with a real danger of
strategic drift. It means gradual demise for the
industry or quantum change back to its potential
growth rate.
� It is the time to challenge old mindsets,
assumptions and established industry recipesand to expose paradigm blind spots. Only then
can reinvention and the required growth be achieved.
THE VUCA ENVIRONMENTwww.strategicforum.co.za
28
THE VUCA ENVIRONMENT: THE NDPwww.strategicforum.co.za

29
THE VUCA ENVIRONMENT: THE NDPwww.strategicforum.co.za

30
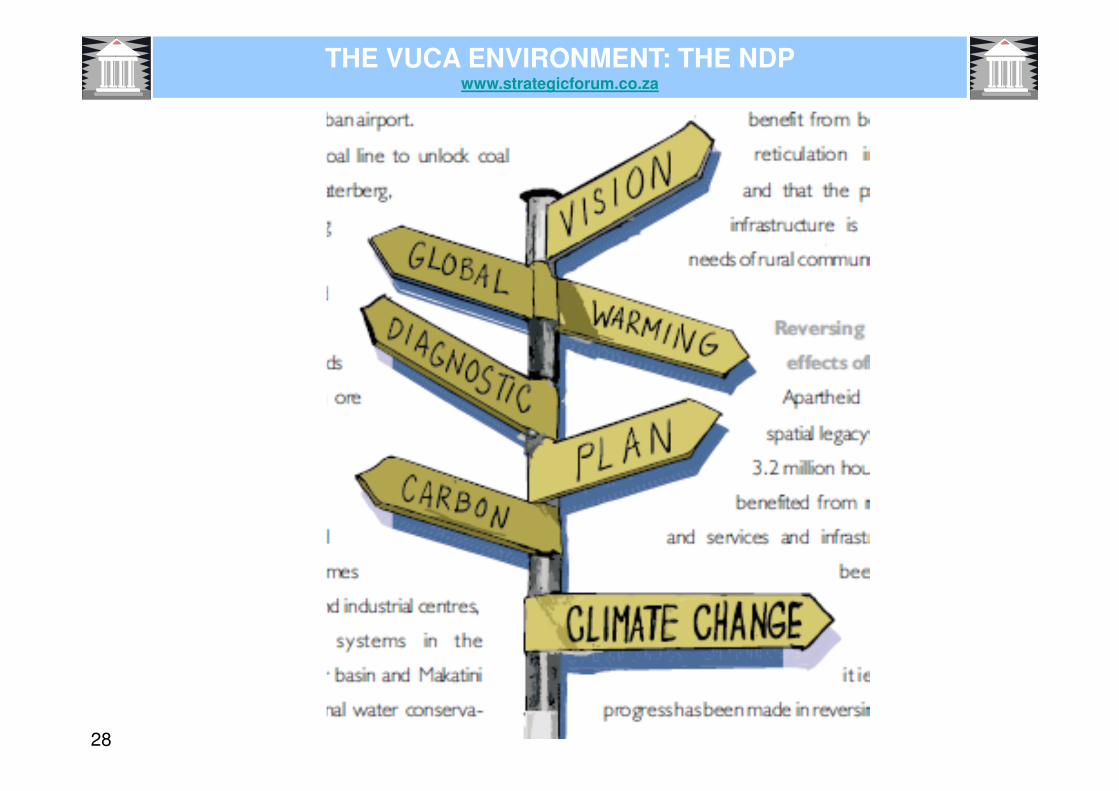
In the past 18 months the South African economy continued to function significantly below full capacity, although in a number of areas bottlenecks visibly inhibited economic progress. The National Planning Commission released a vision statement and development plan for the country in November 2011, targeting the elimination of poverty and reduction of inequality by 2030 through appropriate changes, hard work, leadership and unity. Having identified the key developmental challenges facing the country and its people, the commission developed a plan focusing on
– the creation of jobs; – improving South Africa’s infrastructure; – appropriate transition to a low-carbon economy; – an inclusive and integrated rural economy; – reversing the spatial effects of apartheid; – improving the quality of education, training and innovation; – providing quality healthcare for all; – social protection; – building safer communities; – reforming the public service to build a capable state; – eliminating corruption; and – transforming society and uniting the country.
Addressing the infrastructure bottlenecks was recognised as of particular importance. In 2011, to ensure timeous and effective implementation in this area, Cabinet created the Presidential Infrastructure Co-ordinating Commission, chaired by the President and including half the members of Cabinet, the nine provincial premiers, and the mayors of the metropolitan areas. The President underlined the need for speeding up the capital programmes of the public sector in his State of the Nation address to Parliament early in 2012, when he unveiled the government’s infrastructure development programme. (SARB, Annual Economic Report: 2012)
THE VUCA ENVIRONMENT: THE NDPwww.strategicforum.co.za
31
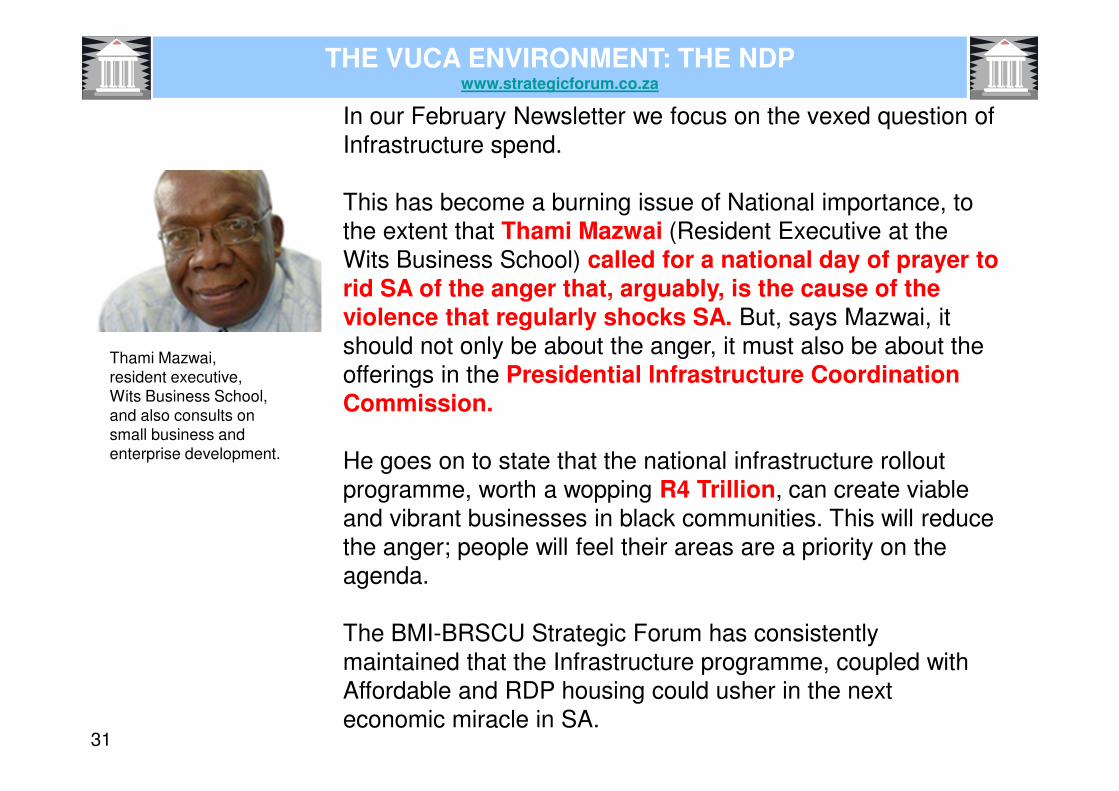
Thami Mazwai, resident executive, Wits Business School,and also consults on small business and enterprise development.
In our February Newsletter we focus on the vexed question of Infrastructure spend.
This has become a burning issue of National importance, to the extent that Thami Mazwai (Resident Executive at the
Wits Business School) called for a national day of prayer to rid SA of the anger that, arguably, is the cause of the violence that regularly shocks SA. But, says Mazwai, it
should not only be about the anger, it must also be about the
offerings in the Presidential Infrastructure Coordination Commission.
He goes on to state that the national infrastructure rollout
programme, worth a wopping R4 Trillion, can create viable
and vibrant businesses in black communities. This will reduce the anger; people will feel their areas are a priority on the
agenda.
The BMI-BRSCU Strategic Forum has consistently
maintained that the Infrastructure programme, coupled with Affordable and RDP housing could usher in the next economic miracle in SA.
THE VUCA ENVIRONMENT: THE NDPwww.strategicforum.co.za

32
(Source: WEF: Global Risks 2013: Eighth Edition)
THE VUCA ENVIRONMENT: THE NDPwww.strategicforum.co.za

33 © BMI-BRSCU
BMI Est Q4 REV % Change GFCF BMI FC % Change MAT FC (DEC) % Change GFCF MAT FC BMI FC % Change GFCF MAT FC
PRIVATE RESIDENTIAL 2010 2011 2011 2011 2012 2012 2012 MAT FC 2012 Q4 2012 2013 2013 2013
- Dwelling-houses < 80 m2 1 835 2 297 25.15% 2 337 1.72% 2 337 1.72% 2 517 7.70%
- Dwelling-houses > 80 m2 12 323 13 372 8.51% 14 576 9.00% 14 576 9.00% 14 628 0.35%
- Townhouses & Flats 5 646 4 845 -14.18% 5 852 20.77% 5 852 20.77% 5 127 -12.37%
- Other (Incl. hotels & casinos) 1 209 863 -28.59% 305 -64.65% 305 -64.65% 944 209.30%
- Additions & alterations 7 392 7 871 6.48% 6 867 -12.75% 6 867 -12.75% 8 242 20.01%
TOTAL PRIVATE RESIDENTIAL 28 405 29 248 2.97% 29 937 2.35% 29 937 2.35% 31 457 5.08%
PUBLIC RESIDENTIAL
- Affordable Housing 18 028 25 316 40.43% 25 949 2.50% 25 949 2.50% 25 490 -1.77%
- General Government 3 762 2 940 -21.85% 4 210 43.20% 4 210 8.30% 3 643 -13.47%
- Public corporations 35 70 100.00% 117 67.14% 117 -60.97% 38 -67.83%
- Private Business Enterprises 8 460 7 882 -6.83% 9 039 14.69% 9 039 17.38% 9 378 3.74%
TOTAL PUBLIC RESIDENTIAL 30 284 36 208 19.56% 39 315 8.58% 39 315 8.58% 38 548 -1.95%
TOTAL RESIDENTIAL (Incl AH) 58 690 65 456 11.53% 69 252 5.80% 69 252 5.80% 70 005 1.09%
TOTAL GFCF RES (Excludes AH) 40 662 40 140 -1.28% 40 140 43 303 7.88% 43 303 7.88% 43 303 44 515 2.80% 44 515
PRIVATE NON-RESIDENTIAL
- Offices 3 623 2 352 -35.09% 3 150 33.97% 3 150 33.97% 2 285 -27.48%
- Shops 3 342 3 319 -0.69% 2 790 -15.93% 2 790 -15.93% 2 792 0.07%
- Industrial & warehouse 3 686 3 140 -14.81% 4 714 50.12% 4 714 50.12% 3 427 -27.30%
- Other 926 1 269 37.07% 1 060 -16.44% 1 060 -16.44% 1 142 7.73%
- Additions & Alterations 3 866 3 601 -6.84% 3 315 -7.96% 3 315 -7.96% 3 046 -8.10%
TOTAL PRIVATE NON-RESIDENTIAL 15 443 13 681 -11.41% 15 029 9.86% 15 029 9.86% 12 692 -15.55%
PUBLIC NON-RESIDENTIAL
- General Government 10 000 12 157 21.57% 15 094 24.16% 15 094 23.02% 14 896 -1.31%
- Public Corporations 3 785 5 617 48.40% 6 033 7.41% 6 033 -37.41% 3 497 -42.03%
- Private Business Enterprises 25 976 29 496 13.55% 28 773 -2.45% 28 773 6.16% 35 800 24.42%
TOTAL PUBLIC NON-RESIDENTIAL 39 761 47 270 18.88% 49 900 5.56% 49 900 5.56% 54 193 8.60%
TOTAL GFCF NON RESIDENTIAL 55 204 60 951 10.41% 60 951 64 929 6.53% 64 929 6.53% 64 929 66 885 3.01% 66 885
TOTAL GFCF RES AND NON RES 95 866 101 091 5.45% 101 091 108 232 7.06% 108 232 7.06% 111 401 2.93%
- Unrecorded Res Additions and Alterations 28 664 28 117 -1.91% 26 629 -5.29% 26 629 -5.29% 25 931 -2.62%
- Unrecorded Non Res Additions and Alterations 4 119 4 046 -1.79% 3 532 -12.69% 3 532 -12.69% 3 246 -8.10%
TOTAL UNRECORDED ADD'S & ALT'S 32 783 32 163 -1.89% 30 161 -6.22% 30 161 -6.22% 29 177 -3.26%
TOTAL INVESTMENT IN BUILDING 146 677 158 570 8.11% 164 342 3.64% 164 342 3.64% 166 068 1.05%
BC as % of Total Investment in Building 29.89% 27.07% 27.36% 27.36% 26.58%
Private Sector as % of Total Investment in Building 52.25% 47.36% 45.71% 45.71% 44.15%
CONSTRUCTION
47 909 59 078 23.31% 68 022 15.14% 68 022 5.00% 72 608 6.74%
85 436 91 483 7.08% 90 912 -0.62% 90 912 4.00% 88 975 -2.13%
24 891 25 817 3.72% 26 838 3.95% 26 838 6.25% 28 833 7.43%
TOTAL INVESTMENT IN CONSTRUCTION 158 236 176 378 11.47% 176 378 185 772 5.33% 185 772 5.00% 185 772 190 416 2.50% 190 416
TOTAL INV IN BLDNG AND CONSTR 304 913 334 948 9.85% 350 114 4.53% 350 114 4.53% 294 004 356 484 1.82% 301 817
TOTAL GFCF CONSTRUCTION 158 236 185 772 185 772 185 772 190 416
TOTAL GFCF BLDNG AND CONSTR 304 913 350 114 350 114 350 114 356 484 356 484
* Res GFCF excludes Affordable Housing 47.34% 46.94%
* Non Res GFCF includes Public Sector 52.66% 53.06%
** Stats SA
*** StatsSA and BMI-BRSCU Workings
Source: BMI-BRSCU
SHORTTERM OUTLOOK FOR THE BUILDING & CONSTR INDUSTRY: 2012: R*MILLION (CURRENT VALUE)
- General government
- Public corporations
- Private Business Enterprises
34
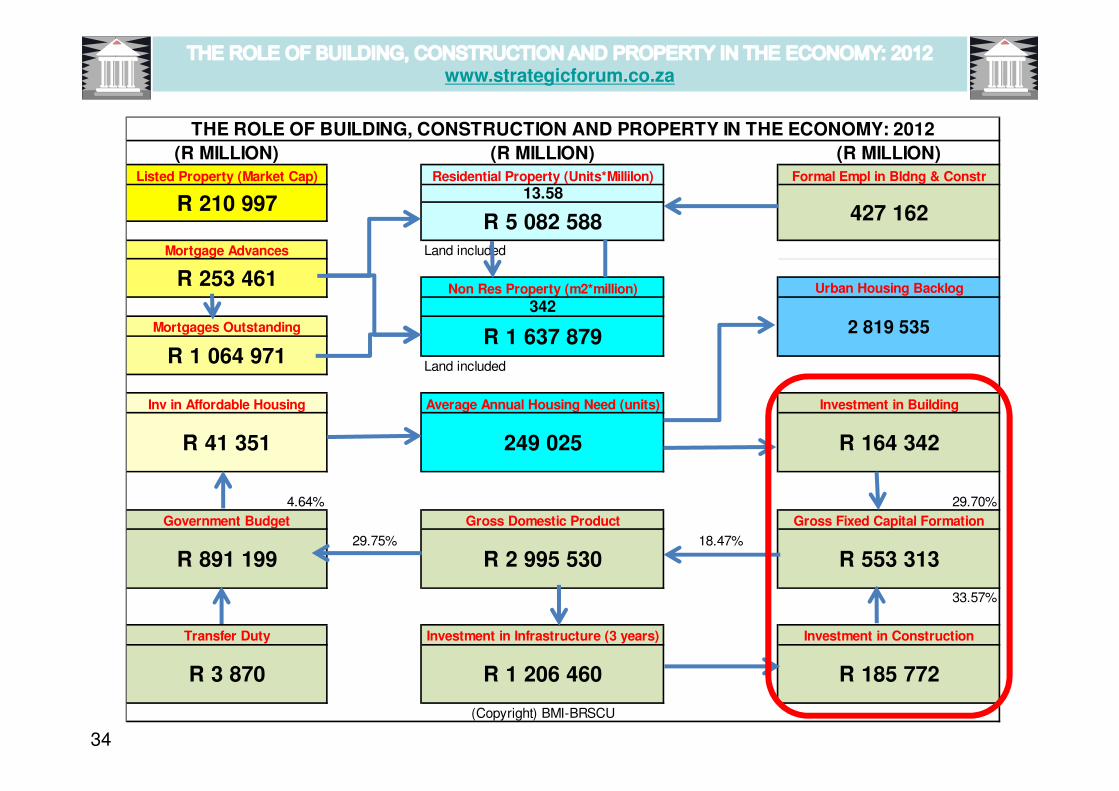
(R MILLION) (R MILLION)Listed Property (Market Cap) Formal Empl in Bldng & Constr
Mortgage Advances Land included
Urban Housing Backlog
Mortgages Outstanding
Land included
Inv in Affordable Housing Investment in Building
4.64% 29.70%
Government Budget Gross Fixed Capital Formation
29.75% 18.47%
33.57%
Transfer Duty Investment in Construction
13.58
Gross Domestic Product
R 41 351 249 025 R 164 342
R 1 637 879
Average Annual Housing Need (units)
R 2 995 530R 891 199 R 553 313
R 3 870 R 1 206 460 R 185 772
(Copyright) BMI-BRSCU
2 819 535
R 253 461
R 1 064 971
Investment in Infrastructure (3 years)
(R MILLION)
R 5 082 588R 210 997
THE ROLE OF BUILDING, CONSTRUCTION AND PROPERTY IN THE ECONOMY: 2012
Residential Property (Units*Millilon)
Non Res Property (m2*million)
342
427 162
www.strategicforum.co.za
35
(R MILLION) (R MILLION)Listed Property (Market Cap) Formal Empl in Bldng & Constr
Mortgage Advances Land included
Urban Housing Backlog
Mortgages Outstanding
Land included
Inv in Affordable Housing Investment in Building
4.64% 29.70%
Government Budget Gross Fixed Capital Formation
29.75% 18.47%
33.57%
Transfer Duty Investment in Construction
13.58
Gross Domestic Product
R 41 351 249 025 R 164 342
R 1 637 879
Average Annual Housing Need (units)
R 2 995 530R 891 199 R 553 313
R 3 870 R 1 206 460 R 185 772
(Copyright) BMI-BRSCU
2 819 535
R 253 461
R 1 064 971
Investment in Infrastructure (3 years)
(R MILLION)
R 5 082 588R 210 997
THE ROLE OF BUILDING, CONSTRUCTION AND PROPERTY IN THE ECONOMY: 2012
Residential Property (Units*Millilon)
Non Res Property (m2*million)
342
427 162
www.strategicforum.co.za
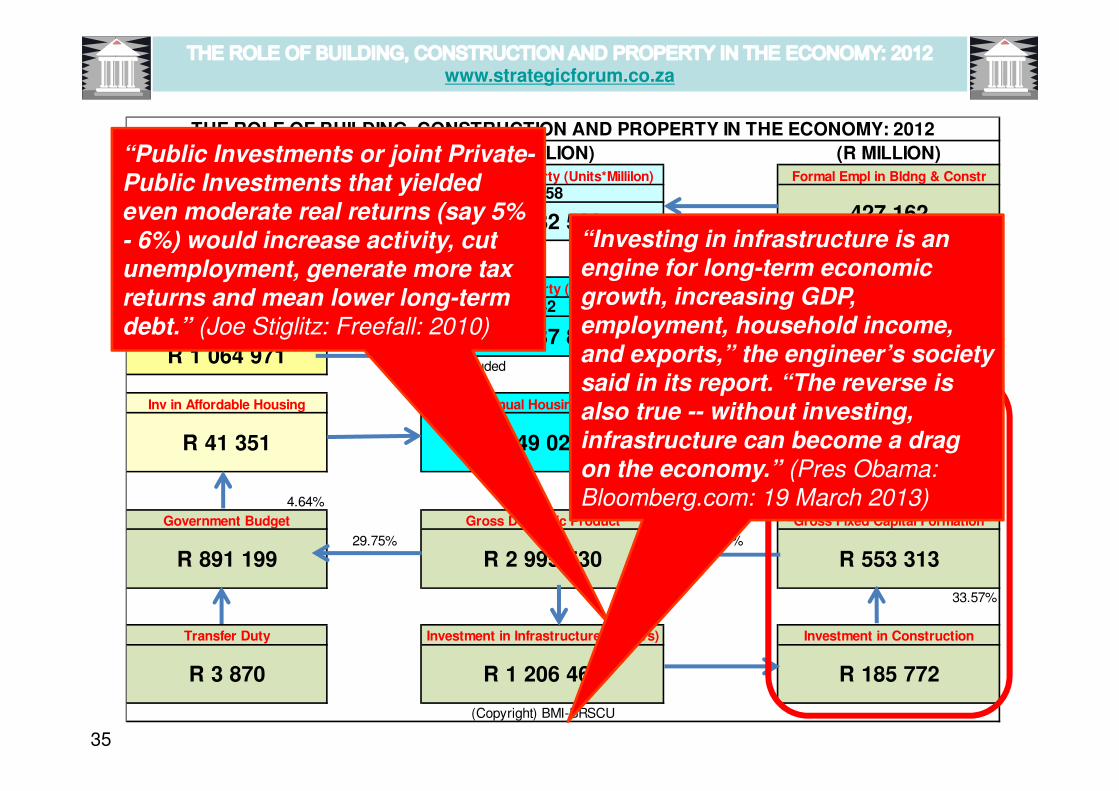
“Public Investments or joint Private-
Public Investments that yielded even moderate real returns (say 5%
- 6%) would increase activity, cut
unemployment, generate more tax returns and mean lower long-term
debt.” (Joe Stiglitz: Freefall: 2010)
“Investing in infrastructure is an
engine for long-term economic growth, increasing GDP,
employment, household income, and exports,” the engineer’s society
said in its report. “The reverse is
also true -- without investing, infrastructure can become a drag
on the economy.” (Pres Obama:
Bloomberg.com: 19 March 2013)
36
(R MILLION) (R MILLION)Listed Property (Market Cap) Formal Empl in Bldng & Constr
Mortgage Advances Land included
Urban Housing Backlog
Mortgages Outstanding
Land included
Inv in Affordable Housing Investment in Building
4.64% 29.70%
Government Budget Gross Fixed Capital Formation
29.75% 18.47%
33.57%
Transfer Duty Investment in Construction
13.58
Gross Domestic Product
R 41 351 249 025 R 164 342
R 1 637 879
Average Annual Housing Need (units)
R 2 995 530R 891 199 R 553 313
R 3 870 R 1 206 460 R 185 772
(Copyright) BMI-BRSCU
2 819 535
R 253 461
R 1 064 971
Investment in Infrastructure (3 years)
(R MILLION)
R 5 082 588R 210 997
THE ROLE OF BUILDING, CONSTRUCTION AND PROPERTY IN THE ECONOMY: 2012
Residential Property (Units*Millilon)
Non Res Property (m2*million)
342
427 162
www.strategicforum.co.za
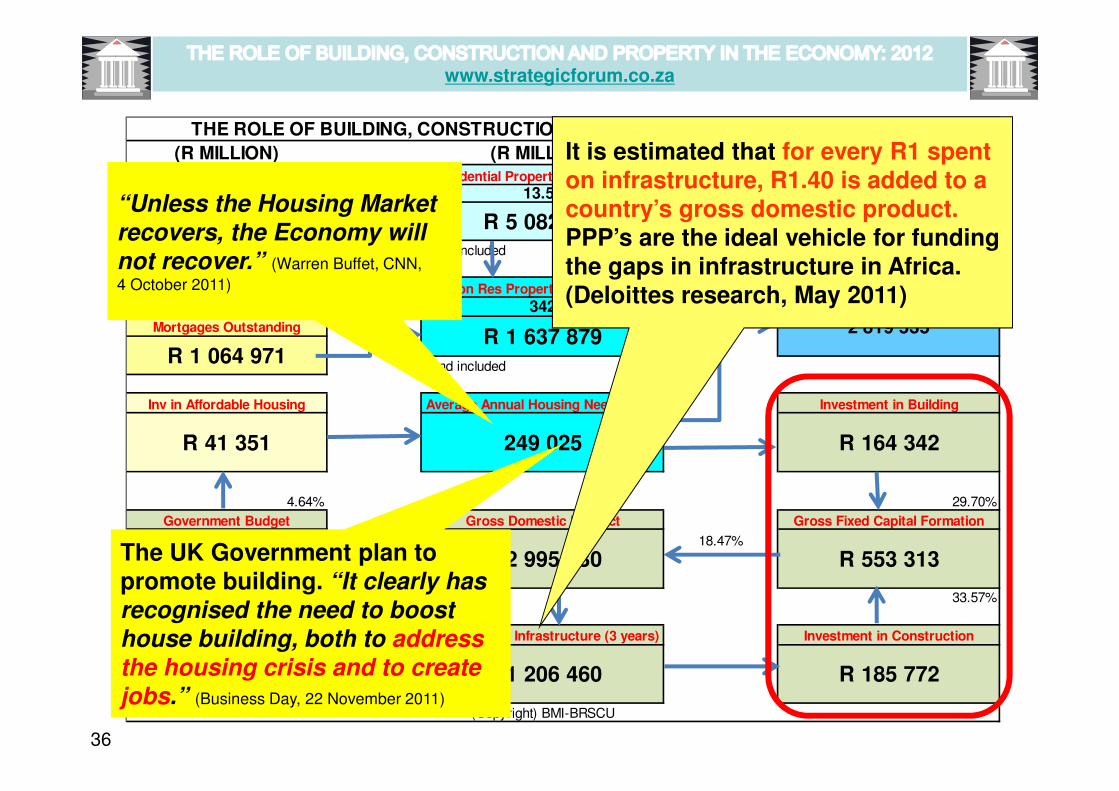
“Unless the Housing Market recovers, the Economy will
not recover.” (Warren Buffet, CNN,
4 October 2011)
It is estimated that for every R1 spent on infrastructure, R1.40 is added to a country’s gross domestic product.PPP’s are the ideal vehicle for funding the gaps in infrastructure in Africa. (Deloittes research, May 2011)
The UK Government plan to promote building. “It clearly has
recognised the need to boost house building, both to address
the housing crisis and to create jobs.” (Business Day, 22 November 2011)

37
-80%-70%-60%-50%-40%-30%-20%-10%0%10%20%30%40%50%60%70%80%90%100%110%120%130%
Go
ld b
oo
m
SA
SO
L I
I
SA
SO
L I
II
Au
ste
rity
pa
cka
ge
Ru
bic
on
sp
ee
ch
De
bt sta
nd
still
Eco
no
mic
re
cove
ry
Ma
nde
la's
re
lea
se
De
mo
cra
tic E
lectio
n
Tra
nsitio
n t
o D
em
ocra
cy
Cu
rren
cy c
olla
pse
Wo
rld
Tra
de
Ce
ntr
e
BN
G H
ou
sin
g P
rog
ram
me
Su
b P
rim
e C
risis
(N
CA
)
23
8 1
47
0
50 000
100 000
150 000
200 000
250 000
300 000
350 000
400 000
450 000
19
79
19
80
19
81
19
82
19
83
19
84
19
85
19
86
19
87
19
88
19
89
19
90
19
91
19
92
19
93
19
94
19
95
19
96
19
97
19
98
19
99
20
00
20
01
20
02
20
03
20
04
20
05
20
06
20
07
20
08
20
09
20
10
20
11
20
12
Y/Y
Pe
rce
na
tag
e C
ha
ng
e
Defining Events
R M
illi
on
s (
Cu
rren
t V
alu
e)
Total Mortgage Loans and Readvances: 1979-2012 (Current Values) (Source: SARB, BMI-BRSCU Workings)
R233 Billion taken out of the system
in two years!
© BMI-BRSCU© BMI-BRSCU
The 2004 EARLY WARNINGS OF CHANGE had no impact on Industry Strategy.How did the Industry respond to the 2007 Sub-prime Crisis?
TOTAL MORTGAGE LOANS & RE-ADVANCES: 1979-2012www.strategicforum.co.za

38
0
5 000
10 000
15 000
20 000
25 000
30 000
35 000
40 000
45 00019
93/0
1
19
93/0
8
19
94/0
3
19
94/1
0
19
95/0
5
19
95/1
2
19
96/0
7
19
97/0
2
19
97/0
9
19
98/0
4
19
98/1
1
19
99/0
6
20
00/0
1
20
00/0
8
20
01/0
3
20
01/1
0
20
02/0
5
20
02/1
2
20
03/0
7
20
04/0
2
20
04/0
9
20
05/0
4
20
05/1
1
20
06/0
6
20
07/0
1
20
07/0
8
20
08/0
3
20
08/1
0
20
09/0
5
20
09/1
2
20
10/'0
7
20
11/'0
2
20
11/'0
9
20
12/'0
4
20
12/'1
1
R M
illi
on
s (
Cu
rre
nt
Va
lue
)
Total gross new mortgage loans and re-advances by Month: 1993- 2012 (December)(Source: SARB: KBP 2127M, BMI-BRSCU Workings)
Total gross new mortgage loans and re-advances 12 per. Mov. Avg. (Total gross new mortgage loans and re-advances )
2007= (2000)*548.4%
2012= (2000)*314,9%
2012= (2007)*57.4%
© BMI-BRSCU
www.strategicforum.co.za
The reduction in new mortgage advances following the introduction of the NCA in 2007 was very effective . . .
How did the Building Industry respond?
39
238147
235856
255510
259590
257484
257353
282204
300141
301592
441410
208488
0
100 000
200 000
300 000
400 000
500 000
600 000
2002 2003 2004 2005 2006 2007 2008 2009 2010 2011 2012 2013 2014 2015 2016 2017 2018 2019 2020
R M
illi
on
s (
Cu
rre
nt a
nd
Co
ns
tan
t 2
01
2
Va
lue
s)
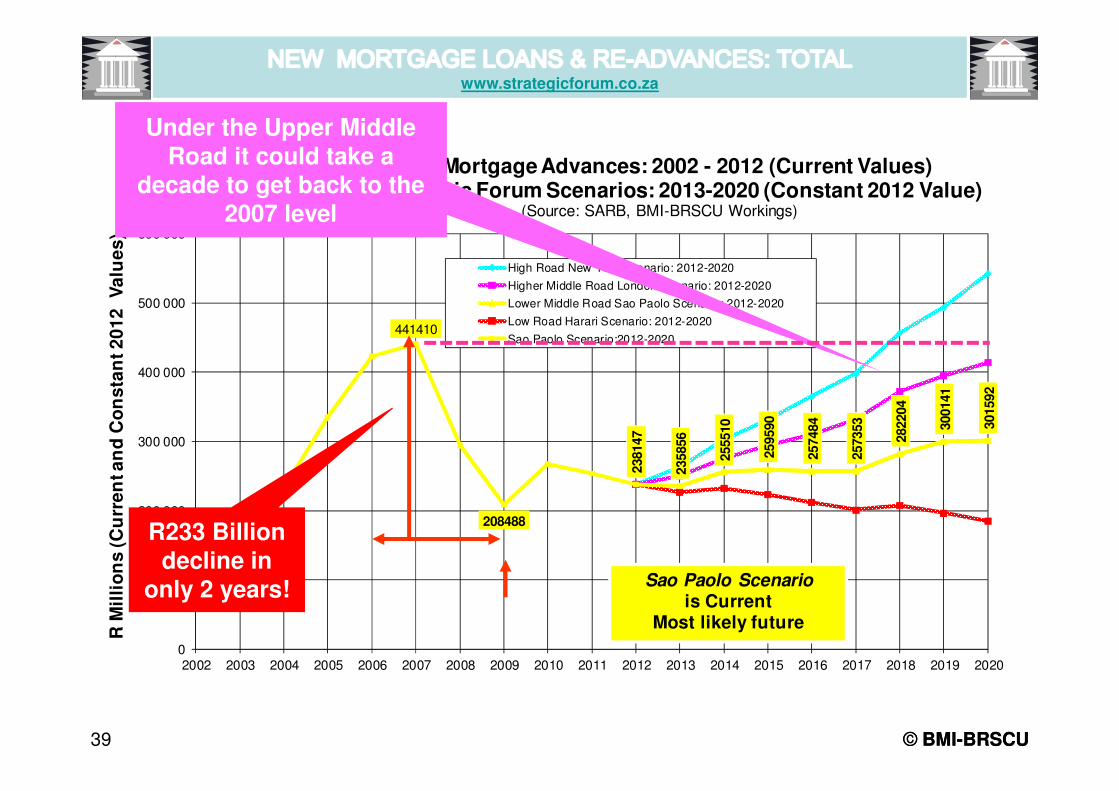
Total Mortgage Advances: 2002 - 2012 (Current Values)The Strategic Forum Scenarios: 2013-2020 (Constant 2012 Value)
(Source: SARB, BMI-BRSCU Workings)
High Road New York Scenario: 2012-2020
Higher Middle Road London Scenario: 2012-2020
Lower Middle Road Sao Paolo Scenario: 2012-2020
Low Road Harari Scenario: 2012-2020
Sao Paolo Scenario:2012-2020
Sao Paolo Scenariois Current
Most likely future
© BMI-BRSCU© BMI-BRSCU
R233 Billion decline in
only 2 years!
Under the Upper Middle Road it could take a
decade to get back to the 2007 level
www.strategicforum.co.za

40
“. . . . the market for new housing would be
affected by trends on the macro-economicfront, the state of household finances,consumer confidence and propertymarket- related factors.
“These factors will be reflected in new housingdemand and supply conditions, market activity,transaction volumes, price levels and the
demand for mortgage finance”.(Jacques du Toit, Bus. Report 22 April 2013)
www.strategicforum.co.za

41
STRUCTURAL SHIFT IN FINANCE: UNINTENDED CONSEQUENCES ? • Banks grow unsecured lending ahead of Home loans and asset
finance because unsecured lending is more profitable;• New regulations discourage banks from taking on long-term loans
like 20 year loans;• Global financiers believe this lowers one form of risk in the balance
sheets of banks, but asset finance, whether for homes or cars, is a healthier form of borrowing for consumers, because assets are usually productive;
• Unsecured lending is too easily used to finance consumption rather than anything that may offer a future return;
• What does worry is the declining prominence of mortgage lending. It will make home ownership more difficult and hurt fixed investment spending;
• That could have social and economic consequences as serious as the micro loan debacle of a decade ago. (Stuart Theobald, Business Day 16 July 2012)
www.strategicforum.co.za
42 © BMI-BRSCU
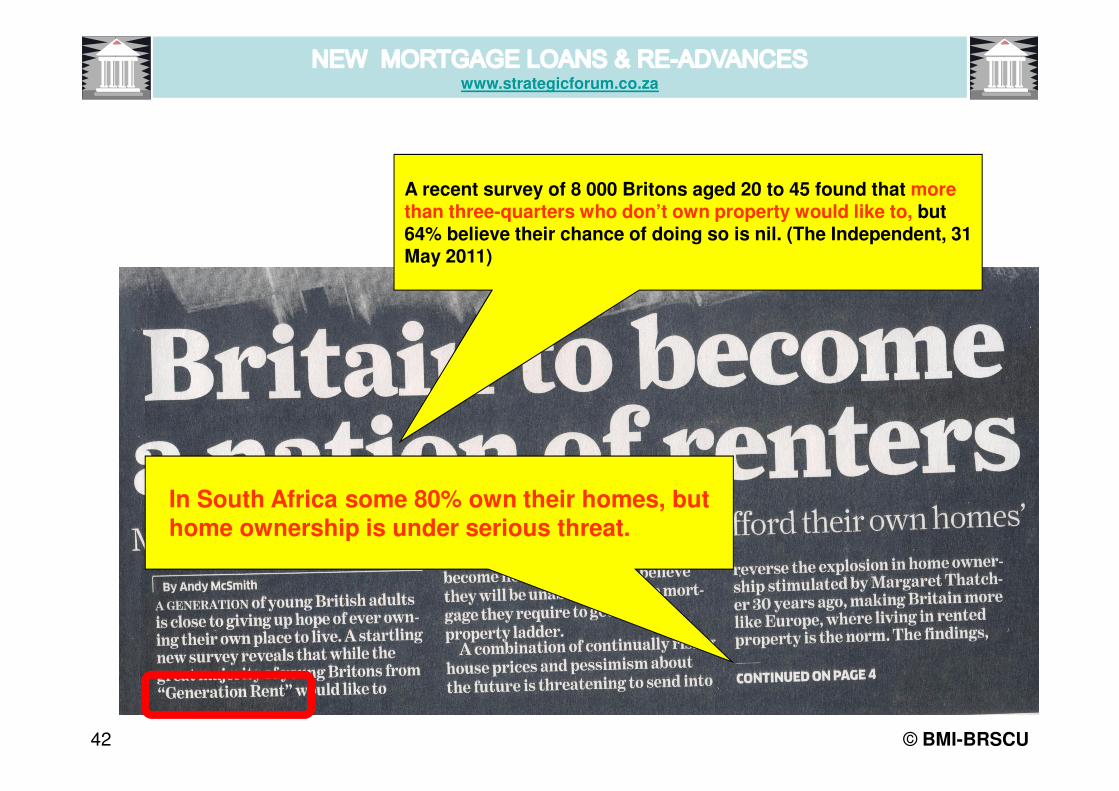
A recent survey of 8 000 Britons aged 20 to 45 found that more than three-quarters who don’t own property would like to, but 64% believe their chance of doing so is nil. (The Independent, 31 May 2011)
In South Africa some 80% own their homes, but home ownership is under serious threat.
www.strategicforum.co.za

43 © BMI-BRSCU
THE SA LIQUIDITY CYCLETHE REAL ECONOMY LAGS ABOUT 9 MONTHS BEHIND THE LIQUIDITY CYCLE
(Based on the Barings Liquidity Model : The Economist : 19 Nov. 1994)
��
��
��
��
��
��
��
��
CASHCASH
COINCIDE WITH ECONOMICUPSWING
COINCIDE WITH ECONOMICUPSWING
COINCIDE WITH ECONOMICDOWNSWING
COINCIDE WITH ECONOMICDOWNSWING
BONDSPROPERTYBONDSPROPERTY
EQUITIESPROPERTYEQUITIESPROPERTY
COMMODITIESCOMMODITIES
EQUITIESEQUITIES
BONDSBONDS
��
��
��
��
��
��
��
INVESTMENT CLIMATE
44
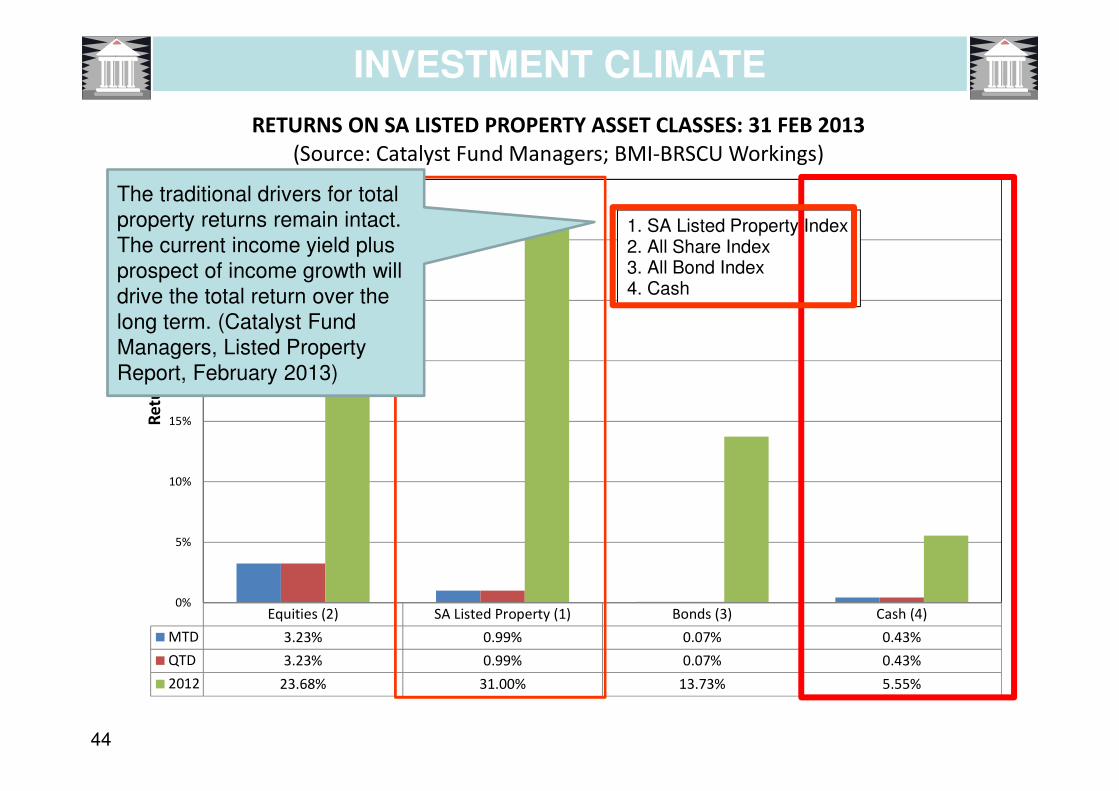
Equities (2) SA Listed Property (1) Bonds (3) Cash (4)
MTD 3.23% 0.99% 0.07% 0.43%
QTD 3.23% 0.99% 0.07% 0.43%
2012 23.68% 31.00% 13.73% 5.55%
0%
5%
10%
15%
20%
25%
30%
35%
Re
turn
%
RETURNS ON SA LISTED PROPERTY ASSET CLASSES: 31 FEB 2013
(Source: Catalyst Fund Managers; BMI-BRSCU Workings)
1. SA Listed Property Index2. All Share Index3. All Bond Index4. Cash
INVESTMENT CLIMATE
The traditional drivers for total
property returns remain intact.
The current income yield plus
prospect of income growth will
drive the total return over the
long term. (Catalyst Fund
Managers, Listed Property
Report, February 2013)
45
In 2011 economic agents exhibited preference for cash and deposits, as well as
fixed-interest securities relative to other financial instruments. Although such preference does
not reveal much about its demand- or supply-side origin, it shows the evolution of risk tolerance among agents. Credit extension was third in the rank as a preferred financial
instrument, in line with stricter lending criteria and a fragile demand for mortgage
funds. The latter’s persistence could hamper economic activity. (Source: SARB, Quarterly Bulletin, June 2012)
INVESTMENT CLIMATE

46 © BMI-BRSCU© BMI-BRSCU
There can be no return to high levels of employment and growth without finding a way of harnessing finance’s creative energies to allocate resources
and risk so effectively that it spurs and speeds economic growth.
We must never forget that credit, and the need for securitisation too, is at the heart of a modern financial system. (Gordon Brown: 2010: 109)
There is a compelling need for wide Stakeholder collaboration to address common problems.
INVESTMENT CLIMATE

47
-20%
-10%
0%
10%
20%
30%
40%
50%
Dem
ocra
tic E
lect
ion
Tra
nsiti
on to
De
mocr
acy
Curr
ency
Co
llapse
World
Tra
de
Ce
ntr
e
BN
G H
ousin
g P
rog
ram
me
Sub
Pri
me C
risi
s (N
CA
)
Socce
r W
orld C
up
0
2 000
4 000
6 000
8 000
10 000
12 000
14 000
19
93
/01
19
94
/01
19
95
/01
19
96
/01
19
97
/01
19
98
/01
19
99
/01
20
00
/01
20
01
/01
20
02
/01
20
03
/01
20
04
/01
20
05
/01
20
06
/01
20
07
/01
20
08
/01
20
09
/01
20
10
/'01
20
11
/'01
20
12
/'01
CU
M Q
/Q (
PR
EV
IOU
S Y
EA
R)
% C
HA
NG
E
Defining Events
R M
ILL
ION
S (
CU
RR
EN
T V
AL
UE
S)
GFCF RESIDENTIAL BUILDING: Q1 1993-Q4 2012: CURRENT VALUESCUMULATIVE YTD Q ON Q (PREVIOUS YEAR) % CHANGE
(Source: SARB; BMI-BRSCU Workings)
CUM YTD Q4 2012 VS Q4 2011 = + 9,19%
CUM Q4 2012 VS 2011 = R43 303 MIO VS R39 657 MIO = + 9,19%ON TOP OF DECLINE OF - 2,47% IN CUM Q3 2011 VS 2010
© BMI-BRSCU© BMI-BRSCU
GFCF RESIDENTIAL BUILDING: Q1 1993-Q4 2012www.strategicforum.co.za

48
CumRes/Q
CUM Q/Q GFCF RESIDENTIAL 2012 10 043 20 891 32 223 43 303
CUM GFCF RESIDENTIAL 2013 10 318 21 342 32 866 44 515
CUM Q/Q % CHANGE 2013 VS 2012 2.74% 2.16% 2.00% 2.80%
CUM Q/Q % CHANGE 2012 VS 2011 8.51% 8.94% 9.30% 9.19%
0.00%
1.00%
2.00%
3.00%
4.00%
5.00%
6.00%
7.00%
8.00%
9.00%
10.00%
0
5 000
10 000
15 000
20 000
25 000
30 000
35 000
40 000
45 000
50 000
Cu
m Q
/Q P
erc
en
tag
e C
han
ge
R M
illio
ns
CUM Q/Q GFCF RESIDENTIAL 2013 VS 2012 (FC)(Source: SARB, BMI-BRSCU Workings)
MAT FORECAST
ACTUAL
GFCF RESIDENTIAL BUILDING: Q1 1993-Q4 2012www.strategicforum.co.za

49 © BMI-BRSCU© BMI-BRSCU
RESIDENTIAL BPP & BC: 1994-2013 (FEB)www.strategicforum.co.za
0
500 000
1 000 000
1 500 000
2 000 000
2 500 000
3 000 000
3 500 000
4 000 000
4 500 000
5 000 000
5 500 000
1993
1994
1995
1996
1997
1998
1999
2000
2001
2002
2003
2004
2005
2006
2007
2008
2009
2010
2011
2012
2013
R*1000 (Current Values)
BPP & BC Total Residential: 1993-2013 by month: R*1000 (Current Values) (Feb)(Source: StatsSA; BMI-BRSCU: BC Total RSA by Month and Type of Building1993-2008: TOTAL RES BC&BPP R)
BC TOTAL RESIDENTIAL: R*1000 BPP TOTAL RESIDENTIAL: R*1000
12 per. Mov. Avg. (BC TOTAL RESIDENTIAL: R*1000) 12 per. Mov. Avg. (BPP TOTAL RESIDENTIAL: R*1000)
50 © BMI-BRSCU© BMI-BRSCU
-40%
-30%
-20%
-10%
0%
10%
20%
30%
40%
50%
60%
1994
1995
1996
1997
1998
1999
2000
2001
2002
2003
2004
2005
2006
2007
2008
2009
2010
2011
2012
2013
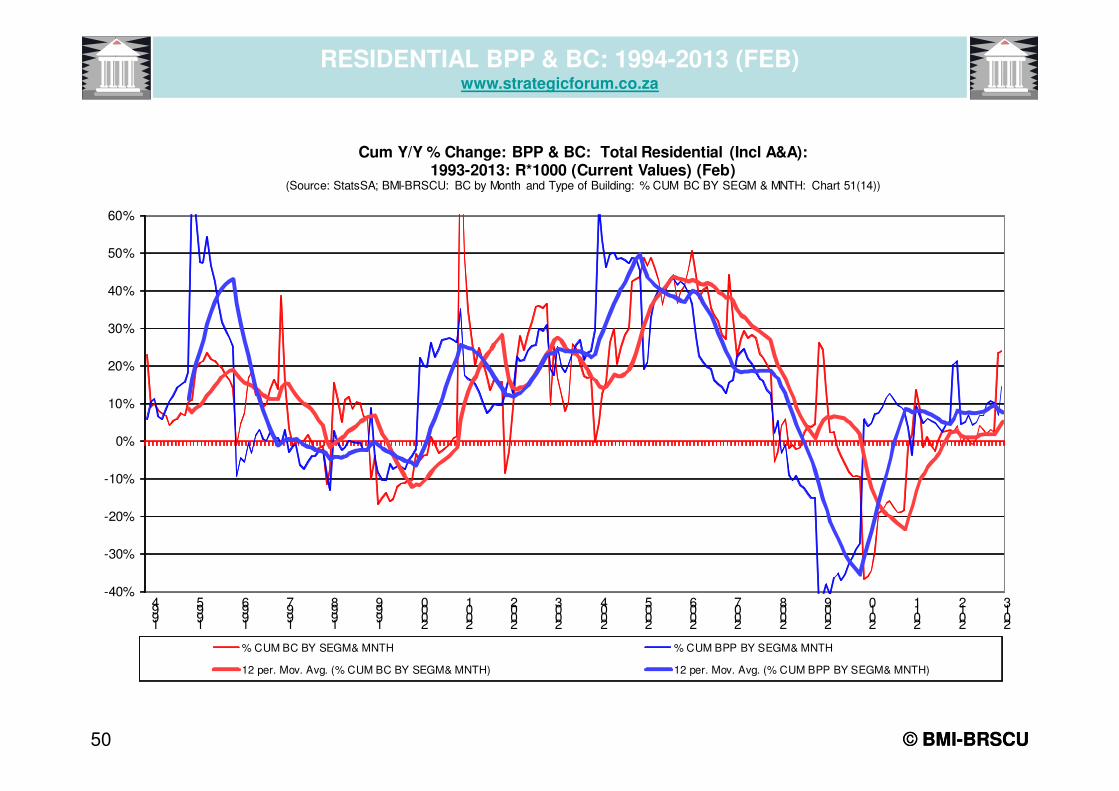
Cum Y/Y % Change: BPP & BC: Total Residential (Incl A&A): 1993-2013: R*1000 (Current Values) (Feb)
(Source: StatsSA; BMI-BRSCU: BC by Month and Type of Building: % CUM BC BY SEGM & MNTH: Chart 51(14))
% CUM BC BY SEGM& MNTH % CUM BPP BY SEGM& MNTH
12 per. Mov. Avg. (% CUM BC BY SEGM& MNTH) 12 per. Mov. Avg. (% CUM BPP BY SEGM& MNTH)
RESIDENTIAL BPP & BC: 1994-2013 (FEB)www.strategicforum.co.za
51
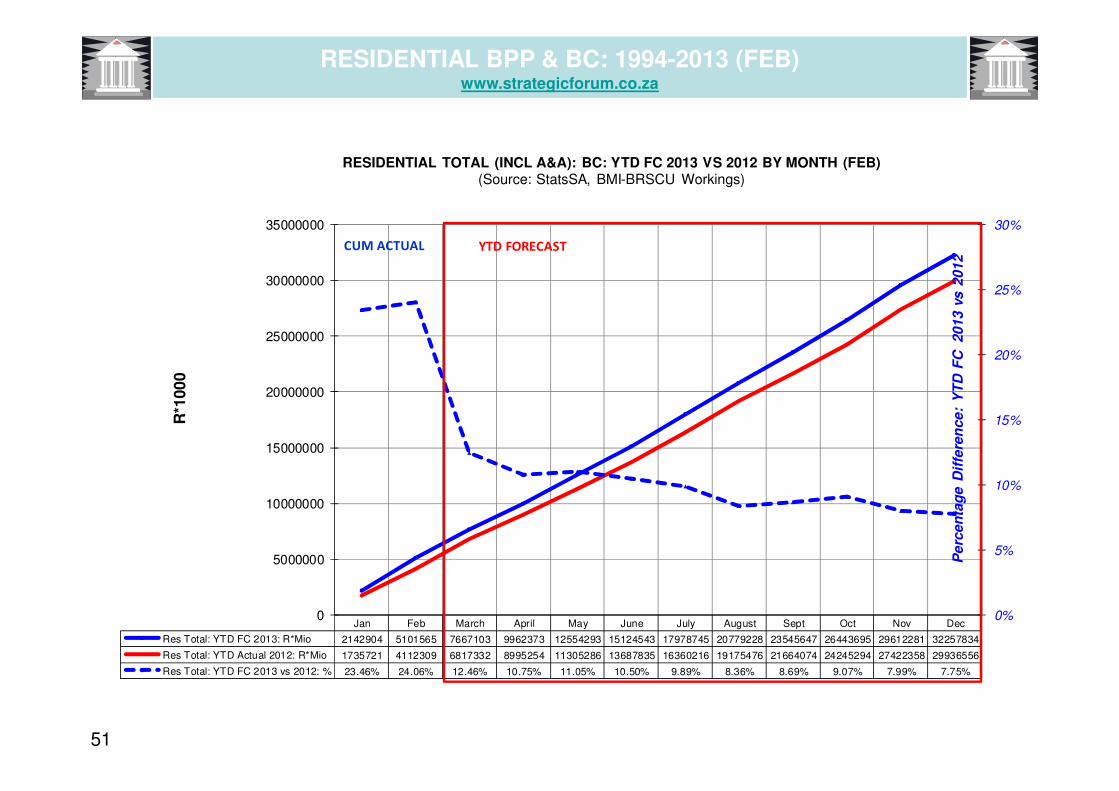
Jan Feb March April May June July August Sept Oct Nov Dec
Res Total: YTD FC 2013: R*Mio 2142904 5101565 7667103 9962373 12554293 15124543 17978745 20779228 23545647 26443695 29612281 32257834
Res Total: YTD Actual 2012: R*Mio 1735721 4112309 6817332 8995254 11305286 13687835 16360216 19175476 21664074 24245294 27422358 29936556
Res Total: YTD FC 2013 vs 2012: % 23.46% 24.06% 12.46% 10.75% 11.05% 10.50% 9.89% 8.36% 8.69% 9.07% 7.99% 7.75%
0%
5%
10%
15%
20%
25%
30%
0
5000000
10000000
15000000
20000000
25000000
30000000
35000000
Pe
rcen
tag
e D
iffe
ren
ce:
YT
D F
C 2013
vs
201
2
R*1
00
0RESIDENTIAL TOTAL (INCL A&A): BC: YTD FC 2013 VS 2012 BY MONTH (FEB)
(Source: StatsSA, BMI-BRSCU Workings)
YTD FORECASTCUM ACTUAL
RESIDENTIAL BPP & BC: 1994-2013 (FEB)www.strategicforum.co.za
52
-10%
-5%
0%
5%
10%
15%
20%
25%
30%
35%
40%
Dem
ocra
tic E
lect
ion
Tra
nsiti
on to
De
mocr
acy
Curr
ency
Co
llapse
World
Tra
de
Ce
ntr
e
BN
G H
ousin
g P
rog
ram
me
Sub
Pri
me C
risi
s
Socce
r W
orld C
up
0
2 000
4 000
6 000
8 000
10 000
12 000
14 000
16 000
18 000
19
93
/01
19
94
/01
19
95
/01
19
96
/01
19
97
/01
19
98
/01
19
99
/01
20
00
/01
20
01
/01
20
02
/01
20
03
/01
20
04
/01
20
05
/01
20
06
/01
20
07
/01
20
08
/01
20
09
/01
20
10
/'01
20
11
/'01
20
12
/'01
CU
M Y
TD
Q/Q
% C
HA
NG
E
Defining Events
R M
ILL
ION
S (
CU
RR
EN
T V
AL
UE
S)
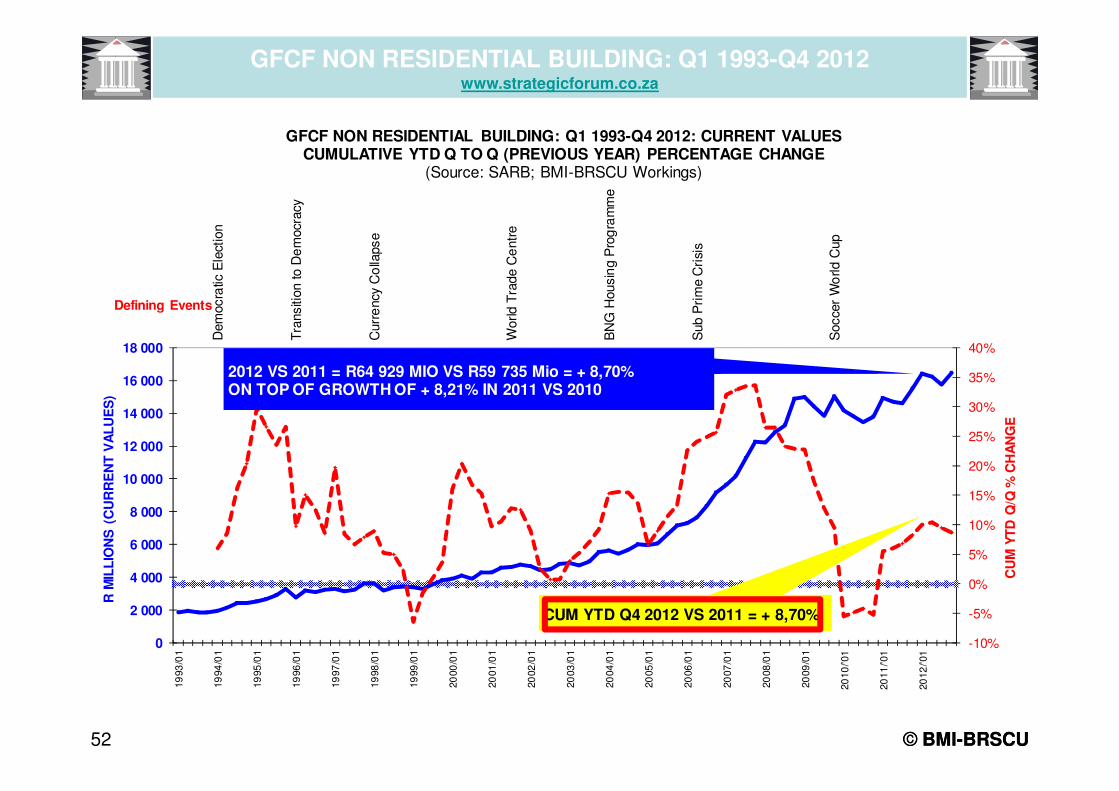
GFCF NON RESIDENTIAL BUILDING: Q1 1993-Q4 2012: CURRENT VALUESCUMULATIVE YTD Q TO Q (PREVIOUS YEAR) PERCENTAGE CHANGE
(Source: SARB; BMI-BRSCU Workings)
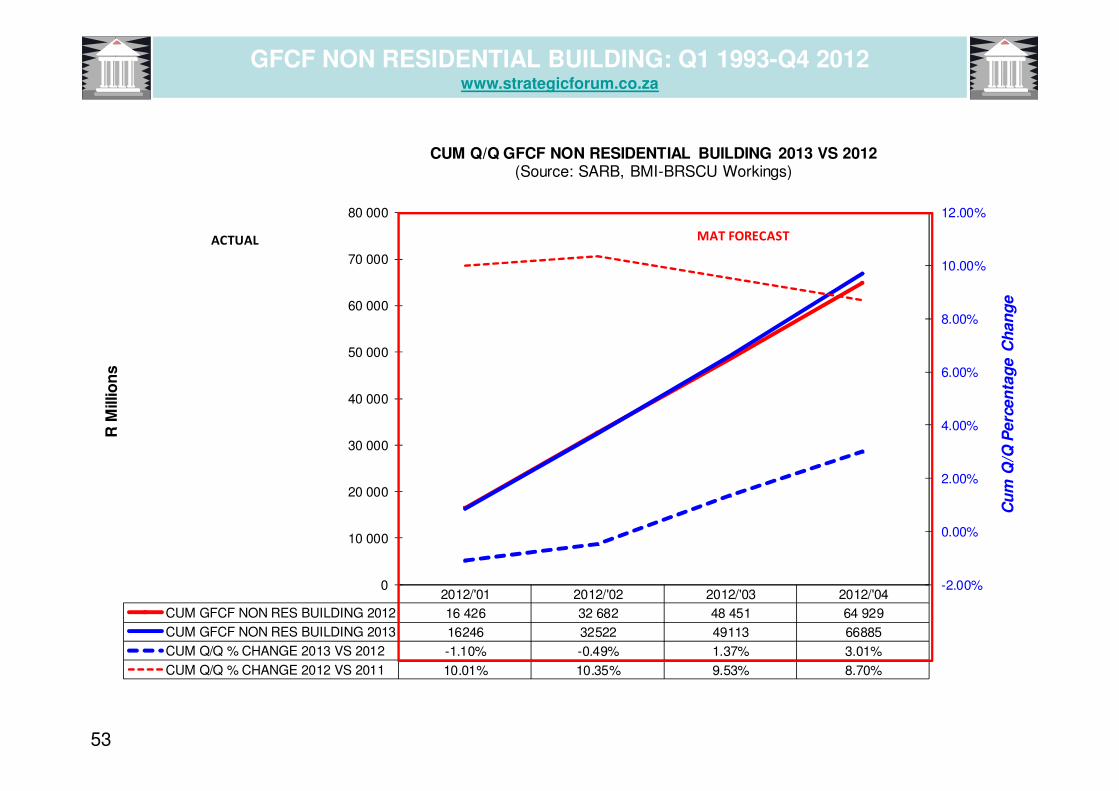
CUM YTD Q4 2012 VS 2011 = + 8,70%
2012 VS 2011 = R64 929 MIO VS R59 735 Mio = + 8,70%ON TOP OF GROWTH OF + 8,21% IN 2011 VS 2010
© BMI-BRSCU© BMI-BRSCU
GFCF NON RESIDENTIAL BUILDING: Q1 1993-Q4 2012www.strategicforum.co.za
53
2012/'01 2012/'02 2012/'03 2012/'04
CUM GFCF NON RES BUILDING 2012 16 426 32 682 48 451 64 929
CUM GFCF NON RES BUILDING 2013 16246 32522 49113 66885
CUM Q/Q % CHANGE 2013 VS 2012 -1.10% -0.49% 1.37% 3.01%
CUM Q/Q % CHANGE 2012 VS 2011 10.01% 10.35% 9.53% 8.70%
-2.00%
0.00%
2.00%
4.00%
6.00%
8.00%
10.00%
12.00%
0
10 000
20 000
30 000
40 000
50 000
60 000
70 000
80 000
Cu
m Q
/Q P
erc
en
tag
e C
han
ge
R M
illio
ns
CUM Q/Q GFCF NON RESIDENTIAL BUILDING 2013 VS 2012(Source: SARB, BMI-BRSCU Workings)
MAT FORECASTACTUAL
GFCF NON RESIDENTIAL BUILDING: Q1 1993-Q4 2012www.strategicforum.co.za

54 © BMI-BRSCU© BMI-BRSCU
NON RESIDENTIAL BPP & BC: 1994-2013 (FEB)www.strategicforum.co.za
0
500 000
1 000 000
1 500 000
2 000 000
2 500 000
1993
1994
1995
1996
1997
1998
1999
2000
2001
2002
2003
2004
2005
2006
2007
2008
2009
2010
2011
2012
2013
R*1000 (Current Values)
BPP & BC Total Non Residential: 1993-2013 by month: R*1000 (Current Values) (Feb)(Source: StatsSA; BMI-BRSCU: BC Total RSA by Month and Type of Building1993-2008: TOTAL NR BC&BPP R)
BC TOTAL NON RESIDENTIAL: R*1000 BPP TOTAL NON RESIDENTIAL: R*1000
12 per. Mov. Avg. (BC TOTAL NON RESIDENTIAL: R*1000) 12 per. Mov. Avg. (BPP TOTAL NON RESIDENTIAL: R*1000)

55 © BMI-BRSCU© BMI-BRSCU
-50%
-40%
-30%
-20%
-10%
0%
10%
20%
30%
40%
50%
60%
70%
80%
90%
1994
1995
1996
1997
1998
1999
2000
2001
2002
2003
2004
2005
2006
2007
2008
2009
2010
2011
2012
2013
Cum Y/Y % Change: BPP & BC: Total Non Residential (Incl A&A): 1993-2013: R*1000 (Current Values)(Feb)
(Source: StatsSA; BMI-BRSCU)
% CUM BC BY SEGM& MNTH % CUM BPP BY SEGM& MNTH
12 per. Mov. Avg. (% CUM BC BY SEGM& MNTH) 12 per. Mov. Avg. (% CUM BPP BY SEGM& MNTH)
NON RESIDENTIAL BPP & BC: 1994-2013 (FEB)www.strategicforum.co.za

56
Jan Feb March April May June July August Sept Oct Nov Dec
NR Total:YTD FC 2013: R*Mio 679926 2576781 3698681 4745999 5858404 6895140 8005261 9045416 10230923 11386344 12624949 13630148
NR Total: YTD Actual 2012: R*Mio 839485 2043989 3223310 5267683 6742569 7682250 8539546 9661691 11500685 12283201 14040375 15029402
NR Total: YTD FC 2013 vs 2012: % -19.01% 26.07% 14.75% -9.90% -13.11% -10.25% -6.26% -6.38% -11.04% -7.30% -10.08% -9.31%
-25%
-20%
-15%
-10%
-5%
0%
5%
10%
15%
20%
25%
30%
0
2000000
4000000
6000000
8000000
10000000
12000000
14000000
16000000
Pe
rce
nta
ge
Dif
fere
nce
: Y
TD
FC
201
3 v
s 2
01
2
R*1
000
NON RES TOTAL (INCL A&A): BC: YTD FC 2013 VERSUS 2012 BY MONTH (FEB) (Source: StatsSA, BMI-BRSCU Workings)
YTD FORECASTCUM ACTUAL
NON RESIDENTIAL BPP & BC: 1994-2013 (FEB)www.strategicforum.co.za

57
Dem
ocra
tic E
lect
ion
Tra
nsiti
on to
De
mocr
acy
Curr
ency
Co
llapse
World
Tra
de
Ce
ntr
e
BN
G H
ousin
g P
rog
ram
me
Sub
Pri
me C
risi
s (N
CA
)
Socce
r W
orld C
up
-10%
-5%
0%
5%
10%
15%
20%
25%
30%
35%
0
5 000
10 000
15 000
20 000
25 000
30 000
19
93
/01
19
94
/01
19
95
/01
19
96
/01
19
97
/01
19
98
/01
19
99
/01
20
00
/01
20
01
/01
20
02
/01
20
03
/01
20
04
/01
20
05
/01
20
06
/01
20
07
/01
20
08
/01
20
09
/01
20
10
/'01
20
11
/'01
20
12
/'01
Defining events
Cu
m Y
TD
Q/Q
Perc
en
tag
e C
han
ge
R M
illio
ns (
Cu
rren
t V
alu
e)
GFCF Total Building by Quarter: Q1 1993 - Q4 2012: Current ValuesCumulative YTD Q/Q (Previous Year) % Change
(Source: SARB; BMI-BRSCU Workings)
CUM YTD Q4 2012 VS 2011 = + 8,89%
2012 VS 2011 = R108 232 MIO VS R99 392 MIO = + 8,89%ON TOP OF DECLINE OF - 0,02% IN 2011 VS 2010
© BMI-BRSCU© BMI-BRSCU
GFCF TOTAL BUILDING: Q1 1993-Q4 2012www.strategicforum.co.za

58
CumGFCF Q1
CumGFCF Q2
CumGFCF Q3
CumGFCF Q4
CUM Q/Q GFCF TOTAL BUILDING 2012 26 469 53 573 80 674 108 232
CUM GFCF TOTAL BUILDING 2013 26 564 53 865 81 979 111 401
CUM Q/Q % CHANGE 2013 VS 2012 0.36% 0.54% 1.62% 2.93%
CUM Q/Q % CHANGE 2012 VS 2011 9.44% 9.80% 9.44% 8.89%
0.00%
2.00%
4.00%
6.00%
8.00%
10.00%
12.00%
0
20 000
40 000
60 000
80 000
100 000
120 000
Cu
m Q
/Q P
erc
en
tag
e C
ha
ng
e
R M
illio
ns
CUM Q/Q GFCF TOTAL BUILDING 2013 VS 2012 (FC)(Source: SARB, BMI-BRSCU Workings)
MAT FORECAST
ACTUAL
GFCF TOTAL BUILDING: Q1 1993-Q4 2012www.strategicforum.co.za

59 © BMI-BRSCU© BMI-BRSCU
TOTAL BPP & BC: 1994-2013 (FEB)www.strategicforum.co.za
0
1 000 000
2 000 000
3 000 000
4 000 000
5 000 000
6 000 000
7 000 000
8 000 000
9 000 000
10 000 000
1993
1994
1995
1996
1997
1998
1999
2000
2001
2002
2003
2004
2005
2006
2007
2008
2009
2010
2011
2012
2013
R*1000 (Current Values)
BPP & BC Total Building: 1993-2013 by month: R*1000 (Current Values) (Feb)(Source: StatsSA; BMI-BRSCU: BC Total RSA by Month and Type of Building1993-2008: TOTAL BLDNG BC&BPP R)
BC TOTAL BUILDING: R*1000 BPP TOTAL BUILDING: R*1000
12 per. Mov. Avg. (BC TOTAL BUILDING: R*1000) 12 per. Mov. Avg. (BPP TOTAL BUILDING: R*1000)

60 © BMI-BRSCU© BMI-BRSCU
-50%
-45%
-40%
-35%
-30%
-25%
-20%
-15%
-10%
-5%
0%
5%
10%
15%
20%
25%
30%
35%
40%
45%
50%
55%
60%
1994
1995
1996
1997
1998
1999
2000
2001
2002
2003
2004
2005
2006
2007
2008
2009
2010
2011
2012
2013
Cum Y/Y % Ch: BPP and BC: Total Building (Incl A&A): 1993-2013: R*1000 (Current Values) (Feb) (Source: StatsSA; BMI-BRSCU)
% CUM BC BY SEGM& MNTH % CUM BPP BY SEGM& MNTH
12 per. Mov. Avg. (% CUM BC BY SEGM& MNTH) 12 per. Mov. Avg. (% CUM BPP BY SEGM& MNTH)
TOTAL BPP & BC: 1994-2013 (FEB)www.strategicforum.co.za

61
Jan FebMarc
hApril May June July Aug Sept Oct Nov Dec
Res & NR Total: YTD FC 2013 2822830 7678346 11365784 14708371 18412697 22019683 25984006 29824644 33776569 37830038 42237230 45887983
Res & NR Total: YTD Actual 2012 2575206 6156298 10040642 14262937 18047855 21370085 24899762 28837167 33164759 36528495 41462733 44965958
Res & NR Total: % Difference YTD FC 2013 vs 2012 9.62% 24.72% 13.20% 3.12% 2.02% 3.04% 4.35% 3.42% 1.84% 3.56% 1.87% 2.05%
0%
5%
10%
15%
20%
25%
30%
0
5000000
10000000
15000000
20000000
25000000
30000000
35000000
40000000
45000000
50000000
R*1
000
RES & NON RES TOTAL (INCL A&A): BC: YTD FC 2013 VERSUS 2012 BY MONTH (FEB)(Source: StatsSA, BMI-BRSCU: Buildings Completed Total RSA; Chart BC57)
% D
iffe
ren
ce:
YT
D
Actu
al
2012 v
s Y
TD
Fo
recast
2013
CUM ACTUAL YTD FORECAST
TOTAL BPP & BC: 1994-2013 (FEB)www.strategicforum.co.za
62
THE INDUSTRY DASHBOARD: BPP & BC, CEMENT AND LUMBER SALES: 2010, 2011 & 2012
-40%
-30%
-20%
-10%
0%
10%
20%
Perc
en
tag
e
Jan-13 Feb-13 Mar-13 Apr-13 May-13 Jun-13 Jul-13 Aug-13 Sep-13 Oct-13 Nov-13 Dec-13
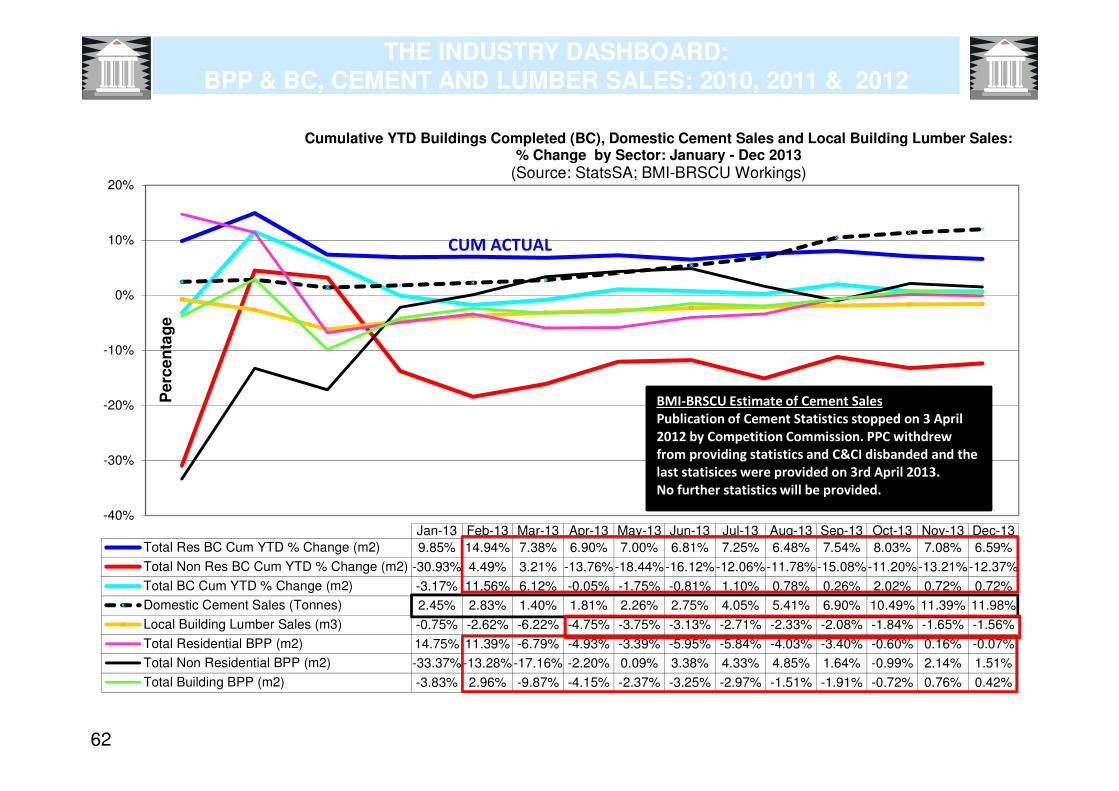
Total Res BC Cum YTD % Change (m2) 9.85% 14.94% 7.38% 6.90% 7.00% 6.81% 7.25% 6.48% 7.54% 8.03% 7.08% 6.59%
Total Non Res BC Cum YTD % Change (m2) -30.93% 4.49% 3.21% -13.76%-18.44%-16.12%-12.06%-11.78%-15.08%-11.20%-13.21%-12.37%
Total BC Cum YTD % Change (m2) -3.17% 11.56% 6.12% -0.05% -1.75% -0.81% 1.10% 0.78% 0.26% 2.02% 0.72% 0.72%
Domestic Cement Sales (Tonnes) 2.45% 2.83% 1.40% 1.81% 2.26% 2.75% 4.05% 5.41% 6.90% 10.49% 11.39% 11.98%
Local Building Lumber Sales (m3) -0.75% -2.62% -6.22% -4.75% -3.75% -3.13% -2.71% -2.33% -2.08% -1.84% -1.65% -1.56%
Total Residential BPP (m2) 14.75% 11.39% -6.79% -4.93% -3.39% -5.95% -5.84% -4.03% -3.40% -0.60% 0.16% -0.07%
Total Non Residential BPP (m2) -33.37%-13.28%-17.16% -2.20% 0.09% 3.38% 4.33% 4.85% 1.64% -0.99% 2.14% 1.51%
Total Building BPP (m2) -3.83% 2.96% -9.87% -4.15% -2.37% -3.25% -2.97% -1.51% -1.91% -0.72% 0.76% 0.42%
Cumulative YTD Buildings Completed (BC), Domestic Cement Sales and Local Building Lumber Sales: % Change by Sector: January - Dec 2013
(Source: StatsSA; BMI-BRSCU Workings)
CUM ACTUAL
BMI-BRSCU Estimate of Cement Sales
Publication of Cement Statistics stopped on 3 April
2012 by Competition Commission. PPC withdrew
from providing statistics and C&CI disbanded and the
last statisices were provided on 3rd April 2013.
No further statistics will be provided.
63
-1 000 000
0
1 000 000
2 000 000
3 000 000
4 000 000
5 000 000
6 000 000
1993
1994
1995
1996
1997
1998
1999
2000
2001
2002
2003
2004
2005
2006
2007
2008
2009
2010
2011
2012
2013
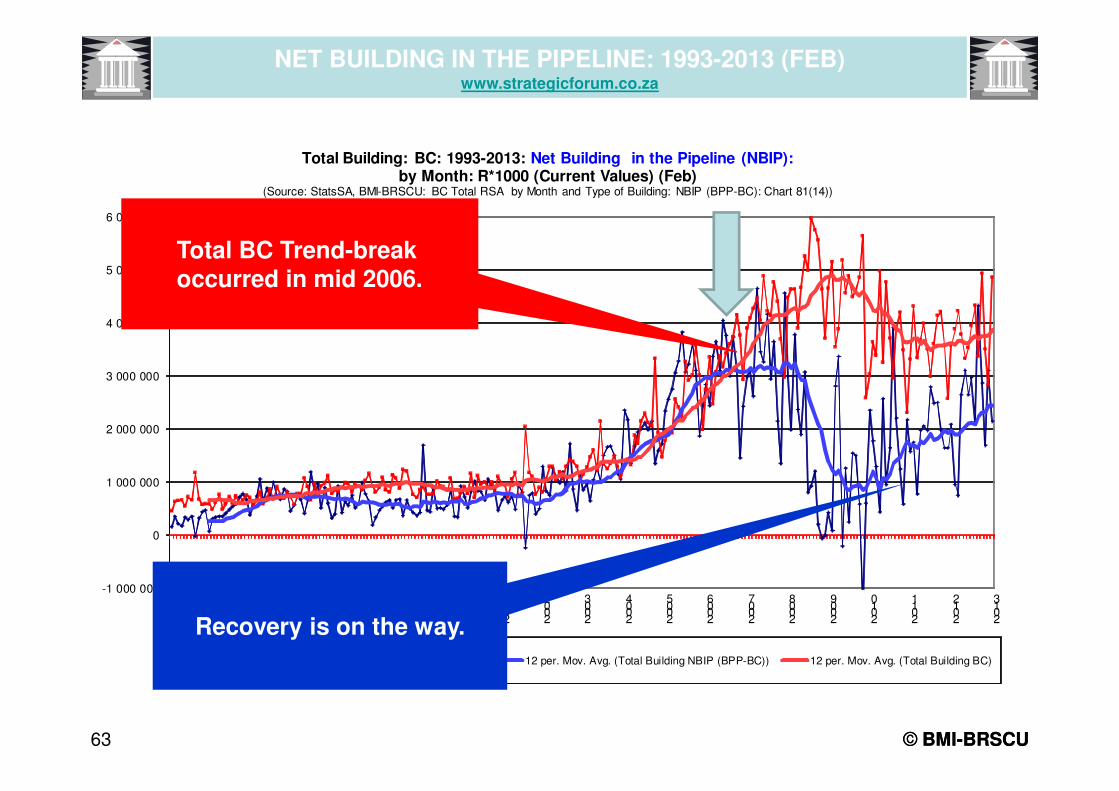
Total Building: BC: 1993-2013: Net Building in the Pipeline (NBIP): by Month: R*1000 (Current Values) (Feb)
(Source: StatsSA, BMI-BRSCU: BC Total RSA by Month and Type of Building: NBIP (BPP-BC): Chart 81(14))
Total Building NBIP (BPP-BC) Total Building BC 12 per. Mov. Avg. (Total Building NBIP (BPP-BC)) 12 per. Mov. Avg. (Total Building BC)
© BMI-BRSCU© BMI-BRSCU
NET BUILDING IN THE PIPELINE: 1993-2013 (FEB)www.strategicforum.co.za
Total BC Trend-break occurred in mid 2006.
Recovery is on the way.

64
NET BUILDING IN THE PIPELINE: 1993-2013 (FEB)www.strategicforum.co.za
0
200 000
400 000
600 000
800 000
1 000 000
1 200 000
1 400 000
1 600 000
1 800 000
2 000 000
1993
1994
1995
1996
1997
1998
1999
2000
2001
2002
2003
2004
2005
2006
2007
2008
2009
2010
2011
2012
2013
Total Residential: 1993-2013: BC, Net Building in the Pipeline (NBIP): by month: 1993-2012: m2 (Feb)
(Source: StatsSA, BMI-BRSCU: BC Total RSA by Month and Type of Building: NBIP (BPP-BC): Chart 77(14))
Total Residential NBIP
Total Residential BC
Total Residential BPP
12 per. Mov. Avg. (Total Residential NBIP)
12 per. Mov. Avg. (Total Residential BC)
12 per. Mov. Avg. (Total Residential BPP)
NBIP = 70.4%*BC
NBIP = 45.5%*BC
NBIP = 42,10%*BC

65 © BMI-BRSCU© BMI-BRSCU
NET BUILDING IN THE PIPELINE: 1993-2013 (FEB)www.strategicforum.co.za
0
50 000
100 000
150 000
200 000
250 000
300 000
350 000
400 000
450 000
500 000
550 000
600 000
650 000
700 000
750 000
800 000
850 000
1993
1994
1995
1996
1997
1998
1999
2000
2001
2002
2003
2004
2005
2006
2007
2008
2009
2010
2011
2012
Total Non Residential: 1993-2013: BC, Net Building in the Pipeline (NBIP): by Month: m2 (Feb)
(Source: StatsSA, BMI-BRSCU: BC Total RSA by Month and Type of Building: NBIP (BPP-BC): Chart 79(14))
NBIP Total Non Residential
BC Total Non Residential
BPP Total Non Residential
12 per. Mov. Avg. (NBIP Total Non Residential)
12 per. Mov. Avg. (BC Total Non Residential)
12 per. Mov. Avg. (BPP Total Non Residential)
NBIP = 76.4%*BC
NBIP = 42.8%*BC
NBIP = 45,13%*BC

66 © BMI-BRSCU© BMI-BRSCU
NET BUILDING IN THE PIPELINE: 1993-2013 (FEB)www.strategicforum.co.za
0
200 000
400 000
600 000
800 000
1 000 000
1 200 000
1 400 000
1 600 000
1 800 000
2 000 000
2 200 000
2 400 000
2 600 000
1993
1994
1995
1996
1997
1998
1999
2000
2001
2002
2003
2004
2005
2006
2007
2008
2009
2010
2011
2012
2013
Total Building: BC: 1993-2013: Net Building in the Pipeline (NBIP): by Month: m2 (Feb)
(Source: StatsSA, BMI-BRSCU: BC Total RSA by Month and Type of Building: NBIP (BPP-BC): Chart 80(14))
Total Building NBIP (BPP-BC)
Total Building BC
Total Building BPP
12 per. Mov. Avg. (Total Building NBIP (BPP-BC))
12 per. Mov. Avg. (Total Building BC)
12 per. Mov. Avg. (Total Building BPP)
NBIP = 71.8%*BC
NBIP = 44%*BC
NBIP = 42.5%*BC
67 © BMI-BRSCU© BMI-BRSCU
% DIFFERENCE IN CUM Y/Y BC : ACTUAL 2012 VS 2011: DECwww.strategicforum.co.za
2.5
5%
-0.4
7%
1.5
6%
1.0
2%
1.0
6% 8.9
2%
20
.00
%
10
.89
% 20
.74
%
-69
.60
%
-64
.65
%
7.8
4%
21
.15
%
33
.97
%
-14
.38
%
-15
.93
%
42
.02
%
48
.25
%
-18
.70
%
-16
.66
%
15
.61
%
-16
.75
%
-12
.72
%
-20
.80
%
-7.9
6%
-11
.23
%
4.5
7%
-80%
-60%
-40%
-20%
0%
20%
40%
60%
No
m2
R'0
00
No
m2
R'0
00
No
m2
R'0
00
m2
R'0
00
R'0
00
m2
R'0
00
m2
R'0
00
m2
R'0
00
m2
R'0
00
R'0
00
m2
R'0
00
m2
R'0
00
R'0
00
R'0
00
Dwellings <80m2
Dwellings >80m2
Flats and TH Other Total Office &Banking
Shopping Ind&WH Other Total A&ADwellings
A&A Other A&ATotalTotal
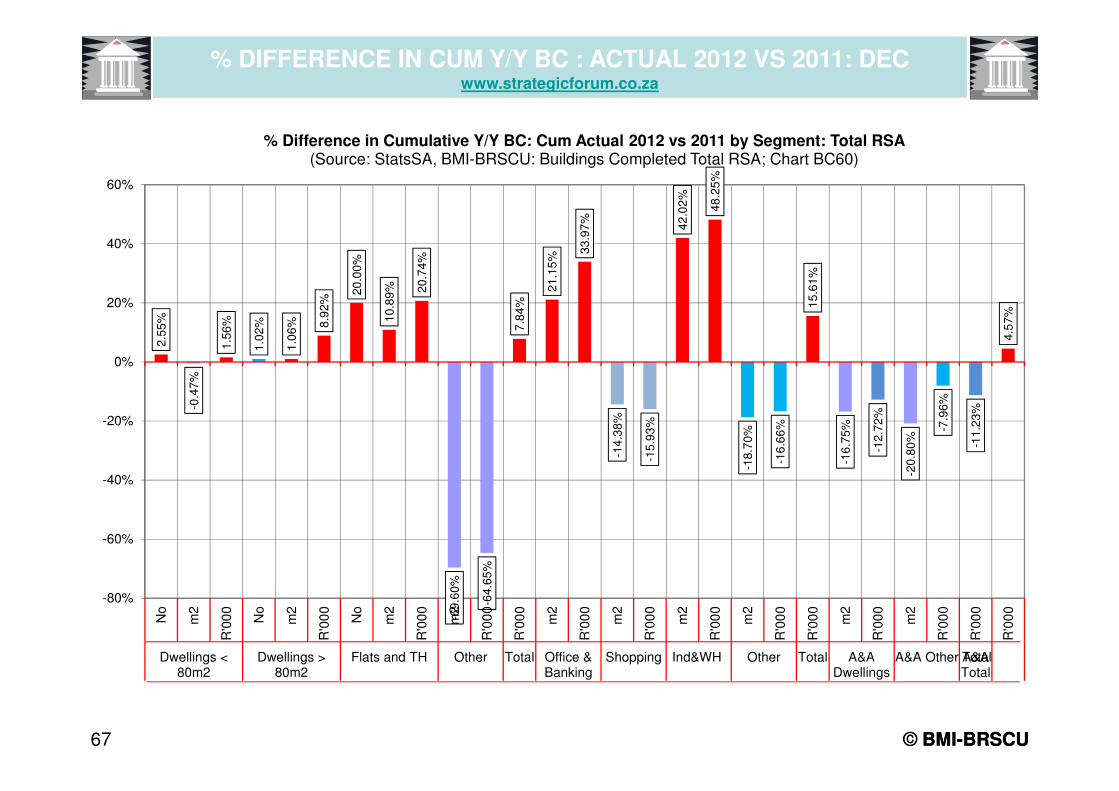
% Difference in Cumulative Y/Y BC: Cum Actual 2012 vs 2011 by Segment: Total RSA(Source: StatsSA, BMI-BRSCU: Buildings Completed Total RSA; Chart BC60)

68
0
903
2 805
1 105
45
1 467
10 026
1 627
45
3 493
21 516
463
499
1 128
201
549
2 853
1 140
5 438
12 272
5 688
754
40 231
0
5 000
10 000
15 000
20 000
25 000
30 000
35 000
40 000
45 000
PRIVATE RESIDENTIAL
Dwelling-houses < 80 m2
Dwelling-houses > 80 m2
Townhouses & Flats
Other (Incl. hotels & casinos)
Additions & alterations
PUBLIC RESIDENTIAL
Affordable Housing
Gene ral Government
Public corporations
Private Business Enterprises
TOTAL RESIDENTIAL
PRIVATE NON-RESIDENTIAL
Offices
Shops
Industrial & warehouse
Other
Additions & Alterations
PUBLIC NON-RESIDENTIAL
Gene ral Government
Public corporations
Private Business Enterprises
TOTAL NON RESIDENTIAL
Unrecorded Res Adds and Alts
Unrecorded Non Res Adds and Alts
GRAND TOTAL
INVESTMENT IN BUILDING BY SECTOR AND BY SEGMENT: 2012: M2*1000(TOTAL = 40 067 M2*1000)
(Source: SARB, StatsSA, MFA, BMI-BRSCU Workings)
© BMI-BRSCU© BMI-BRSCU
CURRENT REALITY OF INVESTMENT IN BUILDINGBY SECTOR AND SEGMENT: 2012

69 © BMI-BRSCU© BMI-BRSCU
THE ROLE OF AFFORDABLE HOUSING IN BUILDING: 2013-2020www.strategicforum.co.za
203588
193615
217348
252834
271219
220204
248850
226216
185225
214979
218381
214518
202930
198978
201962
206002
211152
217486
224011
203 5
88
193 6
15
217 3
48
252 8
34
271 2
19
220 2
04
248 8
50
226 2
16
185 2
25
214 9
79
218 3
81
251 1
38
288 8
09
332 1
30 381 9
50
410 5
96
441 3
91
474 4
95
498 2
20
0
500 000
1 000 000
1 500 000
2 000 000
2 500 000
3 000 000
3 500 000
0
100 000
200 000
300 000
400 000
500 000
600 000
2002 2003 2004 2005 2006 2007 2008 2009 2010 2011 2012 2013 2014 2015 2016 2017 2018 2019 2020
AN
NU
AL
HO
US
ING
BA
KL
OG
(U
NIT
S)
AN
NU
AL
HO
US
ING
DE
LIV
ER
Y (
UN
ITS
)
AFFORDABLE HOUSING DELIVERY AND BACKLOG: 2002-2012LOWER MIDDLE ROAD SOYUZ AND HIGH ROAD COLUMBUS SCENARIO: 2013-2020
(Source: StatsSA and BMI-BRSCU Workings)

70 © BMI-BRSCU© BMI-BRSCU
THE ROLE OF AFFORDABLE HOUSING IN BUILDING: 2013-2020www.strategicforum.co.za
203588
193615
217348
252834
271219
220204
248850
226216
185225
214979
218381
214518
202930
198978
201962
206002
211152
217486
224011
203 5
88
193 6
15
217 3
48
252 8
34
271 2
19
220 2
04
248 8
50
226 2
16
185 2
25
214 9
79
218 3
81
251 1
38
288 8
09
332 1
30 381 9
50
410 5
96
441 3
91
474 4
95
498 2
20
0
500 000
1 000 000
1 500 000
2 000 000
2 500 000
3 000 000
3 500 000
0
100 000
200 000
300 000
400 000
500 000
600 000
2002 2003 2004 2005 2006 2007 2008 2009 2010 2011 2012 2013 2014 2015 2016 2017 2018 2019 2020
AN
NU
AL
HO
US
ING
BA
KL
OG
(U
NIT
S)
AN
NU
AL
HO
US
ING
DE
LIV
ER
Y (
UN
ITS
)
AFFORDABLE HOUSING DELIVERY AND BACKLOG: 2002-2012LOWER MIDDLE ROAD SOYUZ AND HIGH ROAD COLUMBUS SCENARIO: 2013-2020
(Source: StatsSA and BMI-BRSCU Workings)
If 3,08 Million houses are built in next 8 years
Backlog reduced to I,32 million by 2020.
The target must be the eradication of all
slums, or informal settlements, by 2025. For
this to happen, some 500 000 new units a year must become available.

71
28 8
14
32 5
32
33 9
17
37 7
73
47 0
42
60 0
20
72 9
69
86 0
85
100 7
72
101 3
07
95 8
66
99 3
92
108 2
32
111 4
01
115 1
23
118 3
79
119 7
04
126 3
08
133 8
87
139 8
47
135 6
99
0
50 000
100 000
150 000
200 000
250 000
300 000
2000 2001 2002 2003 2004 2005 2006 2007 2008 2009 2010 2011 2012 2013 2014 2015 2016 2017 2018 2019 2020
R M
ILL
ION
S (
CU
RR
EN
T A
ND
CO
NS
TA
NT
20
12
VA
LU
ES
)TOTAL INVESTMENT IN BUILDING: 2000-2012 (CURRENT VALUES)
THE STRATEGIC FORUM SCENARIOS: 2013-2020 (CONSTANT 2012 VALUE)(Source: SARB, StatsSA, MFA, BMI-BRSCU Workings)
TOTAL BUILDINGS : 2000-2007: LOWER MIDDLE ROAD SOYUZ SCENARIO: 2008-2015
TOTAL BUILDINGS HIGH ROAD COLUMBUS SCENARIO
TOTAL BUILDINGS LOW ROAD CHALLENGER SCENARIO
TOTAL BUILDINGS HIGHER MIDDLE ROAD APOLLO SCENARIO
CURRENT MOST LIKELY SCENARIOBETWEEN LOWER MIDDLE AND LOW
ROAD SCENARIOSHigh Road 10%
Upper Middle Road 20%
Lower Middle Road 40%
Low Road 30%
© BMI-BRSCU© BMI-BRSCU
www.strategicforum.co.za

72
28
814
32 5
32
33 9
17
37
773
47
042
60 0
20
72 9
69
86
085
10
0 7
72
10
1 3
07
95
866
99 3
92
10
8 2
32
11
1 4
01
115
123
118 3
79
11
9 7
04
126
308
133 8
87
13
9 8
47
135
699
0
50 000
100 000
150 000
200 000
250 000
300 000
2000 2001 2002 2003 2004 2005 2006 2007 2008 2009 2010 2011 2012 2013 2014 2015 2016 2017 2018 2019 2020
R M
ILL
ION
S (
CU
RR
EN
T A
ND
CO
NS
TA
NT
20
12
VA
LU
ES
)TOTAL INVESTMENT IN BUILDING: 2000-2012 (CURRENT VALUES)
THE STRATEGIC FORUM SCENARIOS: 2013-2020 (CONSTANT 2012 VALUE)(Source: SARB, StatsSA, MFA, BMI-BRSCU Workings)
TOTAL BUILDINGS : 2000-2007: LOWER MIDDLE ROAD SOYUZ SCENARIO: 2008-2015
TOTAL BUILDINGS HIGH ROAD COLUMBUS SCENARIO
TOTAL BUILDINGS LOW ROAD CHALLENGER SCENARIO
TOTAL BUILDINGS HIGHER MIDDLE ROAD APOLLO SCENARIO
CURRENT MOST LIKELY SCENARIOBETWEEN LOWER MIDDLE AND LOW
ROAD SCENARIOS
High Road 10%
Upper Middle Road 20%
Lower Middle Road 40%
Low Road 30%
© BMI-BRSCU© BMI-BRSCU
www.strategicforum.co.za
The difference between “high road” and “lower middle road” could be R560 Billion and 940 000 jobs over the 8 years to 2020.

73
-10%
0%
10%
20%
30%
40%
50%
60%
70%
80%
Dem
ocra
tic E
lect
ion
Tra
nsiti
on to
De
mocr
acy
Curr
ency
Co
llapse
World
Tra
de
Ce
ntr
e
BN
G H
ousin
g P
rog
ram
me
Sub
Pri
me C
risi
s
Socce
r W
orld C
up
0
10 000
20 000
30 000
40 000
50 000
60 000
19
93
/01
19
94
/01
19
95
/01
19
96
/01
19
97
/01
19
98
/01
19
99
/01
20
00
/01
20
01
/01
20
02
/01
20
03
/01
20
04
/01
20
05
/01
20
06
/01
20
07
/01
20
08
/01
20
09
/01
20
10
/'01
20
11
/'01
20
12
/'01
CU
M Y
TD
Q/Q
% C
HA
NG
E
Defining Events
R M
ILL
ION
S (
CU
RR
EN
T V
AL
UE
S)
GFCF CONSTRUCTION: Q1 1993-Q4 2012: CURRENT VALUESCUMULATIVE YTD Q TO Q (PREVIOUS YEAR) PERCENTAGE CHANGE
(Source: SARB; BMI-BRSCU Workings)
CUM YTD Q3 2012 VS 2011 = + 9,40%
2012 VS 2011 = R185 772 MIO VS R169 816 Mio = + 9,40%ON TOP OF GROWTH OF + 7,32% IN 2011 VS 2010
© BMI-BRSCU© BMI-BRSCU
GFCF CONSTRUCTION: Q1 1993-Q4 2012www.strategicforum.co.za

74
2012/'01 2012/'02 2012/'03 2012/'04
CUM GFCF CONSTRUCTION 2012 45 393 90 913 137 498 185 772
CUM GFCF CONSTRUCTION 2013 45 409 91 104 138 903 190 416
CUM Q/Q % CHANGE GFCF CONSTR 2013VS 2012
0.04% 0.21% 1.02% 2.50%
CUM Q/Q % CHANGE GFCF CONSTR 2012VS 2011
9.51% 10.19% 9.86% 9.40%
0.00%
2.00%
4.00%
6.00%
8.00%
10.00%
12.00%
0
20 000
40 000
60 000
80 000
100 000
120 000
140 000
160 000
180 000
200 000
Cu
m Q
/Q P
erc
en
tag
e C
han
ge
R M
illio
ns
CUM Q/Q GFCF CONSTRUCTION: 2013 VS 2012 (FC) (Source: SARB, BMI-BRSCU Workings)
MAT FORECASTACTUAL
© BMI-BRSCU© BMI-BRSCU
GFCF CONSTRUCTION: Q1 1993-Q4 2012www.strategicforum.co.za

75 © BMI-BRSCU© BMI-BRSCU
SCENARIOS FOR CONSTRUCTION: 2013-2020www.strategicforum.co.za
19 0
29
23 0
22
30 6
63
35 1
15
40 7
39
53 1
24 80 8
79
127 3
02 161 5
95
158 2
36
169 8
16
185 7
72
190 4
16
199 9
37
213 9
33
216 0
72
226 8
76
238 2
19
245 3
66
250 2
73
0
50 000
100 000
150 000
200 000
250 000
300 000
350 00020
01
20
02
20
03
20
04
20
05
20
06
20
07
20
08
20
09
20
10
20
11
20
12
20
13
20
14
20
15
20
16
20
17
20
18
20
19
20
20
R M
ILL
ION
S (
CU
RR
EN
T A
ND
2012 V
AL
UE
S)
INVESTMENT IN CONSTRUCTION: 2001-2012THE STRATEGIC FORUM SCENARIOS: 2013-2020
(Source: SARB, StatsSA, MFA, BMI-BRSCU Workings)
MOTORWAY SCENARIO: 2007-2015 HIGHWAY SCENARIO: 2007-2015
FREEWAY SCENARIO: 2001-2015 BYWAY SCENARIO: 2001-2015
2 per. Mov. Avg. (FREEWAY SCENARIO: 2001-2015)
The currentMOST LIKELY FUTURE
is theFREEWAY SCENARIO
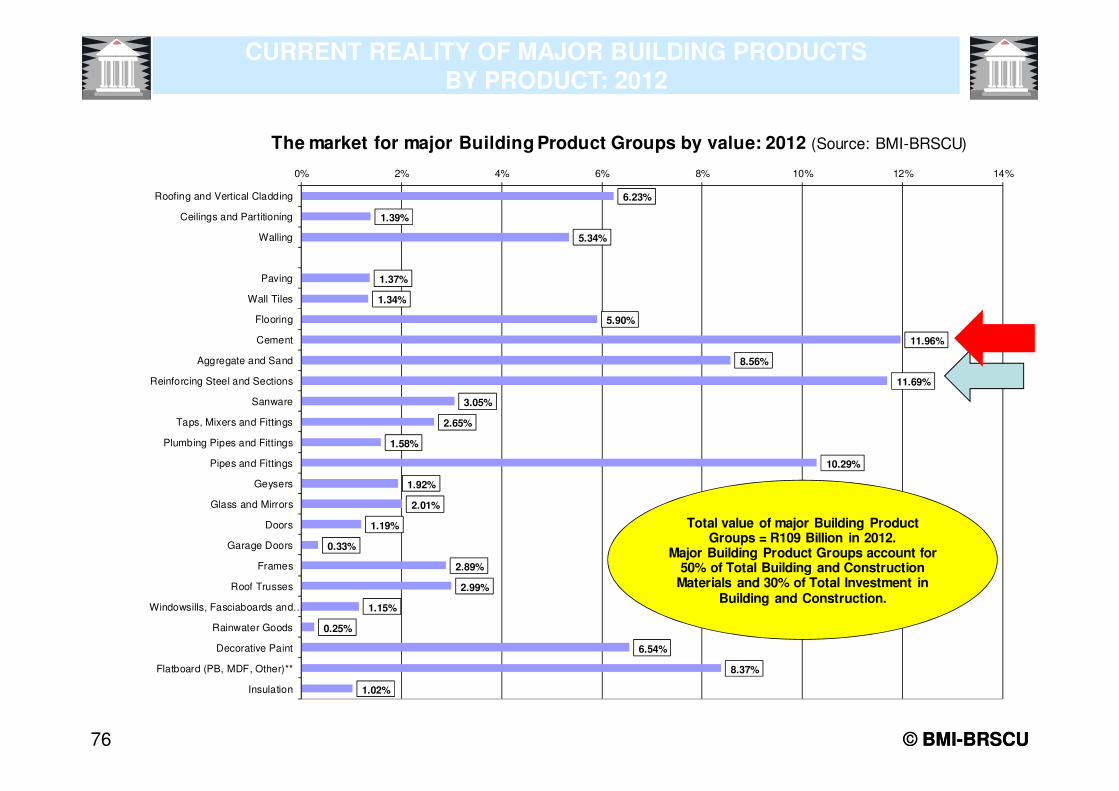
76
6.23%
1.39%
5.34%
1.37%
1.34%
5.90%
11.96%
8.56%
11.69%
3.05%
2.65%
1.58%
10.29%
1.92%
2.01%
1.19%
0.33%
2.89%
2.99%
1.15%
0.25%
6.54%
8.37%
1.02%
0% 2% 4% 6% 8% 10% 12% 14%
Roofing and Vertical Cladding
Ceilings and Partitioning
Walling
Paving
Wall Tiles
Flooring
Cement
Aggregate and Sand
Reinforcing Steel and Sections
Sanware
Taps, Mixers and Fittings
Plumbing Pipes and Fittings
Pipes and Fittings
Geysers
Glass and Mirrors
Doors
Garage Doors
Frames
Roof Trusses
Windowsills, Fasciaboards and…
Rainwater Goods
Decorative Paint
Flatboard (PB, MDF, Other)**
Insulation
The market for major Building Product Groups by value: 2012 (Source: BMI-BRSCU)
Total value of major Building Product Groups = R109 Billion in 2012.
Major Building Product Groups account for 50% of Total Building and Construction
Materials and 30% of Total Investment in Building and Construction.
© BMI-BRSCU© BMI-BRSCU
CURRENT REALITY OF MAJOR BUILDING PRODUCTS BY PRODUCT: 2012
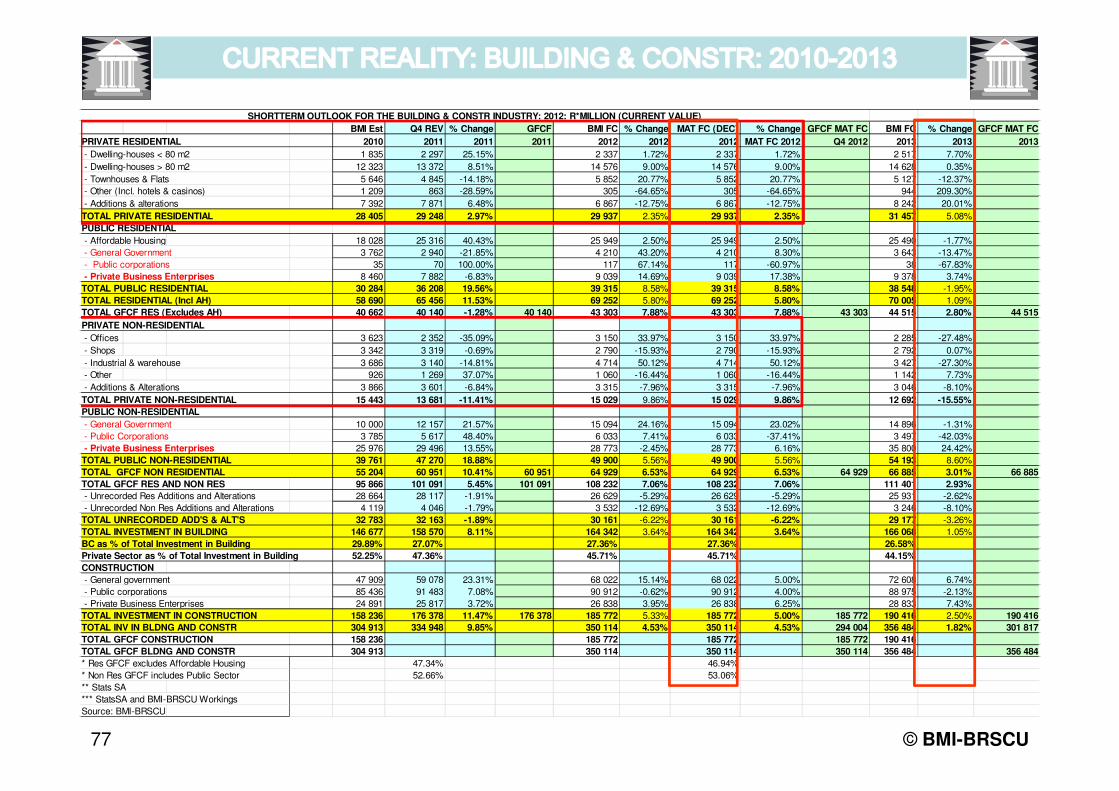
77 © BMI-BRSCU
BMI Est Q4 REV % Change GFCF BMI FC % Change MAT FC (DEC) % Change GFCF MAT FC BMI FC % Change GFCF MAT FC
PRIVATE RESIDENTIAL 2010 2011 2011 2011 2012 2012 2012 MAT FC 2012 Q4 2012 2013 2013 2013
- Dwelling-houses < 80 m2 1 835 2 297 25.15% 2 337 1.72% 2 337 1.72% 2 517 7.70%
- Dwelling-houses > 80 m2 12 323 13 372 8.51% 14 576 9.00% 14 576 9.00% 14 628 0.35%
- Townhouses & Flats 5 646 4 845 -14.18% 5 852 20.77% 5 852 20.77% 5 127 -12.37%
- Other (Incl. hotels & casinos) 1 209 863 -28.59% 305 -64.65% 305 -64.65% 944 209.30%
- Additions & alterations 7 392 7 871 6.48% 6 867 -12.75% 6 867 -12.75% 8 242 20.01%
TOTAL PRIVATE RESIDENTIAL 28 405 29 248 2.97% 29 937 2.35% 29 937 2.35% 31 457 5.08%
PUBLIC RESIDENTIAL
- Affordable Housing 18 028 25 316 40.43% 25 949 2.50% 25 949 2.50% 25 490 -1.77%
- General Government 3 762 2 940 -21.85% 4 210 43.20% 4 210 8.30% 3 643 -13.47%
- Public corporations 35 70 100.00% 117 67.14% 117 -60.97% 38 -67.83%
- Private Business Enterprises 8 460 7 882 -6.83% 9 039 14.69% 9 039 17.38% 9 378 3.74%
TOTAL PUBLIC RESIDENTIAL 30 284 36 208 19.56% 39 315 8.58% 39 315 8.58% 38 548 -1.95%
TOTAL RESIDENTIAL (Incl AH) 58 690 65 456 11.53% 69 252 5.80% 69 252 5.80% 70 005 1.09%
TOTAL GFCF RES (Excludes AH) 40 662 40 140 -1.28% 40 140 43 303 7.88% 43 303 7.88% 43 303 44 515 2.80% 44 515
PRIVATE NON-RESIDENTIAL
- Offices 3 623 2 352 -35.09% 3 150 33.97% 3 150 33.97% 2 285 -27.48%
- Shops 3 342 3 319 -0.69% 2 790 -15.93% 2 790 -15.93% 2 792 0.07%
- Industrial & warehouse 3 686 3 140 -14.81% 4 714 50.12% 4 714 50.12% 3 427 -27.30%
- Other 926 1 269 37.07% 1 060 -16.44% 1 060 -16.44% 1 142 7.73%
- Additions & Alterations 3 866 3 601 -6.84% 3 315 -7.96% 3 315 -7.96% 3 046 -8.10%
TOTAL PRIVATE NON-RESIDENTIAL 15 443 13 681 -11.41% 15 029 9.86% 15 029 9.86% 12 692 -15.55%
PUBLIC NON-RESIDENTIAL
- General Government 10 000 12 157 21.57% 15 094 24.16% 15 094 23.02% 14 896 -1.31%
- Public Corporations 3 785 5 617 48.40% 6 033 7.41% 6 033 -37.41% 3 497 -42.03%
- Private Business Enterprises 25 976 29 496 13.55% 28 773 -2.45% 28 773 6.16% 35 800 24.42%
TOTAL PUBLIC NON-RESIDENTIAL 39 761 47 270 18.88% 49 900 5.56% 49 900 5.56% 54 193 8.60%
TOTAL GFCF NON RESIDENTIAL 55 204 60 951 10.41% 60 951 64 929 6.53% 64 929 6.53% 64 929 66 885 3.01% 66 885
TOTAL GFCF RES AND NON RES 95 866 101 091 5.45% 101 091 108 232 7.06% 108 232 7.06% 111 401 2.93%
- Unrecorded Res Additions and Alterations 28 664 28 117 -1.91% 26 629 -5.29% 26 629 -5.29% 25 931 -2.62%
- Unrecorded Non Res Additions and Alterations 4 119 4 046 -1.79% 3 532 -12.69% 3 532 -12.69% 3 246 -8.10%
TOTAL UNRECORDED ADD'S & ALT'S 32 783 32 163 -1.89% 30 161 -6.22% 30 161 -6.22% 29 177 -3.26%
TOTAL INVESTMENT IN BUILDING 146 677 158 570 8.11% 164 342 3.64% 164 342 3.64% 166 068 1.05%
BC as % of Total Investment in Building 29.89% 27.07% 27.36% 27.36% 26.58%
Private Sector as % of Total Investment in Building 52.25% 47.36% 45.71% 45.71% 44.15%
CONSTRUCTION
47 909 59 078 23.31% 68 022 15.14% 68 022 5.00% 72 608 6.74%
85 436 91 483 7.08% 90 912 -0.62% 90 912 4.00% 88 975 -2.13%
24 891 25 817 3.72% 26 838 3.95% 26 838 6.25% 28 833 7.43%
TOTAL INVESTMENT IN CONSTRUCTION 158 236 176 378 11.47% 176 378 185 772 5.33% 185 772 5.00% 185 772 190 416 2.50% 190 416
TOTAL INV IN BLDNG AND CONSTR 304 913 334 948 9.85% 350 114 4.53% 350 114 4.53% 294 004 356 484 1.82% 301 817
TOTAL GFCF CONSTRUCTION 158 236 185 772 185 772 185 772 190 416
TOTAL GFCF BLDNG AND CONSTR 304 913 350 114 350 114 350 114 356 484 356 484
* Res GFCF excludes Affordable Housing 47.34% 46.94%
* Non Res GFCF includes Public Sector 52.66% 53.06%
** Stats SA
*** StatsSA and BMI-BRSCU Workings
Source: BMI-BRSCU
SHORTTERM OUTLOOK FOR THE BUILDING & CONSTR INDUSTRY: 2012: R*MILLION (CURRENT VALUE)
- General government
- Public corporations
- Private Business Enterprises

78 © BMI-BRSCU
ANIMAL SPIRITS AND CONFIDENCEwww.strategicforum.co.za
George A. Akerlof is the Daniel E. Koshland Sr. Distinguished Professor of Economics at the University of
California, Berkeley. He was awarded the 2001 Nobel Prize in Economics.
Robert Shiller is the best-selling Author of Irrational Exuberance and The Subprime Solution (both Princeton). He is the Arthur M. Okun
Professor of Economics at Yale University.
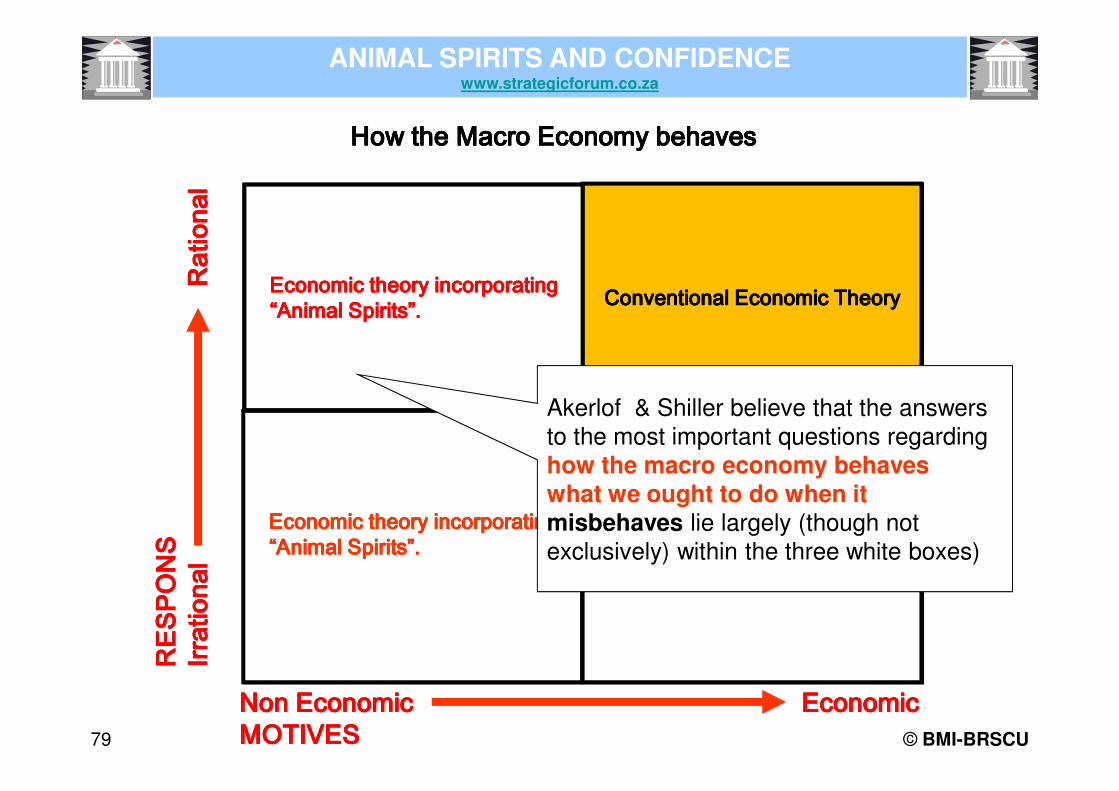
79 © BMI-BRSCU
RESP
ONS
RE
SPO
NS
RESP
ONS
RE
SPO
NS
Irrat
iona
l Irr
atio
nal
Irrat
iona
l Irr
atio
nal
Ratio
nal
Ratio
nal
Ratio
nal
Ratio
nal
Non EconomicNon EconomicNon EconomicNon Economic EconomicEconomicEconomicEconomicMOTIVESMOTIVESMOTIVESMOTIVES
Conventional Economic TheoryConventional Economic TheoryConventional Economic TheoryConventional Economic TheoryEconomic theory incorporating Economic theory incorporating Economic theory incorporating Economic theory incorporating “Animal Spirits”. “Animal Spirits”. “Animal Spirits”. “Animal Spirits”.
Economic theory incorporating Economic theory incorporating Economic theory incorporating Economic theory incorporating “Animal Spirits”. “Animal Spirits”. “Animal Spirits”. “Animal Spirits”.
Economic theory incorporating Economic theory incorporating Economic theory incorporating Economic theory incorporating “Animal Spirits”. “Animal Spirits”. “Animal Spirits”. “Animal Spirits”.
How the Macro Economy behavesHow the Macro Economy behavesHow the Macro Economy behavesHow the Macro Economy behaves
ANIMAL SPIRITS AND CONFIDENCEwww.strategicforum.co.za
Akerlof & Shiller believe that the answers to the most important questions regarding how the macro economy behaves and
what we ought to do when it misbehaves lie largely (though not exclusively) within the three white boxes)
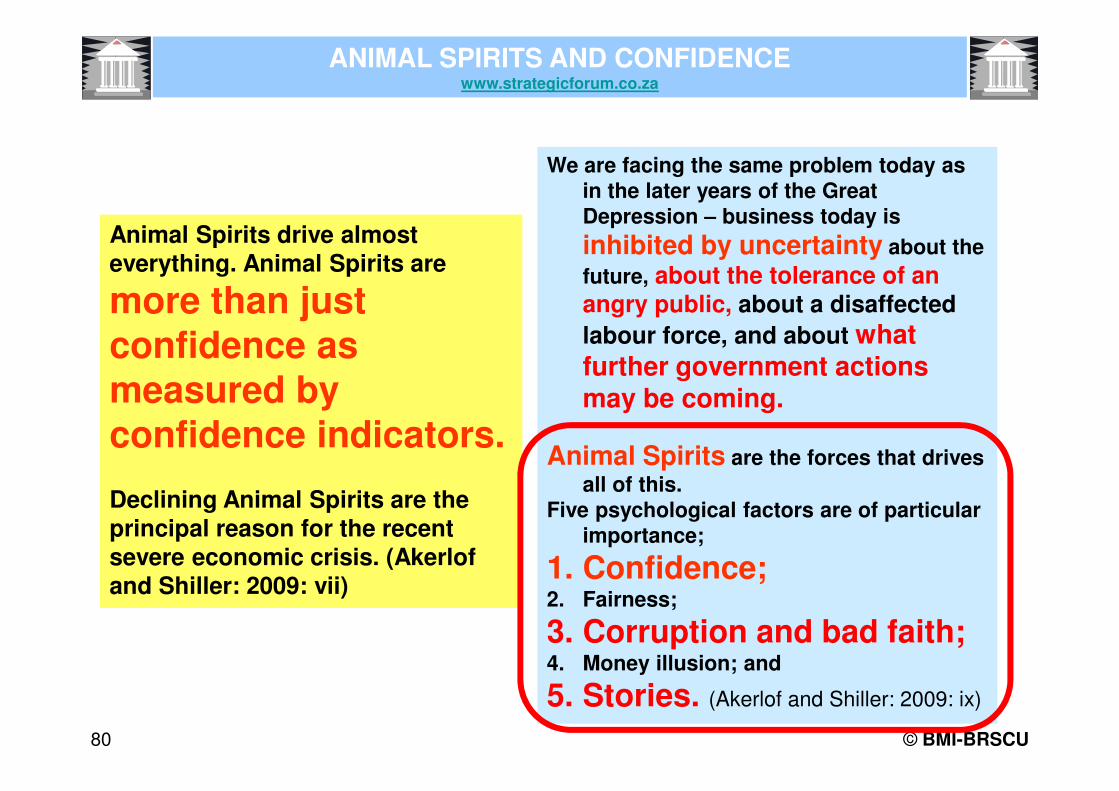
80 © BMI-BRSCU
Animal Spirits drive almost everything. Animal Spirits are
more than just confidence as measured by confidence indicators.
Declining Animal Spirits are the principal reason for the recent severe economic crisis. (Akerlofand Shiller: 2009: vii)
ANIMAL SPIRITS AND CONFIDENCEwww.strategicforum.co.za
We are facing the same problem today as in the later years of the Great Depression – business today is
inhibited by uncertainty about the
future, about the tolerance of an angry public, about a disaffected
labour force, and about what further government actions may be coming.
Animal Spirits are the forces that drives
all of this.Five psychological factors are of particular
importance;
1. Confidence;2. Fairness;
3. Corruption and bad faith;4. Money illusion; and
5. Stories. (Akerlof and Shiller: 2009: ix)
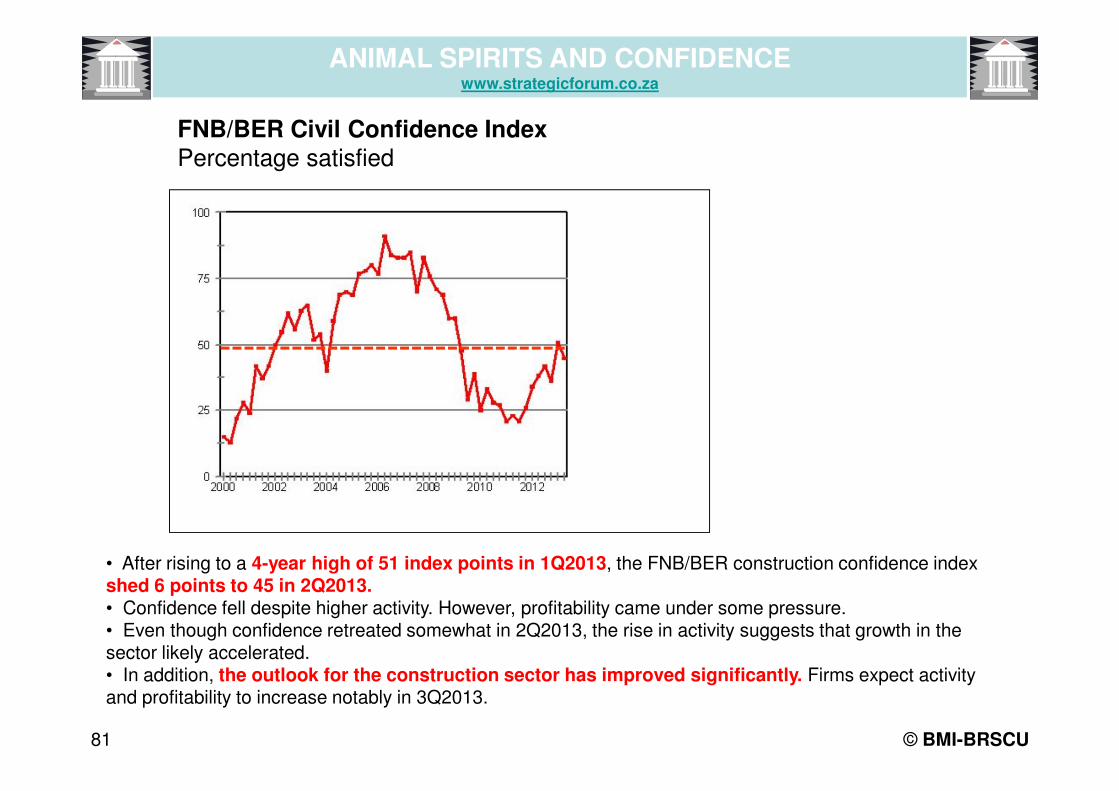
81 © BMI-BRSCU
ANIMAL SPIRITS AND CONFIDENCEwww.strategicforum.co.za
FNB/BER Civil Confidence Index Percentage satisfied
• After rising to a 4-year high of 51 index points in 1Q2013, the FNB/BER construction confidence index shed 6 points to 45 in 2Q2013.• Confidence fell despite higher activity. However, profitability came under some pressure.• Even though confidence retreated somewhat in 2Q2013, the rise in activity suggests that growth in the sector likely accelerated.• In addition, the outlook for the construction sector has improved significantly. Firms expect activity and profitability to increase notably in 3Q2013.

82 © BMI-BRSCU
ANIMAL SPIRITS AND CONFIDENCEwww.strategicforum.co.za
Civil constructionGrowth in construction activity
• Private sector construction work remained sluggish amid persistent unrest in the mining sector.• However, the public sector continued to add to construction work in 2Q2013. Construction activity by SANRAL and Transnet as well as a resumption of work at Medupi power station likely boosted work by public corporations. • General government capex on construction was possibly supported by municipal spending which has, in the past, picked up in the second quarter. This is as a result of municipalities rushing to spend allocated funds before the end of their financial year in June.
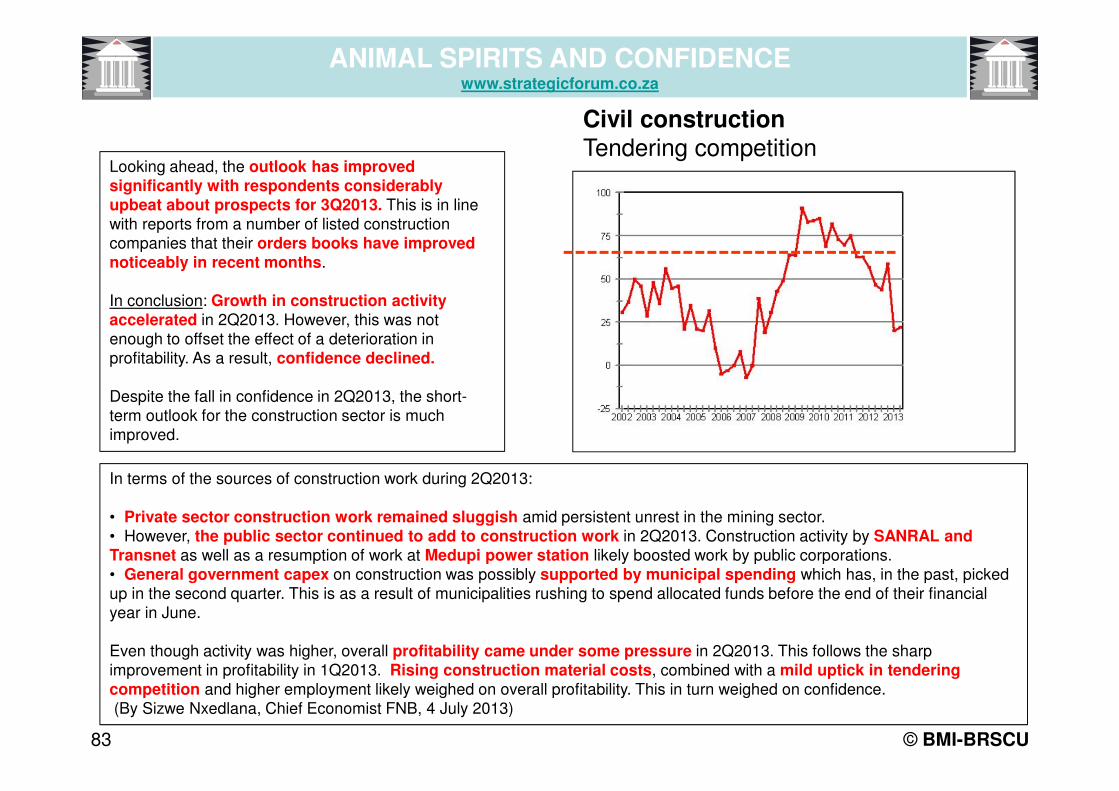
83 © BMI-BRSCU
ANIMAL SPIRITS AND CONFIDENCEwww.strategicforum.co.za
In terms of the sources of construction work during 2Q2013:
• Private sector construction work remained sluggish amid persistent unrest in the mining sector.• However, the public sector continued to add to construction work in 2Q2013. Construction activity by SANRAL and Transnet as well as a resumption of work at Medupi power station likely boosted work by public corporations. • General government capex on construction was possibly supported by municipal spending which has, in the past, picked up in the second quarter. This is as a result of municipalities rushing to spend allocated funds before the end of their financial year in June.
Even though activity was higher, overall profitability came under some pressure in 2Q2013. This follows the sharp improvement in profitability in 1Q2013. Rising construction material costs, combined with a mild uptick in tendering competition and higher employment likely weighed on overall profitability. This in turn weighed on confidence.
(By Sizwe Nxedlana, Chief Economist FNB, 4 July 2013)
Civil constructionTendering competition
Looking ahead, the outlook has improved significantly with respondents considerably upbeat about prospects for 3Q2013. This is in line with reports from a number of listed construction companies that their orders books have improved noticeably in recent months.
In conclusion: Growth in construction activity accelerated in 2Q2013. However, this was not enough to offset the effect of a deterioration in profitability. As a result, confidence declined.
Despite the fall in confidence in 2Q2013, the short-term outlook for the construction sector is much improved.
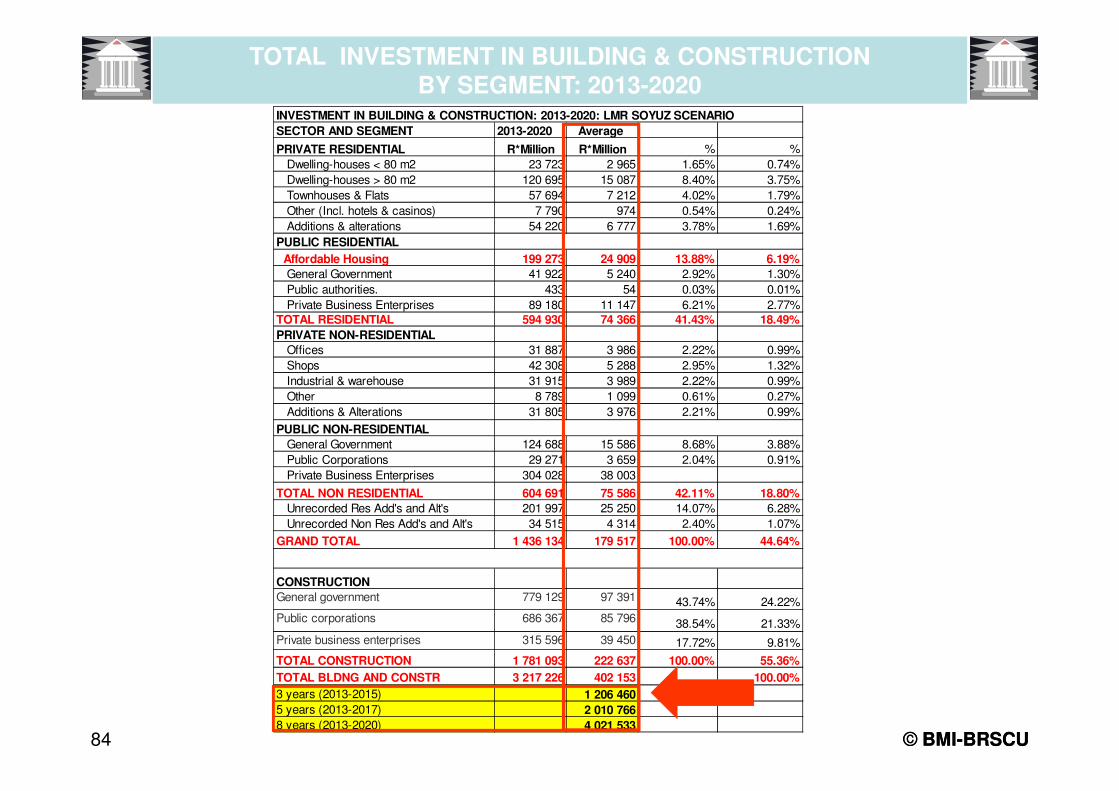
84
2013-2020 Average
R*Million R*Million % %
23 723 2 965 1.65% 0.74%
120 695 15 087 8.40% 3.75%
57 694 7 212 4.02% 1.79%
7 790 974 0.54% 0.24%
54 220 6 777 3.78% 1.69%
199 273 24 909 13.88% 6.19%
41 922 5 240 2.92% 1.30%
433 54 0.03% 0.01%
89 180 11 147 6.21% 2.77%
594 930 74 366 41.43% 18.49%
31 887 3 986 2.22% 0.99%
42 308 5 288 2.95% 1.32%
31 915 3 989 2.22% 0.99%
8 789 1 099 0.61% 0.27%
31 805 3 976 2.21% 0.99%
124 688 15 586 8.68% 3.88%
29 271 3 659 2.04% 0.91%
304 028 38 003
604 691 75 586 42.11% 18.80%
201 997 25 250 14.07% 6.28%
34 515 4 314 2.40% 1.07%
1 436 134 179 517 100.00% 44.64%
779 129 97 391 43.74% 24.22%
686 367 85 796 38.54% 21.33%
315 596 39 450 17.72% 9.81%
1 781 093 222 637 100.00% 55.36%
3 217 226 402 153 100.00%
1 206 460
2 010 766
4 021 533
Additions & alterations
PUBLIC RESIDENTIAL
Unrecorded Res Add's and Alt's
Unrecorded Non Res Add's and Alt's
GRAND TOTAL
CONSTRUCTION
General Government
Public Corporations
Private Business Enterprises
TOTAL NON RESIDENTIAL
Shops
Industrial & warehouse
Other
Additions & Alterations
PUBLIC NON-RESIDENTIAL
Public authorities.
Private Business Enterprises
TOTAL RESIDENTIAL
PRIVATE NON-RESIDENTIAL
Offices
General government
Public corporations
Private business enterprises
TOTAL CONSTRUCTION
TOTAL BLDNG AND CONSTR
3 years (2013-2015)
5 years (2013-2017)
8 years (2013-2020)
INVESTMENT IN BUILDING & CONSTRUCTION: 2013-2020: LMR SOYUZ SCENARIO
SECTOR AND SEGMENT
Affordable Housing
General Government
PRIVATE RESIDENTIAL
Dwelling-houses < 80 m2
Dwelling-houses > 80 m2
Townhouses & Flats
Other (Incl. hotels & casinos)
© BMI-BRSCU© BMI-BRSCU
TOTAL INVESTMENT IN BUILDING & CONSTRUCTION BY SEGMENT: 2013-2020
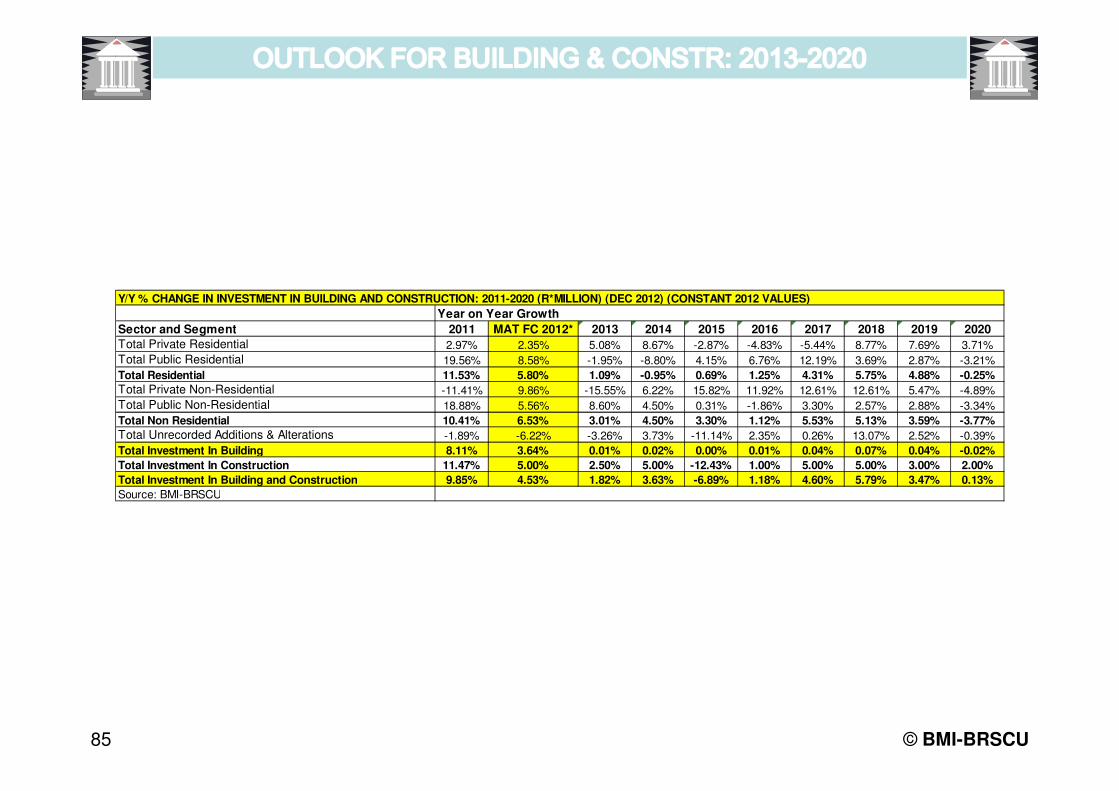
85 © BMI-BRSCU
2011 MAT FC 2012* 2013 2014 2015 2016 2017 2018 2019 2020
2.97% 2.35% 5.08% 8.67% -2.87% -4.83% -5.44% 8.77% 7.69% 3.71%
19.56% 8.58% -1.95% -8.80% 4.15% 6.76% 12.19% 3.69% 2.87% -3.21%
11.53% 5.80% 1.09% -0.95% 0.69% 1.25% 4.31% 5.75% 4.88% -0.25%
-11.41% 9.86% -15.55% 6.22% 15.82% 11.92% 12.61% 12.61% 5.47% -4.89%
18.88% 5.56% 8.60% 4.50% 0.31% -1.86% 3.30% 2.57% 2.88% -3.34%
10.41% 6.53% 3.01% 4.50% 3.30% 1.12% 5.53% 5.13% 3.59% -3.77%
-1.89% -6.22% -3.26% 3.73% -11.14% 2.35% 0.26% 13.07% 2.52% -0.39%
8.11% 3.64% 0.01% 0.02% 0.00% 0.01% 0.04% 0.07% 0.04% -0.02%
11.47% 5.00% 2.50% 5.00% -12.43% 1.00% 5.00% 5.00% 3.00% 2.00%
9.85% 4.53% 1.82% 3.63% -6.89% 1.18% 4.60% 5.79% 3.47% 0.13%
Total Public Residential
Total Residential
Total Private Non-Residential
Total Public Non-Residential
Total Non Residential
Y/Y % CHANGE IN INVESTMENT IN BUILDING AND CONSTRUCTION: 2011-2020 (R*MILLION) (DEC 2012) (CONSTANT 2012 VALUES)
Year on Year Growth
Sector and Segment
Total Private Residential
Total Unrecorded Additions & Alterations
Total Investment In Building
Total Investment In Construction
Total Investment In Building and Construction
Source: BMI-BRSCU

86
THE VUCA ENVIRONMENT: STRATEGIC RESPONSEwww.strategicforum.co.za
The VUCA world is essentially about the transition to a new set of values, which tells us that:
• Consumers no longer define themselves by the size of their car, house or new kitchen.
• Instead, their focus is in five key areas:
� Value for money – they are highly price sensitive
� Simplicity – they are looking for less complex lifestyles� People, not things – family and friends are increasingly important� Values – they value trust, and they are concerned about their carbon foot
� Convenience – they want products to last, and to be available locally

87
THE VUCA ENVIRONMENT: STRATEGIC RESPONSEwww.strategicforum.co.za

88 © BMI-BRSCU
No society is likely to renew itself unless its dominant orientation is to the future.This is not to say that a society can ignore its past. A people without historians would be as crippled as an individual with amnesia; they would not know who they were. In helping a society to achieve self knowledge, the historian serves the cause of renewal. However, in the renewing society, the historian consults the past in the service of the present and the future.The society capable of continuous renewal not only is oriented towards the future but looks ahead with some confidence. This is not to say that blind optimism prevails; it is simply to say that hopelessness does not make for renewal. (Gardner: 105 – 106)
THE VUCA ENVIRONMENT: STRATEGIC RESPONSEwww.strategicforum.co.za

89 © BMI-BRSCU© BMI-BRSCU
TowardsBuilding, the Engine for growth and wealth creation
Dr. Llewellyn B. LewisApril 2013
THE STRATEGIC FORUMA place of assembly
for strategic conversations
THE STRATEGIC FORUMwww.strategicforum.co.za
BMI
Studium Ad Prosperandum
Voluntas in Conveniendum
BUILDING RESEARCHSTRATEGY CONSULTINGUNIT cc
Reg. No. 2002/105109/23
•
BMI
Studium Ad Prosperandum
Voluntas in Conveniendum
BUILDING RESEARCH
STRATEGY CONSULTING
UNIT cc
•
BMI•
BMI•
BMI•
BMI
Studium Ad Prosperandum
Voluntas in Conveniendum
BUILDING RESEARCHSTRATEGY CONSULTINGUNIT cc
Reg. No. 2002/105109/23
•
BMI
Studium Ad Prosperandum
Voluntas in Conveniendum
BUILDING RESEARCH
STRATEGY CONSULTING
UNIT cc
•
BMI•
BMI•
BMI•
BMI•
BMI•
BMI•
Top Related