


Languages
Pages
Legal

An IMF staff team led by Alexei Kireyev and Ali Mansoor
Making Senegal a Hub for West Africa
African Department
I N T E R N A T I O N A L M O N E T A R Y F U N D
An IMF staff team led by Alexei Kireyev and Ali Mansoor
Making Senegal a Hub for West Africa
African Department
I N T E R N A T I O N A L M O N E T A R Y F U N D
Copyright © 2015
International Monetary Fund
Cataloging-in-Publication Data
Making Senegal a Hub for West Africa / prepared by an IMF staff team led by Alexei Kireyev and Ali Mansoor … [et al.]. – Washington, D.C. : International Monetary Fund, 2015.
pages ; cm – (African Departmental Paper)
“Approved by the African Department.” Includes bibliographical references. ISBN: 978-1-49834-124-0
1. Senegal – Economic conditions. 2. Senegal – Politics and government – 2000- 3. Africa, West– Economic conditions. I. Basdevant, Olivier. II. International Monetary Fund. III. InternationalMonetary Fund. African Department. IV. Title: Making Senegal a hub for West Africa. V. African departmental paper.
HC1045.S53 2015 ISBN: (paper) 9781498341240 ISBN: (ePub) 9781498389525 ISBN: (Mobipocket) 9781498329637 ISBN: (Web PDF) 9781498327817
Publication orders may be placed online, by fax, or through the mail: International Monetary Fund, Publication Services
P.O. Box 92780, Washington, DC 20090, U.S.A. Tel. (202) 623-7430 Fax: (202) 623-7201
E-mail: [email protected] www.imfbookstore.org www.elibrary.imf.org
INTERNATIONAL MONETARY FUND iii
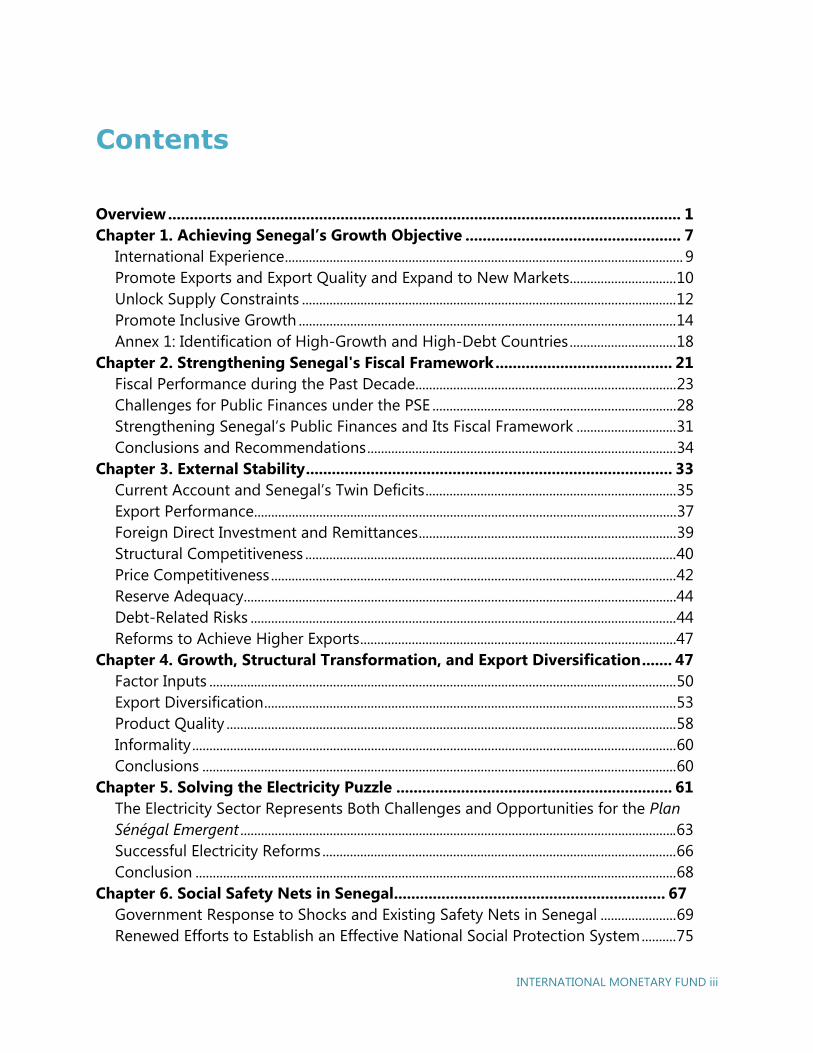
Contents
Overview ....................................................................................................................... 1 Chapter 1. Achieving Senegal’s Growth Objective .................................................. 7
International Experience .................................................................................................................... 9 Promote Exports and Export Quality and Expand to New Markets ............................... 10 Unlock Supply Constraints ............................................................................................................. 12 Promote Inclusive Growth .............................................................................................................. 14 Annex 1: Identification of High-Growth and High-Debt Countries ............................... 18
Chapter 2. Strengthening Senegal's Fiscal Framework ......................................... 21 Fiscal Performance during the Past Decade ............................................................................ 23 Challenges for Public Finances under the PSE ....................................................................... 28 Strengthening Senegal’s Public Finances and Its Fiscal Framework ............................. 31 Conclusions and Recommendations .......................................................................................... 34
Chapter 3. External Stability ..................................................................................... 33 Current Account and Senegal’s Twin Deficits ......................................................................... 35 Export Performance ........................................................................................................................... 37 Foreign Direct Investment and Remittances ........................................................................... 39 Structural Competitiveness ............................................................................................................ 40 Price Competitiveness ...................................................................................................................... 42 Reserve Adequacy .............................................................................................................................. 44 Debt-Related Risks ............................................................................................................................ 44 Reforms to Achieve Higher Exports ............................................................................................ 47
Chapter 4. Growth, Structural Transformation, and Export Diversification ....... 47 Factor Inputs ........................................................................................................................................ 50 Export Diversification ........................................................................................................................ 53 Product Quality ................................................................................................................................... 58 Informality ............................................................................................................................................. 60 Conclusions .......................................................................................................................................... 60
Chapter 5. Solving the Electricity Puzzle ................................................................ 61 The Electricity Sector Represents Both Challenges and Opportunities for the Plan Sénégal Emergent ............................................................................................................................... 63 Successful Electricity Reforms ....................................................................................................... 66 Conclusion ............................................................................................................................................ 68
Chapter 6. Social Safety Nets in Senegal ............................................................... 67 Government Response to Shocks and Existing Safety Nets in Senegal ...................... 69 Renewed Efforts to Establish an Effective National Social Protection System .......... 75
Recommendations to Further Consolidate the National Social Protection System76 Chapter 7. Performance Under the 2011–14 Policy Support Instrument ........... 77
Macroeconomic Performance ....................................................................................................... 80 Program Performance ...................................................................................................................... 86 Technical Assistance ......................................................................................................................... 89 Conclusions .......................................................................................................................................... 91
References .................................................................................................................. 91
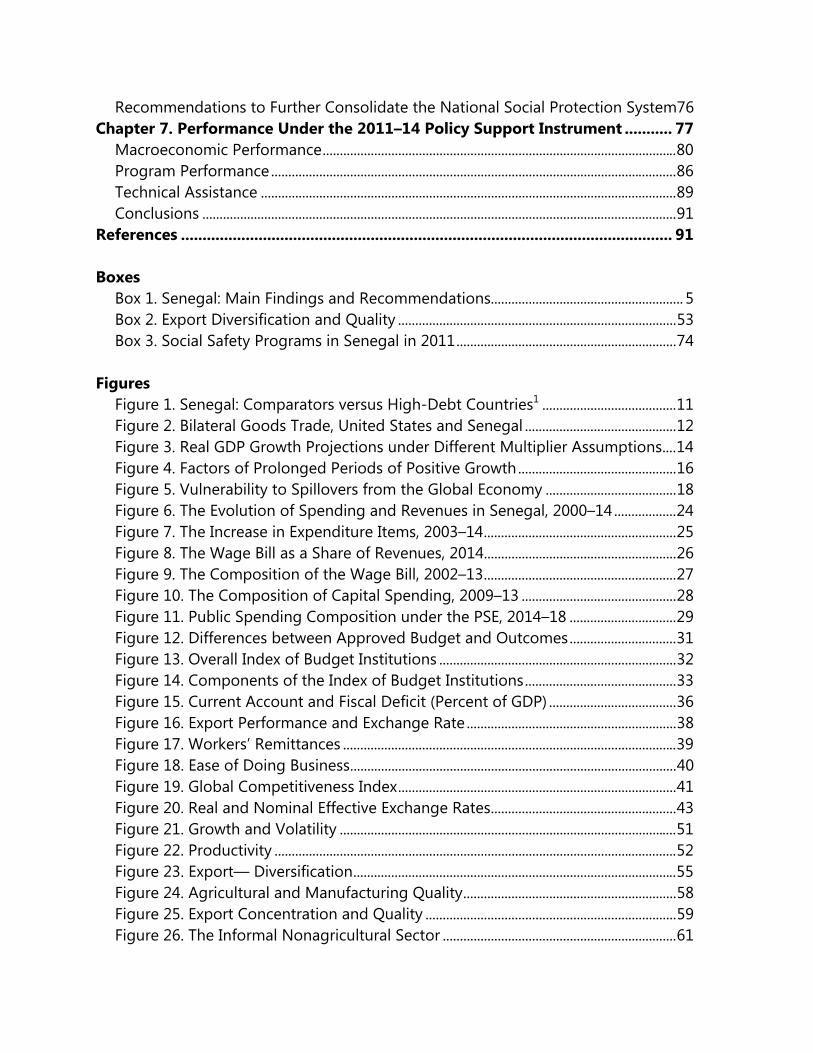
Boxes Box 1. Senegal: Main Findings and Recommendations ........................................................ 5 Box 2. Export Diversification and Quality ................................................................................. 53 Box 3. Social Safety Programs in Senegal in 2011 ................................................................ 74
Figures Figure 1. Senegal: Comparators versus High-Debt Countries1 ....................................... 11 Figure 2. Bilateral Goods Trade, United States and Senegal ............................................ 12 Figure 3. Real GDP Growth Projections under Different Multiplier Assumptions .... 14 Figure 4. Factors of Prolonged Periods of Positive Growth .............................................. 16 Figure 5. Vulnerability to Spillovers from the Global Economy ...................................... 18 Figure 6. The Evolution of Spending and Revenues in Senegal, 2000–14 .................. 24 Figure 7. The Increase in Expenditure Items, 2003–14 ........................................................ 25 Figure 8. The Wage Bill as a Share of Revenues, 2014 ........................................................ 26 Figure 9. The Composition of the Wage Bill, 2002–13 ........................................................ 27 Figure 10. The Composition of Capital Spending, 2009–13 ............................................. 28 Figure 11. Public Spending Composition under the PSE, 2014–18 ............................... 29 Figure 12. Differences between Approved Budget and Outcomes ............................... 31 Figure 13. Overall Index of Budget Institutions ..................................................................... 32 Figure 14. Components of the Index of Budget Institutions ............................................ 33 Figure 15. Current Account and Fiscal Deficit (Percent of GDP) ..................................... 36 Figure 16. Export Performance and Exchange Rate ............................................................. 38 Figure 17. Workers’ Remittances ................................................................................................. 39 Figure 18. Ease of Doing Business ............................................................................................... 40 Figure 19. Global Competitiveness Index ................................................................................. 41 Figure 20. Real and Nominal Effective Exchange Rates ...................................................... 43 Figure 21. Growth and Volatility .................................................................................................. 51 Figure 22. Productivity ..................................................................................................................... 52 Figure 23. Export— Diversification .............................................................................................. 55 Figure 24. Agricultural and Manufacturing Quality .............................................................. 58 Figure 25. Export Concentration and Quality ......................................................................... 59 Figure 26. The Informal Nonagricultural Sector .................................................................... 61
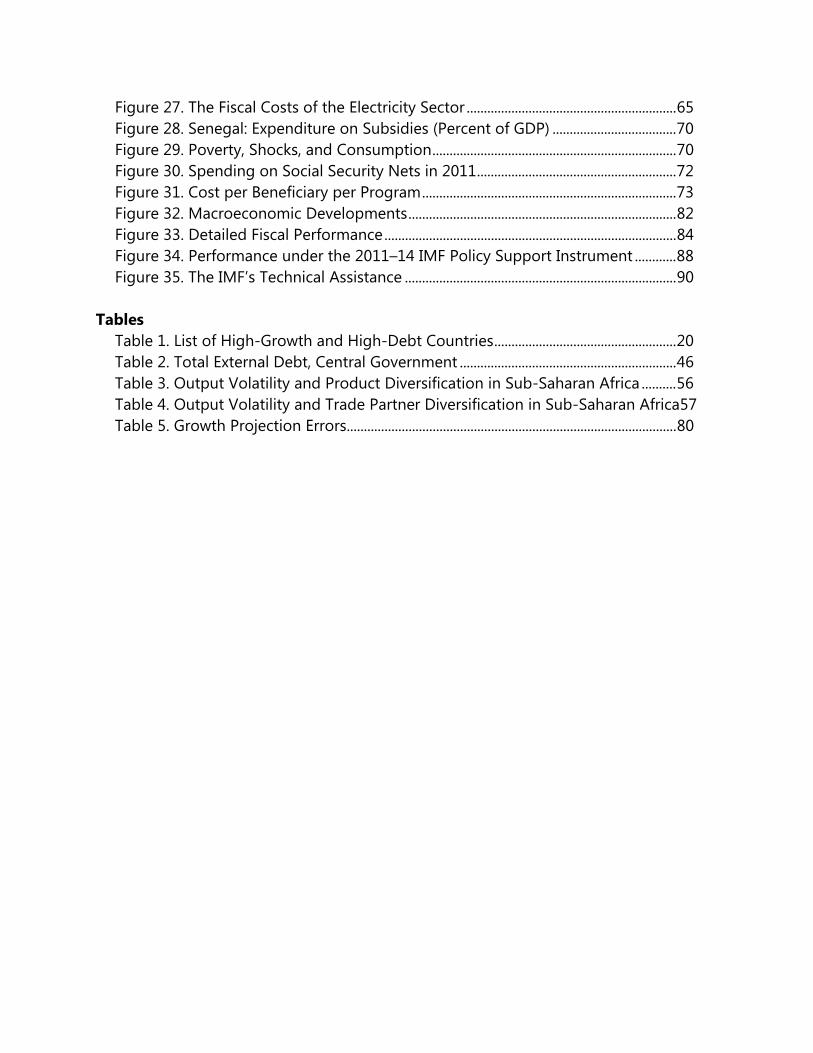
Figure 27. The Fiscal Costs of the Electricity Sector ............................................................. 65 Figure 28. Senegal: Expenditure on Subsidies (Percent of GDP) .................................... 70 Figure 29. Poverty, Shocks, and Consumption ....................................................................... 70 Figure 30. Spending on Social Security Nets in 2011 .......................................................... 72 Figure 31. Cost per Beneficiary per Program .......................................................................... 73 Figure 32. Macroeconomic Developments .............................................................................. 82 Figure 33. Detailed Fiscal Performance ..................................................................................... 84 Figure 34. Performance under the 2011–14 IMF Policy Support Instrument ............ 88 Figure 35. The IMF’s Technical Assistance ............................................................................... 90
Tables Table 1. List of High-Growth and High-Debt Countries ..................................................... 20 Table 2. Total External Debt, Central Government ............................................................... 46 Table 3. Output Volatility and Product Diversification in Sub-Saharan Africa .......... 56 Table 4. Output Volatility and Trade Partner Diversification in Sub-Saharan Africa57 Table 5. Growth Projection Errors ................................................................................................ 80

INTERNATIONAL MONETARY FUND 1
Overview
Alexei Kireyev and Ali Mansoor
Senegal is one of the most democratically developed and stable states in sub-Saharan Africa.
Located in the westernmost part of the African continent, the country has an estimated
population of about 14 million and the per capita income of slightly above US$1,000. A sound
electoral system and a strong democratic tradition, supported by vigilant free media, proved
capable of channeling social and political tensions into a democratic post-election transition in
2012. The new government is committed to respond to chronic underperformance which is
reflected in the growing popular impatience at the slow pace of reforms, low growth,
widespread poverty, and high unemployment. The next presidential elections are expected to
take place in 2017, and there is a sense of urgency to deliver on long-overdue reforms and
electoral promises.
Senegal is at an important inflection point. Growth in the past few years has been sluggish and
did not make a meaningful dent in poverty. To exit the trap of low growth and high poverty, the
authorities have launched a new development strategy: Plan Sénégal Emergent (PSE). The plan
aims for Senegal to be an emerging market economy by 2035 by making it a hub for West
Africa. To reach this objective, 2015 must mark a turning point from the mediocre growth of the
past to the higher, sustainable, and inclusive growth envisaged by the PSE.
The PSE is articulated around three pillars: (1) higher and sustainable growth in the range of 7–8
percent, based on foreign direct investment (FDI) and export-driven structural transformation;
(2) human development and social protection; and (3) improved governance, peace, and
security. The PSE calls for continued fiscal consolidation, constrained public consumption, and
increased public saving to generate fiscal space for higher public investment in human capital
and public infrastructure. It also envisages structural reforms to attract FDI and boost private
investment.
The main challenges for Senegal are to accelerate, broaden, and deepen reforms. The key
institutional preconditions are strong ownership of the PSE at the highest political level, broad
INTERNATIONAL MONETARY FUND 2
popular demand for reforms, and strong support from development partners. On the macro
side, the prospects are favorable: growth is accelerating, inflation remains low, and the fiscal
deficit is under control. Senegal has access to concessional and nonconcessional resources to
finance its development agenda. It should be able to mobilize financial resources with low risk
of debt distress if it follows the fiscal consolidation path envisaged in the PSE and tightens
public consumption, thereby creating space for public investment.
This paper identifies the policy mix needed for the PSE to succeed. Chapter 1 revisits the
challenges of achieving the PSE’s growth objective by tapping into the experience of other
countries that became emerging market economies. Experience of other countries across the
world suggests that the ambition to rise to an emerging economy status within the next two
decades is achievable. Historically, countries that have embarked on important investment
programs have experienced mixed fortunes. Those that have embarked on ambitious structural
reform to unlock FDI and private sector growth have become emerging economies. Those that
just built up debt by ramping up public spending without accompanying reforms still remain
low-income economies. Unleashing Senegal’s growth potential would require strong action on
supply constraints, such as the regulatory framework and cultivation of a business climate
friendly to FDI and small and medium enterprises (SMEs), together with investment in human
capital and infrastructure; reduction in inequality by expanding private employment
opportunities in the formal sector and broader access to education and health services; and
planning for adverse shocks to ensure adequate fiscal space to sustain the PSE investment plan.
Chapter 2 discusses options for strengthening Senegal’s fiscal framework to support the
authorities’ growth strategy implementation while containing risks of debt distress. The
authorities’ latest development plan relies on a new composition of public finances, which
envisages raising additional revenues and rebalancing spending from current to capital. These
plans contrast with the experience in Senegal throughout the past decade, characterized by
weak revenue performance and substantial increases in public consumption, particularly the
government’s wage bill. In this context, strengthening the fiscal framework would be a key step
forward to help steer public finances to support the PSE. This section highlights some areas for
improvement—in particular, in identifying fiscal challenges and planning a credible medium-
term fiscal strategy.
Chapter 3 assesses Senegal’s external stability. Senegal has continued to record sizable current
account deficits over the past decade, financed mainly by official flows, but with increasing
recourse to private flows. While official West African Economic and Monetary Union (WAEMU)
reserves are currently adequate and Senegal’s exchange rate shows no significant signs of
misalignment, the current account deficit is large, at about 10 percent of GDP, and there are
INTERNATIONAL MONETARY FUND 3
signs of eroding competitiveness. Senegal’s exports have not gained market share, and survey-
based indicators continue to point to a need for strong measures to improve structural
competitiveness and the business environment. Debt remains manageable, but there is little
room for higher fiscal deficits or more nonconcessional borrowing if Senegal’s current low-risk
rating is to be preserved. Given these external vulnerabilities, pro-growth fiscal policy must
proceed with caution, especially in the context of a fixed exchange rate, which places almost all
the weight of policy response on the budget.
Chapter 4 explores structural transformation and export of the Senegalese economy to make it
more competitive through more diversified production base and exports. The PSE envisages
boosting economic growth through a large scale-up of investment and structural
transformation. This chapter examines these goals against the backdrop of Senegal’s historical
growth performance with respect to three main areas: total factor productivity, export
diversification and quality, and perceived constraints in the informal sector. It finds that in order
to yield growth gains, additional capital increases need to be accompanied by increases in total
factor productivity, investment in human capital, and broader financial inclusion. Diversification
would benefit growth and stability mainly through increases in the shares of the existing
product base, which are complemented by increases in product quality.
Chapter 5 discusses the electricity problem as a major impediment to accelerated growth and
achieving the objective of the new development strategy. The fiscal cost of the electricity sector
continues to weigh heavily on the government’s budget. As a result, there is an opportunity
cost for development spending, while the economy still faces significant bottlenecks with high
electricity costs and insufficient electricity production. Cross-country experiences provide useful
guidelines on successful reforms, particularly on the fiscal front. Senegal also has an
opportunity to lower tariffs, eliminate fiscal subsidies, and expand coverage—provided it
accelerates the introduction of new low-cost generation. Moreover, this can be done at low cost
to the government budget through the use of power purchase agreements that could be
reached through transparent tenders.
Chapter 6 makes a case for developing and enhancing social safety nets, in particular to protect
the poor and most vulnerable during major structural transformation. While Senegal has been
successful in decreasing poverty rates, the share of the population living below the poverty line
and its exposure to shock remains high, emphasizing the need for safety nets. Such nets should
be scalable to respond to transient needs while ensuring minimum social protection for
chronically poor and vulnerable populations. Strengthening social protection is high on the
authorities’ reform agenda, including within the second pillar of the PSE. This section reviews
Senegal’s current state of social protection and reforms in progress, and outlines main
INTERNATIONAL MONETARY FUND 4
strategies for the design of social security nets going forward.
Chapter 7 takes stock of Senegal’s performance under the IMF’s 2011–14 Policy Support
Instrument (PSI). Senegal has had two successive arrangements under the IMF’s PSI since 2007.
This section focuses on Senegal’s performance under the latest PSI with respect to three main
areas: the overall macroeconomic performance, program conditionality and other policy targets,
and technical assistance. It concludes that the overall macroeconomic performance has been
below par but acceptable. The main PSI goals—higher growth and fiscal and debt
sustainability—were broadly achieved but with less favorable outcomes than initially
programmed; program performance has been mixed, with qualitative targets largely met but
substantial delays in structural reforms. In addition, Senegal has found the technical assistance
from the IMF to be useful, although there is scope for improvement in the implementation of
the IMF’s recommendations.
To sum up, Senegal’s development goals are ambitious but achievable. Risks are substantial but
manageable. The preconditions are in place, the opportunities are vast and challenging. The PSE
provides a unique chance for Senegal to break with the past and join the ranks of fast growing
countries in Africa and across the developing world. Now is the opportune time to go further—
to work together with development partners towards an inclusive, job-rich and sustainable
growth strategy. Now is the right time to start reforming institutions building on the experience
of many countries that have become emerging economies. This is the right time to empower
the youth, women, and the poor. Senegal could be at the front of a joint effort to put the region
on the path to inclusive growth and poverty reduction, become a locomotive for other
countries in WAEMU, and a real hub for West Africa at large.
INTERNATIONAL MONETARY FUND 5
Box 1. Senegal: Main Findings and Recommendations
Peer learning: International experience suggests that Plan Sénégal Emergent (PSE) targets are realistic if
appropriate policies are pursued. For the PSE to succeed, the government of Senegal needs to distill the
experience of comparator countries that successfully became emerging market economies and put in
place a package of reforms that will attract foreign direct investment (FDI), increase private investment,
and expand exports. An active peer-learning effort is needed.
Growth: Unlocking Senegal’s growth potential is possible with bold reforms. The authorities should focus
strong actions on supply constraints, such as creating a regulatory framework and business climate friendly
to FDI and to small and medium enterprises (SMEs). Investment in human capital and infrastructure,
reducing inequalities by expanding private employment opportunities in the formal sector, and
preemptive planning for adverse shocks to safeguard the fiscal space necessary for PSE investments are
also necessary.
Fiscal policies: Improved revenue performance and expenditure composition are critical to the creation of the
fiscal space to support the PSE. The authorities are encouraged to specify the underlying fiscal measures
associated with the PSE, strengthen the fiscal planning of the PSE with contingencies, enhance fiscal
transparency, and improve the effectiveness of public investment.
Transformation: To raise growth, investment needs to be accompanied by improved total factor
productivity, investment in human capital, and broader financial inclusion. Diversification would benefit
growth and stability mainly through increases in the shares of existing products complemented by
improvements in their quality.
Electricity: There is an opportunity cost for development spending—the economy still faces bottlenecks
from high electricity costs and insufficient electricity production. The authorities should continue reforms
of the sector. Cross-country experiences provide useful guidelines on successful reforms, particularly on
the fiscal front. Senegal should also eliminate fiscal subsidies to the electricity sector and expand coverage
capacity, provided it accelerates the introduction of new low-cost electricity generation.
Social safety nets: The share of the population living below the poverty line remains unacceptably high.
Strengthening social protection should be high on the authorities’ reform agenda. The authorities are
encouraged to work with the World Bank and other development partners on establishing safety nets
capable of responding to transient needs and ensuring minimum social protection for chronically poor and
vulnerable groups.
Policy Support Instrument (PSI) implementation: Overall, program performance in 2011–14 has been mixed.
The macroeconomic performance has been below par but acceptable. Key PSI goals were achieved but
with outcomes less favorable than programmed. The qualitative targets were largely met, but substantial
delays occurred in structural reforms. Technical assistance from the IMF was useful, although the
implementation of its recommendations could be improved.

INTERNATIONAL MONETARY FUND 7
Achieving Senegal’s Growth
Objective
Ali Mansoor, Albert Touna Mama, Olivier Basdevant, and Salifou Issoufou1
The Plan Sénégal Emergent (PSE) aims at achieving ambitious growth objectives, which would
allow to make Senegal a regional hub in the medium term. Experience of other countries across
the world suggests that the ambition to rise to an emerging economy status within the next two
decades is achievable. Historically, countries that have embarked on important investment
programs have experienced mixed fortunes. Those that have embarked on ambitions structural
reform to unlock foreign direct investment (FDI) and private sector growth have become
emerging economies. Those that just built up debt by ramping up public spending without
accompanying reforms still remain low-income economies. Unleashing Senegal’s growth
potential would require (1) strong action on supply constraints, such as the regulatory framework
and cultivation of a business climate friendly to FDI and small and medium enterprises (SMEs),
together with investment in human capital and infrastructure; (2) reduction in inequality by
expanding private employment opportunities in the formal sector and broader access to
education and health services; and (3) planning for adverse shocks to ensure adequate fiscal
space to sustain the PSE investment plan.
The PSE calls for Senegal to be an emerging market by 2035 and a hub for the region. The goal
is for Senegal to be a key player in the region for a number of activities through better
infrastructure, greater human development, and better governance. The plan aims to develop
key sectors, such as agriculture, agribusiness, mining, and tourism. To achieve these goals,
1 With assistance from Yanmin Ye.
1
INTERNATIONAL MONETARY FUND 8
Senegal would need to accelerate its growth rate to the 7–8 percent range in the short term
and sustain such rates in the medium term.
International experience suggests that PSE growth objectives are feasible. Historically, growth
acceleration has been a frequent yet unpredictable phenomenon. Nevertheless, growth
acceleration driven by economic reforms tended to be sustained.2 In addition, episodes of
sustained growth and growth acceleration usually coincide with a sharp uptick in private
investment and trade. However, macroeconomic volatility and external shocks are negatively
associated with the duration of growth episodes, while export product sophistication tends to
prolong growth.3
For Senegal, achieving growth rates around 7–8 percent amounts to a structural break
compared with past performances. The PSE projects that economic growth will double the
performance recorded in the past two decades. Over the 1995–2013 period economic
expansion was modest and volatile, with an average real GDP growth of 4 percent and a 1.7
standard deviation. These growth fluctuations were partly caused by uneven agricultural
production, exogenous shocks, and—most important—major bottlenecks in the supply side of
the economy that will need to be addressed for Senegal to achieve a balanced growth path.
This section proposes an analysis of investment, trade, and reforms as ways to achieve PSE
growth objectives. Senegal needs significant private investment, particularly FDI but also
investment in infrastructure and in human capital (education, health). At the same time, it faces
significant supply constraints that hamper growth and development. Increased infrastructure
spending, especially in transportation and power generation, plays an important role in growth,
and it promotes regional and international trade. It can also help achieve such social objectives
as access to clean water, education, and health care. In addition, the PSE foresees a virtuous
cycle of growth set in motion by unlocking these supply constraints. Improved growth
performance would raise revenue and, subsequently, increase fiscal space for investment
spending without putting much pressure on the deficit or building up public debt.
2 Hausmann, Pritchett, and Rodrik (2005) found that growth acceleration is frequent but unpredictable. They
also found economic reform to be a statistically significant predictor of sustained growth acceleration. 3 For volatility and duration of growth episodes see Berg, Ostry, and Zettelmeyer (2012). For export product
sophistication and growth duration see Section 4 of this paper.
INTERNATIONAL MONETARY FUND 9
International Experience
The underlying analysis is based on two sets of countries. The first set consists of high-growth
countries, based on average annual growth in real purchasing-power-parity (PPP) GDP per
capita and levels of real PPP per capita GDP in 1990 and 2013. From among this first set—and
to facilitate drawing lessons on policy and institutional reforms—the analysis then focuses on
10 comparators that satisfy a number of additional criteria. The second set, high-debt
countries, is derived by applying a range of criteria on growth in debt position as well as the
evolution of debt- to-GDP ratios between 1990 and 2013 (see Annex 1 and Table 1).
Historically, countries that have embarked on significant investment programs have
experienced mixed fortunes. Between 1990 and 2013 about 46 countries achieved an average
growth in real PPP per capita GDP of 5 percent or more, while another 43 accumulated debt
without much growth to show for it. Of the 46 countries, the 10 comparators derived from the
analysis are Cabo Verde, China, Guyana, India, Indonesia, Mauritius, Sri Lanka, Tunisia, Uganda,
and Vietnam.4
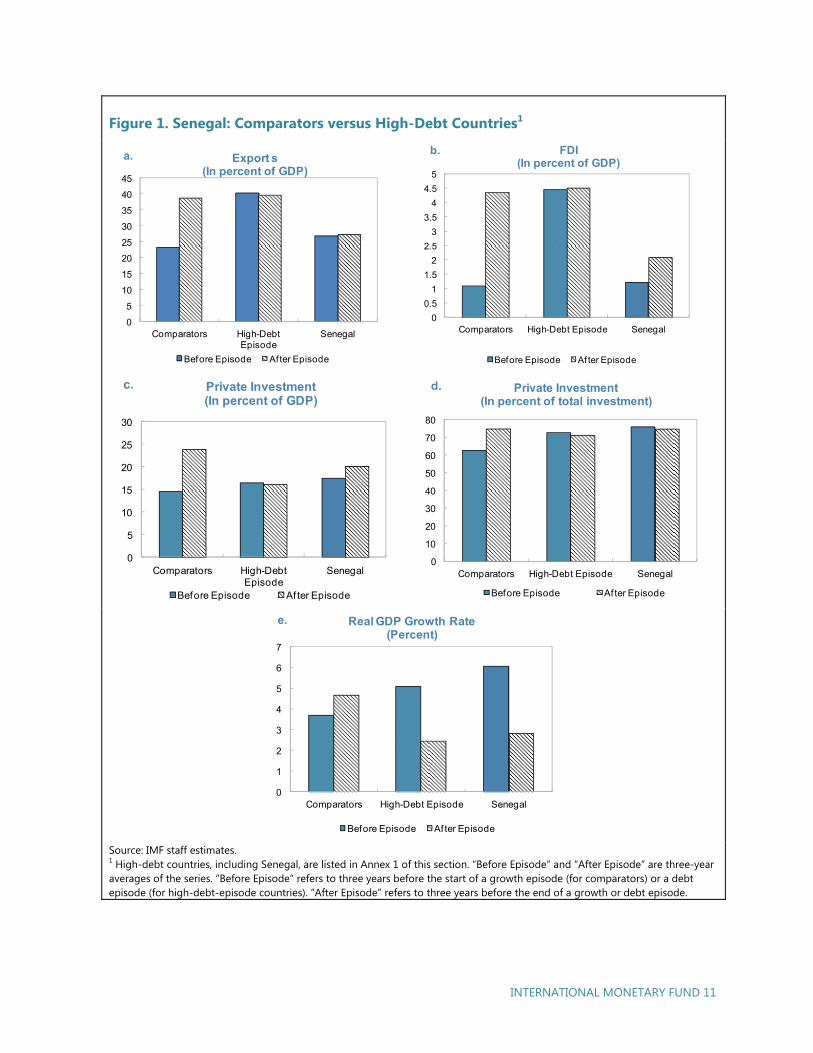
The successful countries emphasized measures to expand exports through more FDI; those that
accumulated debt did not seem to do so (Figure 1). Indeed, comparators experienced
sustained growth by relying on FDI-driven exports. During episodes of growth—and on
average—exports increased by 20 percentage points of GDP for comparators, while high-debt
countries, which include Senegal, saw no change in exports in percent of GDP during episodes
of high debt. The FDI in percent of GDP followed a similar pattern during episodes of growth
for comparators, rising from an average of 1 percent of GDP to nearly 4 percent of GDP in
these 10 countries. Although Senegal has a noticeably higher share of FDI in percent of GDP,
during the episode of high debt, its growth declined. This is partly explained by the lack of a
significant increase in private investment, both in percent of GDP and in percent of total
investment. The sustained growth in comparator countries seems also to be underpinned by
4 This list has only three sub-Saharan African countries and includes China and India. An argument could be
made that it is unrealistic for Senegal to emulate countries like China and India; however, the purpose of the
analysis is to identify countries that Senegal might want to emulate if it is to become an emerging market
middle-income country in 30 years. It could do so by drawing on key lessons from policies and reforms that
countries like China, India, and the rest of the middle-income comparators have successfully devised and
implemented in order to reach their present status.
INTERNATIONAL MONETARY FUND 10
increases in private investment in percent of GDP as well as in percent of total investment. For
Senegal to achieve PSE-set goals, it would need to devise and implement a critical mass of
reforms to encourage private investment, encourage and expand exports, unlock supply
constraints, and promote inclusive growth.
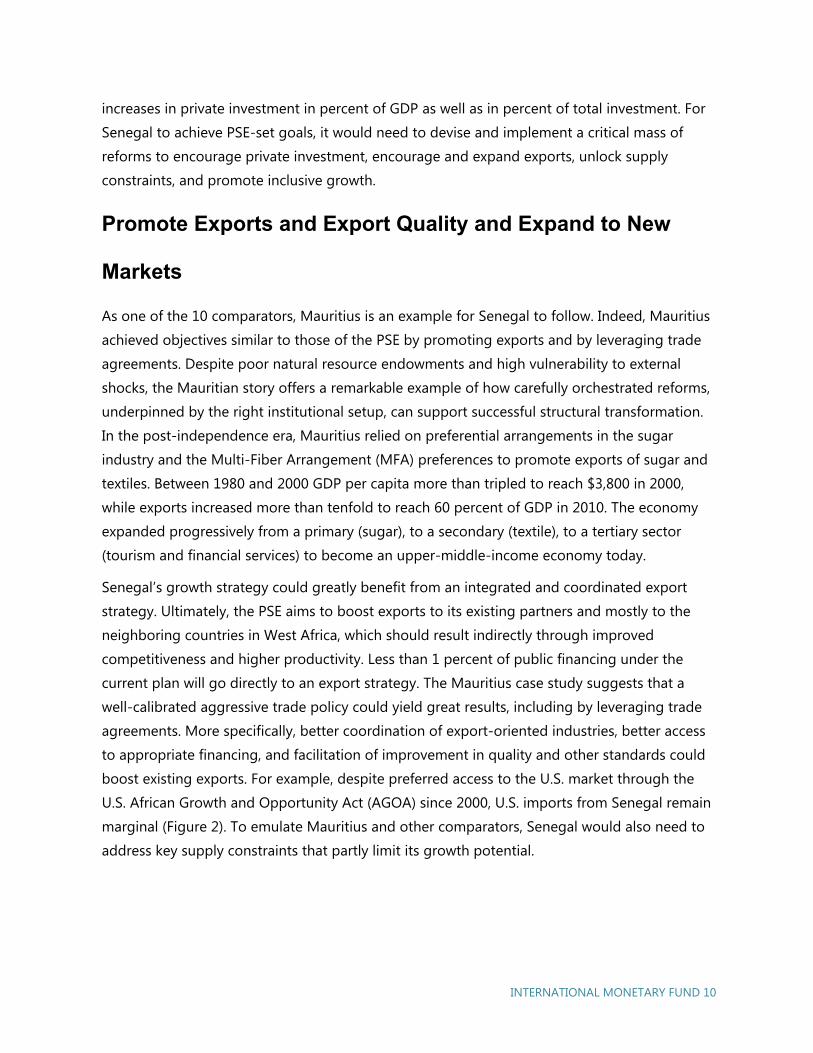
Promote Exports and Export Quality and Expand to New
Markets
As one of the 10 comparators, Mauritius is an example for Senegal to follow. Indeed, Mauritius
achieved objectives similar to those of the PSE by promoting exports and by leveraging trade
agreements. Despite poor natural resource endowments and high vulnerability to external
shocks, the Mauritian story offers a remarkable example of how carefully orchestrated reforms,
underpinned by the right institutional setup, can support successful structural transformation.
In the post-independence era, Mauritius relied on preferential arrangements in the sugar
industry and the Multi-Fiber Arrangement (MFA) preferences to promote exports of sugar and
textiles. Between 1980 and 2000 GDP per capita more than tripled to reach $3,800 in 2000,
while exports increased more than tenfold to reach 60 percent of GDP in 2010. The economy
expanded progressively from a primary (sugar), to a secondary (textile), to a tertiary sector
(tourism and financial services) to become an upper-middle-income economy today.
Senegal’s growth strategy could greatly benefit from an integrated and coordinated export
strategy. Ultimately, the PSE aims to boost exports to its existing partners and mostly to the
neighboring countries in West Africa, which should result indirectly through improved
competitiveness and higher productivity. Less than 1 percent of public financing under the
current plan will go directly to an export strategy. The Mauritius case study suggests that a
well-calibrated aggressive trade policy could yield great results, including by leveraging trade
agreements. More specifically, better coordination of export-oriented industries, better access
to appropriate financing, and facilitation of improvement in quality and other standards could
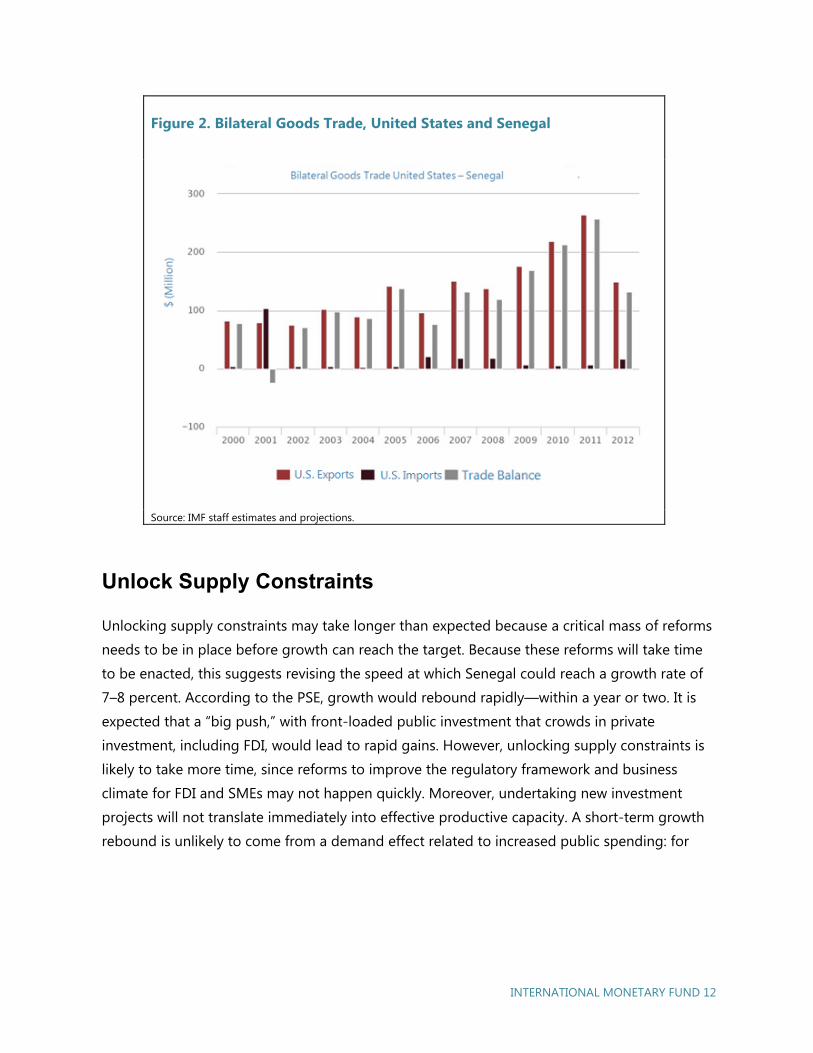
boost existing exports. For example, despite preferred access to the U.S. market through the
U.S. African Growth and Opportunity Act (AGOA) since 2000, U.S. imports from Senegal remain
marginal (Figure 2). To emulate Mauritius and other comparators, Senegal would also need to
address key supply constraints that partly limit its growth potential.
INTERNATIONAL MONETARY FUND 11
Figure 1. Senegal: Comparators versus High-Debt Countries1
Source: IMF staff estimates. 1 High-debt countries, including Senegal, are listed in Annex 1 of this section. “Before Episode” and “After Episode” are three-year averages of the series. “Before Episode” refers to three years before the start of a growth episode (for comparators) or a debt episode (for high-debt-episode countries). “After Episode” refers to three years before the end of a growth or debt episode.
0
5
10
15
20
25
30
35
40
45
Comparators High-Debt Episode
Senegal
Before Episode After Episode
Export s(In percent of GDP)
a.
0
0.5
1
1.5
2
2.5
3
3.5
4
4.5
5
Comparators High-Debt Episode Senegal
Before Episode Af ter Episode
FDI (In percent of GDP)
b.
0
5
10
15
20
25
30
Comparators High-Debt Episode
Senegal
Before Episode Af ter Episode
Private Investment (In percent of GDP)
c.
0
10
20
30
40
50
60
70
80
Comparators High-Debt Episode Senegal
Before Episode After Episode
Private Investment (In percent of total investment)
d.
0
1
2
3
4
5
6
7
Comparators High-Debt Episode Senegal
Before Episode Af ter Episode
Real GDP Growth Rate(Percent)
e.
INTERNATIONAL MONETARY FUND 12
Figure 2. Bilateral Goods Trade, United States and Senegal
Source: IMF staff estimates and projections.
Unlock Supply Constraints
Unlocking supply constraints may take longer than expected because a critical mass of reforms
needs to be in place before growth can reach the target. Because these reforms will take time
to be enacted, this suggests revising the speed at which Senegal could reach a growth rate of
7–8 percent. According to the PSE, growth would rebound rapidly—within a year or two. It is
expected that a “big push,” with front-loaded public investment that crowds in private
investment, including FDI, would lead to rapid gains. However, unlocking supply constraints is
likely to take more time, since reforms to improve the regulatory framework and business
climate for FDI and SMEs may not happen quickly. Moreover, undertaking new investment
projects will not translate immediately into effective productive capacity. A short-term growth
rebound is unlikely to come from a demand effect related to increased public spending: for
INTERNATIONAL MONETARY FUND 13
developing economies, fiscal multipliers tend to be small—and sometimes even negative.5 The
multipliers are low because demand-driven stimuli are hampered by supply constraints. This is
likely to be the case in Senegal, where, among other things, electricity, transportation, and
human capital available to the formal private sector all require policy attention. Moreover, the
large informal sector and low levels of FDI are the result of a poor business climate, clearly
signaled by Senegal’s low rankings in the World Bank’s Doing Business Index. To illustrate this
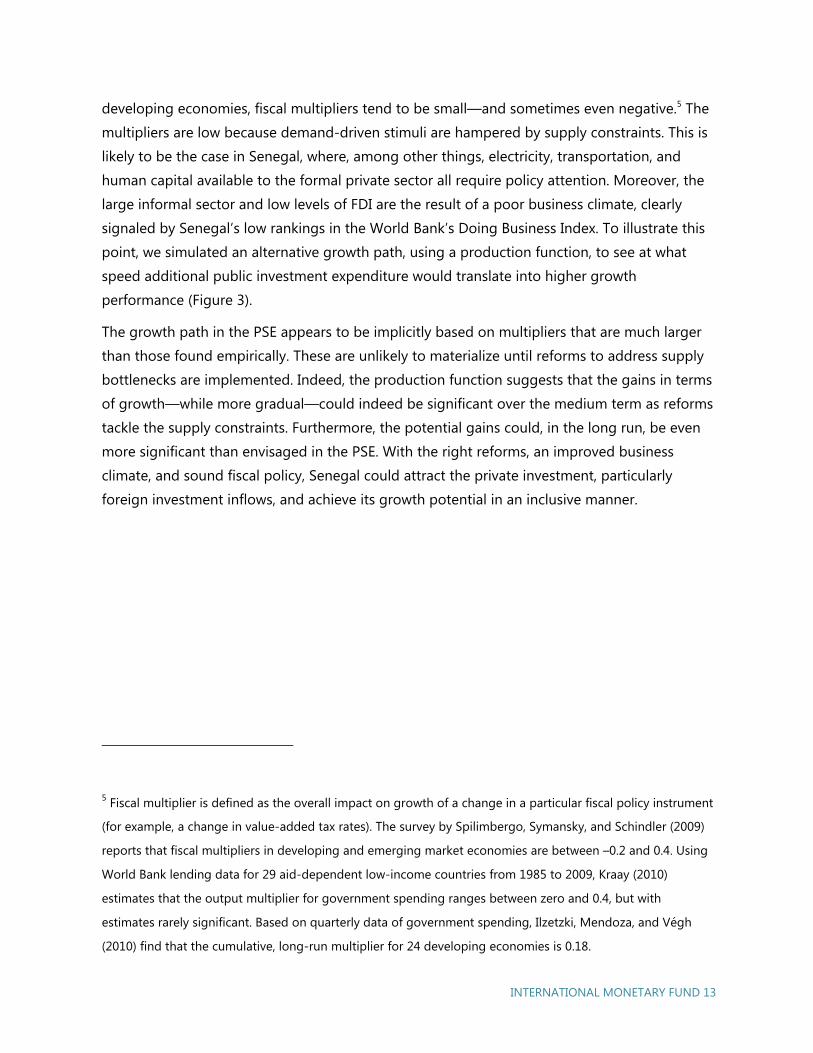
point, we simulated an alternative growth path, using a production function, to see at what
speed additional public investment expenditure would translate into higher growth
performance (Figure 3).
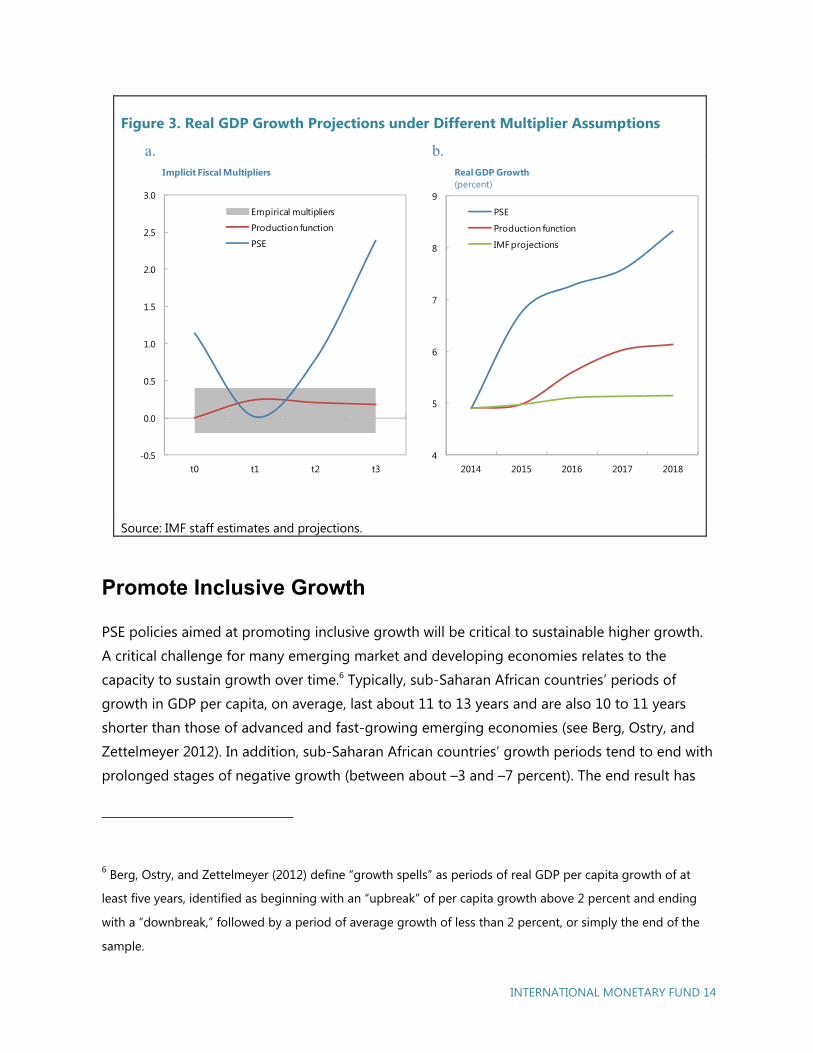
The growth path in the PSE appears to be implicitly based on multipliers that are much larger
than those found empirically. These are unlikely to materialize until reforms to address supply
bottlenecks are implemented. Indeed, the production function suggests that the gains in terms
of growth—while more gradual—could indeed be significant over the medium term as reforms
tackle the supply constraints. Furthermore, the potential gains could, in the long run, be even
more significant than envisaged in the PSE. With the right reforms, an improved business
climate, and sound fiscal policy, Senegal could attract the private investment, particularly
foreign investment inflows, and achieve its growth potential in an inclusive manner.
5 Fiscal multiplier is defined as the overall impact on growth of a change in a particular fiscal policy instrument
(for example, a change in value-added tax rates). The survey by Spilimbergo, Symansky, and Schindler (2009)
reports that fiscal multipliers in developing and emerging market economies are between –0.2 and 0.4. Using
World Bank lending data for 29 aid-dependent low-income countries from 1985 to 2009, Kraay (2010)
estimates that the output multiplier for government spending ranges between zero and 0.4, but with
estimates rarely significant. Based on quarterly data of government spending, Ilzetzki, Mendoza, and Végh
(2010) find that the cumulative, long-run multiplier for 24 developing economies is 0.18.
INTERNATIONAL MONETARY FUND 14
Figure 3. Real GDP Growth Projections under Different Multiplier Assumptions
a. b.
Source: IMF staff estimates and projections.
Promote Inclusive Growth
PSE policies aimed at promoting inclusive growth will be critical to sustainable higher growth.
A critical challenge for many emerging market and developing economies relates to the
capacity to sustain growth over time.6 Typically, sub-Saharan African countries’ periods of
growth in GDP per capita, on average, last about 11 to 13 years and are also 10 to 11 years
shorter than those of advanced and fast-growing emerging economies (see Berg, Ostry, and
Zettelmeyer 2012). In addition, sub-Saharan African countries’ growth periods tend to end with
prolonged stages of negative growth (between about –3 and –7 percent). The end result has
6 Berg, Ostry, and Zettelmeyer (2012) define “growth spells” as periods of real GDP per capita growth of at
least five years, identified as beginning with an “upbreak” of per capita growth above 2 percent and ending
with a “downbreak,” followed by a period of average growth of less than 2 percent, or simply the end of the
sample.
-0.5
0.0
0.5
1.0
1.5
2.0
2.5
3.0
t0 t1 t2 t3
Empirical multipliers
Production function
PSE
Implicit Fiscal Multipliers
4
5
6
7
8
9
2014 2015 2016 2017 2018
PSE
Production function
IMF projections
Real GDP Growth(percent)
INTERNATIONAL MONETARY FUND 15
been overall weaker growth performance, even though most of these countries did experience
periods of high growth.
Senegal’s performance is relatively lower than that of the average sub-Saharan African country.
First, continued growth periods of GDP per capita lasted only about eight years in Senegal;
second, average growth was lower than the average for sub-Saharan Africa. Comparing Senegal
with 4 of the 10 comparators (which had a similar level of income per capita in the early 1990s
but have over about 35 years achieved growth similar to that envisaged for Senegal in the PSE),
four critical factors appear to explain why countries enjoy prolonged periods of positive growth:
income equality, trade openness, political institutions (that is, the degree of democracy), and
FDI (Figure 4).7 Three main stylized facts emerge.
First, Senegal received relatively high levels of FDI during its growth episodes, which
underscores the importance of attracting foreign investors when it comes to Senegal’s
growth performance. In particular, continued improvements in the business climate will be
essential to maintain and develop Senegal’s attractiveness. Senegal would do well to follow
in the footsteps of Rwanda, which rapidly improved its business climate, and Mauritius,
which strove to be in the top tier in Africa. Peer learning in this area has been supported by
the World Bank and could be usefully explored.
Second, over the past decade, Senegal has made two significant changes to its institutions
that bode well for achieving PSE growth objectives. First, Senegal has become more
integrated into the global economy, with more open international trade and improved
diversification.8 Second, Senegal has proved that its democracy functions well, with—for
example—a peaceful political change during last general elections.9 Thus, Senegal has the
basic prerequisites for prolonged periods of high growth as envisaged by the PSE. Indeed,
based on empirical results, with these two institutional improvements, Senegal could have
achieved a prolonged period of growth of about 24 years instead of 8 years.
7 These comparators are Cabo Verde, Indonesia, Sri Lanka, and Uganda. 8 Senegal scored zero on trade openness during its growth episode identified by Berg, Ostry, and Zettelmeyer
(2012), largely because of its marketing board, which was phased out in the early 2000s. Today, Senegal’s trade
has been mostly liberalized, which translates into a trade openness index value of 1. 9 During its identified growth episodes, Senegal had a much lower score for democratic institutions, but it has
since made significant progress, highlighted by peaceful political change and a high score in the Polity IV
index, similar to those of well-established democracies (http://www.systemicpeace.org/polity/polity4.htm).
INTERNATIONAL MONETARY FUND 16
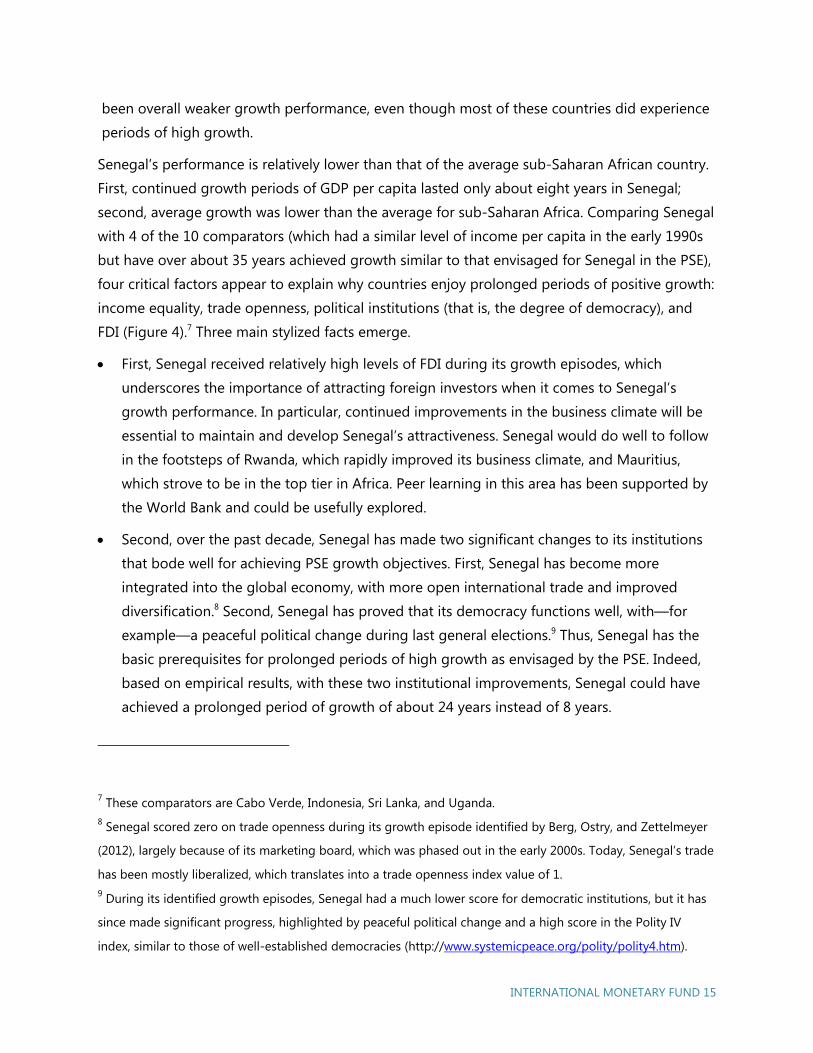
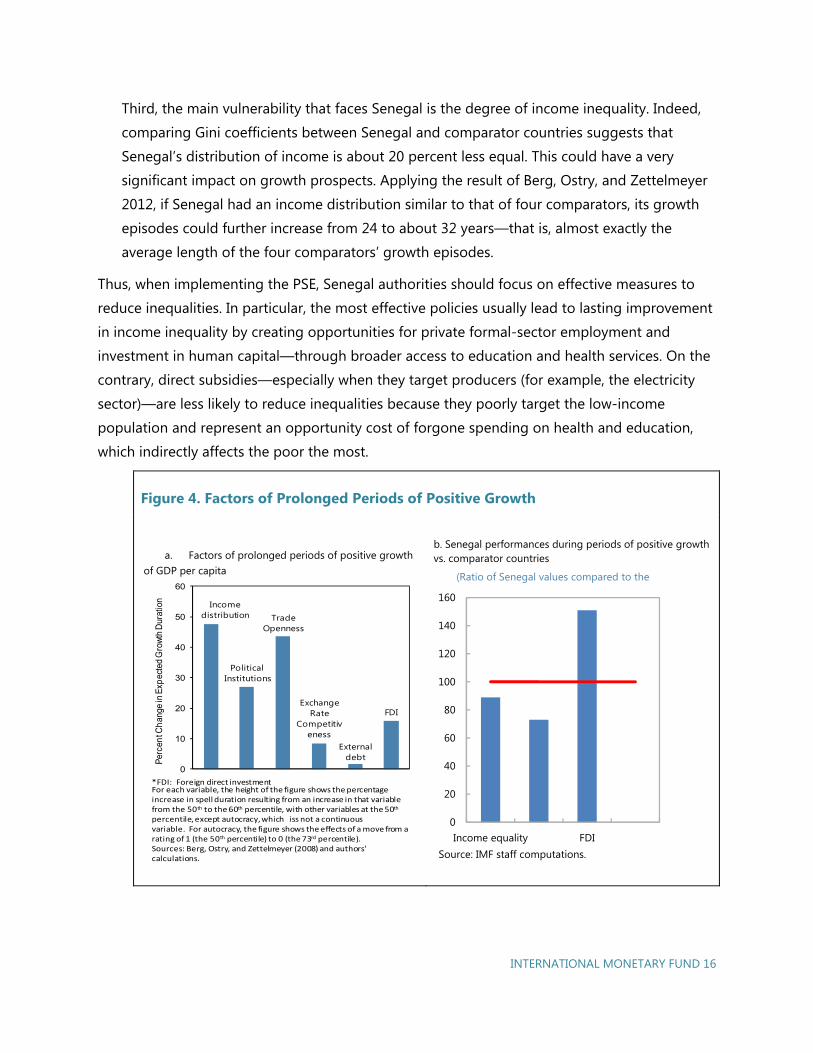
Third, the main vulnerability that faces Senegal is the degree of income inequality. Indeed,
comparing Gini coefficients between Senegal and comparator countries suggests that
Senegal’s distribution of income is about 20 percent less equal. This could have a very
significant impact on growth prospects. Applying the result of Berg, Ostry, and Zettelmeyer
2012, if Senegal had an income distribution similar to that of four comparators, its growth
episodes could further increase from 24 to about 32 years—that is, almost exactly the
average length of the four comparators’ growth episodes.
Thus, when implementing the PSE, Senegal authorities should focus on effective measures to
reduce inequalities. In particular, the most effective policies usually lead to lasting improvement
in income inequality by creating opportunities for private formal-sector employment and
investment in human capital—through broader access to education and health services. On the
contrary, direct subsidies—especially when they target producers (for example, the electricity
sector)—are less likely to reduce inequalities because they poorly target the low-income
population and represent an opportunity cost of forgone spending on health and education,
which indirectly affects the poor the most.
Figure 4. Factors of Prolonged Periods of Positive Growth
a. Factors of prolonged periods of positive growth of GDP per capita
b. Senegal performances during periods of positive growth vs. comparator countries
Income distribution
Political Institutions
Trade Openness
Exchange Rate
Competitiveness
External debt
FDI
0
10
20
30
40
50
60
Per
cen
t Ch
ange
in E
xpec
ted
Gro
wth
Dur
atio
n
For each variable, the height of the figure shows the percentage increase in spell duration resulting from an increase in that variable from the 50th to the 60th percentile, with other variables at the 50th
percentile, except autocracy, which iss not a continuous variable. For autocracy, the figure shows the effects of a move from a rating of 1 (the 50th percentile) to 0 (the 73rd percentile).Sources: Berg, Ostry, and Zettelmeyer (2008) and authors' calculations.
*FDI: Foreign direct investment
0
20
40
60
80
100
120
140
160
Income equality FDI
(Ratio of Senegal values compared to the
Source: IMF staff computations.
INTERNATIONAL MONETARY FUND 17
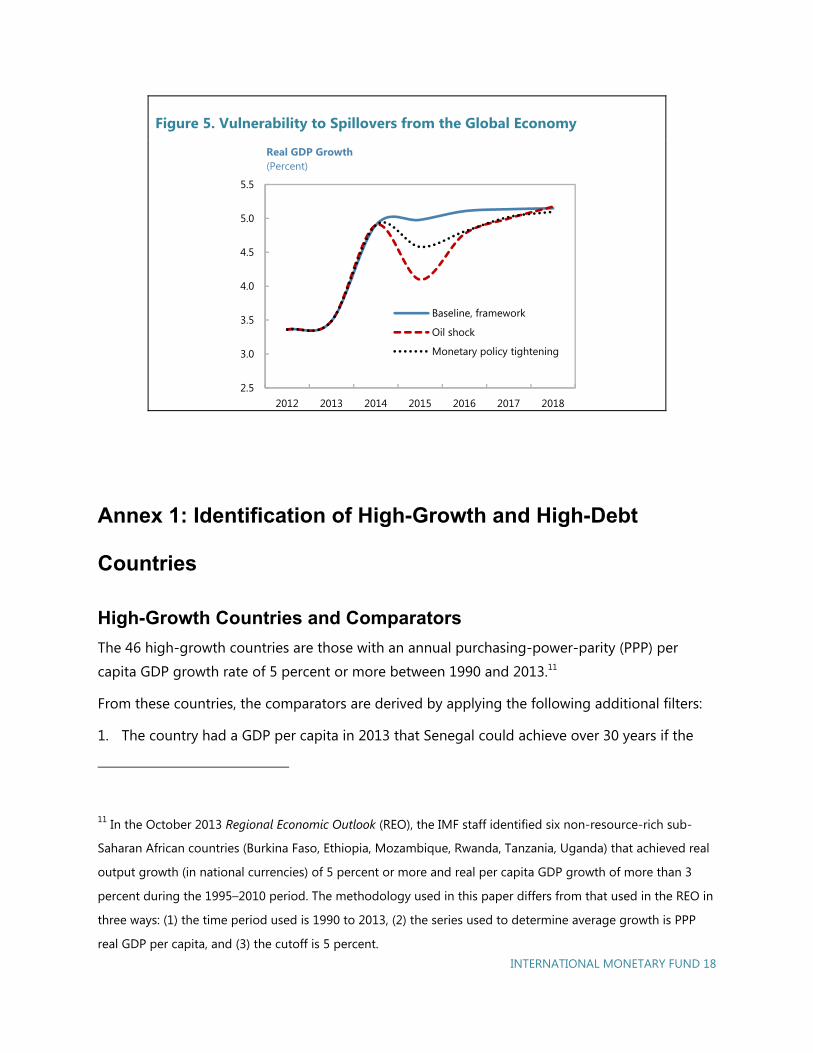
Planning for contingencies will be critical: potential risks to growth could complicate PSE
implementation. Senegal faces risks to its growth pattern. An obvious risk relates to PSE
implementation and would require timely implementation of reforms to bring about the growth
rebound and create the needed fiscal space for investment scale-up. But Senegal is also
exposed to spillover risks—that is, risks pertaining to the global economy and largely outside
Senegalese control. Planning for these risks is critical, given that their potential impact on
growth could derail PSE implementation. These risks can be quantified: based on the
vulnerability exercise for low-income countries (VE-LIC), Senegal could lose between ½ and 1
percentage point of growth (Figure ).10 This could increase tension in fiscal balances by reducing
the fiscal space available for investment. Mitigating this risk requires planning and prioritization
in order not to jeopardize the investment spending (both human and physical) critical to the
PSE. Such planning could be based on (1) streamlining public expenditure—for example, by
timely implementation of electricity sector reform, because it will also reduce the need for
electricity subsidies—and (2) maintaining prudent fiscal and debt policies to allow Senegal to
preserve its access to financing in case of an adverse shock. Regarding the latter, the credibility
of fiscal deficit and debt objectives could be increased by adopting rules to contain recurrent
spending growth and/or developing fiscal councils to enhance the effectiveness of fiscal
objectives. Moreover, such actions should reduce the cost of access to capital markets, further
increasing fiscal space for investment in human capital and public infrastructure.
10 Risks to the global economy are still on the downside. For Senegal the two critical sources of spillovers are
(1) a tightening of monetary policy conditions in advanced economies, which would reduce demand for
Senegalese products, and (2) an oil price shock, following the recent turmoil in the Middle East, which would
translate into a decline in oil production and a protracted increase in oil prices.
INTERNATIONAL MONETARY FUND 18
Figure 5. Vulnerability to Spillovers from the Global Economy
Annex 1: Identification of High-Growth and High-Debt
Countries
High-Growth Countries and Comparators
The 46 high-growth countries are those with an annual purchasing-power-parity (PPP) per
capita GDP growth rate of 5 percent or more between 1990 and 2013.11
From these countries, the comparators are derived by applying the following additional filters:
1. The country had a GDP per capita in 2013 that Senegal could achieve over 30 years if the
11 In the October 2013 Regional Economic Outlook (REO), the IMF staff identified six non-resource-rich sub-
Saharan African countries (Burkina Faso, Ethiopia, Mozambique, Rwanda, Tanzania, Uganda) that achieved real
output growth (in national currencies) of 5 percent or more and real per capita GDP growth of more than 3
percent during the 1995–2010 period. The methodology used in this paper differs from that used in the REO in
three ways: (1) the time period used is 1990 to 2013, (2) the series used to determine average growth is PPP
real GDP per capita, and (3) the cutoff is 5 percent.
2.5
3.0
3.5
4.0
4.5
5.0
5.5
2012 2013 2014 2015 2016 2017 2018
Baseline, framework
Oil shock
Monetary policy tightening
Real GDP Growth(Percent)
INTERNATIONAL MONETARY FUND 19
Plan Sénégal Emergent (PSE) succeeds in becoming an emerging market middle-income
country—that is, PPP per capita GDP between $5,500 and $9,800.12
2. The country had a lower PPP GDP per capita than Senegal in 1990 but a higher PPP GDP per
capita than Senegal in 2013.
3. The country’s export concentration is low (1/3 standard deviation below the mean) or has
improved while remaining within 2/3 standard deviation above the mean.
Identification of Growth Episodes
From the list of high-growth countries, growth episodes were identified using the following
criteria:
1. Real GDP growth of 5 percent or more for at least five consecutive years.
2. No more than two years of deviations from growth trend within the five-year period.
In Figure 1, the variables are computed as follows: the value for “before episode” is a three-year
average before the start of the episode, while the value for “after episode” is a three-year
average through the end of the growth episode.
High-Debt Countries
The list of 43 high-debt-episode countries is derived by applying the following filter:
1. A country that experienced a growth in debt position of 2 percent a year consecutively for
at least five years in trend, with no more than two years of deviation from trend
consecutively within the five-year period.
2. The country’s debt position exceeded 40 percent of GDP at some point between 1990 and
2013.
The variables reported in Figure 1 for high-debt countries, including Senegal, are computed as
three-year averages before the start of debt episodes and through the end of the debt episode.
12 These are the lower and upper bounds if Senegal sustains an average annual growth rate of 4.6 percent and 7.6
percent. An exception is made for African middle-income countries that achieved a higher income level in 2013.
INTERNATIONAL MONETARY FUND 20
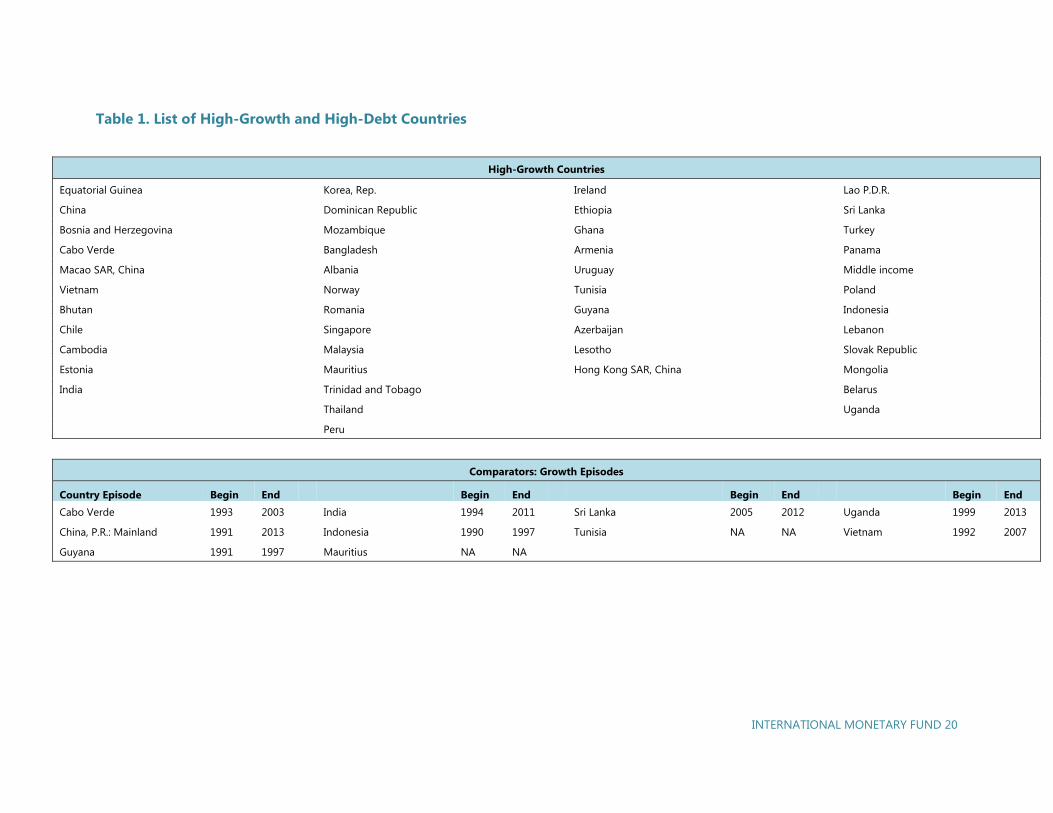
Table 1. List of High-Growth and High-Debt Countries
High-Growth Countries
Equatorial Guinea Korea, Rep. Ireland Lao P.D.R. China Dominican Republic Ethiopia Sri Lanka Bosnia and Herzegovina Mozambique Ghana Turkey Cabo Verde Bangladesh Armenia Panama Macao SAR, China Albania Uruguay Middle income Vietnam Norway Tunisia Poland Bhutan Romania Guyana Indonesia Chile Singapore Azerbaijan Lebanon Cambodia Malaysia Lesotho Slovak Republic Estonia Mauritius Hong Kong SAR, China Mongolia India Trinidad and Tobago Belarus Thailand Uganda
Peru
Comparators: Growth Episodes Country Episode Begin End Begin End Begin End Begin End Cabo Verde 1993 2003 India 1994 2011 Sri Lanka 2005 2012 Uganda 1999 2013
China, P.R.: Mainland 1991 2013 Indonesia 1990 1997 Tunisia NA NA Vietnam 1992 2007
Guyana 1991 1997 Mauritius NA NA
INTERNATIONAL MONETARY FUND 21
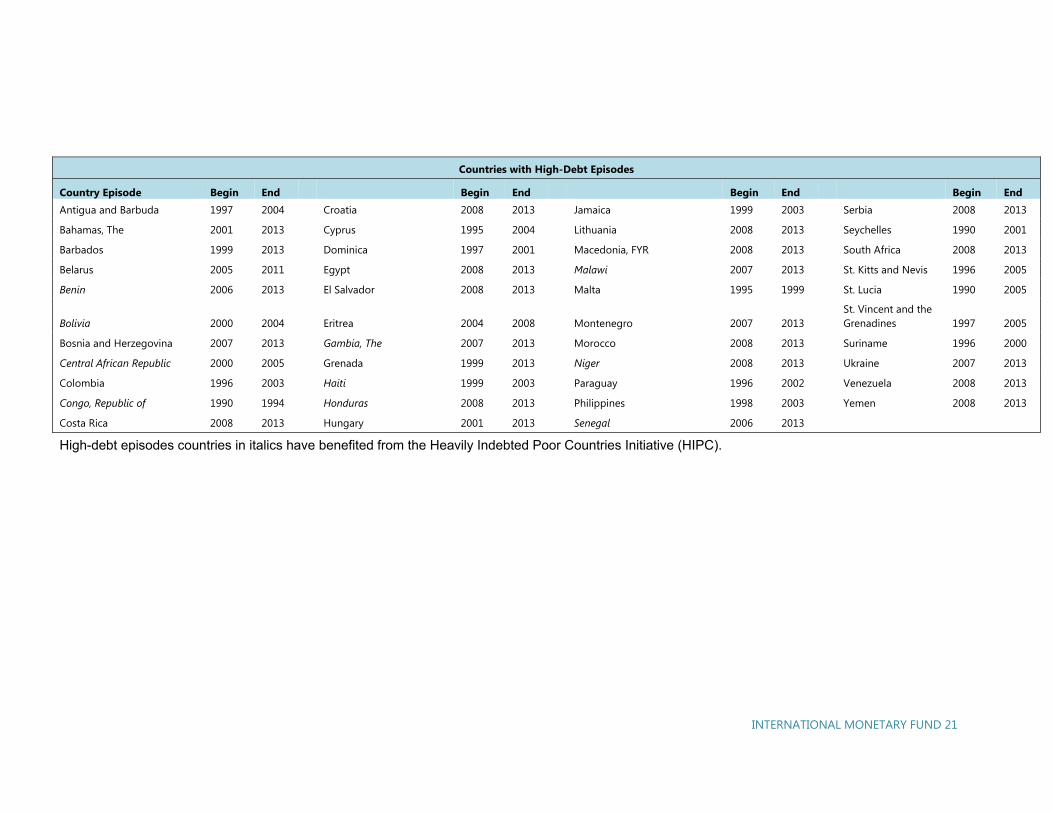
Countries with High-Debt Episodes Country Episode Begin End Begin End Begin End Begin End Antigua and Barbuda 1997 2004 Croatia 2008 2013 Jamaica 1999 2003 Serbia 2008 2013
Bahamas, The 2001 2013 Cyprus 1995 2004 Lithuania 2008 2013 Seychelles 1990 2001
Barbados 1999 2013 Dominica 1997 2001 Macedonia, FYR 2008 2013 South Africa 2008 2013
Belarus 2005 2011 Egypt 2008 2013 Malawi 2007 2013 St. Kitts and Nevis 1996 2005
Benin 2006 2013 El Salvador 2008 2013 Malta 1995 1999 St. Lucia 1990 2005
Bolivia 2000 2004 Eritrea 2004 2008 Montenegro 2007 2013 St. Vincent and the Grenadines 1997 2005
Bosnia and Herzegovina 2007 2013 Gambia, The 2007 2013 Morocco 2008 2013 Suriname 1996 2000
Central African Republic 2000 2005 Grenada 1999 2013 Niger 2008 2013 Ukraine 2007 2013
Colombia 1996 2003 Haiti 1999 2003 Paraguay 1996 2002 Venezuela 2008 2013
Congo, Republic of 1990 1994 Honduras 2008 2013 Philippines 1998 2003 Yemen 2008 2013
Costa Rica 2008 2013 Hungary 2001 2013 Senegal 2006 2013
High-debt episodes countries in italics have benefited from the Heavily Indebted Poor Countries Initiative (HIPC).

INTERNATIONAL MONETARY FUND 23
Strengthening Senegal’s Fiscal
Framework
Carlos Mulas-Granados1
The Plan Sénégal Emergent (PSE) relies on a new composition of public finances, which envisages
raising additional revenues and rebalancing spending from current to capital. These plans
contrast with the experience in Senegal throughout the past decade, characterized by weak
revenue performance and substantial increases in public consumption, particularly the
government’s wage bill. In this context, strengthening the fiscal framework would be a key step
forward to help steer public finances to support the PSE. This section highlights some areas for
improvement—in particular, in identifying fiscal challenges and planning a credible medium-term
fiscal strategy.
Fiscal Performance during the Past Decade
The growth of spending above revenues has weakened the sustainability of public finances. The
increase in public spending has not been accompanied by a parallel increase in public revenues
(Figure 6), thus hampering public finances. As a consequence, the public deficit is at 5.2 percent
of GDP in 2014 (up from less than 2 percent of GDP a decade earlier), and public debt is at 53.4
percent of GDP, which was already high after debt relief obtained under the Heavily Indebted
Poor Countries (HIPC) initiative. While the authorities have committed to deficit reduction,
spending continues to exceed revenues. Financing the deficit through higher public debt may
prove increasingly difficult and more costly as international markets tighten credit conditions
for emerging market economies.
1 With contributions from Olivier Basdevant (MCD) and Renaud Duplay (FAD).
2
INTERNATIONAL MONETARY FUND 24
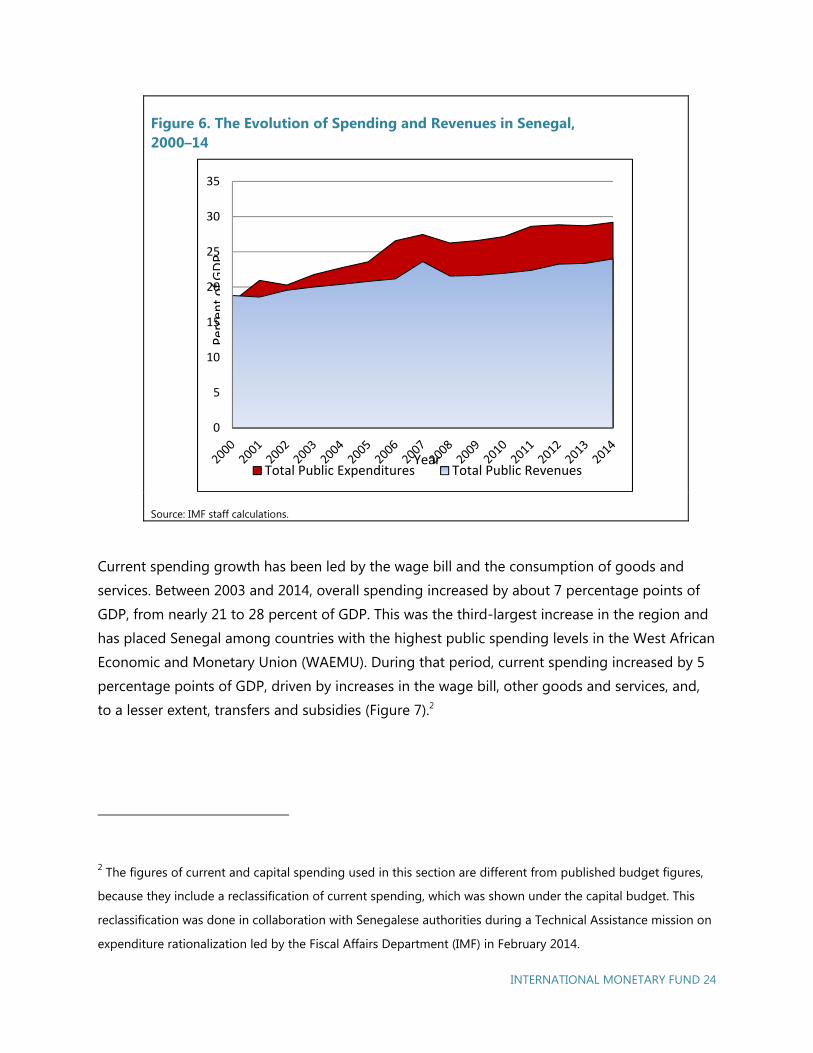
Figure 6. The Evolution of Spending and Revenues in Senegal, 2000–14
Source: IMF staff calculations.
Current spending growth has been led by the wage bill and the consumption of goods and
services. Between 2003 and 2014, overall spending increased by about 7 percentage points of
GDP, from nearly 21 to 28 percent of GDP. This was the third-largest increase in the region and
has placed Senegal among countries with the highest public spending levels in the West African
Economic and Monetary Union (WAEMU). During that period, current spending increased by 5
percentage points of GDP, driven by increases in the wage bill, other goods and services, and,
to a lesser extent, transfers and subsidies (Figure 7).2
2 The figures of current and capital spending used in this section are different from published budget figures,
because they include a reclassification of current spending, which was shown under the capital budget. This
reclassification was done in collaboration with Senegalese authorities during a Technical Assistance mission on
expenditure rationalization led by the Fiscal Affairs Department (IMF) in February 2014.
0
5
10
15
20
25
30
35
Total Public Expenditures Total Public Revenues
Per
cen
to
fG
DP
Year
INTERNATIONAL MONETARY FUND 25
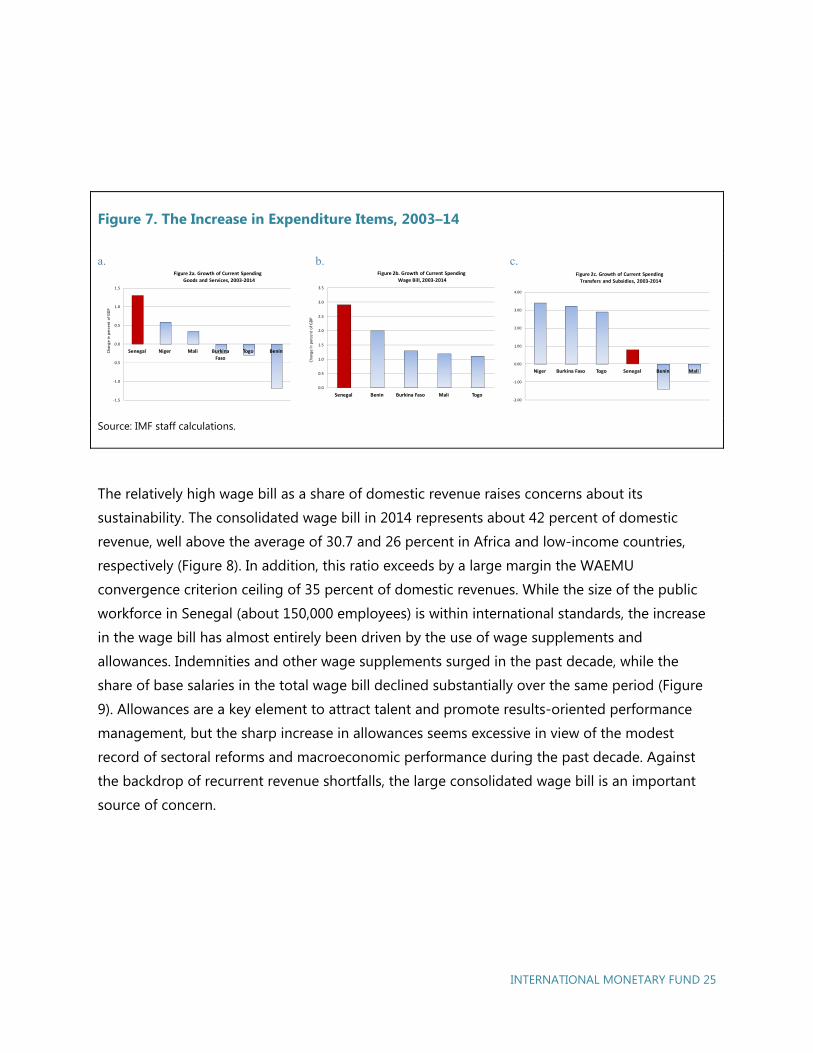
Figure 7. The Increase in Expenditure Items, 2003–14
a. b. c.
Source: IMF staff calculations.
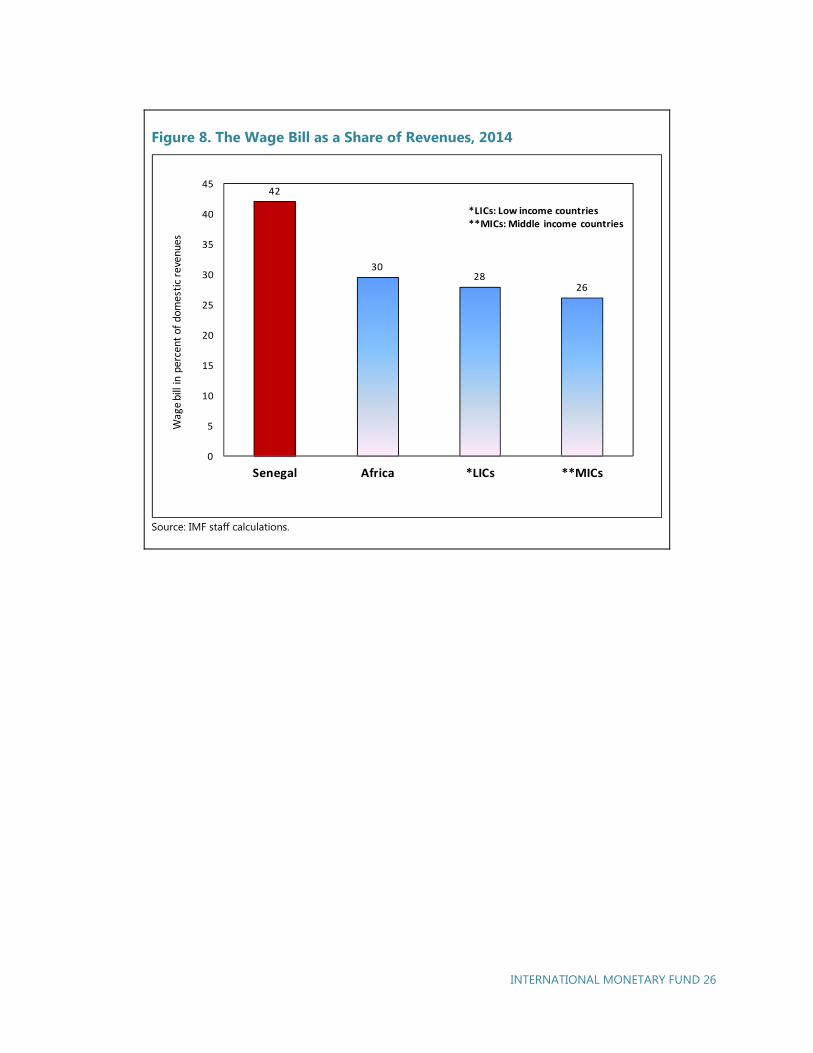
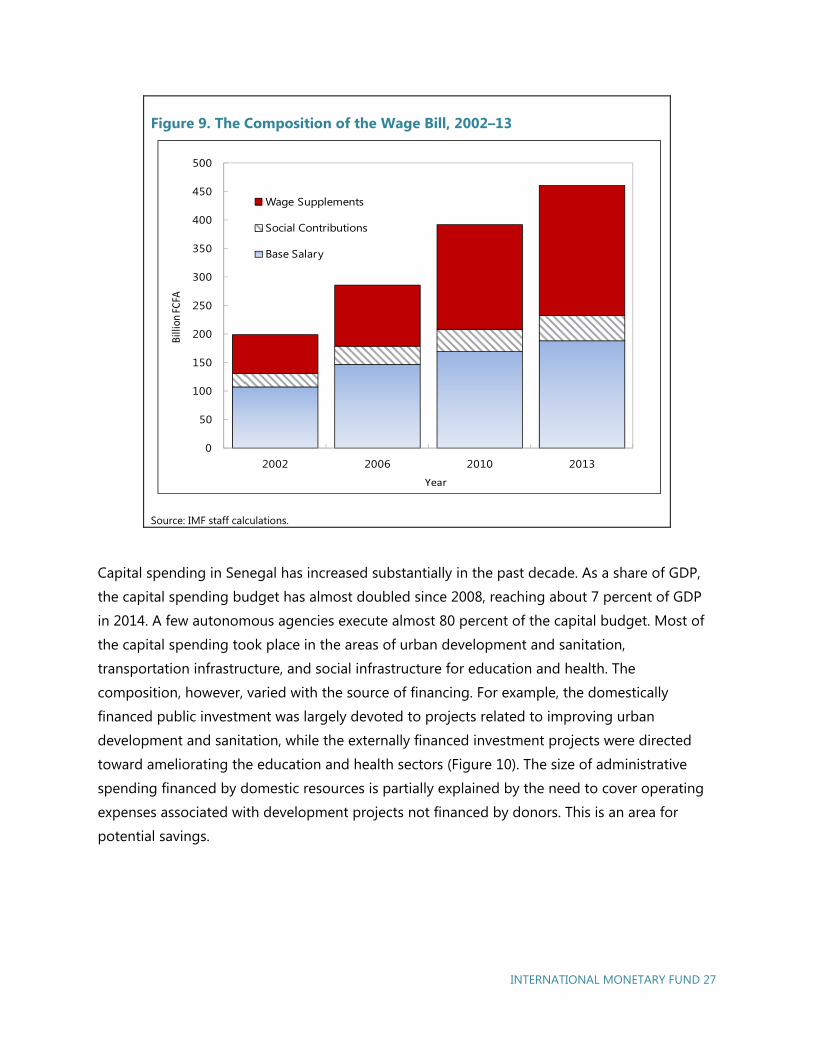
The relatively high wage bill as a share of domestic revenue raises concerns about its
sustainability. The consolidated wage bill in 2014 represents about 42 percent of domestic
revenue, well above the average of 30.7 and 26 percent in Africa and low-income countries,
respectively (Figure 8). In addition, this ratio exceeds by a large margin the WAEMU
convergence criterion ceiling of 35 percent of domestic revenues. While the size of the public
workforce in Senegal (about 150,000 employees) is within international standards, the increase
in the wage bill has almost entirely been driven by the use of wage supplements and
allowances. Indemnities and other wage supplements surged in the past decade, while the
share of base salaries in the total wage bill declined substantially over the same period (Figure
9). Allowances are a key element to attract talent and promote results-oriented performance
management, but the sharp increase in allowances seems excessive in view of the modest
record of sectoral reforms and macroeconomic performance during the past decade. Against
the backdrop of recurrent revenue shortfalls, the large consolidated wage bill is an important
source of concern.
-1.5
-1.0
-0.5
0.0
0.5
1.0
1.5
Senegal Niger Mali Burkina
Faso
Togo Benin Ch
ang
ein
per
cent
of G
DP
Figure 2a. Growth of Current Spending
Goods and Services, 2003-2014
0.0
0.5
1.0
1.5
2.0
2.5
3.0
3.5
Senegal Benin Burkina Faso Mali Togo
Ch
an
gein
pe
rce
nt
of
GD
P
Figure 2b. Growth of Current Spending
Wage Bill, 2003-2014
-2.00
-1.00
0.00
1.00
2.00
3.00
4.00
Niger Burkina Faso Togo Senegal Benin Mali
Figure 2c. Growth of Current Spending
Transfers and Subsidies, 2003-2014
INTERNATIONAL MONETARY FUND 26
Figure 8. The Wage Bill as a Share of Revenues, 2014
Source: IMF staff calculations.
42
3028
26
0
5
10
15
20
25
30
35
40
45
Senegal Africa *LICs **MICs
*LICs: Low income countries**MICs: Middle income countries
Wag
ebi
ll in
per
cent
of
dom
esti
c re
venu
es
INTERNATIONAL MONETARY FUND 27
Figure 9. The Composition of the Wage Bill, 2002–13
Source: IMF staff calculations.
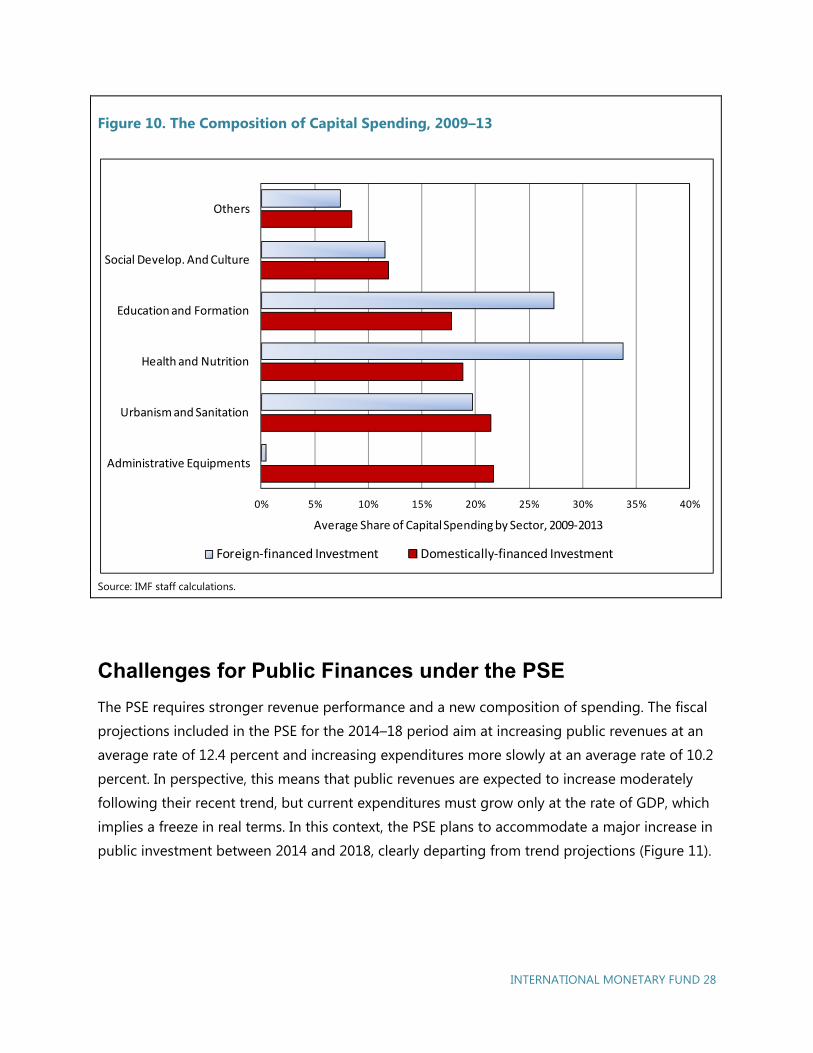
Capital spending in Senegal has increased substantially in the past decade. As a share of GDP,
the capital spending budget has almost doubled since 2008, reaching about 7 percent of GDP
in 2014. A few autonomous agencies execute almost 80 percent of the capital budget. Most of
the capital spending took place in the areas of urban development and sanitation,
transportation infrastructure, and social infrastructure for education and health. The
composition, however, varied with the source of financing. For example, the domestically
financed public investment was largely devoted to projects related to improving urban
development and sanitation, while the externally financed investment projects were directed
toward ameliorating the education and health sectors (Figure 10). The size of administrative
spending financed by domestic resources is partially explained by the need to cover operating
expenses associated with development projects not financed by donors. This is an area for
potential savings.
0
50
100
150
200
250
300
350
400
450
500
2002 2006 2010 2013
Wage Supplements
Social Contributions
Base Salary
Bill
ion
FCFA
Year
INTERNATIONAL MONETARY FUND 28
Figure 10. The Composition of Capital Spending, 2009–13
Source: IMF staff calculations.
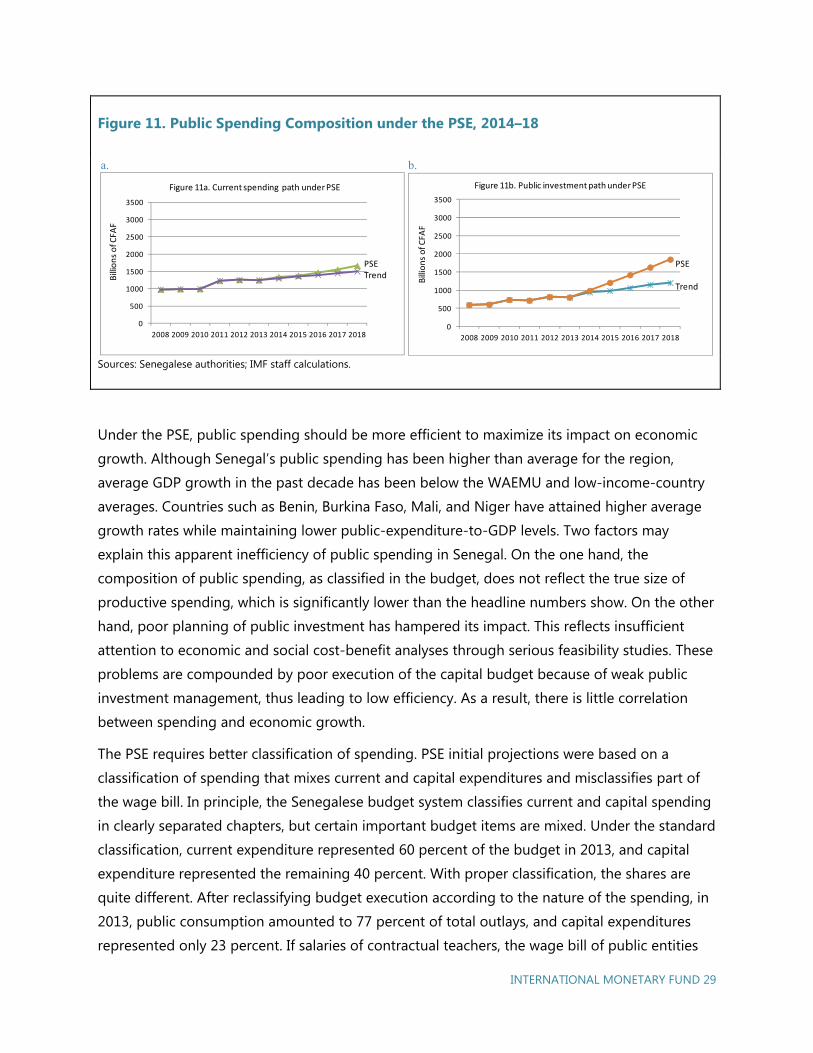
Challenges for Public Finances under the PSE
The PSE requires stronger revenue performance and a new composition of spending. The fiscal
projections included in the PSE for the 2014–18 period aim at increasing public revenues at an
average rate of 12.4 percent and increasing expenditures more slowly at an average rate of 10.2
percent. In perspective, this means that public revenues are expected to increase moderately
following their recent trend, but current expenditures must grow only at the rate of GDP, which
implies a freeze in real terms. In this context, the PSE plans to accommodate a major increase in
public investment between 2014 and 2018, clearly departing from trend projections (Figure 11).
0% 5% 10% 15% 20% 25% 30% 35% 40%
Administrative Equipments
Urbanism and Sanitation
Health and Nutrition
Education and Formation
Social Develop. And Culture
Others
Foreign-financed Investment Domestically-financed Investment
Average Share of Capital Spending by Sector, 2009-2013
INTERNATIONAL MONETARY FUND 29
Figure 11. Public Spending Composition under the PSE, 2014–18
a. b.
Sources: Senegalese authorities; IMF staff calculations.
Under the PSE, public spending should be more efficient to maximize its impact on economic
growth. Although Senegal’s public spending has been higher than average for the region,
average GDP growth in the past decade has been below the WAEMU and low-income-country
averages. Countries such as Benin, Burkina Faso, Mali, and Niger have attained higher average
growth rates while maintaining lower public-expenditure-to-GDP levels. Two factors may
explain this apparent inefficiency of public spending in Senegal. On the one hand, the
composition of public spending, as classified in the budget, does not reflect the true size of
productive spending, which is significantly lower than the headline numbers show. On the other
hand, poor planning of public investment has hampered its impact. This reflects insufficient
attention to economic and social cost-benefit analyses through serious feasibility studies. These
problems are compounded by poor execution of the capital budget because of weak public
investment management, thus leading to low efficiency. As a result, there is little correlation
between spending and economic growth.
The PSE requires better classification of spending. PSE initial projections were based on a
classification of spending that mixes current and capital expenditures and misclassifies part of
the wage bill. In principle, the Senegalese budget system classifies current and capital spending
in clearly separated chapters, but certain important budget items are mixed. Under the standard
classification, current expenditure represented 60 percent of the budget in 2013, and capital
expenditure represented the remaining 40 percent. With proper classification, the shares are
quite different. After reclassifying budget execution according to the nature of the spending, in
2013, public consumption amounted to 77 percent of total outlays, and capital expenditures
represented only 23 percent. If salaries of contractual teachers, the wage bill of public entities
0
500
1000
1500
2000
2500
3000
3500
2008 2009 2010 2011 2012 2013 2014 2015 2016 2017 2018
Figure 11a. Current spending path under PSE
Bill
ion
so
f CFA
F
PSETrend
0
500
1000
1500
2000
2500
3000
3500
2008 2009 2010 2011 2012 2013 2014 2015 2016 2017 2018
Figure 11b. Public investment path under PSE
Bill
ion
so
f CFA
F
PSE
Trend
INTERNATIONAL MONETARY FUND 30
(agencies, universities, hospitals), and the salaries paid under the investment budget executed
by the state are added to the remuneration of central government employees, the wage bill
increases by 45 percent. Similarly, total consumption of goods and services is actually 46
percent higher when the operating costs of agencies, universities, hospitals, and investment
projects are added to the use of goods and services by central government ministries. In this
context, the government has begun a gradual process to reclassify spending properly from the
2015 budget law onward.
The PSE needs better budget planning and execution. The PSE assumes that budget projections
and execution evolve together, but this has not been the case in the recent past—and the
question needs to be addressed if spending under the PSE is to have the desired economic
impact. Since 2010 the authorities’ fiscal projections have been consistently overoptimistic.
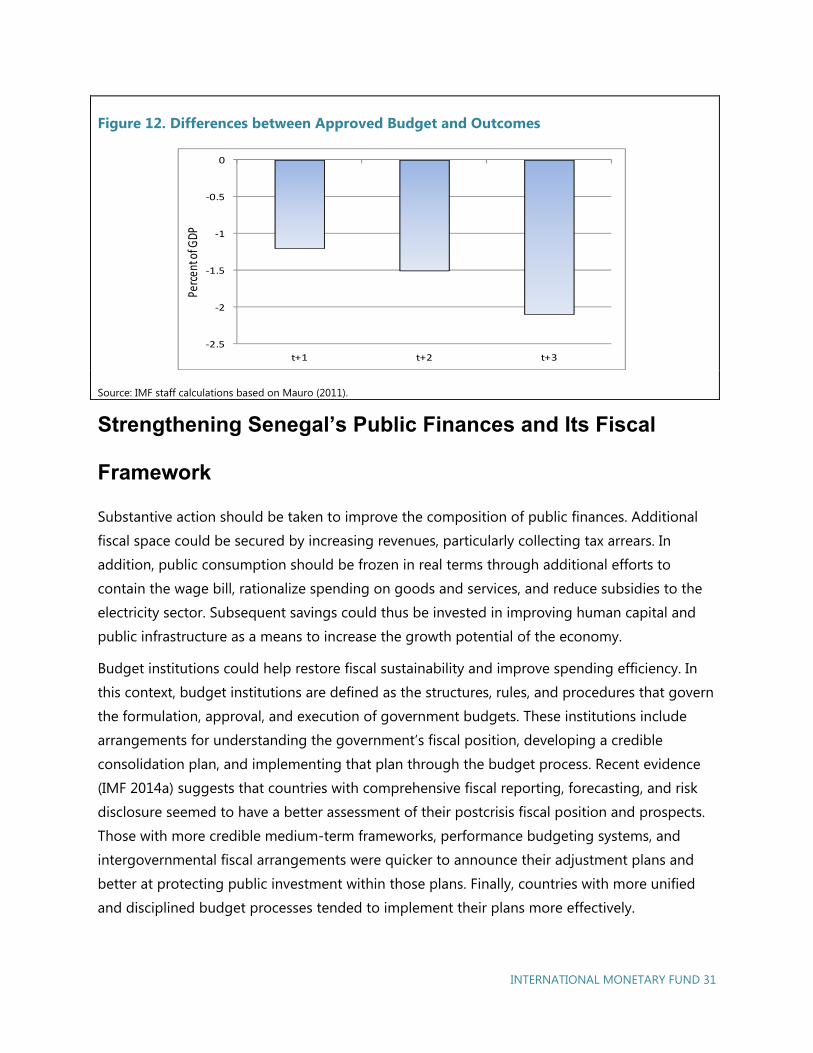
According to Mauro (2011), the average difference between the approved budgets and their
outcomes in Senegal was about –1 percent of GDP until 2010, and the deviation of the primary
balance would reach up to –2 percent of GDP in the subsequent years (Figure 12). This problem
became more pronounced in the recent period between 2010 and 2013. The difference
between program projections at the beginning of every year and actual year-end outcomes has
been especially important in the case of revenues, reaching up to 1.2 percent of GDP in 2013.
These deviations have also been very significant in the case of capital expenditures, reaching
close to 0.7 percent of GDP. To preserve the deficit targets, revenue underperformance has
been systematically offset by reductions in capital expenditures. This is the reverse of what is
necessary to support economic development, which requires investment projects to be
executed in a timely manner to maximize their economic impact. If the PSE is to succeed, such
budget practices will need to be improved to maximize the economic impact of projected
investment.
INTERNATIONAL MONETARY FUND 31
Figure 12. Differences between Approved Budget and Outcomes
Source: IMF staff calculations based on Mauro (2011).
Strengthening Senegal’s Public Finances and Its Fiscal
Framework
Substantive action should be taken to improve the composition of public finances. Additional
fiscal space could be secured by increasing revenues, particularly collecting tax arrears. In
addition, public consumption should be frozen in real terms through additional efforts to
contain the wage bill, rationalize spending on goods and services, and reduce subsidies to the
electricity sector. Subsequent savings could thus be invested in improving human capital and
public infrastructure as a means to increase the growth potential of the economy.
Budget institutions could help restore fiscal sustainability and improve spending efficiency. In
this context, budget institutions are defined as the structures, rules, and procedures that govern
the formulation, approval, and execution of government budgets. These institutions include
arrangements for understanding the government’s fiscal position, developing a credible
consolidation plan, and implementing that plan through the budget process. Recent evidence
(IMF 2014a) suggests that countries with comprehensive fiscal reporting, forecasting, and risk
disclosure seemed to have a better assessment of their postcrisis fiscal position and prospects.
Those with more credible medium-term frameworks, performance budgeting systems, and
intergovernmental fiscal arrangements were quicker to announce their adjustment plans and
better at protecting public investment within those plans. Finally, countries with more unified
and disciplined budget processes tended to implement their plans more effectively.
-2.5
-2
-1.5
-1
-0.5
0
t+1 t+2 t+3
Perc
ent o
f GDP
INTERNATIONAL MONETARY FUND 32
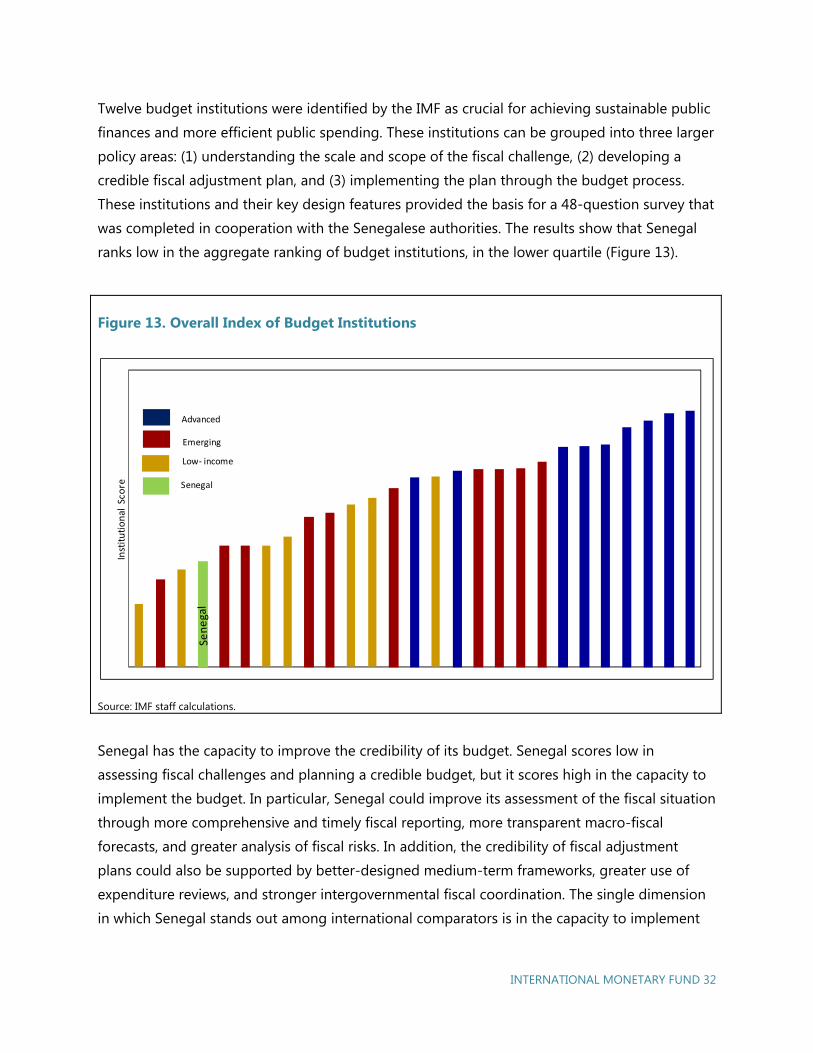
Twelve budget institutions were identified by the IMF as crucial for achieving sustainable public
finances and more efficient public spending. These institutions can be grouped into three larger
policy areas: (1) understanding the scale and scope of the fiscal challenge, (2) developing a
credible fiscal adjustment plan, and (3) implementing the plan through the budget process.
These institutions and their key design features provided the basis for a 48-question survey that
was completed in cooperation with the Senegalese authorities. The results show that Senegal
ranks low in the aggregate ranking of budget institutions, in the lower quartile (Figure 13).
Figure 13. Overall Index of Budget Institutions
Source: IMF staff calculations.
Senegal has the capacity to improve the credibility of its budget. Senegal scores low in
assessing fiscal challenges and planning a credible budget, but it scores high in the capacity to
implement the budget. In particular, Senegal could improve its assessment of the fiscal situation
through more comprehensive and timely fiscal reporting, more transparent macro-fiscal
forecasts, and greater analysis of fiscal risks. In addition, the credibility of fiscal adjustment
plans could also be supported by better-designed medium-term frameworks, greater use of
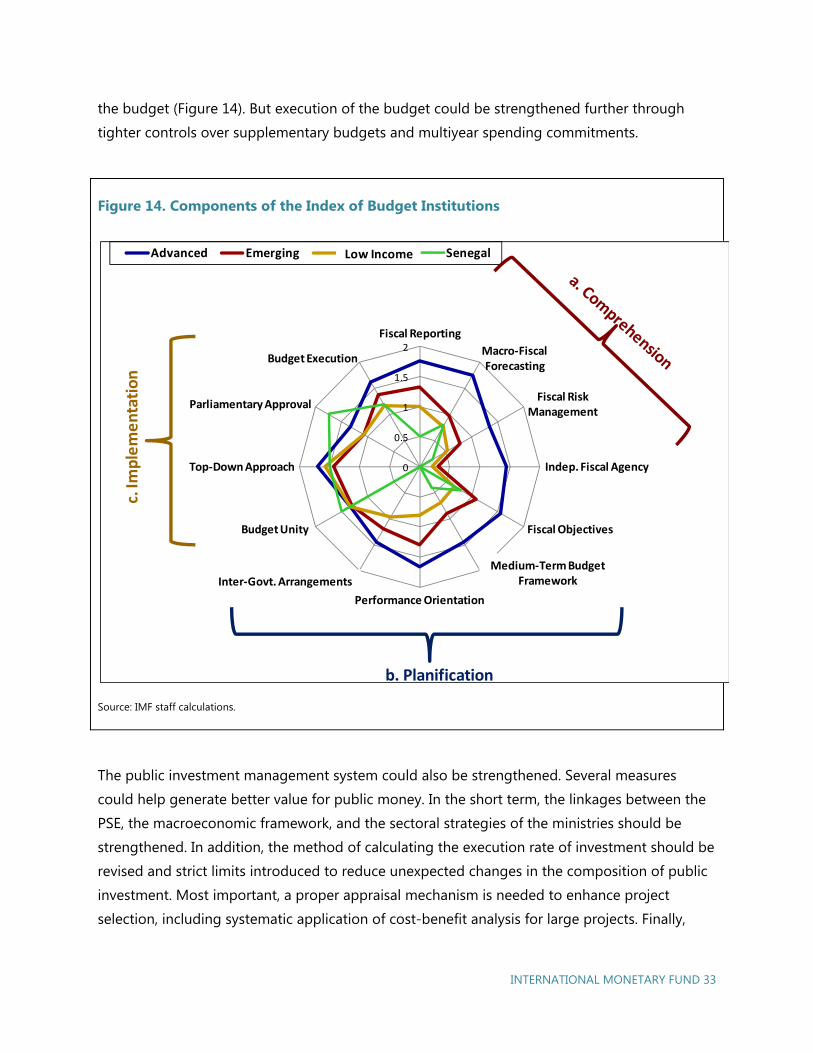
expenditure reviews, and stronger intergovernmental fiscal coordination. The single dimension
in which Senegal stands out among international comparators is in the capacity to implement
Inst
itu
tio
nal
Sco
re
Advanced
Emerging
Low- income
Senegal
INTERNATIONAL MONETARY FUND 33
the budget (Figure 14). But execution of the budget could be strengthened further through
tighter controls over supplementary budgets and multiyear spending commitments.
The public investment management system could also be strengthened. Several measures
could help generate better value for public money. In the short term, the linkages between the
PSE, the macroeconomic framework, and the sectoral strategies of the ministries should be
strengthened. In addition, the method of calculating the execution rate of investment should be
revised and strict limits introduced to reduce unexpected changes in the composition of public
investment. Most important, a proper appraisal mechanism is needed to enhance project
selection, including systematic application of cost-benefit analysis for large projects. Finally,
Figure 14. Components of the Index of Budget Institutions
Source: IMF staff calculations.
0
0.5
1
1.5
2Fiscal Reporting
Macro-FiscalForecasting
Fiscal Risk Management
Indep. Fiscal Agency
Fiscal Objectives
Medium-term Budget Framework
Performance Orientation
Inter-Govt Arrangements
Budget Unity
Top-Down Approach
Parliamentary Approval
Budget Execution
Advanced Emerging Low-Income Senegal
c. Im
ple
me
nta
tio
n
b. Planification
Medium-Term Budget Framework
Low Income
Inter-Govt. Arrangements
INTERNATIONAL MONETARY FUND 34
projects need to be better classified and integrated into a new comprehensive database in
order to enhance the monitoring of new investment.
Conclusions and Recommendations
Fiscal performance should be enhanced to guarantee the sustainability of public finances. The
recent trajectory of fiscal consolidation should continue. Maintaining the commitment to a
medium-term deficit target below 4 percent of GDP is fully compatible with the implementation
of the PSE. Revenues should keep gaining ground once the tax reform has been implemented,
whereas overall expenditures should grow more moderately. The debt-to-GDP ratio should be
kept constant, and new investment projects associated with the PSE should be financed with
additional revenues or with a reallocation of spending.
Improving the composition of the budget could help the PSE succeed. The impact of public
spending on growth depends on the cyclical effect of public consumption in the short term and
the efficiency of public investment in the medium term. In this context, the ongoing
reclassification of spending should continue, because it will help identify areas for potential
savings and which programs should be reinforced. Freezing public consumption by reducing
the growth of the wage bill and cutting unproductive spending is a crucial aspect of the
strategy. Such measures will open up fiscal space needed to finance additional PSE-related
investments. At the same time, the central government should accelerate agency reform, gain
control over transferred funds, and ensure greater alignment of its activities with the objectives
of the PSE.
The quality of public finances could be reinforced through stronger budget institutions. By
improving fiscal data and fiscal reporting, Senegal could ameliorate macro-fiscal forecasting
and reduce fiscal risks. In addition, fiscal objectives should become more realistic and
embedded in a medium-term budget framework fully consistent with PSE objectives. Program-
based budgeting is a crucial reform that would help maximize the economic impact of public
finances. In particular, the reform of the public investment management system should be
geared toward increasing the number of projects that are fully implemented in a timely and
cost-effective manner, especially those related to the PSE. All such actions should be part of a
concerted effort to better link the assessment of fiscal challenges with budget planning and
implementation.
INTERNATIONAL MONETARY FUND 35
External Stability
Gillian Nkhata Senegal has continued to record sizable current account deficits over the past decade, financed
mainly by official flows, but with increasing recourse to private flows. While official West African
Economic and Monetary Union (WAEMU) reserves are currently adequate and Senegal’s exchange
rate shows no significant signs of misalignment, the current account deficit is large, at about 10
percent of GDP, and there are signs of eroding competitiveness. Senegal’s exports have not gained
market share and survey-based indicators continue to point to a need for strong measures to
improve structural competitiveness and the business environment. Debt remains manageable, but
there is little room for higher fiscal deficits or more nonconcessional borrowing if Senegal’s current
low-risk rating is to be preserved. Given these external vulnerabilities, pro-growth fiscal policy
must proceed with caution, especially in the context of a fixed exchange rate, which places almost
all the weight of policy response on the budget.
Current Account and Senegal’s Twin Deficits
Senegal’s main external risk is the current account deficit, which exceeds 10 percent of GDP in
grants are excluded. Over the past decade, the current account deficit has averaged about 8.6
percent of GDP, with overall fiscal balances averaging –4.4 percent of GDP. The current account
deficits have been financed mainly by grants and government borrowing (particularly project
loans). Senegal is also increasingly resorting to nonconcessional commercial borrowing, which
exposes it to shifting donor and market sentiment. Although the deficit is projected to decline
in the long term with fiscal consolidation, it will remain high in the medium term, at more than
8 percent of GDP. The regional nominal effective exchange rate has appreciated by about 6
percent since the first quarter of 2013, mirroring euro appreciation. However, the real effective
exchange rate has appreciated more moderately, by about 4 percent, owing to low inflation. It
remains broadly in line with fundamentals, with Senegal’s investment–savings gap roughly
equally shared by the public and private sector.
3
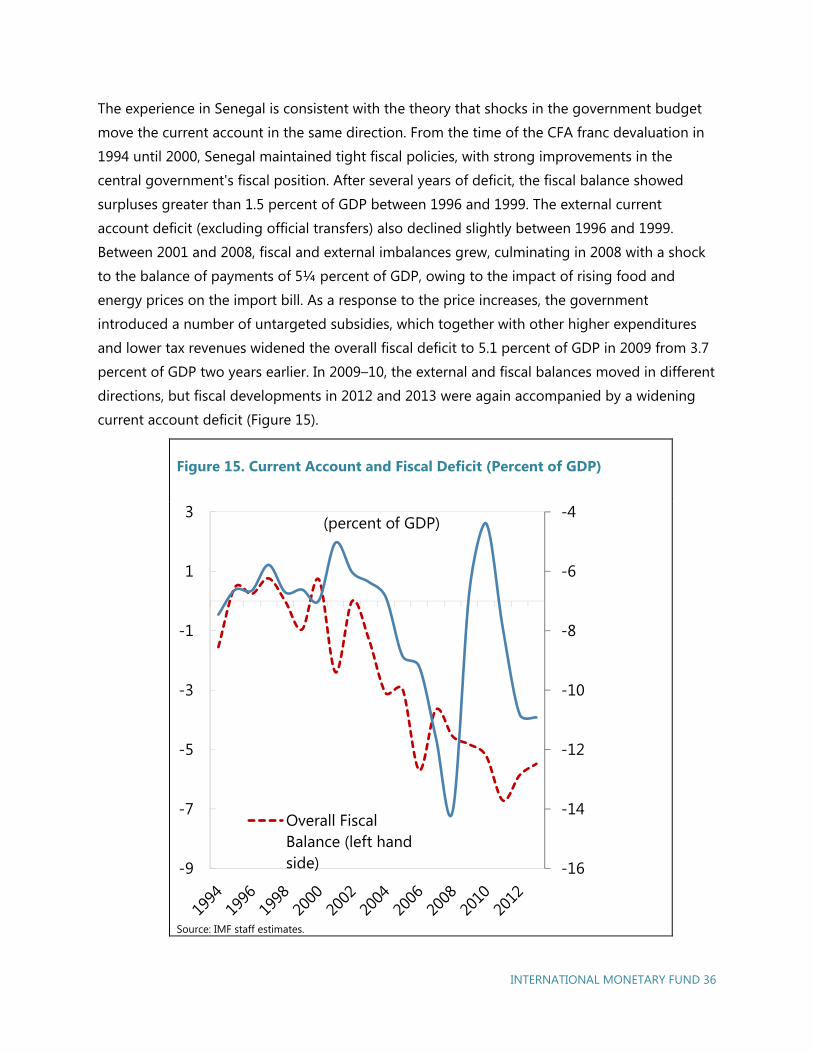
INTERNATIONAL MONETARY FUND 36
The experience in Senegal is consistent with the theory that shocks in the government budget
move the current account in the same direction. From the time of the CFA franc devaluation in
1994 until 2000, Senegal maintained tight fiscal policies, with strong improvements in the
central government's fiscal position. After several years of deficit, the fiscal balance showed
surpluses greater than 1.5 percent of GDP between 1996 and 1999. The external current
account deficit (excluding official transfers) also declined slightly between 1996 and 1999.
Between 2001 and 2008, fiscal and external imbalances grew, culminating in 2008 with a shock
to the balance of payments of 5¼ percent of GDP, owing to the impact of rising food and
energy prices on the import bill. As a response to the price increases, the government
introduced a number of untargeted subsidies, which together with other higher expenditures
and lower tax revenues widened the overall fiscal deficit to 5.1 percent of GDP in 2009 from 3.7
percent of GDP two years earlier. In 2009–10, the external and fiscal balances moved in different
directions, but fiscal developments in 2012 and 2013 were again accompanied by a widening
current account deficit (Figure 15).
Figure 15. Current Account and Fiscal Deficit (Percent of GDP)
Source: IMF staff estimates.
-16
-14
-12
-10
-8
-6
-4
-9
-7
-5
-3
-1
1
3(percent of GDP)
Overall Fiscal Balance (left hand side)
INTERNATIONAL MONETARY FUND 37
The observed correlation between Senegal’s deficits has clear policy implications. The analysis
suggests that for Senegal, excessive deficit spending can result in large external imbalances.
Senegal’s current account deficit will remain high in the medium term, reflecting mainly higher
imports associated with infrastructure projects, although it is projected to decrease in the long
term to about 8 percent of GDP. The low savings, especially in a context of large investment
needs under the Plan Sénégal Emergent (PSE), could mean continued deficits over the medium
term, which may become difficult to finance. This means that budget deficits must remain
contained within reasonable limits, even in an ambitious investment-led strategy. In addition,
fiscal prudence must be accompanied by measures to improve the productivity of public and
private investment. The current weaknesses in public investment management and the business
environment suggest that there is ample scope for substantial gains.
Export Performance
Senegal’s export climate suggests a much greater potential for export growth than has been
realized to date. The country enjoys a favorable geographic location, with a major seaport and
easy access to the large European and North American markets. In addition, it has the benefit of
a stable regional currency and a political environment with democratic institutions. The country
also offers a relatively competitive export framework, including no taxes on exports, low
shipping costs, easy repatriation of capital and income, abundant semiskilled and unskilled
human resources, and a relatively robust telecommunications infrastructure. Senegal is also a
party to a range of agreements that provide it with privileged market access, including bilateral
agreements with several large economies (in particular China and the United States), and is also
signatory to the Cotonou Agreement, which provides (reciprocal) duty-free access to European
Union (EU) markets for African, Caribbean, and Pacific country exports.
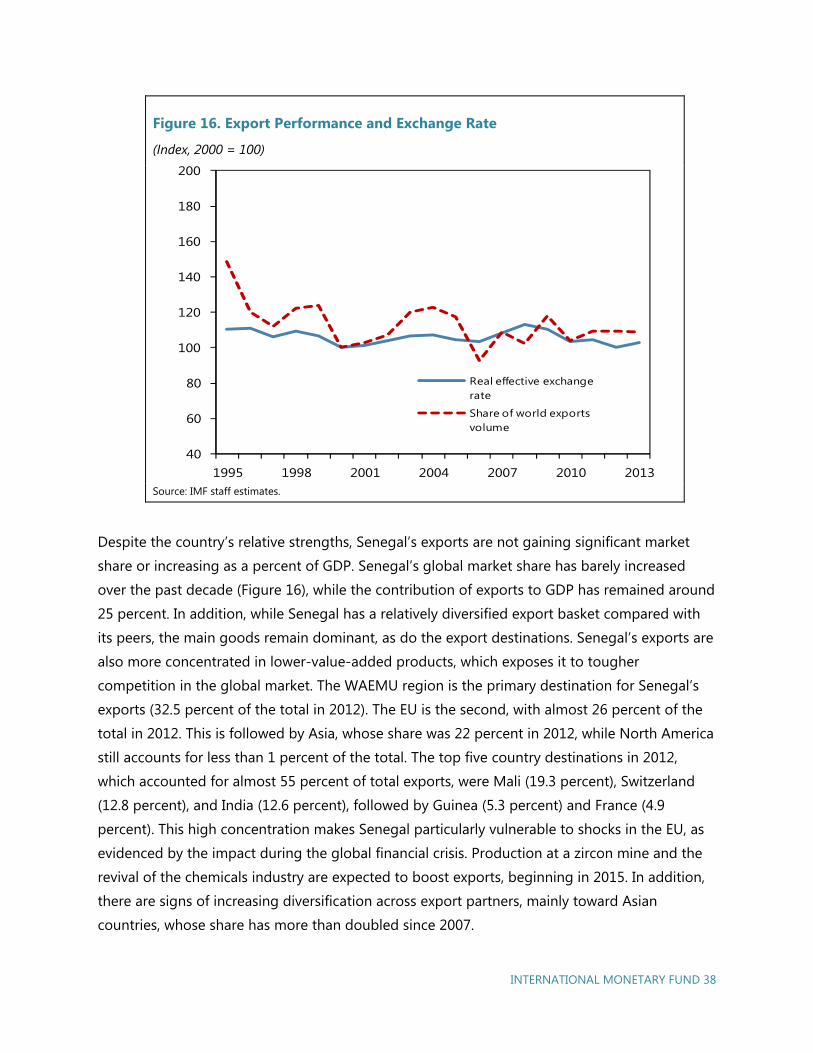
INTERNATIONAL MONETARY FUND 38
Figure 16. Export Performance and Exchange Rate
(Index, 2000 = 100)
Source: IMF staff estimates.
Despite the country’s relative strengths, Senegal’s exports are not gaining significant market
share or increasing as a percent of GDP. Senegal’s global market share has barely increased
over the past decade (Figure 16), while the contribution of exports to GDP has remained around
25 percent. In addition, while Senegal has a relatively diversified export basket compared with
its peers, the main goods remain dominant, as do the export destinations. Senegal’s exports are
also more concentrated in lower-value-added products, which exposes it to tougher
competition in the global market. The WAEMU region is the primary destination for Senegal’s
exports (32.5 percent of the total in 2012). The EU is the second, with almost 26 percent of the
total in 2012. This is followed by Asia, whose share was 22 percent in 2012, while North America
still accounts for less than 1 percent of the total. The top five country destinations in 2012,
which accounted for almost 55 percent of total exports, were Mali (19.3 percent), Switzerland
(12.8 percent), and India (12.6 percent), followed by Guinea (5.3 percent) and France (4.9
percent). This high concentration makes Senegal particularly vulnerable to shocks in the EU, as
evidenced by the impact during the global financial crisis. Production at a zircon mine and the
revival of the chemicals industry are expected to boost exports, beginning in 2015. In addition,
there are signs of increasing diversification across export partners, mainly toward Asian
countries, whose share has more than doubled since 2007.
40
60
80
100
120
140
160
180
200
1995 1998 2001 2004 2007 2010 2013
Real effective exchange rate
Share of world exports volume
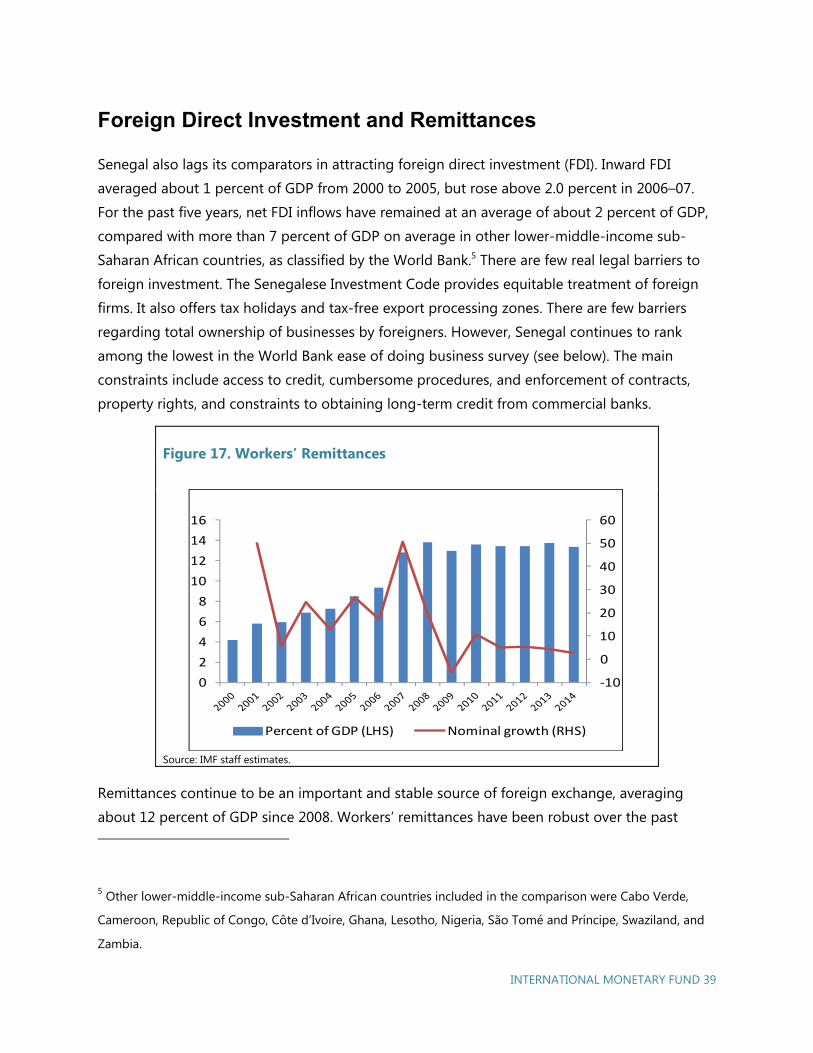
INTERNATIONAL MONETARY FUND 39
Foreign Direct Investment and Remittances
Senegal also lags its comparators in attracting foreign direct investment (FDI). Inward FDI
averaged about 1 percent of GDP from 2000 to 2005, but rose above 2.0 percent in 2006–07.
For the past five years, net FDI inflows have remained at an average of about 2 percent of GDP,
compared with more than 7 percent of GDP on average in other lower-middle-income sub-
Saharan African countries, as classified by the World Bank.5 There are few real legal barriers to
foreign investment. The Senegalese Investment Code provides equitable treatment of foreign
firms. It also offers tax holidays and tax-free export processing zones. There are few barriers
regarding total ownership of businesses by foreigners. However, Senegal continues to rank
among the lowest in the World Bank ease of doing business survey (see below). The main
constraints include access to credit, cumbersome procedures, and enforcement of contracts,
property rights, and constraints to obtaining long-term credit from commercial banks.
Remittances continue to be an important and stable source of foreign exchange, averaging
about 12 percent of GDP since 2008. Workers’ remittances have been robust over the past 5 Other lower-middle-income sub-Saharan African countries included in the comparison were Cabo Verde,
Cameroon, Republic of Congo, Côte d’Ivoire, Ghana, Lesotho, Nigeria, São Tomé and Príncipe, Swaziland, and
Zambia.
Figure 17. Workers’ Remittances
Source: IMF staff estimates.
-10
0
10
20
30
40
50
60
0
2
4
6
8
10
12
14
16
Percent of GDP (LHS) Nominal growth (RHS)
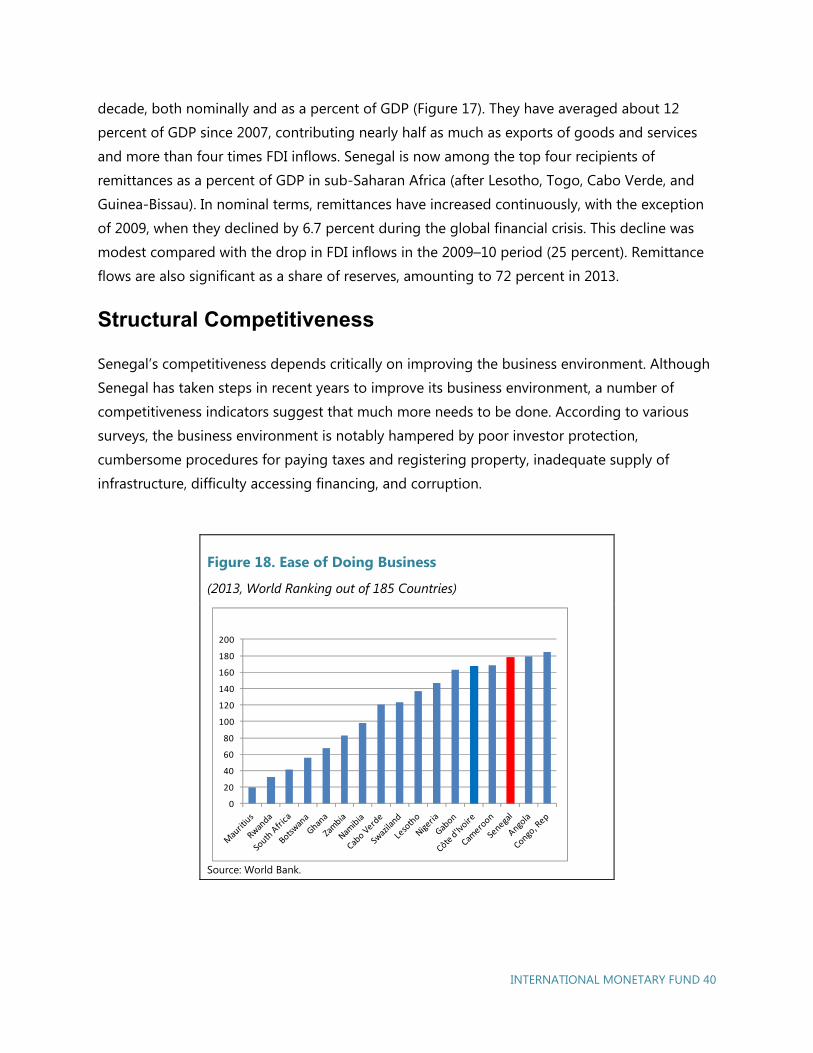
INTERNATIONAL MONETARY FUND 40
decade, both nominally and as a percent of GDP (Figure 17). They have averaged about 12
percent of GDP since 2007, contributing nearly half as much as exports of goods and services
and more than four times FDI inflows. Senegal is now among the top four recipients of
remittances as a percent of GDP in sub-Saharan Africa (after Lesotho, Togo, Cabo Verde, and
Guinea-Bissau). In nominal terms, remittances have increased continuously, with the exception
of 2009, when they declined by 6.7 percent during the global financial crisis. This decline was
modest compared with the drop in FDI inflows in the 2009–10 period (25 percent). Remittance
flows are also significant as a share of reserves, amounting to 72 percent in 2013.
Structural Competitiveness
Senegal’s competitiveness depends critically on improving the business environment. Although
Senegal has taken steps in recent years to improve its business environment, a number of
competitiveness indicators suggest that much more needs to be done. According to various
surveys, the business environment is notably hampered by poor investor protection,
cumbersome procedures for paying taxes and registering property, inadequate supply of
infrastructure, difficulty accessing financing, and corruption.
Figure 18. Ease of Doing Business
(2013, World Ranking out of 185 Countries)
Source: World Bank.
0
20
40
60
80
100
120
140
160
180
200
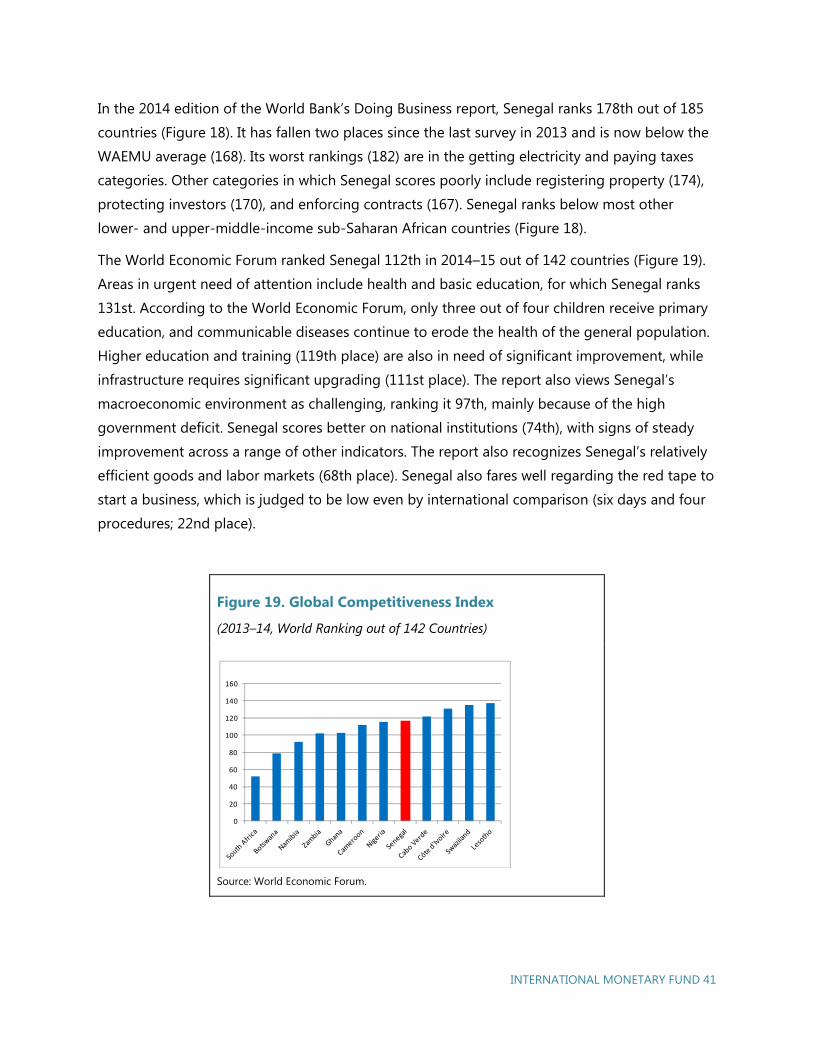
INTERNATIONAL MONETARY FUND 41
In the 2014 edition of the World Bank’s Doing Business report, Senegal ranks 178th out of 185
countries (Figure 18). It has fallen two places since the last survey in 2013 and is now below the
WAEMU average (168). Its worst rankings (182) are in the getting electricity and paying taxes
categories. Other categories in which Senegal scores poorly include registering property (174),
protecting investors (170), and enforcing contracts (167). Senegal ranks below most other
lower- and upper-middle-income sub-Saharan African countries (Figure 18).
The World Economic Forum ranked Senegal 112th in 2014–15 out of 142 countries (Figure 19).
Areas in urgent need of attention include health and basic education, for which Senegal ranks
131st. According to the World Economic Forum, only three out of four children receive primary
education, and communicable diseases continue to erode the health of the general population.
Higher education and training (119th place) are also in need of significant improvement, while
infrastructure requires significant upgrading (111st place). The report also views Senegal’s
macroeconomic environment as challenging, ranking it 97th, mainly because of the high
government deficit. Senegal scores better on national institutions (74th), with signs of steady
improvement across a range of other indicators. The report also recognizes Senegal’s relatively
efficient goods and labor markets (68th place). Senegal also fares well regarding the red tape to
start a business, which is judged to be low even by international comparison (six days and four
procedures; 22nd place).
Figure 19. Global Competitiveness Index
(2013–14, World Ranking out of 142 Countries)
Source: World Economic Forum.
0
20
40
60
80
100
120
140
160
INTERNATIONAL MONETARY FUND 42
Senegal’s government effectiveness, as measured by the World Bank’s Governance Indicators, is
slightly below average compared with lower- and upper-middle-income sub-Saharan countries
and has been trending downward over the past decade. By several measures, corruption
remains a problem. The World Economic Forum identifies corruption as the second most
problematic factor for doing business in Senegal. Transparency International ranks Senegal
112th out of 182 countries in its 2011 Corruption Perception Index. Based on the World Bank’s
World Governance Indicators, corruption in Senegal is worse than the average for lower- and
upper-middle-income sub-Saharan countries.
Price Competitiveness
The assessment of real effective exchange rate (REER) at the regional level does not suggest any
significant price-competitiveness issues. The REER was assessed using three complementary
methodologies developed by the Consultative Group on Exchange Rates (CGER). Although the
regional nominal effective exchange rate appreciated by about 4.6 percent from the beginning
of 2013, reflecting the euro appreciation, the real exchange rates appreciated only by 2.5
percent, owing to moderate inflation developments in the region. Senegal experienced a
moderate REER increase (by about 4 percent), but model-based assessments do not point to
significant misalignment of the REER.
Macroeconomic Balance Approach
The macroeconomic balance approach calculates the difference between the current account
balance projected over the medium term (the “underlying” current account) and an estimated
current account “norm” based on projected values of medium-term economic fundamentals.
The exchange rate adjustment that would eliminate this difference over the medium term is
then calculated using an estimated elasticity of the current account with respect to the real
exchange rate. Senegal’s current account norm is calculated to be between –5.6 and –6.5
percent of GDP, based on coefficients estimated by Vitek (2012) and Ricci and others (2008).
Assuming a trade balance elasticity of –0.71 for small countries, the difference between the
underlying current account and the current account norm indicates a possible REER
misalignment between –4.2 percent and 0.0 percent (see Tokarick 2010).
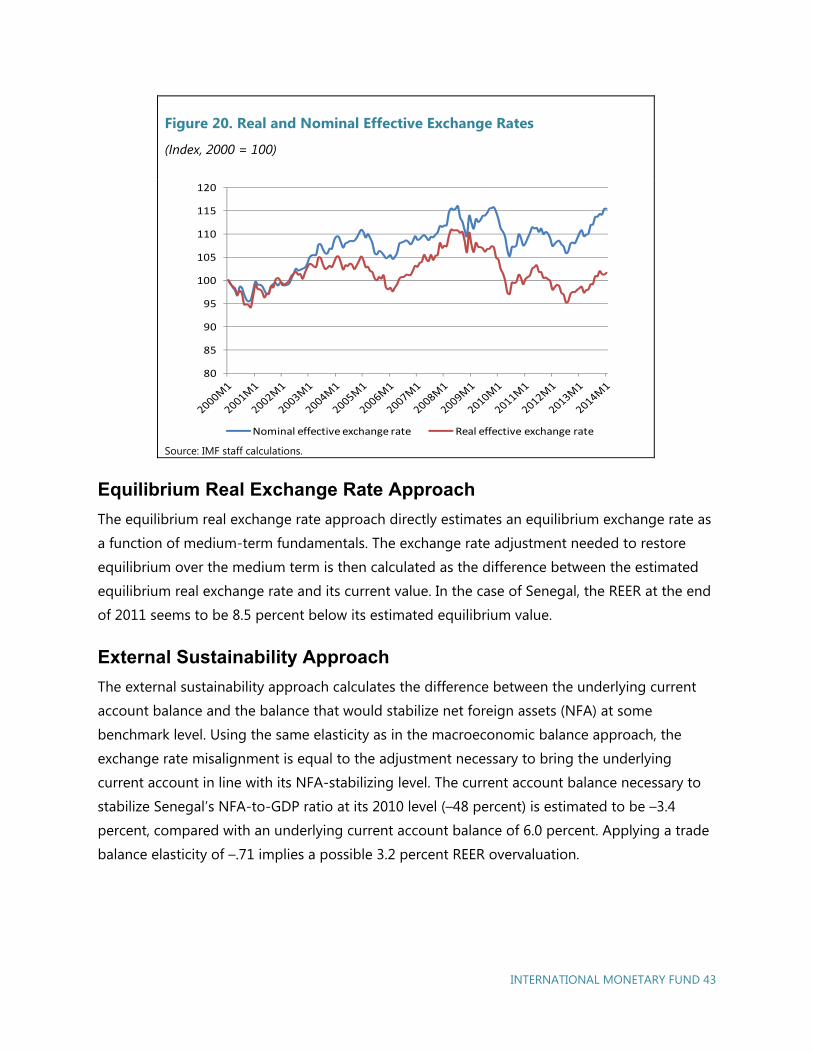
INTERNATIONAL MONETARY FUND 43
Figure 20. Real and Nominal Effective Exchange Rates
(Index, 2000 = 100)
Source: IMF staff calculations.
Equilibrium Real Exchange Rate Approach
The equilibrium real exchange rate approach directly estimates an equilibrium exchange rate as
a function of medium-term fundamentals. The exchange rate adjustment needed to restore
equilibrium over the medium term is then calculated as the difference between the estimated
equilibrium real exchange rate and its current value. In the case of Senegal, the REER at the end
of 2011 seems to be 8.5 percent below its estimated equilibrium value.
External Sustainability Approach
The external sustainability approach calculates the difference between the underlying current
account balance and the balance that would stabilize net foreign assets (NFA) at some
benchmark level. Using the same elasticity as in the macroeconomic balance approach, the
exchange rate misalignment is equal to the adjustment necessary to bring the underlying
current account in line with its NFA-stabilizing level. The current account balance necessary to
stabilize Senegal’s NFA-to-GDP ratio at its 2010 level (–48 percent) is estimated to be –3.4
percent, compared with an underlying current account balance of 6.0 percent. Applying a trade
balance elasticity of –.71 implies a possible 3.2 percent REER overvaluation.
80
85
90
95
100
105
110
115
120
Nominal effective exchange rate Real effective exchange rate
INTERNATIONAL MONETARY FUND 44
Reserve Adequacy
Official reserves coverage appears adequate by traditional metrics. Reserves are pooled among
WAEMU countries; therefore, reserve adequacy must be assessed at the regional level. Regional
official reserves are projected to decrease from CFAF 7,051 billion (US$13.8 billion) at the end of
2012 to CFAF 6,886 billion (US$13.9 billion) at the end of 2013. Reserves coverage remains
adequate at 4.7 months of next-year imports, 50 percent of broad money, and about 91 percent
of short-term liabilities. An alternative analysis based on cost–benefit analysis (Dabla-Norris and
others 2011) indicates that the reserves level is at the low end of the optimal reserves range,
which varies between 5 and 10 months of imports depending on the interest rate differential
with the rest of the world.
Debt-Related Risks
Both total public debt and external debt ratios have increased substantially over the past five
years. In Senegal, the ratio of total public debt to GDP amounted to about 47 percent in 2013,
up from about 25 percent in 2008. At the same time, the stock of total external public and
publicly guaranteed debt has increased from about 20 percent of GDP in 2008 to just over 32
percent at the end of 2013. These levels are close to those that prevailed before Senegal
benefited from debt relief under the Multilateral Debt Relief Initiative in 2006. Debt-servicing
costs have also increased, reflecting higher recourse to market financing. External public debt
service increased from 4.3 percent of exports in 2008 to about 9 percent in 2013.
In terms of composition, the bulk of Senegal’s public debt remains largely external and
provided on concessional terms, but the use of financial market instruments is increasing.6 Most
of the public debt is external (that is, owed to non-WAEMU residents); however, the share of
domestic debt to GDP increased from 5.3 percent in 2008 to about 16 percent in 2013.7 Almost
two-thirds of Senegal’s external debt is owed to multilateral creditors—primarily the World
Bank and the African Development Bank. The largest groups of bilateral creditors are the
Organisation for Economic Co-operation and Development and certain Arab countries. The
share of market debt is still relatively small, although it has grown rapidly over the past few
years with the issuance of two Eurobonds in 2009 and 2011 and the contracting of a syndicated
6 Public debt refers to the debt of the central government. 7 Domestic debt includes debt issued in the WAEMU financial market.
INTERNATIONAL MONETARY FUND 45
loan in 2013, which includes a tranche in euro-targeting nonresidents. The authorities
postponed a planned Eurobond issuance in 2013, following sharp tightening of financial
conditions in international markets during the year. They then issued a US$500 million
Eurobond in mid-2014. Conditions have been relatively favorable in international markets
throughout the second part of 2014, and the authorities got a rate of 6.25 percent, a little
higher than the 6 percent yield on the 2011 Eurobond. This rate was higher than expected at
the time of the previous debt sustainability analysis (DSA), partly owing to market concerns
about the slow pace of reform, but more favorable than might have been achieved in 2013.
However, part of the proceeds was used to repay the euro tranche of the syndicated loan
contracted in 2013, which has a shorter maturity and higher rate (6.5 percent).
Private external debt has averaged about 20 percent of GDP over the past decade and was
estimated at about 36 percent of GDP at the end of 2013. 8 About half of this debt was in the
form of trade credits and bank deposits; the rest consisted of debt securities, loans, and other
liabilities. This exposure was partly offset by private external assets amounting to 8 percent of
GDP.
Senegal remains at a low risk of debt distress. Under the baseline scenario, which is consistent
with higher program ceilings for nonconcessional and semiconcessional borrowing, all the debt
burden indicators remain below their policy-dependent indicative thresholds, and debt ratios in
present value terms are lower than in the previous DSA. Policy-dependent thresholds were
increased as Senegal was reclassified as a “strong” performer based on a higher average World
Bank Country Policy and Institutional Assessment (CPIA) score in 2011–13.9 The probability
approach also shows a more favorable outlook. The stress tests result in two spikes in the debt-
service-to-revenue ratio, corresponding to the repayment of two Eurobonds, which result in a
small and temporary breach of the threshold. The DSA, however, suggests that there is not
much space for higher fiscal deficits if the low-risk rating is to be preserved. It also indicates a
need for caution in resorting to nonconcessional borrowing.
8 Estimates of private sector external debt are based on Central Bank of West African States data on the
international investment position. 9 Senegal’s CPIA score was 3.825 in 2013 and 3.81 on average during 2011–13. Under the debt sustainability
framework rules, this corresponds to a “strong” performance.
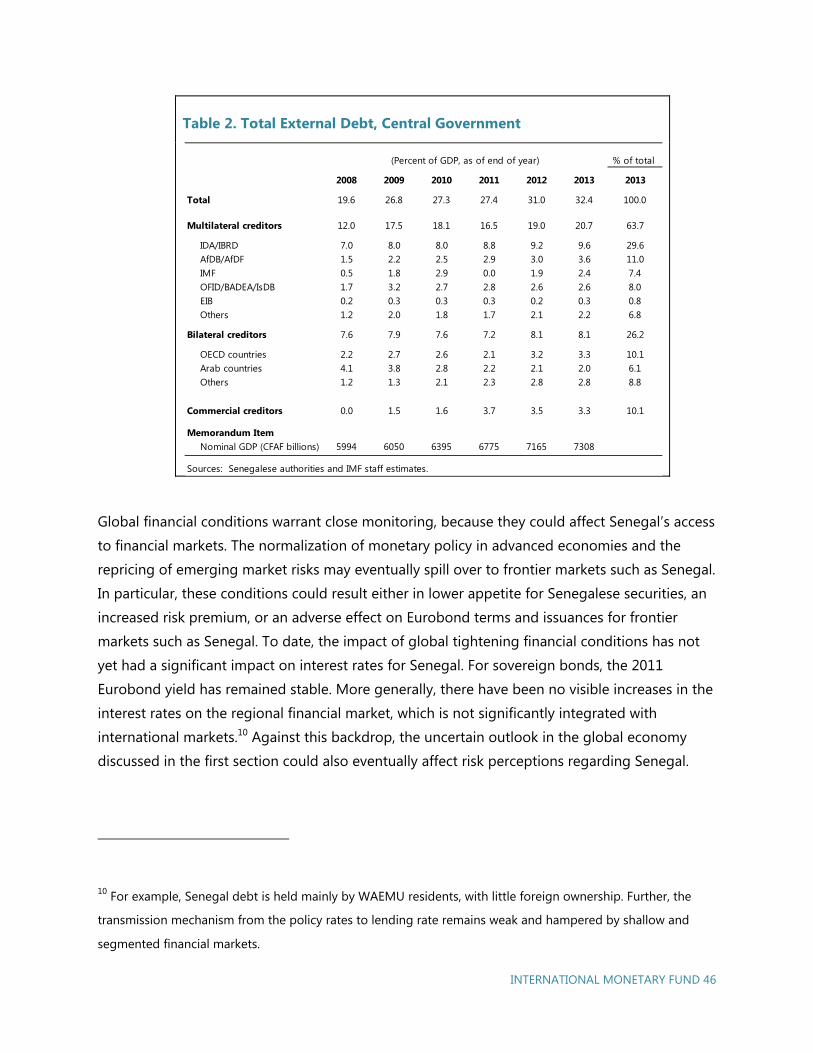
INTERNATIONAL MONETARY FUND 46
Table 2. Total External Debt, Central Government
Global financial conditions warrant close monitoring, because they could affect Senegal’s access
to financial markets. The normalization of monetary policy in advanced economies and the
repricing of emerging market risks may eventually spill over to frontier markets such as Senegal.
In particular, these conditions could result either in lower appetite for Senegalese securities, an
increased risk premium, or an adverse effect on Eurobond terms and issuances for frontier
markets such as Senegal. To date, the impact of global tightening financial conditions has not
yet had a significant impact on interest rates for Senegal. For sovereign bonds, the 2011
Eurobond yield has remained stable. More generally, there have been no visible increases in the
interest rates on the regional financial market, which is not significantly integrated with
international markets.10 Against this backdrop, the uncertain outlook in the global economy
discussed in the first section could also eventually affect risk perceptions regarding Senegal.
10 For example, Senegal debt is held mainly by WAEMU residents, with little foreign ownership. Further, the
transmission mechanism from the policy rates to lending rate remains weak and hampered by shallow and
segmented financial markets.
% of total
2008 2009 2010 2011 2012 2013 2013
Total 19.6 26.8 27.3 27.4 31.0 32.4 100.0
Multilateral creditors 12.0 17.5 18.1 16.5 19.0 20.7 63.7
IDA/IBRD 7.0 8.0 8.0 8.8 9.2 9.6 29.6AfDB/AfDF 1.5 2.2 2.5 2.9 3.0 3.6 11.0IMF 0.5 1.8 2.9 0.0 1.9 2.4 7.4OFID/BADEA/IsDB 1.7 3.2 2.7 2.8 2.6 2.6 8.0EIB 0.2 0.3 0.3 0.3 0.2 0.3 0.8Others 1.2 2.0 1.8 1.7 2.1 2.2 6.8
Bilateral creditors 7.6 7.9 7.6 7.2 8.1 8.1 26.2
OECD countries 2.2 2.7 2.6 2.1 3.2 3.3 10.1Arab countries 4.1 3.8 2.8 2.2 2.1 2.0 6.1Others 1.2 1.3 2.1 2.3 2.8 2.8 8.8
Commercial creditors 0.0 1.5 1.6 3.7 3.5 3.3 10.1
Memorandum ItemNominal GDP (CFAF billions) 5994 6050 6395 6775 7165 7308
Sources: Senegalese authorities and IMF staff estimates.
(Percent of GDP, as of end of year)
INTERNATIONAL MONETARY FUND 47
Reforms to Achieve Higher Exports
Senegal is well positioned to become a primary trade hub for West Africa, but more is needed
to achieve the export growth required to reach the PSE objectives. Senegal has several
competitive advantages: political stability, government commitment, good road networks, a
major port, and a competitive exchange rate arrangement. It is also one of the most
industrialized countries in the region, with favorable investment ratings.11 However, experiences
in other countries suggest that even though access to international markets and a competitive
price environment are crucial, Senegal would be better able to leverage its advantages if it
improved significantly its structural competitiveness and macroeconomic environment. This
would imply action on several fronts.
Maintain sound and credible macroeconomic policies. With Senegal in a currency union and a
regional exchange rate broadly in line with fundamentals, fiscal policy and structural
measures are the only levers available to boost competitiveness. Changing the equation will
require strong actions to increase net national saving by reducing fiscal deficits and
stimulating household saving. Sound fiscal policies will provide the government with greater
freedom to implement policies to boost exports. Credible policies overall will attract the
type of investment needed to develop a more diversified and upgraded export basket.
Boost foreign direct investment inflows. Empirical evidence suggests that FDI can enhance
export performance, in particular, by introducing innovations and transforming the
composition of exports (China, Singapore). It also shows that the impact of FDI on export
growth varies with the development of the export sector. The impact is strongest at the
earliest and the most advanced stages, with a lower impact in between.12 Senegal already
has a good legal framework for encouraging investment, but it needs to pay greater
attention to the consistency of the investments with its broader PSE objectives and policies
in mind (for example, the upgrading of export quality and skills/technology transfer).
Promote export-friendly institutions. Institutions are crucial, but experience elsewhere seems
to suggest that institutions matter more at higher levels of export performance. Improved
institutions will help Senegal overcome some of the main constraints to doing business,
11 Senegal’s Standard & Poor’s credit rating is B+; Moody’s rating for Senegal’s sovereign debt is B1. 12 Studies show a U-shaped distribution, which is strong at the outset, weakens as export development
advances, and becomes stronger again at later stages of export development.
INTERNATIONAL MONETARY FUND 48
such as credit access to would-be investors, cumbersome procedures, enforcement of
contracts, property rights, and constraints in obtaining long-term credit from commercial
banks. Better institutions should foster more efficient administration, which is important for
the country’s competitiveness. Senegal needs to persevere in its efforts to work with
development partners in these areas.
Develop infrastructure. Export performance depends critically on physical infrastructure
(roads, ports, energy, and telecommunications). Senegal’s PSE accords draw significant
attention to infrastructure investments, with ambitious programs to modernize the port of
Dakar, build a new international airport—which is expected to handle two times the capacity
of the current one—and improve the road network.
Boost human capital development and productivity. Public investment should also be
devoted to increasing the availability and quality of human capital and appropriate use of
technology.
INTERNATIONAL MONETARY FUND 49
Growth, Structural
Transformation, and Export
Diversification
Monique Newiak
The Plan Sénégal Emergent (PSE) envisages boosting economic growth through a large scale-up
of investment and structural transformation. This chapter examines these goals against the
backdrop of Senegal’s historical growth performance with respect to three main areas: (1) total
factor productivity, (2) export diversification and quality, and (3) perceived constraints in the
informal sector. It finds that in order to yield growth gains, additional capital increases need to be
accompanied by increases in total factor productivity, investment in human capital, and broader
financial inclusion. Diversification would benefit growth and stability mainly through increases in
the shares of the existing product base, which are complemented by increases in product quality.
Growth in Senegal has been modest, with relatively high volatility compared with benchmark
cases (Figure 21). Real GDP growth amounted to less than 4 percent a year on average over the
past 20 years, far below a group of fast-growing sub-Saharan countries that succeeded in
almost quadrupling real GDP over the same time horizon. Real GDP per capita has grown
slowly, outperformed by several multiples by regional and non-regional benchmarks. The
volatility of growth, however, was in line with the average in the sub-Saharan region, and driven
mainly by large fluctuations in agricultural production, not sufficiently smoothed by other
sectors.
This section examines Senegal’s growth performance against the backdrop of three areas of
relevance for the PSE:
Growth decomposition: Total factor productivity (TFP) and human capital are highlighted as
constraints from the production side, with the manufacturing, wholesale, and agricultural
sectors experiencing particular problems in this area. Capital’s relative size and contribution
4
INTERNATIONAL MONETARY FUND 50
to growth is shown to be high compared with other countries. Consequently, increases in
investment volume should be accompanied by efficiency increases to yield growth
dividends.
Export diversification and quality: Senegal has made strong progress in the diversification of
its export product and partner base over the past decades, but additional diversification
could yield significant growth and stability gains, especially if complemented by
improvements in export quality, which still lags far behind benchmark countries. Increasing
the shares of products of comparatively high quality could boost growth but will require
investment in human capital and institutions.
Informality: In addition to the constraints described above, a recent informal business survey
points to limited access to finance and limited education as major structural problems in the
informal sector.
Factor Inputs
Low factor productivity has moderated growth in several sectors (Figure 22). A growth
decomposition exercise shows that growth was driven mainly by capital growth, and human
capital development and TFP growth had, respectively, a modest and even negative effect. A
sectoral composition of TFP reveals that its unfavorable contribution has been driven mainly by
wholesale and retail trade, manufacturing, and agriculture; mining, construction, and service
contributed positively to TFP growth. Similar conclusions can be drawn from a decomposition
of labor productivity, which benefited, on average, only modestly from increases in human
capital and TFP increases over the past decade.
With productivity the main constraint, policies targeting higher growth should therefore focus
on increasing efficiency and developing human capital. The results indicate that additional
increases in investment volumes may not result in desired growth gains if they are not
accompanied by gains in productivity. Given low public investment management scores,
improving the quality of investment and efficiency of the public investment management
system will be important. For example, enhancing project evaluation through ex ante cost-
benefit analysis and alignment of the project evaluation cycle with the annual budget process
can bring about such improvement (Figure 22, lower left panel). Given that 93 percent of public
primary and secondary education spending represents personnel costs (of which 28 percent is
paid to nonteaching staff), improvements to human resource management—including better
systems and controls at the central level—will be necessary to leave more room for classroom
supplies, textbooks, and teacher training. Finally, improvements to the business environment
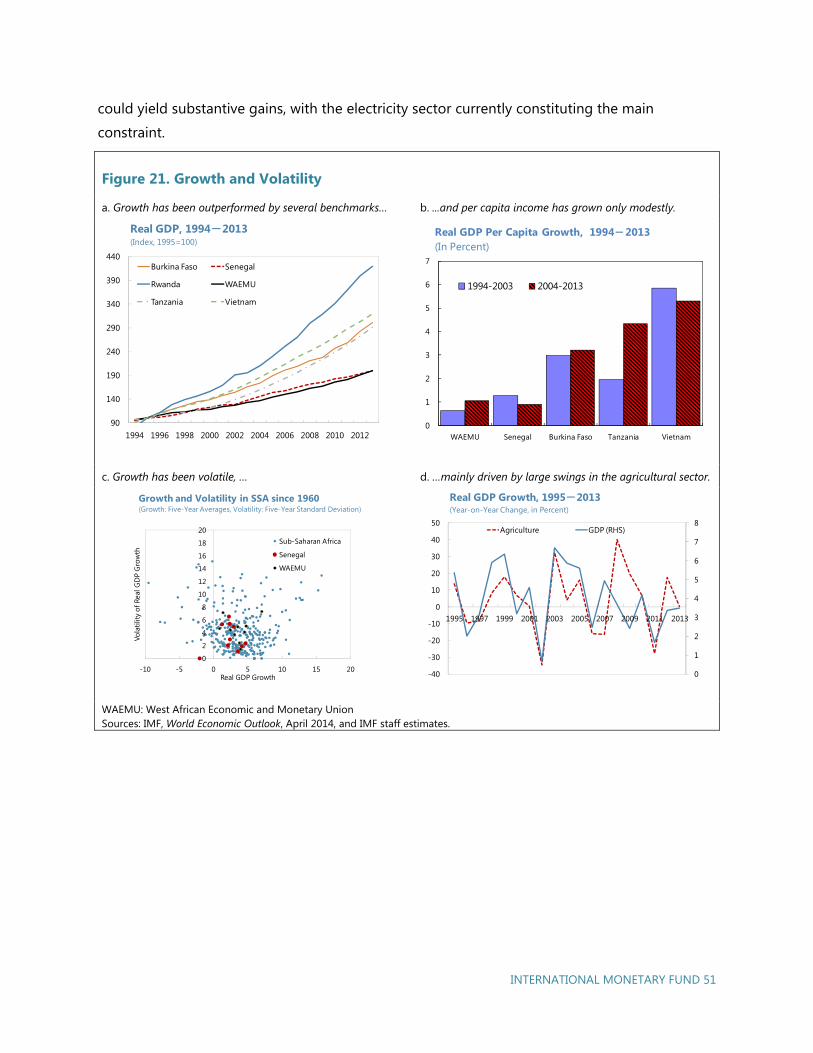
INTERNATIONAL MONETARY FUND 51
could yield substantive gains, with the electricity sector currently constituting the main
constraint.
Figure 21. Growth and Volatility
a. Growth has been outperformed by several benchmarks… b. ...and per capita income has grown only modestly.
c. Growth has been volatile, … d. …mainly driven by large swings in the agricultural sector.
WAEMU: West African Economic and Monetary Union Sources: IMF, World Economic Outlook, April 2014, and IMF staff estimates.
0
2
4
6
8
10
12
14
16
18
20
-10 -5 0 5 10 15 20
Vola
tility
of R
eal G
DP
Gro
wth
Real GDP Growth
Sub-Saharan Africa
Senegal
WAEMU
Growth and Volatility in SSA since 1960(Growth: Five-Year Averages, Volatility: Five-Year Standard Deviation)
90
140
190
240
290
340
390
440
1994 1996 1998 2000 2002 2004 2006 2008 2010 2012
Burkina Faso Senegal
Rwanda WAEMU
Tanzania Vietnam
Real GDP, 1994-2013(Index, 1995=100)
0
1
2
3
4
5
6
7
WAEMU Senegal Burkina Faso Tanzania Vietnam
1994-2003 2004-2013
Real GDP Per Capita Growth, 1994-2013(In Percent)
0
1
2
3
4
5
6
7
8
-40
-30
-20
-10
0
10
20
30
40
50
1995 1997 1999 2001 2003 2005 2007 2009 2011 2013
Agriculture GDP (RHS)
Real GDP Growth, 1995-2013(Year-on-Year Change, in Percent)
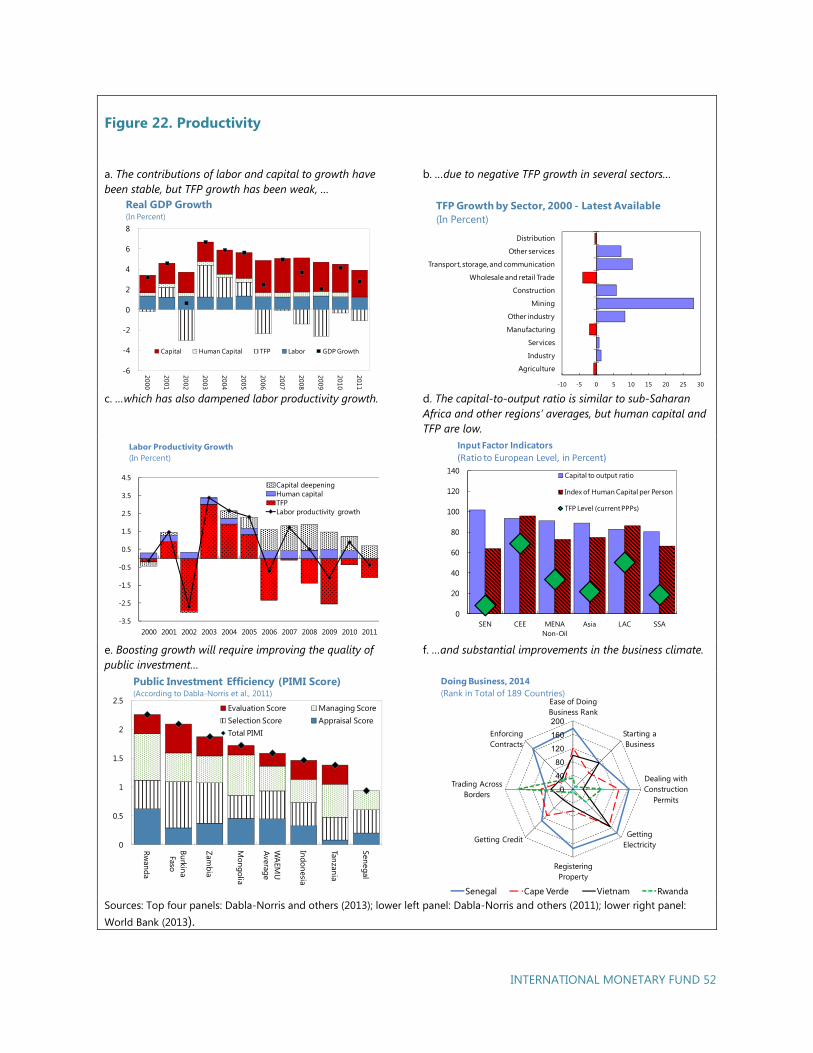
INTERNATIONAL MONETARY FUND 52
Figure 22. Productivity
a. The contributions of labor and capital to growth havebeen stable, but TFP growth has been weak, …
b. …due to negative TFP growth in several sectors…
c. …which has also dampened labor productivity growth. d. The capital-to-output ratio is similar to sub-SaharanAfrica and other regions’ averages, but human capital and TFP are low.
e. Boosting growth will require improving the quality ofpublic investment…
f. …and substantial improvements in the business climate.
Sources: Top four panels: Dabla-Norris and others (2013); lower left panel: Dabla-Norris and others (2011); lower right panel: World Bank (2013).
-6
-4
-2
0
2
4
6
8
2000
2001
2002
2003
2004
2005
2006
2007
2008
2009
2010
2011
Capital Human Capital TFP Labor GDP Growth
Real GDP Growth(In Percent)
-10 -5 0 5 10 15 20 25 30
Agriculture
Industry
Services
Manufacturing
Other industry
Mining
Construction
Wholesale and retail Trade
Transport, storage, and communication
Other services
Distribution
TFP Growth by Sector, 2000 - Latest Available(In Percent)
-3.5
-2.5
-1.5
-0.5
0.5
1.5
2.5
3.5
4.5
2000 2001 2002 2003 2004 2005 2006 2007 2008 2009 2010 2011
Capital deepening Human capital TFPLabor productivity growth
Labor Productivity Growth(In Percent)
0
20
40
60
80
100
120
140
SEN CEE MENA Non-Oil
Asia LAC SSA
Capital to output ratio
Index of Human Capital per Person
TFP Level (current PPPs)
Input Factor Indicators(Ratio to European Level, in Percent)
0
0.5
1
1.5
2
2.5
Rwanda
Burkina Faso
Zambia
Mongolia
WA
EMU
Average
Indonesia
Tanzania
Senegal
Evaluation Score Managing ScoreSelection Score Appraisal ScoreTotal PIMI
Public Investment Efficiency (PIMI Score)(According to Dabla-Norris et al., 2011)
0
40
80
120
160
200
Ease of Doing Business Rank
Starting a Business
Dealing with Construction
Permits
Getting Electricity
Registering Property
Getting Credit
Trading Across Borders
Enforcing Contracts
Senegal Cape Verde Vietnam Rwanda
Doing Business, 2014(Rank in Total of 189 Countries)
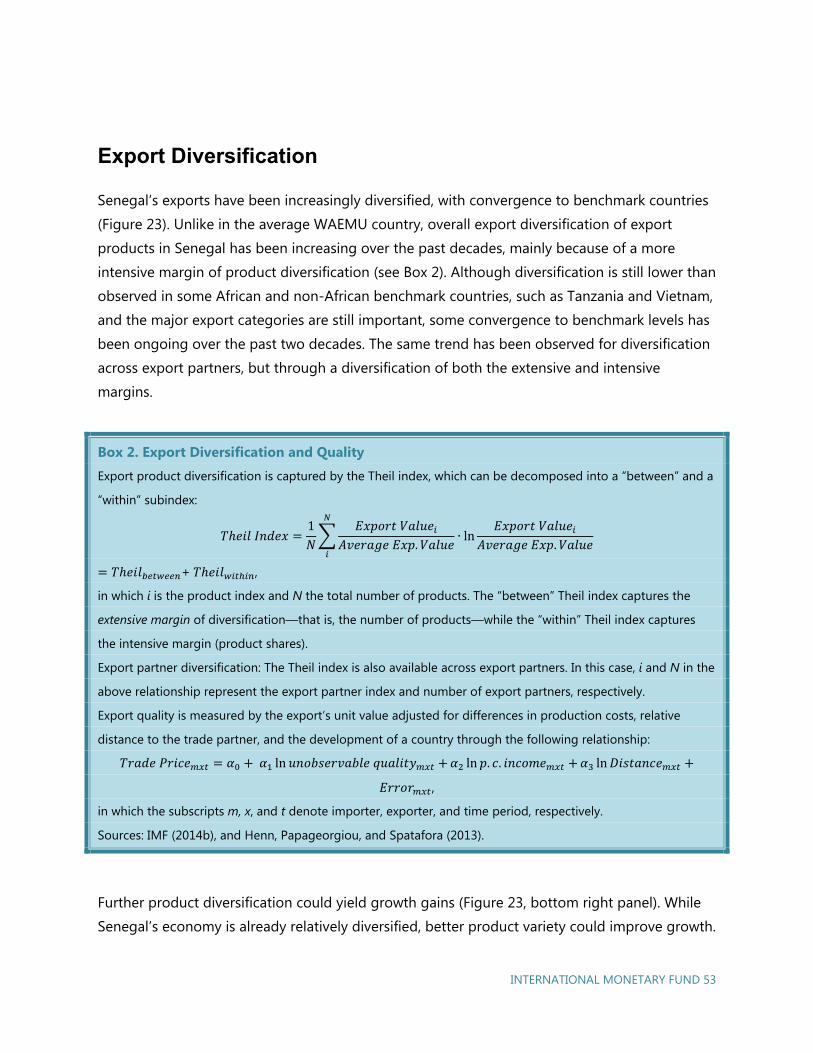
INTERNATIONAL MONETARY FUND 53
Export Diversification
Senegal’s exports have been increasingly diversified, with convergence to benchmark countries
(Figure 23). Unlike in the average WAEMU country, overall export diversification of export
products in Senegal has been increasing over the past decades, mainly because of a more
intensive margin of product diversification (see Box 2). Although diversification is still lower than
observed in some African and non-African benchmark countries, such as Tanzania and Vietnam,
and the major export categories are still important, some convergence to benchmark levels has
been ongoing over the past two decades. The same trend has been observed for diversification
across export partners, but through a diversification of both the extensive and intensive
margins.
Box 2. Export Diversification and Quality
Export product diversification is captured by the Theil index, which can be decomposed into a “between” and a
“within” subindex:
1
.∙ ln
.
+ ,
in which i is the product index and N the total number of products. The “between” Theil index captures the
extensive margin of diversification—that is, the number of products—while the “within” Theil index captures
the intensive margin (product shares).
Export partner diversification: The Theil index is also available across export partners. In this case, i and N in the
above relationship represent the export partner index and number of export partners, respectively.
Export quality is measured by the export’s unit value adjusted for differences in production costs, relative
distance to the trade partner, and the development of a country through the following relationship:
ln ln . . ln
,
in which the subscripts m, x, and t denote importer, exporter, and time period, respectively.
Sources: IMF (2014b), and Henn, Papageorgiou, and Spatafora (2013).
Further product diversification could yield growth gains (Figure 23, bottom right panel). While
Senegal’s economy is already relatively diversified, better product variety could improve growth.
INTERNATIONAL MONETARY FUND 54
Based on the estimates in IMF 2014b, a 1 standard deviation increase in low-income countries’
export diversification raises the growth rate by about 0.8 percentage point. For Senegal, this
translates into estimated growth gains of ¼ percentage point if export diversification rises to
levels observed, for example, in Tanzania.
Further diversification across products and partners could also help restrain the volatility of
growth (Tables 3 and 4). The methodology in IMF 2014b suggests estimating a two-stage
general method of moments regression to quantify the effect of diversification on the volatility
of growth in a dynamic panel. This chapter focuses on sub-Saharan African countries and
extends the regressions by examining the effects of the extensive margin of product
diversification and the effect of a diversification in export partners. The results show volatility is
more likely to decrease through an increase in the intensive margin of product and export
partner diversification and that the gains are economically significant. All else equal, the
estimates imply that increasing product diversification to levels in Tanzania or Vietnam could
reduce volatility by about one-sixth and one-quarter, respectively, with similar magnitudes
implied by boosts in export partner diversification.
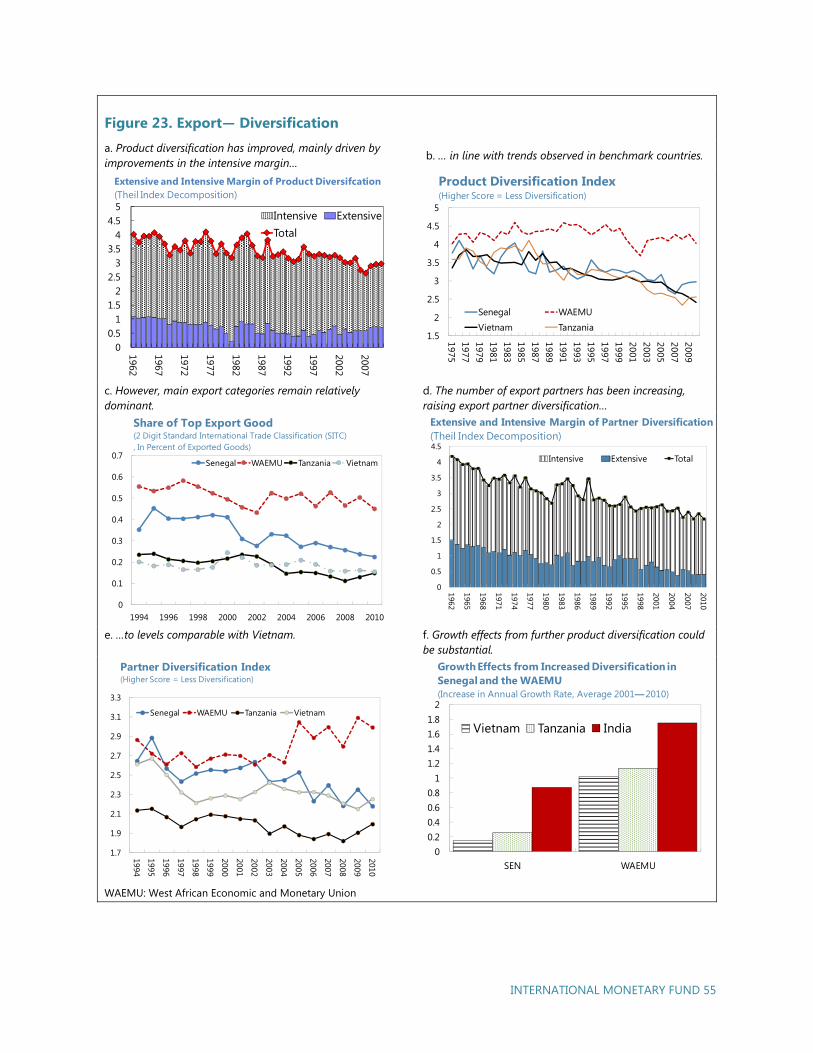
INTERNATIONAL MONETARY FUND 55
Figure 23. Export— Diversification a. Product diversification has improved, mainly driven by improvements in the intensive margin…
b. … in line with trends observed in benchmark countries.
c. However, main export categories remain relativelydominant.
d. The number of export partners has been increasing, raising export partner diversification…
e. …to levels comparable with Vietnam. f. Growth effects from further product diversification could be substantial.
WAEMU: West African Economic and Monetary Union
00.5
11.5
22.5
33.5
44.5
5
1962
1967
1972
1977
1982
1987
1992
1997
2002
2007
Intensive ExtensiveTotal
Extensive and Intensive Margin of Product Diversifcation(Theil Index Decomposition)
1.5
2
2.5
3
3.5
4
4.5
5
197519771979198119831985198719891991199319951997199920012003200520072009
Senegal WAEMU
Vietnam Tanzania
Product Diversification Index(Higher Score = Less Diversification)
0
0.1
0.2
0.3
0.4
0.5
0.6
0.7
1994 1996 1998 2000 2002 2004 2006 2008 2010
Senegal WAEMU Tanzania Vietnam
Share of Top Export Good(2 Digit Standard International Trade Classification (SITC), In Percent of Exported Goods)
0
0.5
1
1.5
2
2.5
3
3.5
4
4.5
1962
1965
1968
1971
1974
1977
1980
1983
1986
1989
1992
1995
1998
2001
2004
2007
2010
Intensive Extensive Total
Extensive and Intensive Margin of Partner Diversification(Theil Index Decomposition)
1.7
1.9
2.1
2.3
2.5
2.7
2.9
3.1
3.3
1994
1995
1996
1997
1998
1999
2000
2001
2002
2003
2004
2005
2006
2007
2008
2009
2010
Senegal WAEMU Tanzania Vietnam
Partner Diversification Index(Higher Score = Less Diversification)
00.20.40.60.8
11.21.41.61.8
2
SEN WAEMU
Vietnam Tanzania India
Growth Effects from Increased Diversification in Senegal and the WAEMU(Increase in Annual Growth Rate, Average 2001—2010)
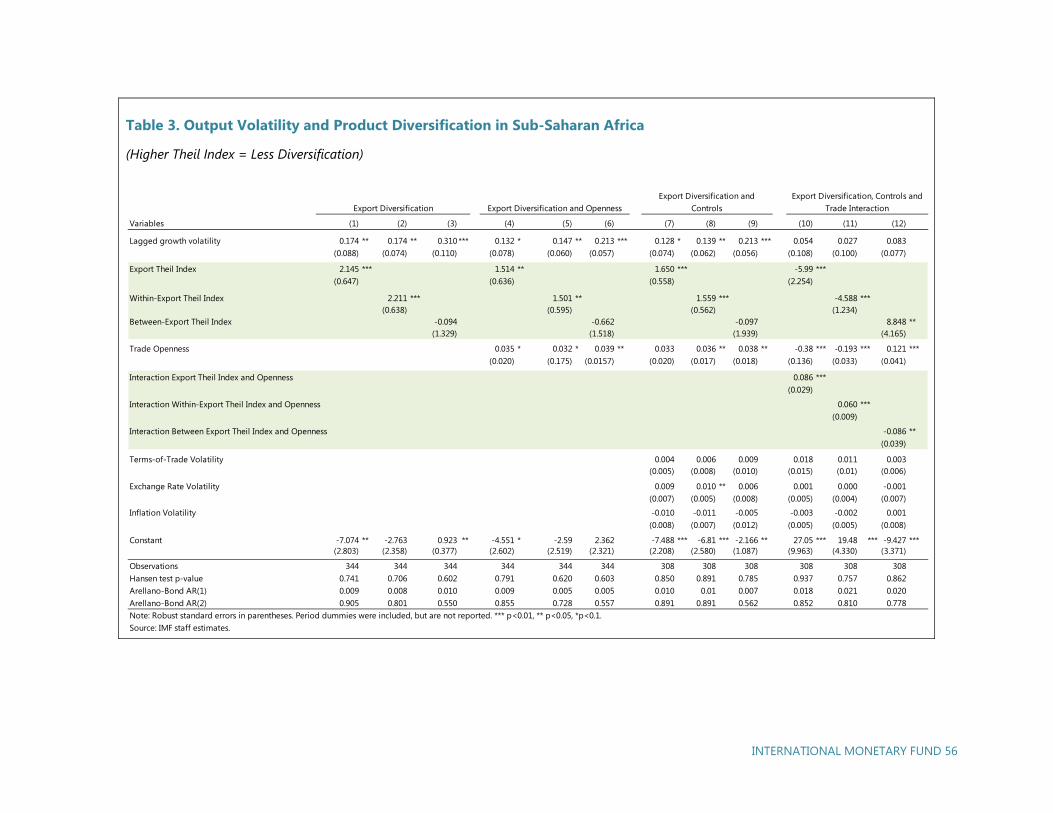
INTERNATIONAL MONETARY FUND 56
Table 3. Output Volatility and Product Diversification in Sub-Saharan Africa
(Higher Theil Index = Less Diversification)
Variables (1) (2) (3) (4) (5) (6) (7) (8) (9) (10) (11) (12)
Lagged growth volatility 0.174 ** 0.174 ** 0.310*** 0.132 * 0.147 ** 0.213 *** 0.128 * 0.139 ** 0.213 *** 0.054 0.027 0.083(0.088) (0.074) (0.110) (0.078) (0.060) (0.057) (0.074) (0.062) (0.056) (0.108) (0.100) (0.077)
Export Theil Index 2.145 *** 1.514 ** 1.650 *** -5.99 ***(0.647) (0.636) (0.558) (2.254)
Within-Export Theil Index 2.211 *** 1.501 ** 1.559 *** -4.588 ***(0.638) (0.595) (0.562) (1.234)
Between-Export Theil Index -0.094 -0.662 -0.097 8.848 **(1.329) (1.518) (1.939) (4.165)
Trade Openness 0.035 * 0.032 * 0.039 ** 0.033 0.036 ** 0.038 ** -0.38 *** -0.193 *** 0.121 ***(0.020) (0.175) (0.0157) (0.020) (0.017) (0.018) (0.136) (0.033) (0.041)
Interaction Export Theil Index and Openness 0.086 ***(0.029)
Interaction Within-Export Theil Index and Openness 0.060 ***(0.009)
Interaction Between Export Theil Index and Openness -0.086 **(0.039)
Terms-of-Trade Volatility 0.004 0.006 0.009 0.018 0.011 0.003(0.005) (0.008) (0.010) (0.015) (0.01) (0.006)
Exchange Rate Volatility 0.009 0.010 ** 0.006 0.001 0.000 -0.001(0.007) (0.005) (0.008) (0.005) (0.004) (0.007)
Inflation Volatility -0.010 -0.011 -0.005 -0.003 -0.002 0.001(0.008) (0.007) (0.012) (0.005) (0.005) (0.008)
Constant -7.074 ** -2.763 0.923 ** -4.551 * -2.59 2.362 -7.488 *** -6.81 *** -2.166 ** 27.05 *** 19.48 *** -9.427 ***(2.803) (2.358) (0.377) (2.602) (2.519) (2.321) (2.208) (2.580) (1.087) (9.963) (4.330) (3.371)
Observations 344 344 344 344 344 344 308 308 308 308 308 308Hansen test p-value 0.741 0.706 0.602 0.791 0.620 0.603 0.850 0.891 0.785 0.937 0.757 0.862Arellano-Bond AR(1) 0.009 0.008 0.010 0.009 0.005 0.005 0.010 0.01 0.007 0.018 0.021 0.020Arellano-Bond AR(2) 0.905 0.801 0.550 0.855 0.728 0.557 0.891 0.891 0.562 0.852 0.810 0.778Note: Robust standard errors in parentheses. Period dummies were included, but are not reported. *** p<0.01, ** p<0.05, *p<0.1.Source: IMF staff estimates.
Export Diversification Export Diversification and OpennessExport Diversification and
ControlsExport Diversification, Controls and
Trade Interaction
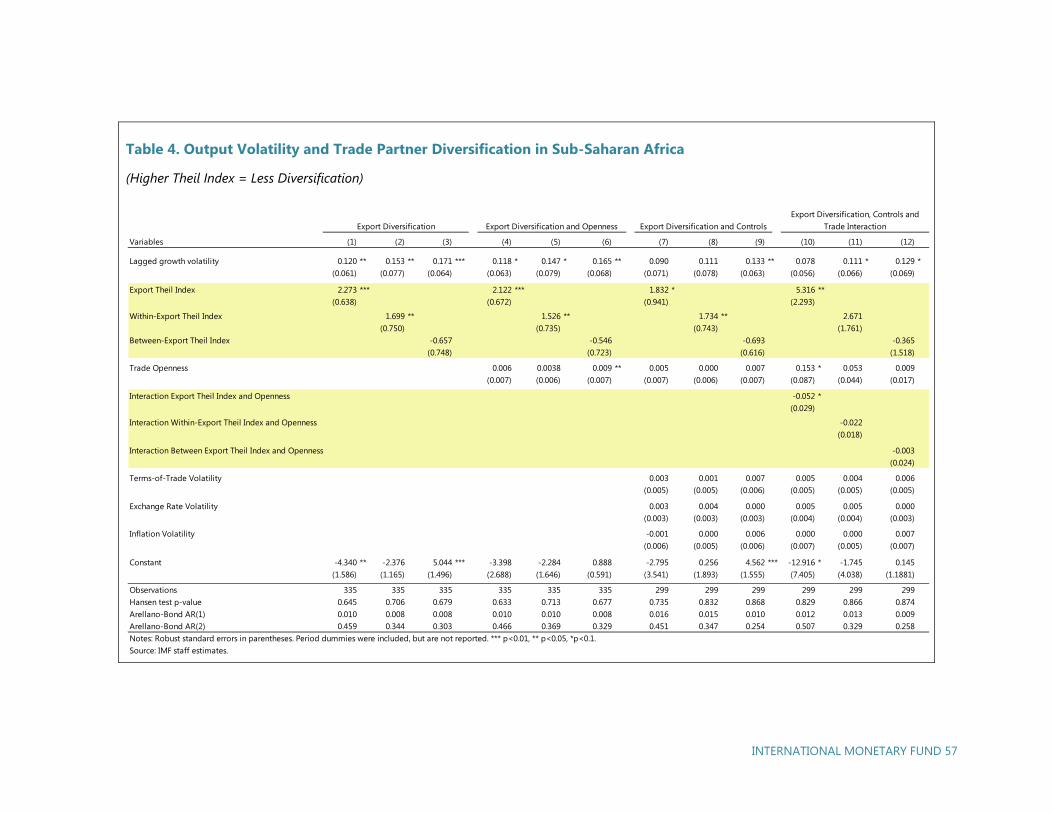
INTERNATIONAL MONETARY FUND 57
Table 4. Output Volatility and Trade Partner Diversification in Sub-Saharan Africa
(Higher Theil Index = Less Diversification)
Variables (1) (2) (3) (4) (5) (6) (7) (8) (9) (10) (11) (12)
Lagged growth volatility 0.120 ** 0.153 ** 0.171 *** 0.118 * 0.147 * 0.165 ** 0.090 0.111 0.133 ** 0.078 0.111 * 0.129 *(0.061) (0.077) (0.064) (0.063) (0.079) (0.068) (0.071) (0.078) (0.063) (0.056) (0.066) (0.069)
Export Theil Index 2.273 *** 2.122 *** 1.832 * 5.316 **(0.638) (0.672) (0.941) (2.293)
Within-Export Theil Index 1.699 ** 1.526 ** 1.734 ** 2.671(0.750) (0.735) (0.743) (1.761)
Between-Export Theil Index -0.657 -0.546 -0.693 -0.365(0.748) (0.723) (0.616) (1.518)
Trade Openness 0.006 0.0038 0.009 ** 0.005 0.000 0.007 0.153 * 0.053 0.009(0.007) (0.006) (0.007) (0.007) (0.006) (0.007) (0.087) (0.044) (0.017)
Interaction Export Theil Index and Openness -0.052 *(0.029)
Interaction Within-Export Theil Index and Openness -0.022(0.018)
Interaction Between Export Theil Index and Openness -0.003(0.024)
Terms-of-Trade Volatility 0.003 0.001 0.007 0.005 0.004 0.006(0.005) (0.005) (0.006) (0.005) (0.005) (0.005)
Exchange Rate Volatility 0.003 0.004 0.000 0.005 0.005 0.000(0.003) (0.003) (0.003) (0.004) (0.004) (0.003)
Inflation Volatility -0.001 0.000 0.006 0.000 0.000 0.007(0.006) (0.005) (0.006) (0.007) (0.005) (0.007)
Constant -4.340 ** -2.376 5.044 *** -3.398 -2.284 0.888 -2.795 0.256 4.562 *** -12.916 * -1.745 0.145(1.586) (1.165) (1.496) (2.688) (1.646) (0.591) (3.541) (1.893) (1.555) (7.405) (4.038) (1.1881)
Observations 335 335 335 335 335 335 299 299 299 299 299 299Hansen test p-value 0.645 0.706 0.679 0.633 0.713 0.677 0.735 0.832 0.868 0.829 0.866 0.874Arellano-Bond AR(1) 0.010 0.008 0.008 0.010 0.010 0.008 0.016 0.015 0.010 0.012 0.013 0.009Arellano-Bond AR(2) 0.459 0.344 0.303 0.466 0.369 0.329 0.451 0.347 0.254 0.507 0.329 0.258Notes: Robust standard errors in parentheses. Period dummies were included, but are not reported. *** p<0.01, ** p<0.05, *p<0.1.Source: IMF staff estimates.
Export Diversification, Controls and Trade InteractionExport Diversification Export Diversification and Openness Export Diversification and Controls
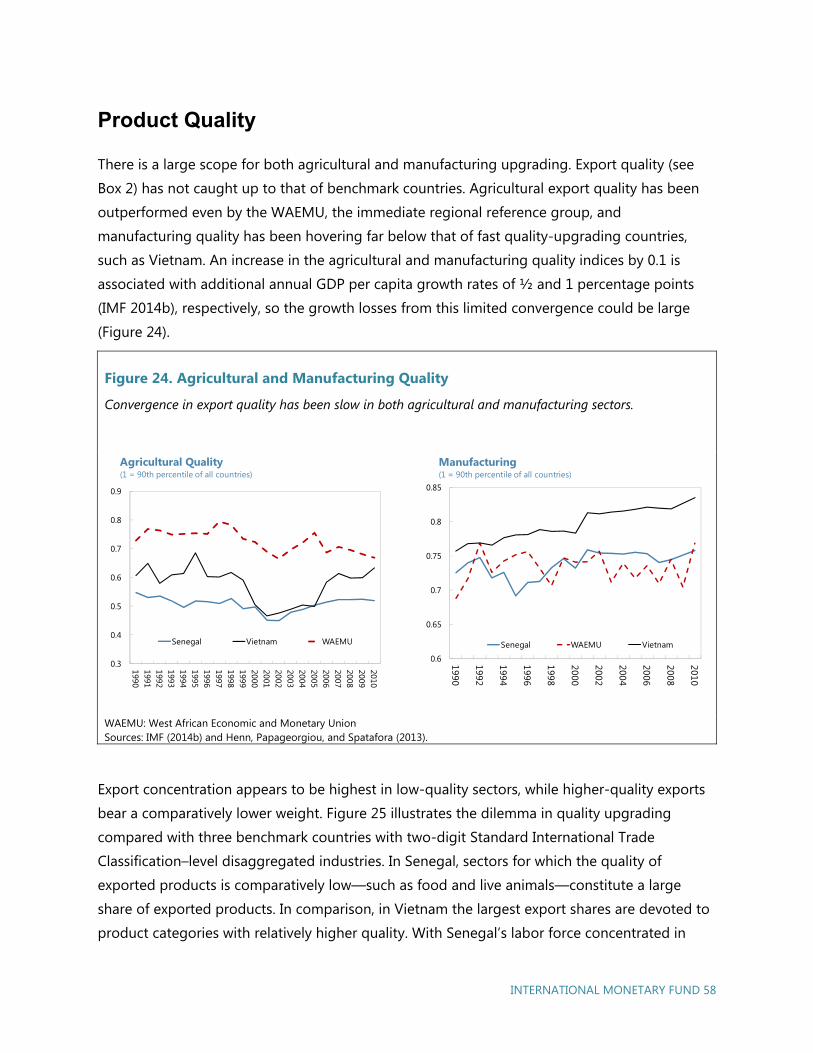
INTERNATIONAL MONETARY FUND 58
Product Quality
There is a large scope for both agricultural and manufacturing upgrading. Export quality (see
Box 2) has not caught up to that of benchmark countries. Agricultural export quality has been
outperformed even by the WAEMU, the immediate regional reference group, and
manufacturing quality has been hovering far below that of fast quality-upgrading countries,
such as Vietnam. An increase in the agricultural and manufacturing quality indices by 0.1 is
associated with additional annual GDP per capita growth rates of ½ and 1 percentage points
(IMF 2014b), respectively, so the growth losses from this limited convergence could be large
(Figure 24).
Figure 24. Agricultural and Manufacturing Quality
Convergence in export quality has been slow in both agricultural and manufacturing sectors.
WAEMU: West African Economic and Monetary Union Sources: IMF (2014b) and Henn, Papageorgiou, and Spatafora (2013).
Export concentration appears to be highest in low-quality sectors, while higher-quality exports
bear a comparatively lower weight. Figure 25 illustrates the dilemma in quality upgrading
compared with three benchmark countries with two-digit Standard International Trade
Classification–level disaggregated industries. In Senegal, sectors for which the quality of
exported products is comparatively low—such as food and live animals—constitute a large
share of exported products. In comparison, in Vietnam the largest export shares are devoted to
product categories with relatively higher quality. With Senegal’s labor force concentrated in
0.3
0.4
0.5
0.6
0.7
0.8
0.9
199019911992199319941995199619971998199920002001200220032004200520062007200820092010
Senegal Vietnam WAEMU
Agricultural Quality(1 = 90th percentile of all countries)
0.6
0.65
0.7
0.75
0.8
0.85
1990
1992
1994
1996
1998
2000
2002
2004
2006
2008
2010
Senegal WAEMU Vietnam
Manufacturing(1 = 90th percentile of all countries)
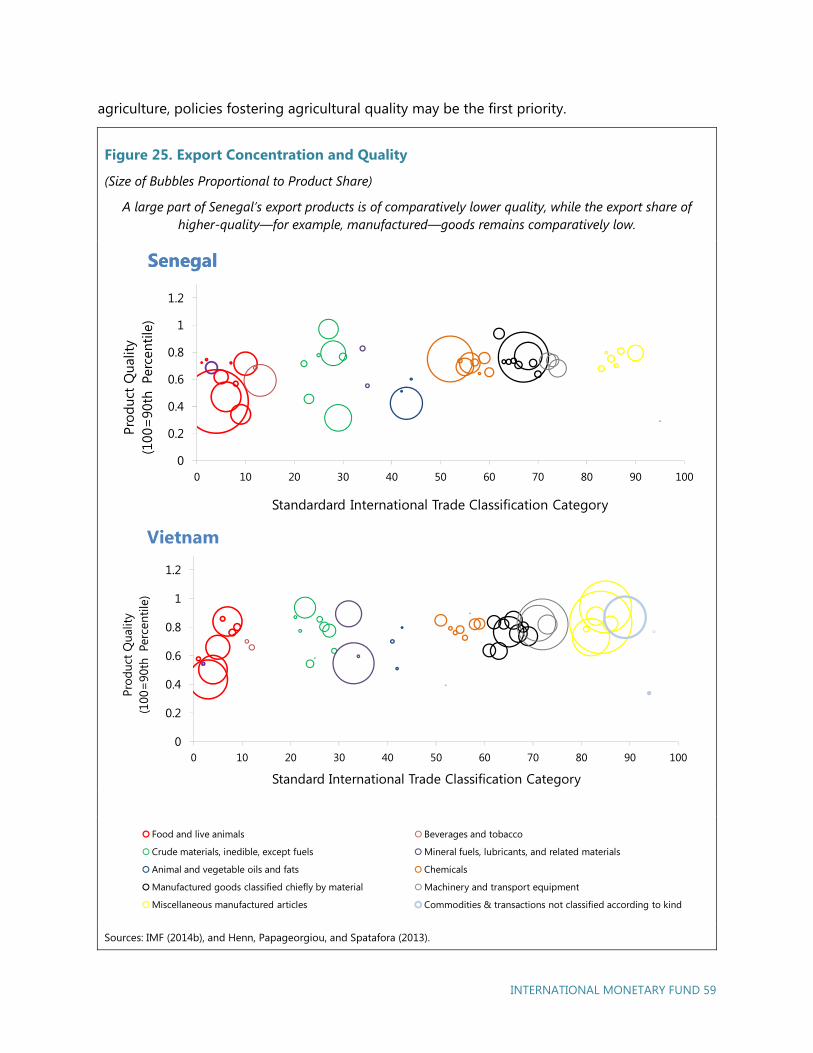
INTERNATIONAL MONETARY FUND 59
agriculture, policies fostering agricultural quality may be the first priority.
Figure 25. Export Concentration and Quality
(Size of Bubbles Proportional to Product Share)
A large part of Senegal’s export products is of comparatively lower quality, while the export share of higher-quality—for example, manufactured—goods remains comparatively low.
Sources: IMF (2014b), and Henn, Papageorgiou, and Spatafora (2013).
01Food and live animals Beverages and tobacco
Crude materials, inedible, except fuels Mineral fuels, lubricants, and related materials
Animal and vegetable oils and fats Chemicals
Manufactured goods classified chiefly by material Machinery and transport equipment
Miscellaneous manufactured articles Commodities & transactions not classified according to kind
0
0.2
0.4
0.6
0.8
1
1.2
0 10 20 30 40 50 60 70 80 90 100
Prod
uct Q
ualit
y(1
00=
90th
Per
cent
ile)
Standardard International Trade Classification Category
SenegalSenegal
0
0.2
0.4
0.6
0.8
1
1.2
0 10 20 30 40 50 60 70 80 90 100
Prod
uct Q
ualit
y(1
00=
90th
Per
cent
ile)
Standard International Trade Classification Category
Vietnam
INTERNATIONAL MONETARY FUND 60
Informality
An informal business survey confirms a gap in human capital and highlights financing as
another constraint to growth. Figure 26 highlights the main results of a survey covering
Senegal’s nonagricultural informal sector enterprises. This sector employs about 2.2 million
people and contributes about two-fifths to Senegal’s total GDP (ANSD 2013). It therefore
represents Senegal’s economy well. In line with the constraints to education highlighted in this
section, the results of the survey show that the majority of actors in the informal market do not
possess education above the primary level. Among the most severe perceived constraints to the
business environment is access to finance, with the majority of participants relying on their
personal savings as their main sources of financing.
Conclusions
Policies should target increases in TFP productivity, and further export diversification should be
complemented with improvements in product quality. With TFP and human capital the main
constraints from the production side, and the relative level of capital already high compared
with that of other countries, any investment scale-up should be accompanied by efficiency
increases and investments in human capital to yield growth dividends. Sectors that could
benefit the most from increased productivity are manufacturing, wholesale, and agriculture.
Senegal has made strong progress in the diversification of its export product and partner base
over the past decades, but export quality is lagging that of benchmark countries. Increasing the
shares of products of comparatively high quality could boost growth but will require
investments in human capital and institutions as well. Increasing access to finance and
education could be priority structural reforms from the informal sector’s perspective.
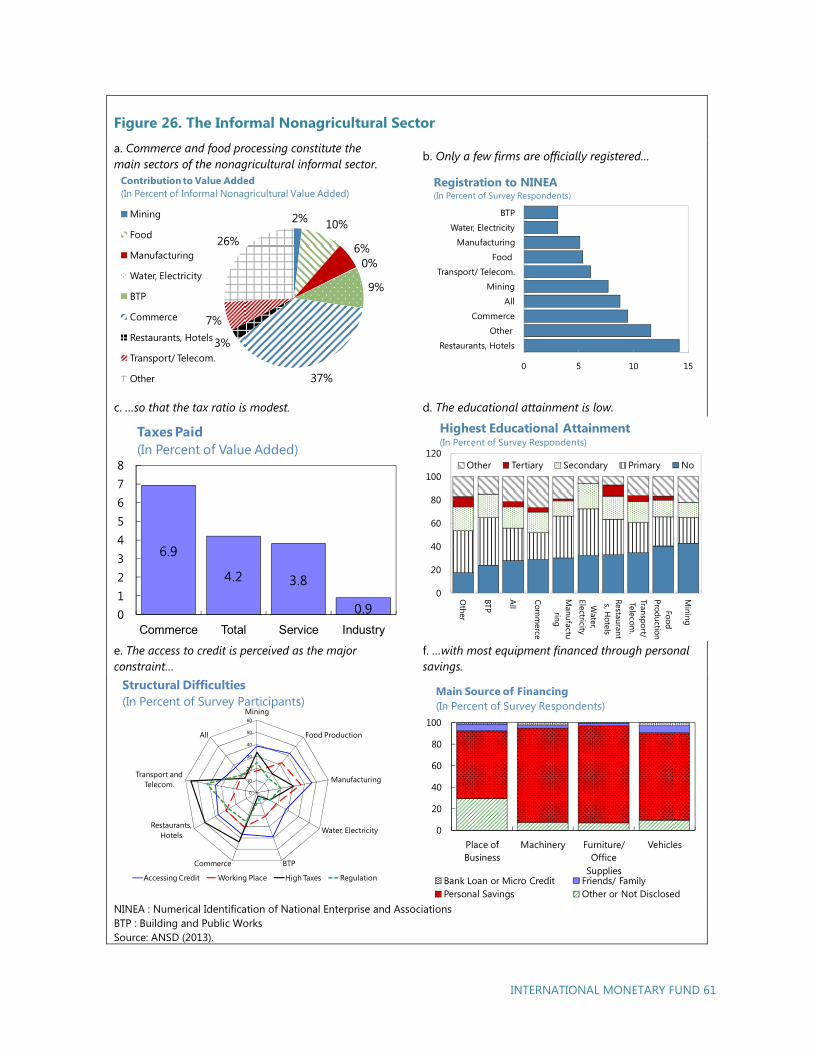
INTERNATIONAL MONETARY FUND 61
Figure 26. The Informal Nonagricultural Sector
a. Commerce and food processing constitute themain sectors of the nonagricultural informal sector.
b. Only a few firms are officially registered…
c. …so that the tax ratio is modest. d. The educational attainment is low.
e. The access to credit is perceived as the majorconstraint…
f. …with most equipment financed through personal savings.
NINEA : Numerical Identification of National Enterprise and Associations BTP : Building and Public Works Source: ANSD (2013).
2% 10%
6%0%
9%
37%
3%
7%
26%
Mining
Food
Manufacturing
Water, Electricity
BTP
Commerce
Restaurants, Hotels
Transport/ Telecom.
Other
Contribution to Value Added(In Percent of Informal Nonagricultural Value Added)
0 5 10 15
Restaurants, Hotels
Other
Commerce
All
Mining
Transport/ Telecom.
Food
Manufacturing
Water, Electricity
BTP
Registration to NINEA(In Percent of Survey Respondents)
6.9
4.2 3.8
0.9012345678
Commerce Total Service Industry
Taxes Paid (In Percent of Value Added)
0
20
40
60
80
100
120
Other
BTP
All
Comm
erce
Manufactu
ring
Water,
Electricity
Restaurants, H
otels
Transport/ Telecom
.
Food Production
Mining
Other Tertiary Secondary Primary No
Highest Educational Attainment(In Percent of Survey Respondents)
0
10
20
30
40
50
60
Mining
Food Production
Manufacturing
Water, Electricity
BTPCommerce
Restaurants, Hotels
Transport and Telecom.
All
Accessing Credit Working Place High Taxes Regulation
Structural Difficulties(In Percent of Survey Participants)
0
20
40
60
80
100
Place of Business
Machinery Furniture/ Office
Supplies
Vehicles
Bank Loan or Micro Credit Friends/ FamilyPersonal Savings Other or Not Disclosed
Main Source of Financing(In Percent of Survey Respondents)

INTERNATIONAL MONETARY FUND 63
Solving the Electricity Puzzle
Olivier Basdevant
The fiscal cost of the electricity sector continues to weigh heavily on the government’s budget. As
a result, there is an opportunity cost for development spending, while the economy still faces
significant bottlenecks with high electricity costs and insufficient electricity production. Cross-
country experiences provide useful guidelines on successful reforms, particularly on the fiscal front.
Senegal also has an opportunity to lower tariffs, eliminate fiscal subsidies, and expand coverage—
provided it accelerates the introduction of new low-cost generation. Moreover, this can be done at
low cost to the government budget through the use of power purchase agreements that could be
reached through transparent tenders.
The Electricity Sector Represents Both Challenges and
Opportunities for the Plan Sénégal Emergent
Limited access to affordable electricity is a significant impediment to private sector
development. Electricity is generated primarily by oil-fired plants. As a result of this limited
access to electricity, Senegal suffers from one of the highest production costs in sub-Saharan
Africa: about US$0.30 a kilowatt-hour (kWh). To illustrate how bad this is, power tariffs in most
emerging market areas fall in the range of US$0.04 to US$0.08 a kWh. Even relative to sub-
Saharan Africa, Senegal scores badly; its tariff is more than twice the average tariff of US$0.13 a
kWh. In parallel, its electricity prices are among the highest in sub-Saharan Africa, set at about
30–40 percent below cost recovery. Overall, access to electricity remains low because of high
costs and insufficient generation. Senegal receives its lowest score in the World Bank Doing
Business indicators for the access to electricity: 182nd out of 189.13
13 http://www.doingbusiness.org/data/exploreeconomies/senegal.
5
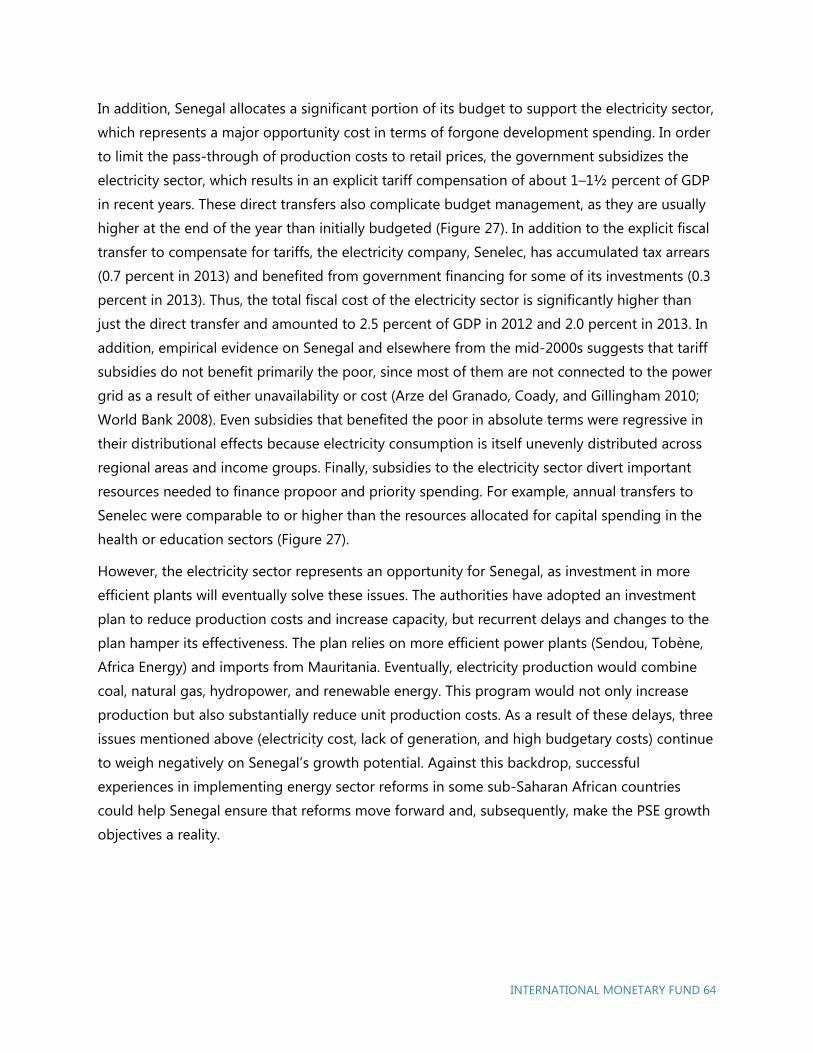
INTERNATIONAL MONETARY FUND 64
In addition, Senegal allocates a significant portion of its budget to support the electricity sector,
which represents a major opportunity cost in terms of forgone development spending. In order
to limit the pass-through of production costs to retail prices, the government subsidizes the
electricity sector, which results in an explicit tariff compensation of about 1–1½ percent of GDP
in recent years. These direct transfers also complicate budget management, as they are usually
higher at the end of the year than initially budgeted (Figure 27). In addition to the explicit fiscal
transfer to compensate for tariffs, the electricity company, Senelec, has accumulated tax arrears
(0.7 percent in 2013) and benefited from government financing for some of its investments (0.3
percent in 2013). Thus, the total fiscal cost of the electricity sector is significantly higher than
just the direct transfer and amounted to 2.5 percent of GDP in 2012 and 2.0 percent in 2013. In
addition, empirical evidence on Senegal and elsewhere from the mid-2000s suggests that tariff
subsidies do not benefit primarily the poor, since most of them are not connected to the power
grid as a result of either unavailability or cost (Arze del Granado, Coady, and Gillingham 2010;
World Bank 2008). Even subsidies that benefited the poor in absolute terms were regressive in
their distributional effects because electricity consumption is itself unevenly distributed across
regional areas and income groups. Finally, subsidies to the electricity sector divert important
resources needed to finance propoor and priority spending. For example, annual transfers to
Senelec were comparable to or higher than the resources allocated for capital spending in the
health or education sectors (Figure 27).
However, the electricity sector represents an opportunity for Senegal, as investment in more
efficient plants will eventually solve these issues. The authorities have adopted an investment
plan to reduce production costs and increase capacity, but recurrent delays and changes to the
plan hamper its effectiveness. The plan relies on more efficient power plants (Sendou, Tobène,
Africa Energy) and imports from Mauritania. Eventually, electricity production would combine
coal, natural gas, hydropower, and renewable energy. This program would not only increase
production but also substantially reduce unit production costs. As a result of these delays, three
issues mentioned above (electricity cost, lack of generation, and high budgetary costs) continue
to weigh negatively on Senegal’s growth potential. Against this backdrop, successful
experiences in implementing energy sector reforms in some sub-Saharan African countries
could help Senegal ensure that reforms move forward and, subsequently, make the PSE growth
objectives a reality.
INTERNATIONAL MONETARY FUND 65
Figure 27. The Fiscal Costs of the Electricity Sector
a. Electricity production costs are much higher than inadvanced and emerging market economies.
b. In addition, tariffs are set well below cost recovery, in partbecause tariffs are already high.
c. As a result, the budget finances the electricity sector,which leaves fewer resources for poverty-reducing expenditures.
d. Moreover, the ex post transfers to the electricity companySenelec tend to be higher than ex ante.
KWh: Kilowatt per hour Sources: Country authorities, World Bank, and IMF staff estimates and projections.
0
5
10
15
20
25
30
35
United States Senegal
Electricty Production Cost(US$ cents per KWh)
110
120
130
140
150
160
170
180
2011 2012 2013
Average tariff
Average cost
Tariff Gap, 2011–19 (CFAF per KWh)
0.0
0.5
1.0
1.5
2.0
2.5
3.0
2012 2013
HealthEducationFiscal cost
Transfers to Senelec and Investment Spending on Social Sectors, 2012–13(Percent of GDP)
0.0
0.2
0.4
0.6
0.8
1.0
1.2
1.4
1.6
1.8
2.0
2011 2012 2013
Projected¹Actual
Tariff Compensation, 2011–13 (Percent of GDP)
INTERNATIONAL MONETARY FUND 66
Successful Electricity Reforms
Successful electricity reforms in sub-Saharan African countries can help elucidate how Senegal
could address its own challenges (IMF 2013). Low access, high costs, and unreliable supply
plague much of the continent, so although Senegal is among the outliers, it is not the only
African country to face this challenge and can build on the experience of other countries’ past
reforms. Successful reforms incorporate price adjustment, investment in cost reduction, proper
outreach to users, and a strategy that includes social safety nets. Investing to reduce cost and increase generation is the right strategy. Fundamentally, Senegal’s
strategy is the right one. All successful cases of energy reforms have indeed implemented
investment to improve the energy mix, thus reducing electricity costs, improving generation
capacity, and phasing out budgetary costs. What is peculiar about Senegal’s situation are the
recurrent delays in implementing the investment plan. An avenue that could be explored is
finding ways to strengthen credibility in the plan by demonstrating commitment to implement
it. To do so, three avenues could be explored, which have been used by other sub-Saharan
African countries: (1) establishing a public debate with a view to creating a large political and
social consensus on all aspects of the reforms (that is, not just the investment plan), (2)
considering tariff adjustments to mitigate the budgetary impact of potential delays and
preserve room for development spending in the budget, and (3) developing social safety nets
that can be more efficient in reaching the poor. These three points are discussed further in the
following paragraphs. Strengthening support for reform. Electricity subsidies are a highly visible way for governments
to benefit their people, even if, overall, they mostly benefit the rich. Strengthening support for
subsidy reforms would typically involve communicating their redistributive implications and
convincing the population that overall reforms would benefit the majority by better targeting
the poor and by unleashing the country’s growth potential. In this respect Senegal could
consider using elements of communication strategies used in Ghana and Kenya, two countries
that achieved successful reforms.
Ghana’s 2005 reform included an active campaign, using media and consultation with civil
society to communicate the benefits of the reform and involve all stakeholders (IMF 2013).
Kenya consulted with stakeholders early in its reform process, allaying concerns of people
working in utilities. The consultation culminated in Kenya’s 2004 energy policy, which
increased tariffs to match long-term marginal costs. Costs increased concurrently with
improvements in quality of service, placating consumers (IMF 2013).
INTERNATIONAL MONETARY FUND 67
Senegal’s authorities could communicate the potential gains from a reallocation of government
spending away from electricity subsidies. A convincing argument could be made about the
opportunity cost of subsidizing electricity in terms of forgone development spending or tax cuts
targeted to crowd in private investment, particularly foreign direct investment (FDI).
Furthermore, consumers may become aware that reforms that improve the financial position of
Senelec would also lead to better electricity service and access. In order to be effective, the
support for the reform could rely on two specific initiatives related to fiscal transparency. First,
the fiscal cost of the electricity sector could be presented in its entirety in budget documents—
that is, covering not only the direct transfer but also tax arrears and investment financed by the
government. For example, a welcome development is the inclusion of some estimates in the
2015 budget. Second, the fiscal cost would not be considered “given” but would be set as a
complement to Senelec’s own efforts to reduce its operating costs. In this context, Senelec’s
performance contract is likely to adequately complement the efforts at fiscal transparency by
providing more information on Senelec’s own efforts.
Developing social safety nets to protect the poor. Successful reforms have included programs
targeting the poor through two actions: maintaining cheaper electricity for them and improving
their access to electricity (notably by the electrification of rural areas). For example, Kenya
maintained lifeline (below-cost) tariffs to households consuming less than 50 kWh a month,
which was cross-subsidized through higher rates for larger consumers. In addition, access was
improved for the poor, using subsidies financed by donors to invest in infrastructure. Gabon
adopted a similar approach, allowing households with extremely low electric bills access to free
electricity up to a certain amount. Senegal has made efforts to move in this direction. Specific
investments are planned in electricity distribution through the strengthening and
modernization of networks, stations, and power lines. To achieve the target of 60 percent rural
electrification by 2016, a priority rural electrification three-year program (2014–16) was
developed. In parallel, efforts have been made to revamp social safety nets, with a view to
better targeting the poor. The authorities have worked closely with development partners,
notably the World Bank, on this issue; however, these efforts will take time to bear fruit, notably
in terms of electrification of rural areas.
Along with cost-reduction investments, price adjustments are usually necessary. This is
particularly relevant if the utility company needs the tariffs to cover not only its operating costs
but also the cost of its investment. Kenya has undergone reforms that began in the 1990s and
continued into the 2000s. At present, this utility company has some flexibility to invest (Ajodhia,
Mulder, and Slot 2012). The price-adjustment mechanism includes a pass-through of fuel prices
and exchange-rate fluctuations. Senegal already has high electricity tariffs compared with those
INTERNATIONAL MONETARY FUND 68
of the region. As such, the scope for an across-the-board price adjustment is limited; however,
options could be considered to increase tariffs temporarily and selectively in order to reduce
the fiscal burden. But Senegal may be able to avoid price adjustments if it can rapidly expand
low-cost generation from coal to replace existing high-cost fuel plants. Moreover, if the
majority of the investment is undertaken under power purchase agreements, then there would
be no need for the state (or Senelec) to borrow to finance the expansion plans beyond the cost
of the distribution network. In turn, grants from the EU and other donors for infrastructure
targeted to the poor could finance a significant share of this spending without generating
financial pressures on the budget, Senelec, or electricity consumers.
Conclusion
Overall, Senegal’s strategy to address electricity sector issues is sound and in line with
international successful experiences. In particular, the investment plan, as well as efforts to
improve Senelec’s financial transparency, goes in the right direction in terms of reducing costs
and improving access to electricity.
In order to strengthen the effectiveness of their strategy, the authorities could consider
continued efforts in building consensus, especially if difficult decisions, such as price
adjustments, were to become necessary. In this respect, an active communication strategy on
the gains from a reallocation of government spending away from electricity subsidies would be
helpful. This could also persuade the population to accept costs in exchange for improved
accessibility and eventual reduced costs. In addition, continued efforts in developing social
safety nets would also help mitigate the social costs during the transition.
INTERNATIONAL MONETARY FUND 69
Social Safety Nets in Senegal
Aline Coudouel and Monique Newiak1
While Senegal has been successful in decreasing poverty rates, the share of the population living
below the poverty line and its exposure to shock remains high, emphasizing the need for safety
nets. Such nets should be scalable to respond to transient needs while ensuring minimum social
protection for chronically poor and vulnerable populations. Strengthening social protection is high
on the authorities’ reform agenda, including within the second pillar of the Plan Sénégal
Emergent (PSE). This section reviews Senegal’s current state of social protection and reforms in
progress, and outlines main strategies for the design of social security nets going forward.
Senegal has made progress in poverty alleviation, but the poverty incidence remains high, and
households are vulnerable to shocks (Figure 29, top left panel). In 2001–11 poverty rates
declined by 8.5 percentage points, with the largest decreases observed in Dakar, but almost half
of the population continues to live below the poverty line. The poorest households are
particularly vulnerable to idiosyncratic shocks, such as the loss of livestock or harvest, or
exogenous shocks—for example, to the prices of such major imports as oil, rice, and wheat. The
majority of households do not have mechanisms to mitigate the impact of such shocks,
resulting in their often tapping into savings and selling assets in response to shocks, with the
risk of being locked into long-term poverty.
Government Response to Shocks and Existing Safety Nets
in Senegal
Government’s response to exogenous shocks has included financial support to farmers, general
assistance to the rural population, and subsidies (Figure 29). In response to droughts, the
1 Drawing on World Bank (2014a and 2014b).
6
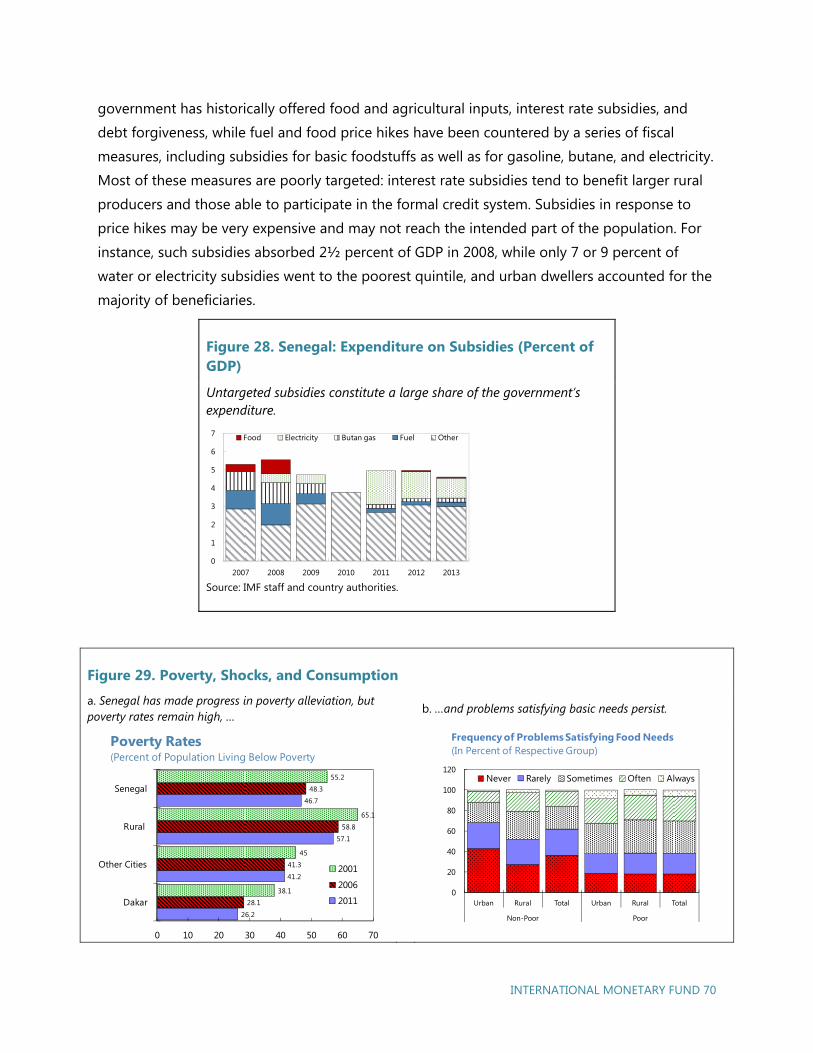
INTERNATIONAL MONETARY FUND 70
government has historically offered food and agricultural inputs, interest rate subsidies, and
debt forgiveness, while fuel and food price hikes have been countered by a series of fiscal
measures, including subsidies for basic foodstuffs as well as for gasoline, butane, and electricity.
Most of these measures are poorly targeted: interest rate subsidies tend to benefit larger rural
producers and those able to participate in the formal credit system. Subsidies in response to
price hikes may be very expensive and may not reach the intended part of the population. For
instance, such subsidies absorbed 2½ percent of GDP in 2008, while only 7 or 9 percent of
water or electricity subsidies went to the poorest quintile, and urban dwellers accounted for the
majority of beneficiaries.
Figure 28. Senegal: Expenditure on Subsidies (Percent of GDP)
Untargeted subsidies constitute a large share of the government’s expenditure.
Source: IMF staff and country authorities.
Figure 29. Poverty, Shocks, and Consumption
a. Senegal has made progress in poverty alleviation, but poverty rates remain high, …
b. …and problems satisfying basic needs persist.
0
1
2
3
4
5
6
7
2007 2008 2009 2010 2011 2012 2013
Food Electricity Butan gas Fuel Other
26.2
41.2
57.1
46.7
28.1
41.3
58.8
48.3
38.1
45
65.1
55.2
0 10 20 30 40 50 60 70
Dakar
Other Cities
Rural
Senegal
2001
2006
2011
Poverty Rates(Percent of Population Living Below Poverty
0
20
40
60
80
100
120
Urban Rural Total Urban Rural Total
Non-Poor Poor
Never Rarely Sometimes Often Always
Frequency of Problems Satisfying Food Needs(In Percent of Respective Group)
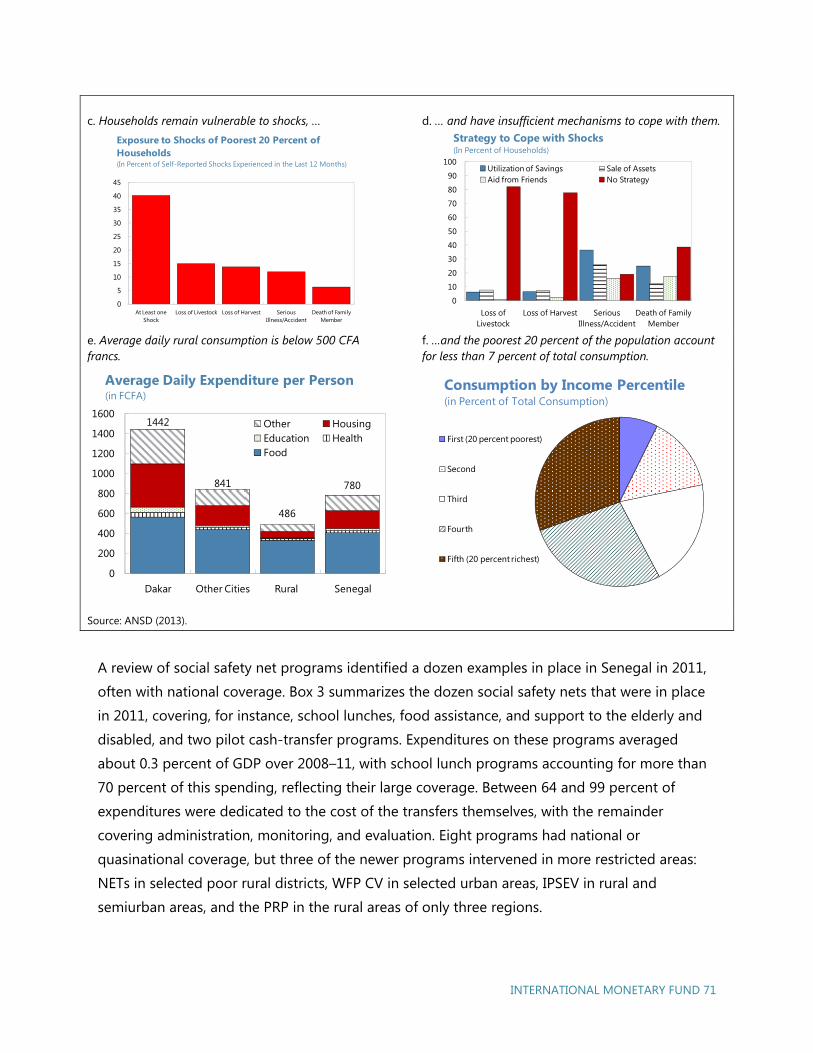
INTERNATIONAL MONETARY FUND 71
c. Households remain vulnerable to shocks, … d. … and have insufficient mechanisms to cope with them.
e. Average daily rural consumption is below 500 CFAfrancs.
f. …and the poorest 20 percent of the population account for less than 7 percent of total consumption.
Source: ANSD (2013).
A review of social safety net programs identified a dozen examples in place in Senegal in 2011,
often with national coverage. Box 3 summarizes the dozen social safety nets that were in place
in 2011, covering, for instance, school lunches, food assistance, and support to the elderly and
disabled, and two pilot cash-transfer programs. Expenditures on these programs averaged
about 0.3 percent of GDP over 2008–11, with school lunch programs accounting for more than
70 percent of this spending, reflecting their large coverage. Between 64 and 99 percent of
expenditures were dedicated to the cost of the transfers themselves, with the remainder
covering administration, monitoring, and evaluation. Eight programs had national or
quasinational coverage, but three of the newer programs intervened in more restricted areas:
NETs in selected poor rural districts, WFP CV in selected urban areas, IPSEV in rural and
semiurban areas, and the PRP in the rural areas of only three regions.
0
5
10
15
20
25
30
35
40
45
At Least one Shock
Loss of Livestock Loss of Harvest Serious Illness/Accident
Death of Family Member
Exposure to Shocks of Poorest 20 Percent of Households(In Percent of Self-Reported Shocks Experienced in the Last 12 Months)
0
10
20
30
40
50
60
70
80
90
100
Loss of Livestock
Loss of Harvest Serious Illness/Accident
Death of Family Member
Utilization of Savings Sale of AssetsAid from Friends No Strategy
Strategy to Cope with Shocks(In Percent of Households)
1442
841
486
780
0
200
400
600
800
1000
1200
1400
1600
Dakar Other Cities Rural Senegal
Other HousingEducation HealthFood
Average Daily Expenditure per Person(in FCFA)
First (20 percent poorest)
Second
Third
Fourth
Fifth (20 percent richest)
Consumption by Income Percentile(in Percent of Total Consumption)
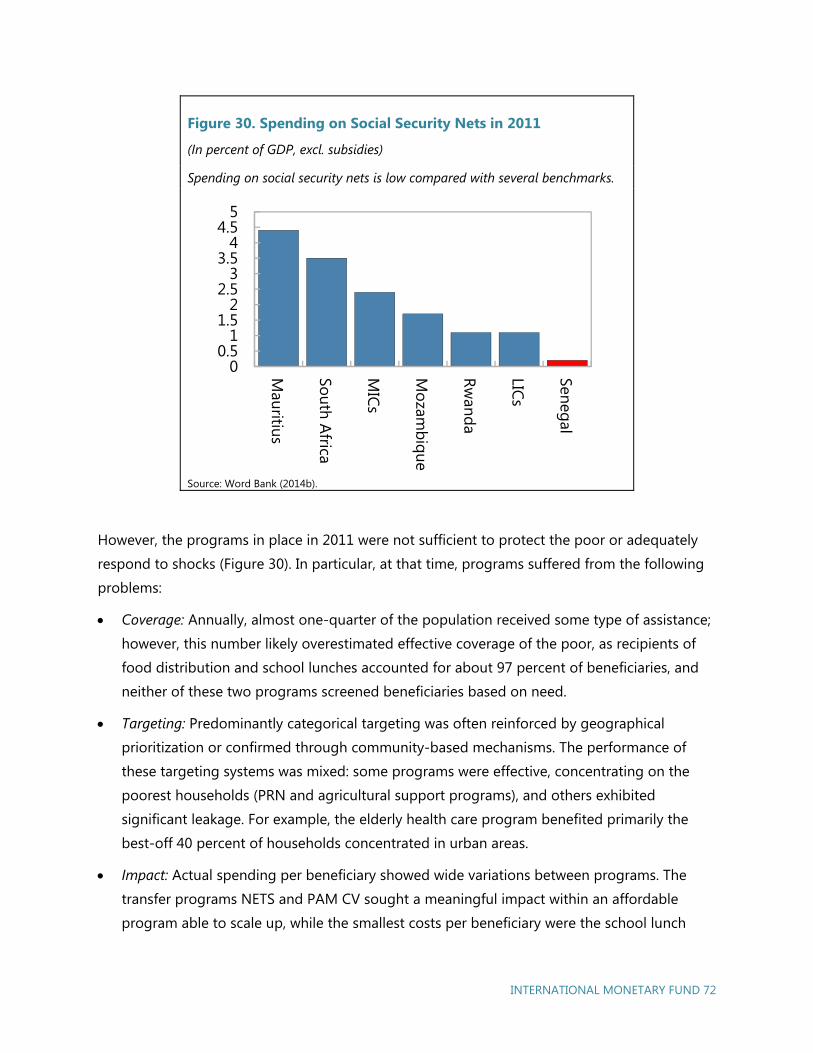
INTERNATIONAL MONETARY FUND 72
Figure 30. Spending on Social Security Nets in 2011
(In percent of GDP, excl. subsidies)
Spending on social security nets is low compared with several benchmarks.
Source: Word Bank (2014b).
However, the programs in place in 2011 were not sufficient to protect the poor or adequately
respond to shocks (Figure 30). In particular, at that time, programs suffered from the following
problems:
Coverage: Annually, almost one-quarter of the population received some type of assistance;
however, this number likely overestimated effective coverage of the poor, as recipients of
food distribution and school lunches accounted for about 97 percent of beneficiaries, and
neither of these two programs screened beneficiaries based on need.
Targeting: Predominantly categorical targeting was often reinforced by geographical
prioritization or confirmed through community-based mechanisms. The performance of
these targeting systems was mixed: some programs were effective, concentrating on the
poorest households (PRN and agricultural support programs), and others exhibited
significant leakage. For example, the elderly health care program benefited primarily the
best-off 40 percent of households concentrated in urban areas.
Impact: Actual spending per beneficiary showed wide variations between programs. The
transfer programs NETS and PAM CV sought a meaningful impact within an affordable
program able to scale up, while the smallest costs per beneficiary were the school lunch
00.5
11.5
22.5
33.5
44.5
5
Mauritius
South Africa
MICs
Mozam
bique
Rwanda
LICs
Senegal
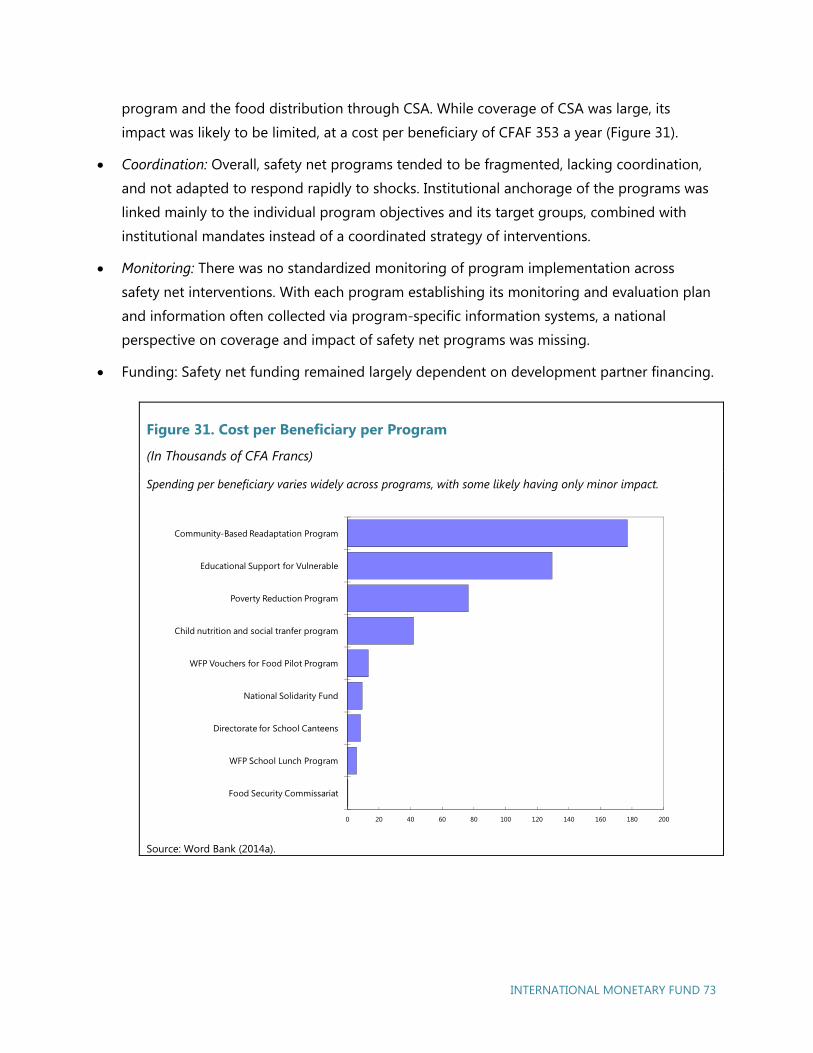
INTERNATIONAL MONETARY FUND 73
program and the food distribution through CSA. While coverage of CSA was large, its
impact was likely to be limited, at a cost per beneficiary of CFAF 353 a year (Figure 31).
Coordination: Overall, safety net programs tended to be fragmented, lacking coordination,
and not adapted to respond rapidly to shocks. Institutional anchorage of the programs was
linked mainly to the individual program objectives and its target groups, combined with
institutional mandates instead of a coordinated strategy of interventions.
Monitoring: There was no standardized monitoring of program implementation across
safety net interventions. With each program establishing its monitoring and evaluation plan
and information often collected via program-specific information systems, a national
perspective on coverage and impact of safety net programs was missing.
Funding: Safety net funding remained largely dependent on development partner financing.
Figure 31. Cost per Beneficiary per Program
(In Thousands of CFA Francs)
Spending per beneficiary varies widely across programs, with some likely having only minor impact.
Source: Word Bank (2014a).
0 20 40 60 80 100 120 140 160 180 200
Food Security Commissariat
WFP School Lunch Program
Directorate for School Canteens
National Solidarity Fund
WFP Vouchers for Food Pilot Program
Child nutrition and social tranfer program
Poverty Reduction Program
Educational Support for Vulnerable
Community-Based Readaptation Program
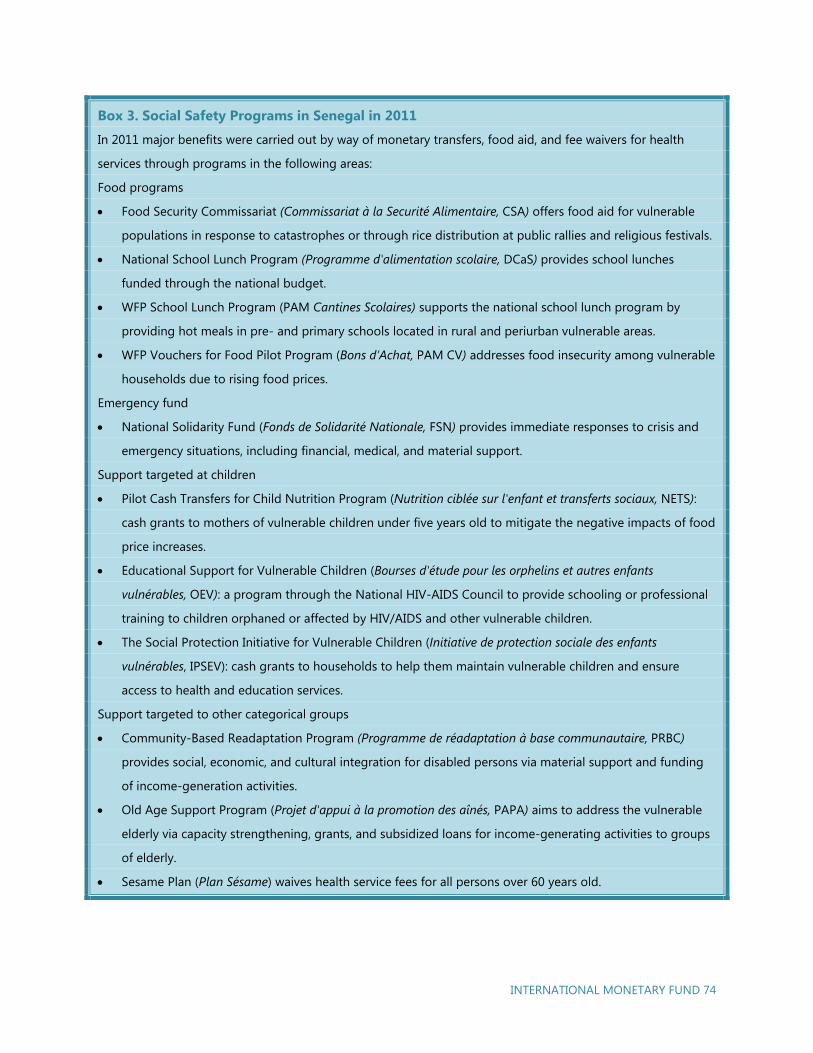
INTERNATIONAL MONETARY FUND 74
Box 3. Social Safety Programs in Senegal in 2011
In 2011 major benefits were carried out by way of monetary transfers, food aid, and fee waivers for health
services through programs in the following areas:
Food programs
Food Security Commissariat (Commissariat à la Securité Alimentaire, CSA) offers food aid for vulnerable
populations in response to catastrophes or through rice distribution at public rallies and religious festivals.
National School Lunch Program (Programme d'alimentation scolaire, DCaS) provides school lunches
funded through the national budget.
WFP School Lunch Program (PAM Cantines Scolaires) supports the national school lunch program by
providing hot meals in pre- and primary schools located in rural and periurban vulnerable areas.
WFP Vouchers for Food Pilot Program (Bons d’Achat, PAM CV) addresses food insecurity among vulnerable
households due to rising food prices.
Emergency fund
National Solidarity Fund (Fonds de Solidarité Nationale, FSN) provides immediate responses to crisis and
emergency situations, including financial, medical, and material support.
Support targeted at children
Pilot Cash Transfers for Child Nutrition Program (Nutrition ciblée sur l'enfant et transferts sociaux, NETS):
cash grants to mothers of vulnerable children under five years old to mitigate the negative impacts of food
price increases.
Educational Support for Vulnerable Children (Bourses d'étude pour les orphelins et autres enfants
vulnérables, OEV): a program through the National HIV-AIDS Council to provide schooling or professional
training to children orphaned or affected by HIV/AIDS and other vulnerable children.
The Social Protection Initiative for Vulnerable Children (Initiative de protection sociale des enfants
vulnérables, IPSEV): cash grants to households to help them maintain vulnerable children and ensure
access to health and education services.
Support targeted to other categorical groups
Community-Based Readaptation Program (Programme de réadaptation à base communautaire, PRBC)
provides social, economic, and cultural integration for disabled persons via material support and funding
of income-generation activities.
Old Age Support Program (Projet d'appui à la promotion des aînés, PAPA) aims to address the vulnerable
elderly via capacity strengthening, grants, and subsidized loans for income-generating activities to groups
of elderly.
Sesame Plan (Plan Sésame) waives health service fees for all persons over 60 years old.

INTERNATIONAL MONETARY FUND 75
Poverty Reduction Program (Programme d'appui à la mise en oeuvre de la Stratégie de Réduction de la
Pauvreté, PRP) supports grants for income-generating activities for vulnerable groups, primarily women,
the disabled, and HIV/AIDS–affected populations.
Renewed Efforts to Establish an Effective National Social
Protection System
Recently, the government has taken important steps to set up new institutional arrangements
and programs to strengthen Senegal’s social protection system:
Délégation Générale à la Protection Sociale et à la Solidarité Nationale (DGPSN): In 2012
DGPSN was established to help define social protection policy, implement social protection
programs, coordinate the National Social Protection Strategy, and participate in monitoring
its implementation. To help it play its role of overall leadership and coordination of the
social protection sector, an Inter-ministerial Steering Committee on Social Protection was
established, which includes both civil society and development partners.
Interministerial committee: The recently established framework includes an interministerial
committee with overall responsibility for formulation of the country’s social protection
strategy implementation. In addition, a technical steering committee is being established to
lead the efforts in terms of social safety net implementation at a technical level.
Programme National de Bourses de Sécurité Familiale: The government has launched this
effort, a conditional cash-transfer program that aims to provide support to the most
vulnerable households and to promote investments in human capital on a national scale.
The implementation of this program provides the basis for the definition of tools and
instruments (for targeting, registry, payment and monitoring, and evaluation) that can be
used by other social safety nets in the country. Started in October 2013, the program is
expected to reach 250,000 households by 2017.
Caisse Autonome de Protection Sociale Universelle: Work in progress also includes the setup
of an Autonomous Social Protection Fund, which would be responsible for organizing the
financing of social protection activities, such as universal health coverage, the national
conditional cash-transfer program, and pensions for the elderly. The fund, which is still in its
conceptual phase, would be responsible for mobilizing resources from a variety of sources,
such as individual premiums or contributions, government general resources, private sector
resources, special taxes, and contributions from development partners.
INTERNATIONAL MONETARY FUND 76
Recommendations to Further Consolidate the National
Social Protection System
The overall goal of the recommendations is to strengthen coordination between currently isolated
programs, improve their targeting, increase their coverage, and, more generally, improve the
ability of the national social protection system to effectively protect the most vulnerable and
respond to shocks.
Build synergies between existing individual programs to progress toward a unified national
safety net system. To move to a national safety net system would require building explicit
synergies between currently isolated programs. For example, households enrolled in cash-
transfer programs could be automatically eligible for health or education fee waivers, or
households participating in public works could be linked with income-generating projects,
microfinance, or other asset-building programs. Interoperable management information
systems across programs, as well as a central registry of vulnerable households, can provide an
important platform to promote connections between programs.
Strengthen collaboration between agencies and other key players. Currently, programs develop
their own local coordination mechanisms, with multiple committees and consultation
mechanisms—a common institutional platform would thus create synergies. Collaboration
could also expand to other relevant sectors, such as health and education services and natural
disaster management. Harmonization with external partners, including international agencies
and non-government organizations, can be improved through central-level coordination. The
newly formed DGPSN and the Inter-Ministerial Committee for the National Social Protection
Strategy have an important role to play to continue strengthening such collaboration.
Design a medium-term expenditure framework and integrate it into the budget process.
Moving from an individual program approach to a national safety system will require
developing an overall financial framework for the sector that prioritizes expenditures and builds
a sustainable funding basis for safety nets. Such a framework would help translate a national
safety strategy into public spending priorities within a multiyear macroeconomic and fiscal
framework integrated into the budget process. Central-level coordination will help underpin the
sustainability of the system. Furthermore, this effort can help rationalize existing programs—
redesigning (better targeting, more efficient management, and so on) or eliminating the least
effective ones.
Develop central monitoring and evaluation mechanisms that inform strategic decision making
INTERNATIONAL MONETARY FUND 77
and allow program evaluation. A key function of the DGPSN and Inter-Ministerial Committee is
to promote the use of rigorous data on various programs. This should help inform the design
and implementation of programs and make it possible to demonstrate their impact to political
decision makers, development partners, and civil society, thus enhancing global knowledge of
the social safety nets. To this end, it is important that each program develop its own
management information system to monitor and evaluate its implementation. It is also critical
that these program-specific management information systems be interoperable across
programs so that the coordinating agency can draw from these sources for its sector wide
analysis and facilitate targeting and coordination through a central registry of beneficiaries.
Improve targeting to reach the most vulnerable parts of the population. The targeting
methodology adopted for the national conditional cash-transfer program relies on a
combination of community-based targeting and the application of an objective proxy means
test that combines information on household characteristics, correlated with poverty and
vulnerability, to confirm their eligibility. In the coming years, it will be important to keep
improving on the methodology as new data become available and to ensure that all programs
improve their targeting of households. The development of a unique registry with ample
information on the most vulnerable households is an important step to help each program
efficiently apply its own selection criteria without having to replicate the data-collection effort.
Further strengthen the institutional framework. In the coming years, it is important for DGPSN
to develop its capacity to provide the leadership required for the coordination of the sector and
the implementation of the national strategy. In the future, given that cross-country evidence
suggests that coordination and implementation of specific programs are often separated with
maturing systems, DGPSN could focus its efforts on the overall leadership of the sector and the
implementation of the National Social Protection Strategy. It could thus oversee the
management of the sector and monitor implementation and results; the implementation of
programs would remain the responsibility of sectoral institutions.

INTERNATIONAL MONETARY FUND 79
Performance Under the
2011– 14 Policy Support
Instrument
Alexei Kireyev
Senegal has had two successive arrangements under the IMF’s Policy Support Instrument (PSI)
since 2007. This section focuses on Senegal’s performance under the latest PSI with respect to
three main areas: the overall macroeconomic performance, program conditionality and other
policy targets, and technical assistance. It concludes that the overall macroeconomic performance
has been below par but acceptable. The main PSI goals—higher growth and fiscal and debt
sustainability—were broadly achieved but with less favorable outcomes than initially
programmed; program performance has been mixed, with qualitative targets largely met but
substantial delays in structural reforms. In addition, Senegal has found the technical assistance
from the IMF to be useful, although there is scope for improvement in the implementation of the
IMF’s recommendations.
The 2011–14 PSI is the latest arrangement in a long history of IMF involvement in Senegal. At
the authorities’ request, the three-year PSI—approved by the Executive Board on December 3,
2010—was extended by one year during the Fifth Review, and it was set to expire on December
2, 2014. Under the PSI, Senegal has sought the IMF’s advice, monitoring, and endorsement of
the authorities’ policy framework without using the IMF’s financial assistance.
Senegal’s PSI was based on country-owned poverty-reduction strategies. For the initial
implementation period, the PSI was aligned with the projections underlying the second Poverty
Reduction Strategy (PRSP-II 2006–10), including an updated macroeconomic framework for
2011–15. In mid-2012 the authorities finalized their National Strategy of Economic and Social
Development (NSESD), which outlined policies and reforms for 2013–17 and became the new
national strategy supported by the PSI. The NSESD devised policies required to push forward
the authorities’ agenda for high, sustained, and inclusive growth and poverty reduction.
7
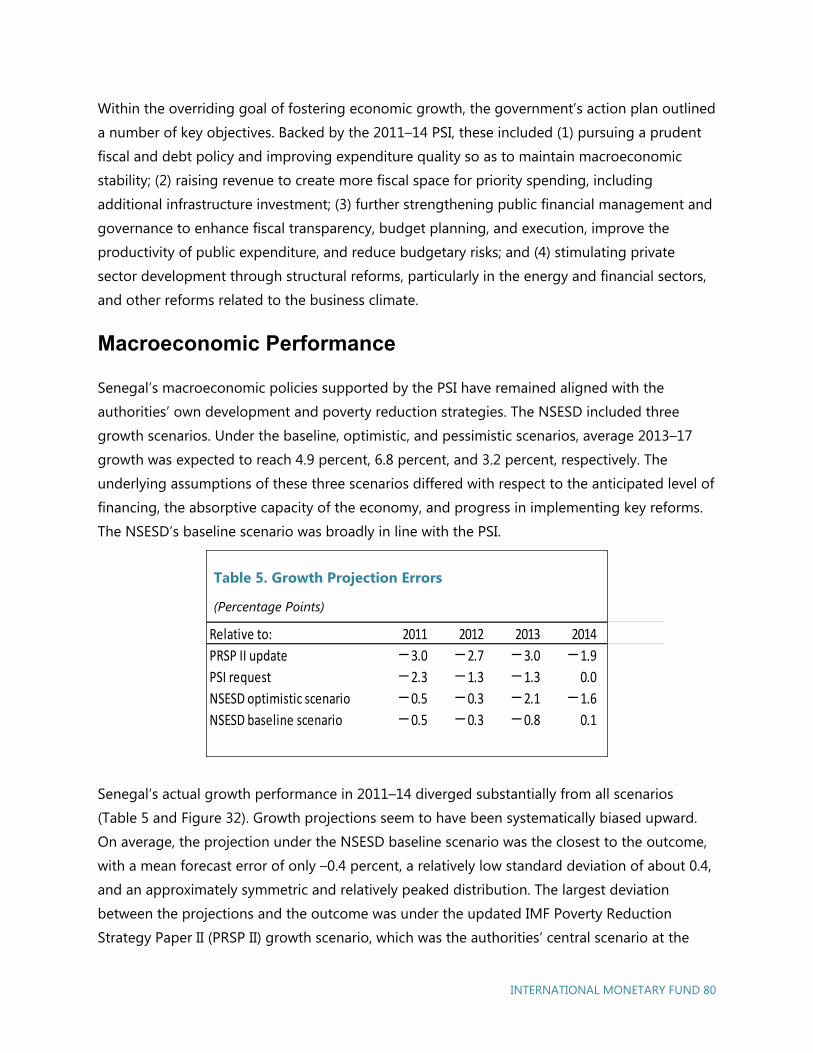
INTERNATIONAL MONETARY FUND 80
Within the overriding goal of fostering economic growth, the government’s action plan outlined
a number of key objectives. Backed by the 2011–14 PSI, these included (1) pursuing a prudent
fiscal and debt policy and improving expenditure quality so as to maintain macroeconomic
stability; (2) raising revenue to create more fiscal space for priority spending, including
additional infrastructure investment; (3) further strengthening public financial management and
governance to enhance fiscal transparency, budget planning, and execution, improve the
productivity of public expenditure, and reduce budgetary risks; and (4) stimulating private
sector development through structural reforms, particularly in the energy and financial sectors,
and other reforms related to the business climate.
Macroeconomic Performance
Senegal’s macroeconomic policies supported by the PSI have remained aligned with the
authorities’ own development and poverty reduction strategies. The NSESD included three
growth scenarios. Under the baseline, optimistic, and pessimistic scenarios, average 2013–17
growth was expected to reach 4.9 percent, 6.8 percent, and 3.2 percent, respectively. The
underlying assumptions of these three scenarios differed with respect to the anticipated level of
financing, the absorptive capacity of the economy, and progress in implementing key reforms.
The NSESD’s baseline scenario was broadly in line with the PSI.
Table 5. Growth Projection Errors
(Percentage Points)
Senegal’s actual growth performance in 2011–14 diverged substantially from all scenarios
(Table 5 and Figure 32). Growth projections seem to have been systematically biased upward.
On average, the projection under the NSESD baseline scenario was the closest to the outcome,
with a mean forecast error of only –0.4 percent, a relatively low standard deviation of about 0.4,
and an approximately symmetric and relatively peaked distribution. The largest deviation
between the projections and the outcome was under the updated IMF Poverty Reduction
Strategy Paper II (PRSP II) growth scenario, which was the authorities’ central scenario at the
Relative to: 2011 2012 2013 2014
PRSP II update -3.0 -2.7 -3.0 -1.9
PSI request -2.3 -1.3 -1.3 0.0
NSESD optimistic scenario -0.5 -0.3 -2.1 -1.6
NSESD baseline scenario -0.5 -0.3 -0.8 0.1
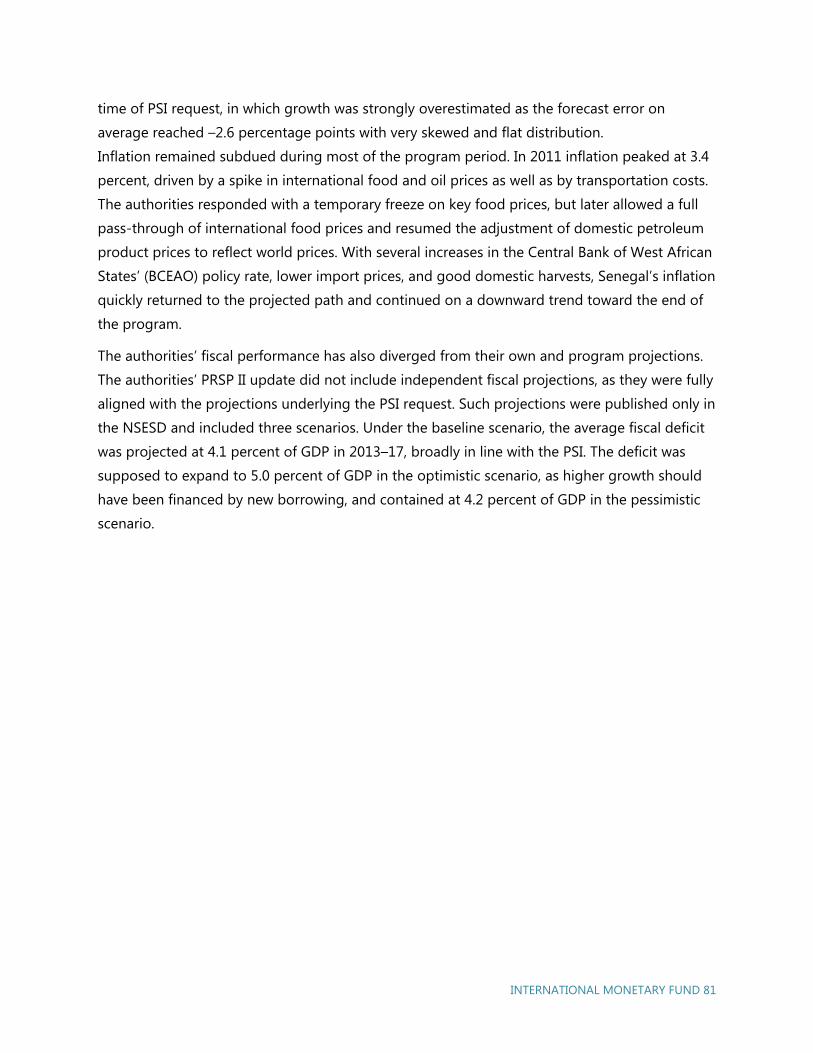
INTERNATIONAL MONETARY FUND 81
time of PSI request, in which growth was strongly overestimated as the forecast error on
average reached –2.6 percentage points with very skewed and flat distribution.
Inflation remained subdued during most of the program period. In 2011 inflation peaked at 3.4
percent, driven by a spike in international food and oil prices as well as by transportation costs.
The authorities responded with a temporary freeze on key food prices, but later allowed a full
pass-through of international food prices and resumed the adjustment of domestic petroleum
product prices to reflect world prices. With several increases in the Central Bank of West African
States’ (BCEAO) policy rate, lower import prices, and good domestic harvests, Senegal’s inflation
quickly returned to the projected path and continued on a downward trend toward the end of
the program.
The authorities’ fiscal performance has also diverged from their own and program projections.
The authorities’ PRSP II update did not include independent fiscal projections, as they were fully
aligned with the projections underlying the PSI request. Such projections were published only in
the NSESD and included three scenarios. Under the baseline scenario, the average fiscal deficit
was projected at 4.1 percent of GDP in 2013–17, broadly in line with the PSI. The deficit was
supposed to expand to 5.0 percent of GDP in the optimistic scenario, as higher growth should
have been financed by new borrowing, and contained at 4.2 percent of GDP in the pessimistic
scenario.
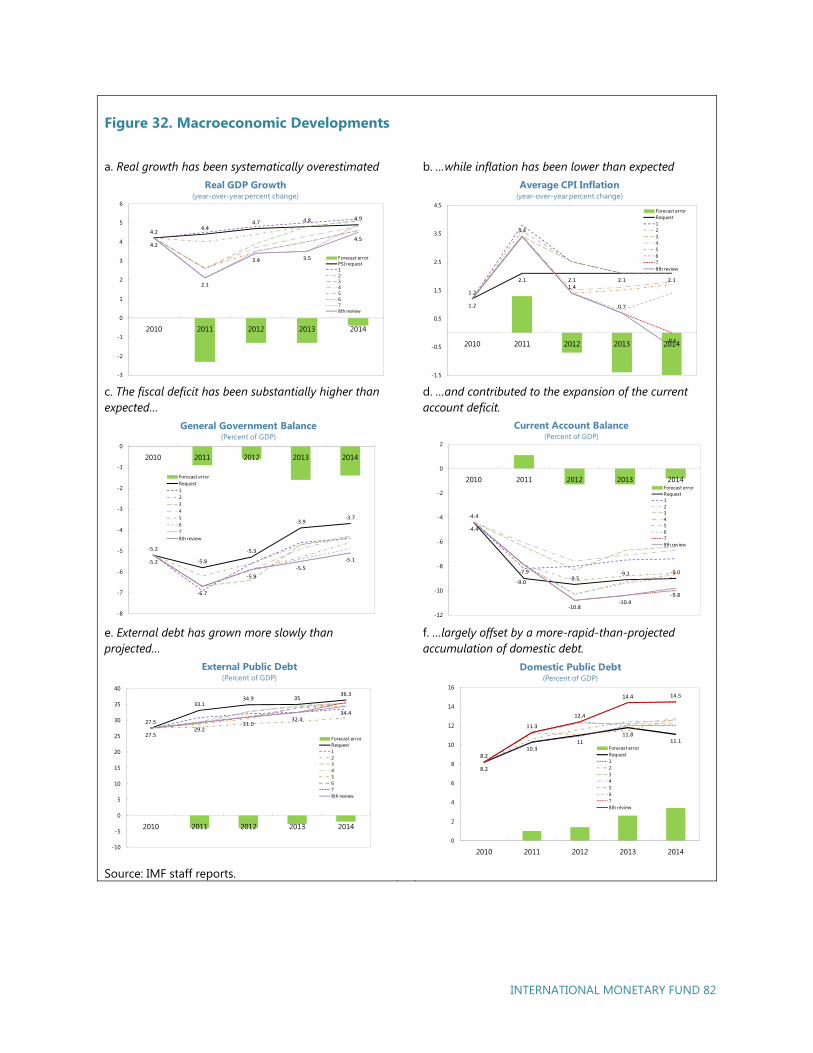
INTERNATIONAL MONETARY FUND 82
Figure 32. Macroeconomic Developments
a. Real growth has been systematically overestimated b. …while inflation has been lower than expected
c. The fiscal deficit has been substantially higher than expected…
d. …and contributed to the expansion of the current account deficit.
e. External debt has grown more slowly than projected…
f. …largely offset by a more-rapid-than-projected accumulation of domestic debt.
Source: IMF staff reports.
4.24.4
4.7 4.8 4.9
4.2
2.1
3.4 3.5
4.5
-3
-2
-1
0
1
2
3
4
5
6
2010 2011 2012 2013 2014
Forecast errorPSI request 12345678th review
Real GDP Growth(year-over-year percent change)
1.2
2.1 2.1 2.1 2.1
1.2
3.4
1.4
0.7
-0.5
-1.5
-0.5
0.5
1.5
2.5
3.5
4.5
2010 2011 2012 2013 2014
Forecast errorRequest 12345678th review
Average CPI Inflation(year-over-year percent change)
-5.2
-5.8
-5.3
-3.9-3.7
-5.2
-6.7
-5.9
-5.5
-5.1
-8
-7
-6
-5
-4
-3
-2
-1
0
2010 2011 2012 2013 2014
Forecast errorRequest 12345678th review
General Government Balance(Percent of GDP)
-4.4
-9.0-9.5
-9.1 -9.0
-4.4
-7.9
-10.8-10.4
-9.8
-12
-10
-8
-6
-4
-2
0
2
2010 2011 2012 2013 2014Forecast errorRequest 12345678th review
Current Account Balance(Percent of GDP)
27.5
33.134.9 35
36.3
27.529.2
31.032.4
34.4
-10
-5
0
5
10
15
20
25
30
35
40
2010 2011 2012 2013 2014
Forecast errorRequest 12345678th review
External Public Debt(Percent of GDP)
8.2
10.311
11.811.1
8.2
11.3
12.4
14.4 14.5
0
2
4
6
8
10
12
14
16
2010 2011 2012 2013 2014
Forecast errorRequest 12345678th review
Domestic Public Debt(Percent of GDP)
INTERNATIONAL MONETARY FUND 83
By mid-2014, neither of the fiscal scenarios was in line with projections. On average, the
smallest mean errors were observed under both NSESD scenarios. The actual deficit was
substantially better than projected, compared with the optimistic scenario (by an average of 0.3
percent of GDP). At the same time, the deficit was considerably higher, compared with both the
NSESD baseline scenario and the PSI request scenario, on average by 0.4 and 1.1 percent of
GDP, respectively. This suggests that neither the baseline scenario nor the optimistic scenario
was realistic from the outset.
The divergence of fiscal projections from targets was driven by forecasting weaknesses of both
revenue and expenditure (Figure 33). Tax and nontax revenue underperformed on average by
0.5 percent of GDP during the program period. This one-sided error in revenue projections
points to systematic revenue overestimation. The opposite is true for expenditures, which have
been systematically underestimated by about 1.5 percent of GDP on average. As a result of this
and the protracted revenue shortfalls and expenditure underestimations, the authorities had to
make fiscal adjustments of about 2 percent of GDP each year on average in order to meet the
fiscal deficit target during the program period. This, in turn, led to high volatility in government
investment, which carried substantial burden in the adjustment
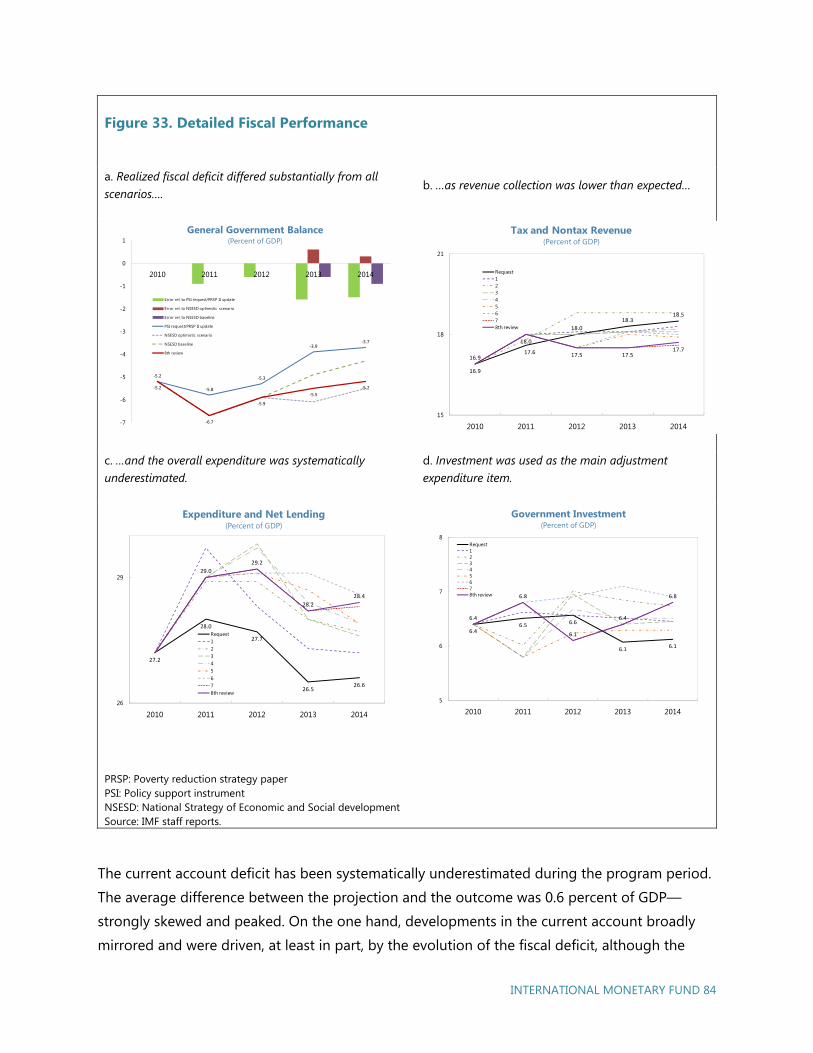
INTERNATIONAL MONETARY FUND 84
Figure 33. Detailed Fiscal Performance
a. Realized fiscal deficit differed substantially from all scenarios….
b. …as revenue collection was lower than expected…
c. …and the overall expenditure was systematically underestimated.
d. Investment was used as the main adjustment expenditure item.
PRSP: Poverty reduction strategy paper PSI: Policy support instrument NSESD: National Strategy of Economic and Social development Source: IMF staff reports.
The current account deficit has been systematically underestimated during the program period.
The average difference between the projection and the outcome was 0.6 percent of GDP—
strongly skewed and peaked. On the one hand, developments in the current account broadly
mirrored and were driven, at least in part, by the evolution of the fiscal deficit, although the
-5.2
-5.8
-5.3
-3.9-3.7
-5.2
-6.7
-5.9
-5.5
-5.2
-7
-6
-5
-4
-3
-2
-1
0
1
2010 2011 2012 2013 2014
Error rel. to PSI request/PRSP II update
Error rel. to NSESD optimistic scenario
Error rel. to NSESD baseline
PSI request/PRSP II update
NSESD optimistic scenario
NSESD baseline
8th review
General Government Balance(Percent of GDP)
16.917.6
18.0
18.318.5
16.9
18.0
17.5 17.517.7
15
18
21
2010 2011 2012 2013 2014
Request 12345678th review
Tax and Nontax Revenue(Percent of GDP)
27.2
28.0
27.7
26.526.6
29.0
29.2
28.2
28.4
26
29
2010 2011 2012 2013 2014
Request 12345678th review
Expenditure and Net Lending(Percent of GDP)
6.46.5 6.6
6.16.1
6.4
6.8
6.1
6.4
6.8
5
6
7
8
2010 2011 2012 2013 2014
Request 12345678th review
Government Investment(Percent of GDP)
INTERNATIONAL MONETARY FUND 85
divergence from the baseline in the current account was somewhat lower. On the other hand,
during the program period, Senegal was hit by exogenous shocks, related mainly to sharp
increases in imported food and oil prices, and regional geopolitical tensions, which also
contributed to the expansion of the current account deficit. The private sector offset at least
part of these exogenous shocks by adjusting its saving investment balance accordingly.
Finally, the rate of accumulation of domestic public debt has been higher than program
projections. The overall average deviation from the projections is relatively small—about 0.7
percent of GDP—and the trajectory of the overall debt accumulation was below the projected
trend during the first half of the program. However, it substantially exceeded the projected level
toward the end. External debt accumulation was substantially lower than projected, by about
2.8 percent of GDP on average each year. It was explained mainly by the authorities’ prudent
policies, low availability of concessional financing, and conditionality on external debt included
in the PSI. At the same time, the authorities extensively used domestic and regional financing,
which led to rapid domestic debt accumulation at a rate exceeding the baseline projections by
2.1 percent of GDP.
Several factors may explain the systematic deviations of key macroeconomic variables from
their projected path during the 2011–14 PSI.
First, protracted delays in key structural reforms: Higher growth, strong revenue collection,
and lower fiscal deficits required ambitious structural reforms. Most structural reforms—in
particular, related to the energy sector and public financial management—have been
delayed, scaled down, or implemented inconsistently, which weighed heavily on growth and
revenue.
Second, systematic upward biases in the authorities’ macroeconomic projections: In the recent
past, growth was projected to exceed its historically observed averages and even the
empirically estimated potential. To achieve such ambitious growth rates would have
required either a substantial increase in total factor productivity, for which the potential is
limited without a profound economic modernization, or new labor and capital, which is held
back by the lack of productive employment opportunities and financial constraints.
Third, an external environment less favorable than anticipated: Senegal was negatively
affected by several oil and food price increases in international markets, which led to both
lower growth and unanticipated increases in fiscal subsidies. At the regional level,
Senegalese export demand was somewhat affected by regional crises in Côte d’Ivoire and
Mali.
INTERNATIONAL MONETARY FUND 86
Finally, the domestic political cycle did not allow for the vigorous pursuit of reforms that could
have had social impact. For almost a year ahead of the March 2012 presidential elections
and for several months ahead of the June 2014 local elections, most structural reforms
moved ahead much more slowly than anticipated, and the most critical were postponed
until the postelection period.
Program Performance
Senegal’s performance under the 2011–14 PSI program has been satisfactory (Figure 34). After
initial difficulties in meeting the assessment criteria during the first half of the program period,
program implementation improved during the second half. The quantitative assessment criteria
were largely met, and only 3 out of 48 quantitative assessment criteria were missed, in both
cases by small margins. Specifically, the authorities missed (1) the assessment criteria (AC) on
the basic fiscal deficit by 0.2 percent of GDP because of lower-than-projected oil revenue (First
Review), (2) the overall fiscal deficit target by 0.4 percent of GDP because of administrative
weaknesses leading to expenditure overruns (Third Review), and (3) the ceiling on
nonconcessional borrowing by 0.4 percent of GDP due to the failure to classify properly a loan
with an 11 percent grant element as nonconcessional (Eighth Review).
The authorities’ capacity to control expenditure strengthened during the program period,
although serious deficiencies remain. Fiscal deficit targets have been met—however, always at
the expense of curtailing expenditure, mainly domestically financed investment, toward year
end. At the same time, weaknesses in revenue collection have persisted, and the indicative floor
on tax revenue was missed by 1.3 percent of GDP during the Seventh Review. The indicative
ceiling on the share of public contracts signed by a single tender was missed by a small margin
at the Fifth Review, reflecting mainly coordinating difficulties in the procurement process.
The implementation of structural reforms has been uneven. Of the 35 structural measures
included in the program, about three-quarters have been implemented either on time or with
delays. However, the remaining measures either have not been done or were dropped
altogether. All measures aimed at controlling the fiscal deficit, improving tax revenue, and
enhancing the quality of expenditure and of debt management have been broadly
implemented, although some with substantial delays. This was especially the case for the public
financial management (PFM) during the program’s second half. The single treasury account has
not yet been implemented, and the continuous benchmark on the cost-benefit analysis of the
creation of new agencies was missed. Because no new projects exceeding CFAF 10 billion were
included in the 2014 budget, the benchmark on their cost-benefit assessment could not be met,
INTERNATIONAL MONETARY FUND 87
while the rollout of the new payroll software was met with a substantial delay. Structural
problems persisted in the area of private sector development, business climate, investment, and
infrastructure. Most were related to delays in reforms to the energy sector, electricity subsidies,
and other infrastructure investment.
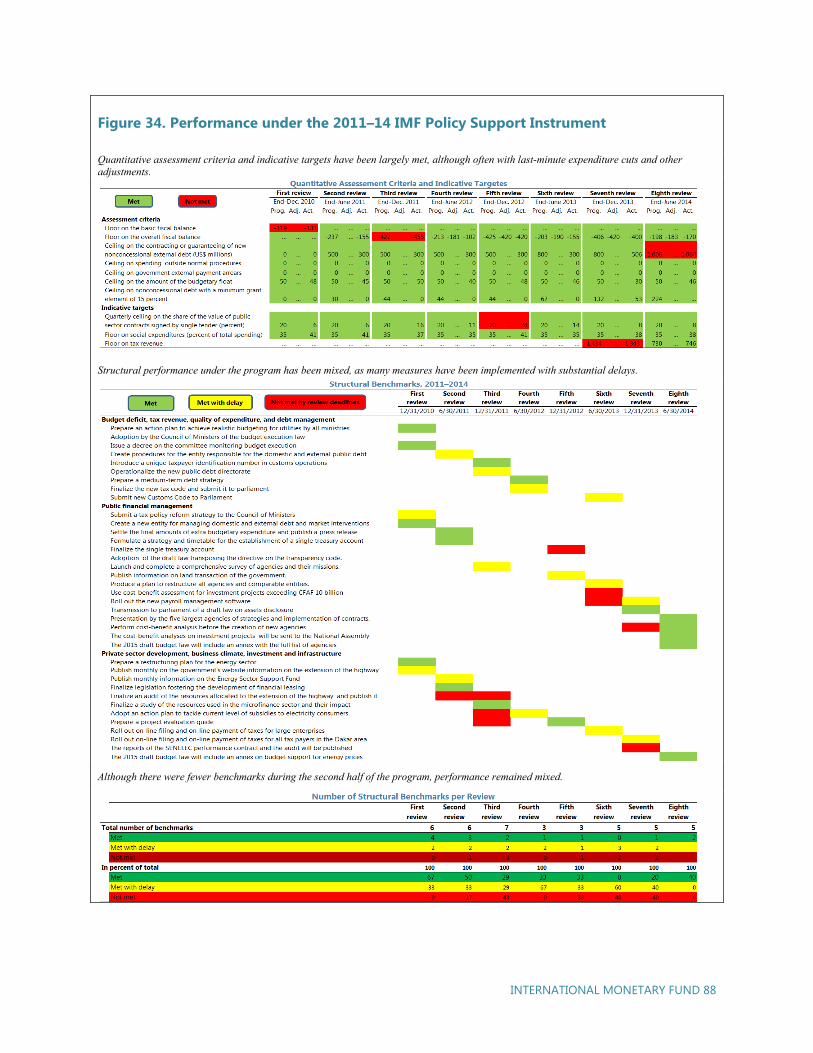
INTERNATIONAL MONETARY FUND 88
Figure 34. Performance under the 2011–14 IMF Policy Support Instrument
Quantitative assessment criteria and indicative targets have been largely met, although often with last-minute expenditure cuts and other adjustments.
Structural performance under the program has been mixed, as many measures have been implemented with substantial delays.
Although there were fewer benchmarks during the second half of the program, performance remained mixed.
INTERNATIONAL MONETARY FUND 89
PSI design and conditionality has appropriately focused on areas of IMF expertise and critical
importance for Senegal. The program has been mainly fiscal in nature, targeting both fiscal and
debt sustainability. At the First Review, the main program AC was changed from the basic
balance to the overall fiscal balance because of an increased focus on debt sustainability. To
address difficulties with revenue collection, an indicative target on tax revenue was introduced
at the Sixth Review. At the same time, substantial flexibility has been built into the program by
way of adjustors on the fiscal deficit to allow the full use of all concessional financing. The
ceilings on nonconcessional and semiconcessional external financing have been increased
several times to allow Senegal to make full use of additional resources to finance investment in
macrocritical areas, such as energy and infrastructure.
Technical Assistance
During the 2011–14 PSI, Senegal has been a high-intensity user of the IMF’s technical assistance
(TA; Figure 35). In terms of years of staff/expert time (full-time equivalent, FTE), Senegal ranked
in the top quartile among sub-Saharan African countries, with an average of 2.2 years of TA
provided during the PSI program period. In terms of volume, TA to Senegal substantially
exceeded that to all other West African Economic and Monetary Union (WAEMU) countries,
with the exception of Togo, and was comparable to the TA provided by the IMF to the
Democratic Republic of the Congo, Mozambique, and Nigeria. Compared with those of an
average sub-Saharan African country, Senegalese officials received more training provided by
the IMF’s Institute for Capacity Development.
The IMF’s TA to Senegal has focused on several priority areas. About 90 percent was devoted—
directly or indirectly—to public finances, compared with 50 percent in other sub-Saharan
African countries. To strengthen Senegal’s public financial management (PFM), the IMF’s TA has
focused on reinforcing budget accounting, improving the coverage and timeliness of fiscal
reporting, strengthening cash management, establishing a single treasury account, and
implementing the new WAEMU PFM directives. Priorities in the TA related to tax policy have
included support for the development of a new tax code, reforms to the value-added tax (VAT),
particularly the VAT credit system and exemptions, the personal income tax, and the taxation of
the banking system. Reforms in tax and customs administration have been geared toward
modernizing their functional structures (for example, establishment of a medium-size taxpayers’
office in Dakar) and strengthening risk-based audits to improve compliance. TA on debt
management has contributed to the establishment of a single debt-management unit in the
Ministry of Finance and the development of a new debt-management strategy. Finally, Senegal
has continued to strengthen its macroeconomic statistics, including the production of quarterly
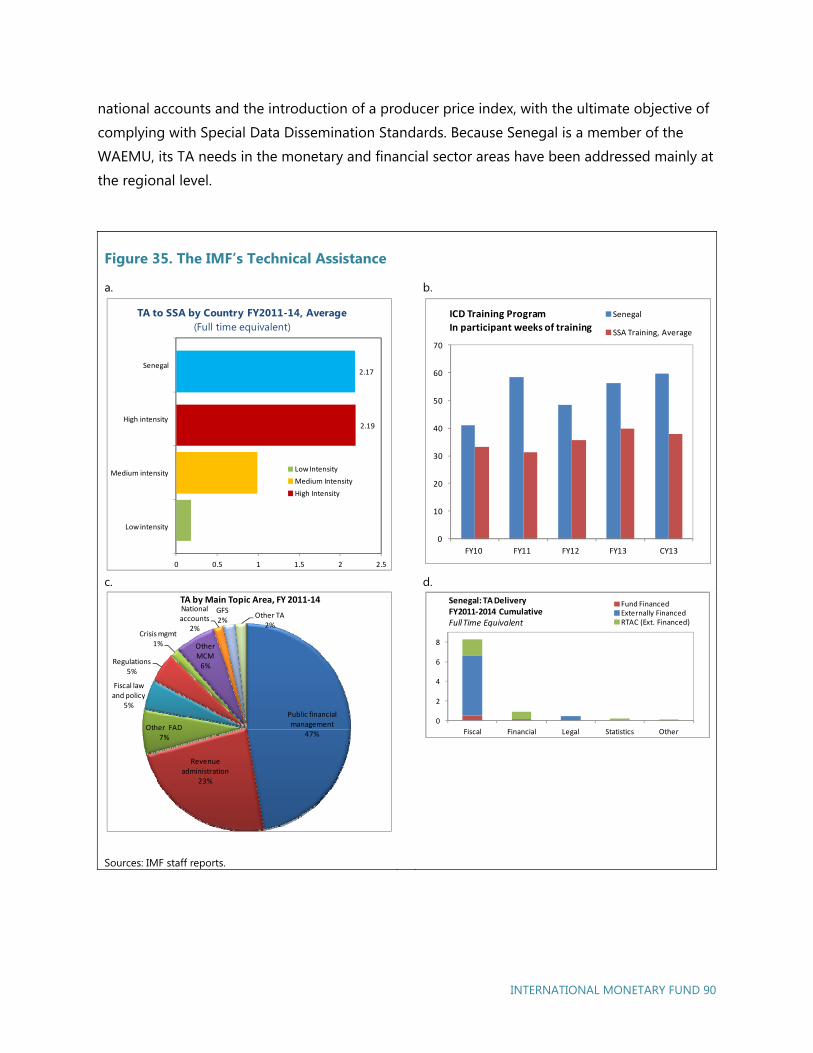
INTERNATIONAL MONETARY FUND 90
national accounts and the introduction of a producer price index, with the ultimate objective of
complying with Special Data Dissemination Standards. Because Senegal is a member of the
WAEMU, its TA needs in the monetary and financial sector areas have been addressed mainly at
the regional level.
Figure 35. The IMF’s Technical Assistance
a. b.
c. d.
Sources: IMF staff reports.
2.19
2.17
0 0.5 1 1.5 2 2.5
Low intensity
Medium intensity
High intensity
Senegal
TA to SSA by Country FY2011-14, Average(Full time equivalent)
Low Intensity
Medium Intensity
High Intensity
0
10
20
30
40
50
60
70
FY10 FY11 FY12 FY13 CY13
ICD Training Program
In participant weeks of training
Senegal
SSA Training, Average
Public financial management
47%
Revenue administration
23%
Other FAD7%
Fiscal law and policy
5%
Regulations5%
Crisis mgmt1% Other
MCM6%
National accounts
2%
GFS2%
Other TA2%
TA by Main Topic Area, FY 2011-14
0
2
4
6
8
Fiscal Financial Legal Statistics Other
Senegal: TA Delivery FY2011-2014 CumulativeFull Time Equivalent
Fund FinancedExternally FinancedRTAC (Ext. Financed)
INTERNATIONAL MONETARY FUND 91
Conclusions
Senegal’s macroeconomic performance under the PSI-supported program was satisfactory. Key
program goals—growth, fiscal and debt sustainability—were achieved and the overall
macroeconomic stability preserved, although outcomes were less favorable than initially
programmed. Consequently, the achieved growth rate and fiscal policies were not sufficient to
make a visible dent in poverty reduction and improve other social indicators. While the
authorities’ own growth and poverty-reduction strategies had set the appropriately high targets
to achieve the desired growth and fiscal and social outcomes, the projections turned out to be
excessively ambitious and inconsistent with historically observed trends. Unrealistic
expectations have led to systematic upward biases in program projections of key
macroeconomic variables.
Senegal’s performance under the PSI-supported program was an important guiding post for
domestic reforms and their external support. The satisfactory macroeconomic performance and
the compliance with key quantitative assessment criteria were somewhat overshadowed by slow
program implementation on the structural side. There is a strong case for continued active
cooperation between the IMF and Senegal, either in a program or regular surveillance context.
The IMF’s technical assistance to Senegal has been helpful in accompanying important reforms.
The priority areas should remain broadly the same, but more emphasis is needed on
implementation and follow-up on earlier advice. Tax collection and expenditure rationalization
are the two priority TA areas for the short term that could contribute to more manageable fiscal
performance, reduce the need for disruptive ad hoc adjustments, and improve overall fiscal
predictability. Additional TA in public debt management, strategic fiscal policy, and PFM issues
will be needed. Emphasis on public investment management may be called for in view of the
planned increase in infrastructure spending under the PSE.

INTERNATIONAL MONETARY FUND 93
References
Ajodhia, V., W. Mulder, and T. Slot. 2012. Tariff Structures for Sustainable Electrification in Africa.
Arnhem, Netherlands: KEMA.
Arze del Granado, J., D. Coady, and R. Gillingham. 2010. “The Unequal Benefits of Fuel Subsidies:
A Review of Evidence for Developing Countries.” IMF Working Paper 10/202, International
Monetary Fund, Washington. http://www.imf.org/external/pubs/ft/wp/2010/wp10202.pdf.
Agence Nationale de la Statistique et de la Démographie. 2013. Enquête Nationale Sur le
Secteur Informel au Sénégal (ENSIS 2011).
Berg, A., J. Ostry, and J. Zettelmeyer. 2012. “What Makes Growth Sustained?” Journal of
Development Economics 98: 149–66.
Dabla-Norris, Era, Jim Brumby, Annette Kyobe, Zac Mills, and Chris Papageorgiou. 2011.
“Investing in Public Investment Efficiency.” IMF Working Paper 11/37, International
Monetary Fund, Washington.
Hausmann, R., L. Pritchett, and D. Rodrik. 2005. “Growth Accelerations.” Journal of Economic
Growth 10: 303–29.
Henn, Christian, Chris Papageorgiou, and Nikola Spatafora. 2013. “Export Quality in Developing
Countries.” IMF Working Paper 13/108, International Monetary Fund, Washington.
Ilzetzki, E., E. G. Mendoza, and C. A. Végh. 2010. “How Big (Small) Are Fiscal Multipliers?”
Working Paper 16479, National Bureau of Economic Research, Cambridge, Massachusetts.
International Monetary Fund (IMF). 2013. Energy Subsidy Reform: Lessons and Implications, IMF
Policy Paper. Washington, January.
https://www.imf.org/external/np/pp/eng/2013/012813.pdf.
———. 2014a. Budget Institutions in G-20 Countries: An Update. Washington, May.
http://www.imf.org/external/np/sec/pr/2014/pr14233.htm.
INTERNATIONAL MONETARY FUND 94
———. 2014b. Sustaining Long-Run Growth and Macroeconomic Stability in Low-Income
Countries—The Role of Structural Transformation and Diversification—Background Notes.
Washington, March. http://www.imf.org/external/np/pp/eng/2014/030514a.pdf.
———. 2014c. West African Economic and Monetary Union. Staff Report on Common Policies for
Member Countries. Washington, March.
http://www.imf.org/external/pubs/ft/scr/2014/cr1484.pdf.
Kraay, A. 2010. “How Large Is the Government Spending Multiplier? Evidence from World Bank
Lending.” Policy Research Working Paper 5500, World Bank, Washington.
Mauro, P. 2011. Chipping Away at the Public Debt—Sources of Failure and Keys to Success in
Fiscal Adjustment. Hoboken, New Jersey: John Wiley and Sons.
Ricci, L., G.-M. Milesi-Ferretti, and J. Lee. 2008. “Real Exchange Rates and Fundamentals: A
Cross-Country Perspective.” IMF Working Paper 08/13, International Monetary Fund,
Washington.
Spilimbergo, A., S. Symansky, and M. Schindler. 2009. “Fiscal Multipliers.” Staff Position Note
09/11, International Monetary Fund, Washington.
Tokarick, S. 2010. “A Method for Calculating Export Supply and Import Demand Elasticities.” IMF
Working Paper 10/180, International Monetary Fund, Washington.
Vitek, F. 2012. Exchange Rate Assessment Tools for Advanced, Emerging, and Developing
Economies. Washington: International Monetary Fund.
World Bank. 2008. Senegal – Poverty Assessement. Report No. 44455-SN. Washington
———. 2014a. “Republic of Senegal: Social Safety Net Assessment.” Washington.
———. 2014b. “International Development Association Project Appraisal Document on a
Proposed Credit in the Amount of SDR 26.20 Million (US$40.50 Million Equivalent) to the
Republic of Senegal for a Social Safety Net Project.” Washington.
———. 2013. “Doing Business Indicators.” Washington. http://www.doingbusiness.org.

Top Related