


Languages
Pages
Legal


A0. Basic Data
1 2
Working days (days /year) 300 300
Effective working days (days /years) 270 270
Production volume (dozens) 2,700 2,925
The amount of defects (dozens) 135 146.25
The amount of sales (dozens) 2,565 2,779
Total sales ($/year) 21,803 23,619
Commission fee (10%) 2,180 2,362
Net sales 19,622 21,257
Repair & maintenance cost ($/year) 3,750 3,750
Material costs 5,265 5,704
Labor costs 2,194 2,377
Energy costs 1,316 1,426
Depreciation charge ($/year) 4,400 4,400
A1. Profit and Loss Account
1 2
1. Net sales ($) 19,622 21,257
2. Costs of production ($)
◦ Material costs 5,265 5,704
◦ Labor costs 2,194 2,377
◦ Energy costs 1,316 1,426
◦ Repair & maintenance 3,750 3,750
◦ Depreciation charge 4,400 4,400
◦ General & adm expences 1500 1500
Total production cost 18,425 19,156
3. Gross profit ($) 1,197 2,101
4. Income tax 20 % 239.45 420.2375
5. Net profit ($) 958 1,681
A4. Internal Rate of Return Capital Outlay Cash Proceed
($) ($)
0
1
Year
Description Year
Description Year

2
3
4
5
5
Total
2. Produtivity of Capital ($/$)
Index of Productivity of Capital

A2. Cashflow ProjectionDescription
3 4 5 1. Initial cash ($)
300 300 300 2. Cash in ($)
270 270 270 . Net sales
3150 3195 3240 . Share
157.5 159.75 162 . Other
2,993 3,035 3,078 Total cash in
25,436 25,800 26,163 3. Cash out ($)
2,544 2,580 2,616 ◦ Machinery purchase
22,893 23,220 23,547 ◦ Materials
3,750 3,750 3,750 ◦ Labor
6,143 6,230 6,318 ◦ Energy
2,559 2,596 2,633 ◦ Repair & maintenance
1,536 1,558 1,580 ◦ General & adm exp.
4,400 4,400 4,400 ◦ Income tax payment
Total cash out
4. Balance ($)
3 4 5 A3. Net Present Value (NPV)22,889 23,220 23,547
6,143 6,230 6,318 0
2,559 2,596 2,633 1
1,536 1,558 1,580 2
3,750 3,750 3,750 3
4,400 4,400 4,400 4
1500 1500 1500 5
19,888 20,034 20,180
3,002 3,186 3,367 Total
600 637 673
2,402 2,549 2,694
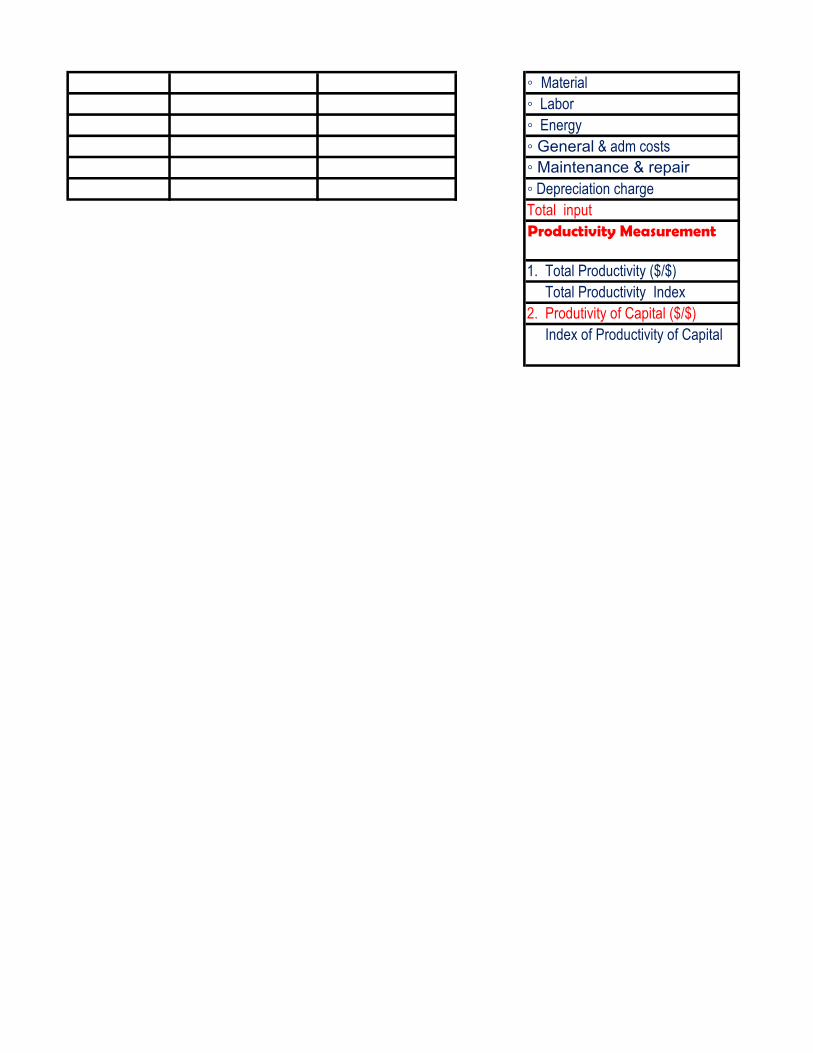
A5. Productivity of CapitalNet Cash Present Value at
($) 12%
Output ($)
Input ($)
Description Present Value at
15 %
Year
Year
Year

◦ Material
◦ Labor
◦ Energy
◦ General & adm costs
◦ Maintenance & repair
◦ Depreciation charge
Total input
Productivity Measurement
1. Total Productivity ($/$)
Total Productivity Index
2. Produtivity of Capital ($/$)
Index of Productivity of Capital

A2. Cashflow Projection0 1 2 3
2,000 2,000 7,358 13,439
- 19,622 21,257 22,889
25,000 -
- -
27,000 21,622 28,615 36,328
25,000 - - -
- 5,265 5,704 6,143
- 2,194 2,377 2,559
- 1,316 1,426 1,536
- 3,750 3,750 3,750
- 1500 1500 1500
- 239.45 420.2375 600
25,000 14,264 15,176 16,088
2,000 7,358 13,439 20,240
A3. Net Present Value (NPV)Capital Outlay Cash Proceed Net Cash
($) ($) ($)
25,000 0 2,000 2000
14,264 5,358 7,358 6569
15,176 6,081 13,439 10713
16,088 6,802 20,240 14407
16,271 6,949 27,189 17279
16,453 7,094 34,283 19453
103,252 32,283 104,509 70,422
A5. Productivity of Capital
1 2 3 4
19,622 21,257 22,889 23,220
Year
Present Value at 12
%

5,265 5,704 6,143 6,230
2,194 2,377 2,559 2,596
1,316 1,426 1,536 1,558
1500 1500 1500 1500
3,750 3,750 3,750 3,750
4,400 4,400 4,400 4,400
18,425 19,156 19,888 20,034
1.06 1.11 1.15 1.16
1.49 1.62 1.74 1.77

4 5
20,240 27,189
23,220 23,547
43,460 50,736
- -
6,230 6,318
2,596 2,633
1,558 1,580
3,750 3,750
1500 1500
637 673
16,271 16,453
27,189 34,283
0.12
Present Value at df 12 % df 15 %
15% 1 1.0000
2000 0.892857143 0.8696
6398 0.797193878 0.7561
10162 0.711780248 0.6575
13308 12 0.635518078 0.5718
15545 15 0.567426856 0.4972
17045 3
irr
64,458
$43,464.21 $35,965.22
45,422 39,458
5
23,547
Year

6,318
2,633
1,580
1500
3,750
4,400
20,180
1.17
1.79
0.15
5,963
11.81
35.43
47.43
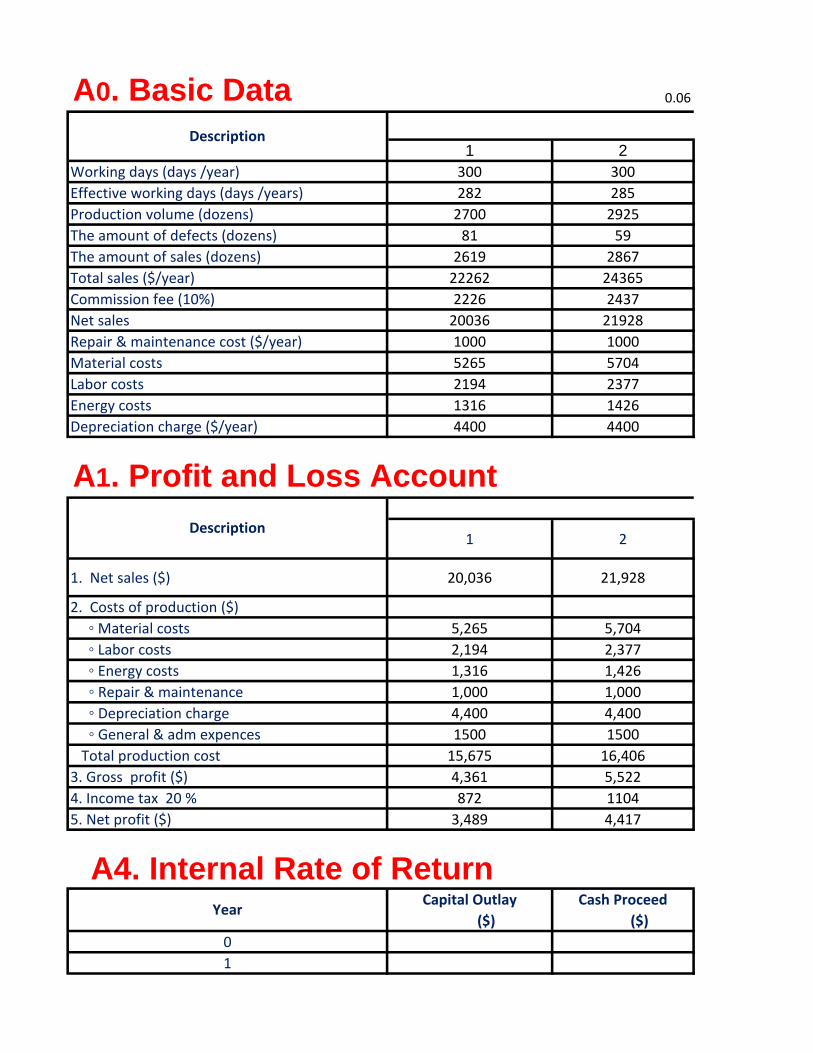
A0. Basic Data 0.06
1 2
Working days (days /year) 300 300
Effective working days (days /years) 282 285
Production volume (dozens) 2700 2925
The amount of defects (dozens) 81 59
The amount of sales (dozens) 2619 2867
Total sales ($/year) 22262 24365
Commission fee (10%) 2226 2437
Net sales 20036 21928
Repair & maintenance cost ($/year) 1000 1000
Material costs 5265 5704
Labor costs 2194 2377
Energy costs 1316 1426
Depreciation charge ($/year) 4400 4400
A1. Profit and Loss Account
1 2
1. Net sales ($) 20,036 21,928
2. Costs of production ($)
◦ Material costs 5,265 5,704
◦ Labor costs 2,194 2,377
◦ Energy costs 1,316 1,426
◦ Repair & maintenance 1,000 1,000
◦ Depreciation charge 4,400 4,400
◦ General & adm expences 1500 1500
Total production cost 15,675 16,406
3. Gross profit ($) 4,361 5,522
4. Income tax 20 % 872 1104
5. Net profit ($) 3,489 4,417
A4. Internal Rate of Return Capital Outlay Cash Proceed
($) ($)
0
1
Year
Description Year
Description Year

2
3
4
5
5
Total
2. Produtivity of Capital ($/$)
Index of Productivity of Capital
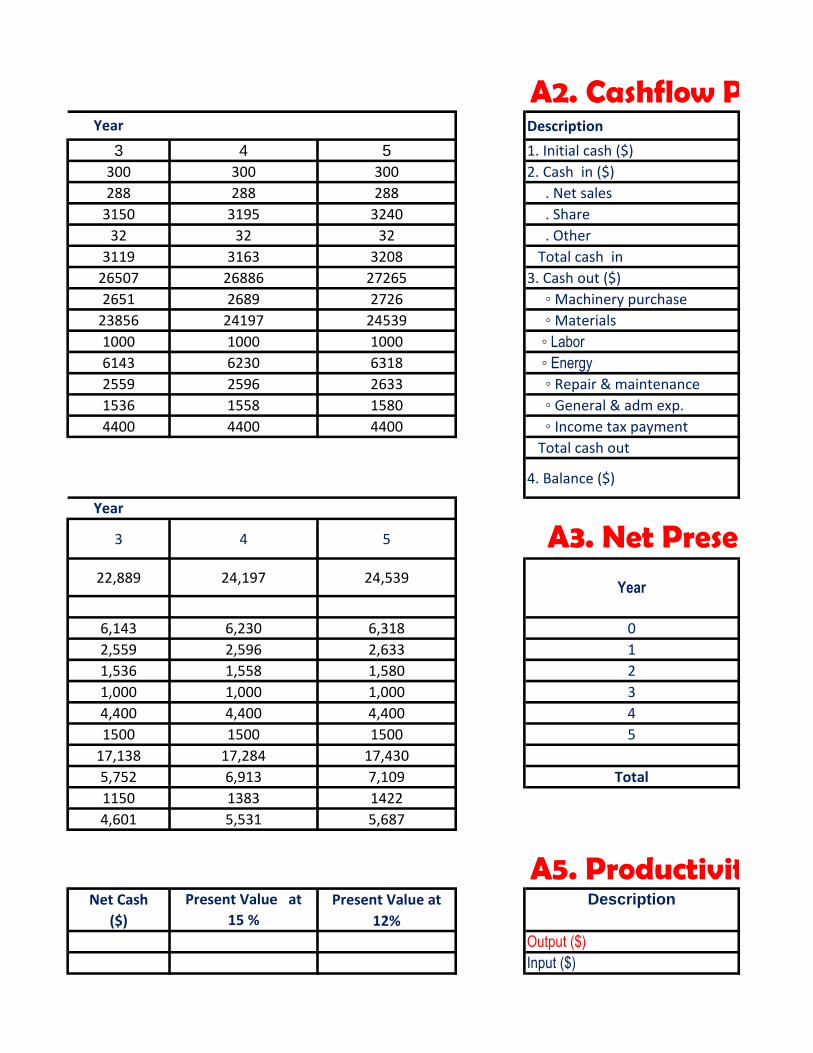
A2. Cashflow ProjectionDescription
3 4 5 1. Initial cash ($)
300 300 300 2. Cash in ($)
288 288 288 . Net sales
3150 3195 3240 . Share
32 32 32 . Other
3119 3163 3208 Total cash in
26507 26886 27265 3. Cash out ($)
2651 2689 2726 ◦ Machinery purchase
23856 24197 24539 ◦ Materials
1000 1000 1000 ◦ Labor
6143 6230 6318 ◦ Energy
2559 2596 2633 ◦ Repair & maintenance
1536 1558 1580 ◦ General & adm exp.
4400 4400 4400 ◦ Income tax payment
Total cash out
4. Balance ($)
3 4 5 A3. Net Present Value (NPV)22,889 24,197 24,539
6,143 6,230 6,318 0
2,559 2,596 2,633 1
1,536 1,558 1,580 2
1,000 1,000 1,000 3
4,400 4,400 4,400 4
1500 1500 1500 5
17,138 17,284 17,430
5,752 6,913 7,109 Total
1150 1383 1422
4,601 5,531 5,687
A5. Productivity of CapitalNet Cash Present Value at
($) 12%
Output ($)
Input ($)
Present Value at
15 %
Description
Year
Year
Year
◦ Material
◦ Labor
◦ Energy
◦ General & adm costs
◦ Maintenance & repair
◦ Depreciation charge
Total input
Productivity Measurement
1. Total Productivity ($/$)
Total Productivity Index
2. Produtivity of Capital ($/$)
Index of Productivity of Capital
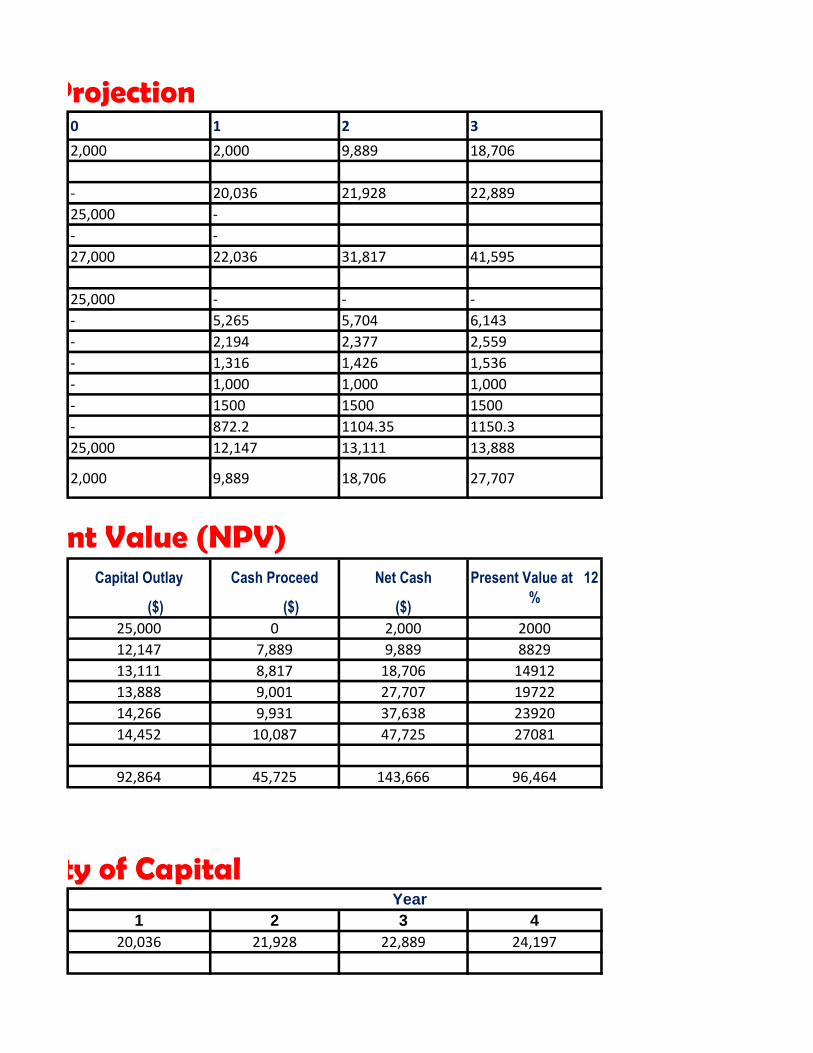
A2. Cashflow Projection0 1 2 3
2,000 2,000 9,889 18,706
- 20,036 21,928 22,889
25,000 -
- -
27,000 22,036 31,817 41,595
25,000 - - -
- 5,265 5,704 6,143
- 2,194 2,377 2,559
- 1,316 1,426 1,536
- 1,000 1,000 1,000
- 1500 1500 1500
- 872.2 1104.35 1150.3
25,000 12,147 13,111 13,888
2,000 9,889 18,706 27,707
A3. Net Present Value (NPV)Capital Outlay Cash Proceed Net Cash
($) ($) ($)
25,000 0 2,000 2000
12,147 7,889 9,889 8829
13,111 8,817 18,706 14912
13,888 9,001 27,707 19722
14,266 9,931 37,638 23920
14,452 10,087 47,725 27081
92,864 45,725 143,666 96,464
A5. Productivity of Capital
1 2 3 4
20,036 21,928 22,889 24,197
Year
Present Value at 12
%

5,265 5,704 6,143 6,230
2,194 2,377 2,559 2,596
1,316 1,426 1,536 1,558
1500 1500 1500 1500
1,000 1,000 1,000 1,000
4,400 4,400 4,400 4,400
15,675 16,406 17,138 17,284
1.278 1.337 1.336 1.400
1.93 2.11 2.20 2.33

4 5
27,707 37,638
24,197 24,539
51,904 62,177
- -
6,230 6,318 8,775 9,506 10,238
2,596 2,633
1,558 1,580
1,000 1,000
1500 1500
1382.65 1421.8
14,266 14,452
37,638 47,725
0.12
Present Value at df 12 % df 15 %
15% 1 1.0000
2000 0.892857143 0.8696
8599 0.797193878 0.7561
14145 0.711780248 0.6575
18218 12 0.635518078 0.5718
21520 15 0.567426856 0.4972
23728 3
irr
88,209
$59,264.68 $48,914.98
47.06
71,464 63,209
5
24,539
Year
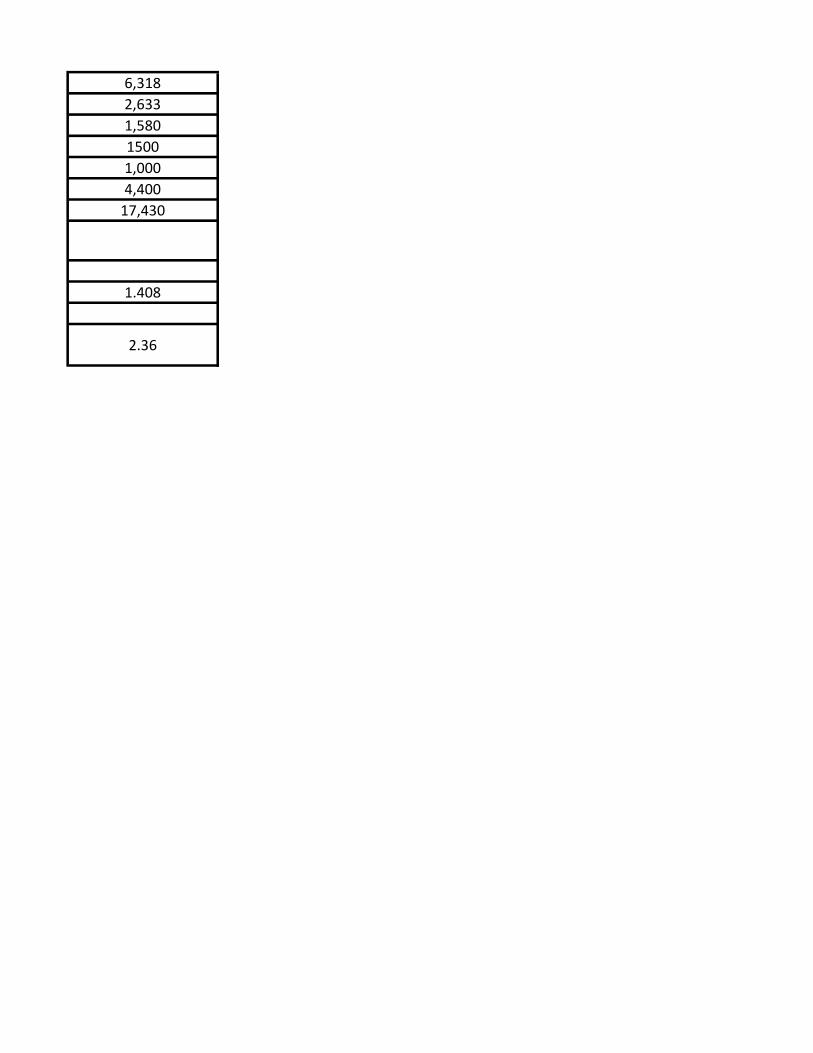
6,318
2,633
1,580
1500
1,000
4,400
17,430
1.408
2.36

10,384 10,530
0.15
8,254
11.69
35.06

Bo : Basic Data
1 2 3 4 5
Working days (days /year)
Effective working days (days /years)
Production volume (dozens)
The amount of defects (dozens)
The amount of sales (dozens)
Total sales ($/year)
Commission fee (10%)
Net sales
Repair & maintenance cost ($/year)
Material
Labor
Energy
Depreciation charge ($/year)
B1. Profit and Loss Account
1 2 3 4 5
1. Net sales ($)
2. Costs of production ($)
◦ Materials
◦ Labor
◦ Energy
◦ Repair & maintenance
◦ Depreciation charge
◦ General & adm expences
Total production cost
3. Gross profit ($)
4. Income tax 20 %
5. Net profit ($)
B2. Cashflow ProjectionDescription 0 1 2 3 4
Description Year
Description Year
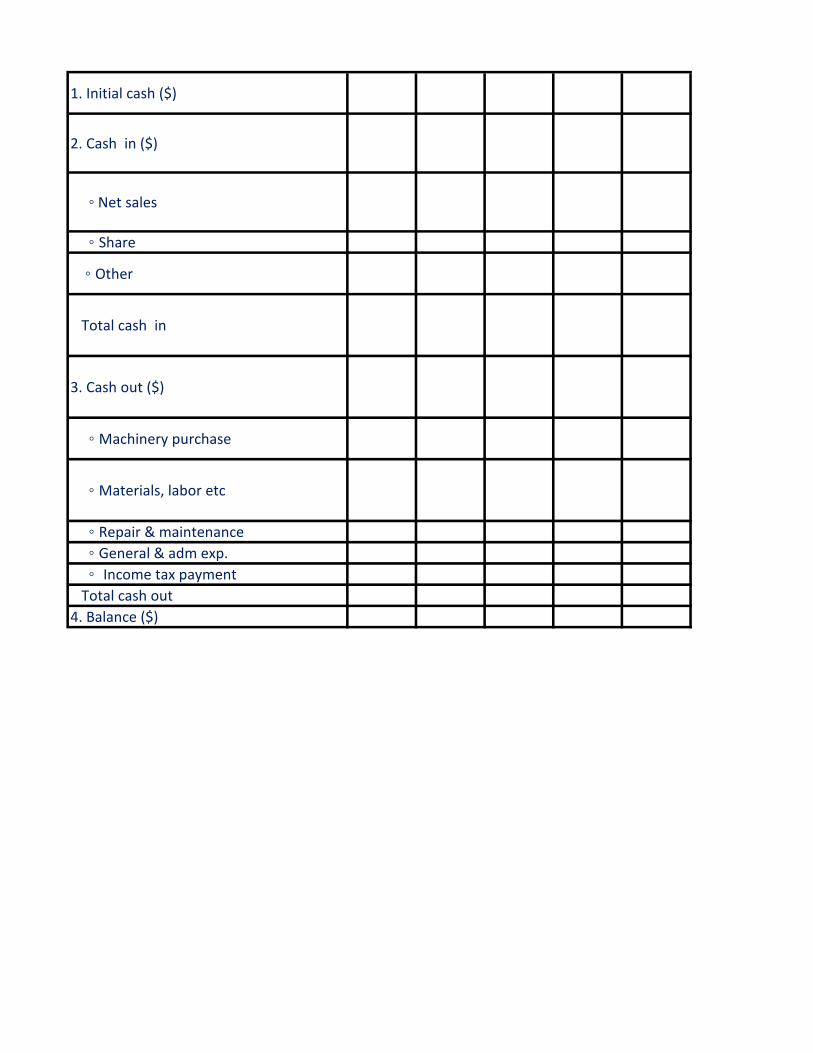
1. Initial cash ($)
2. Cash in ($)
◦ Net sales
◦ Share
◦ Other
Total cash in
3. Cash out ($)
◦ Machinery purchase
◦ Materials, labor etc
◦ Repair & maintenance
◦ General & adm exp.
◦ Income tax payment
Total cash out
4. Balance ($)
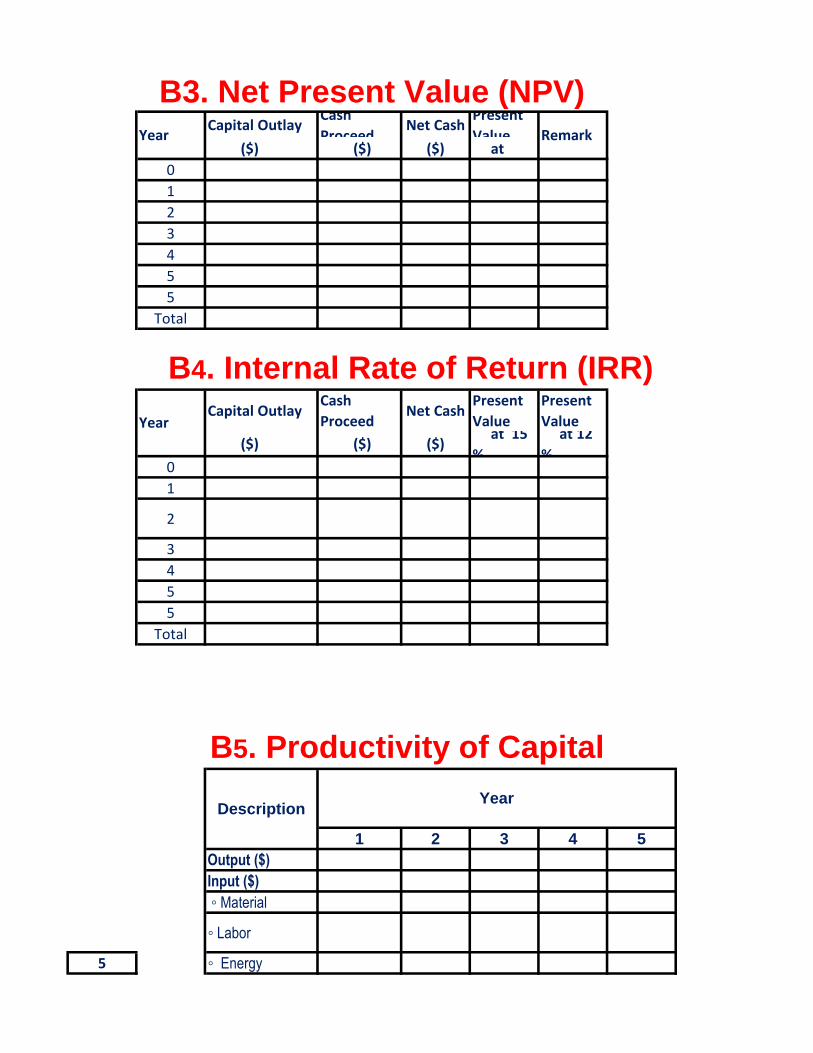
B3. Net Present Value (NPV)Capital Outlay
Cash
ProceedNet Cash
Present
Value ($) ($) ($) at
0
1
2
3
4
5
5
Total
B4. Internal Rate of Return (IRR)Capital Outlay
Cash
ProceedNet Cash
Present
Value
Present
Value
($) ($) ($) at 15
%
at 12
% 0
1
2
3
4
5
5
Total
B5. Productivity of Capital
1 2 3 4 5
Output ($)
Input ($)
◦ Material
◦ Labor
5 ◦ Energy
Description Year
Year Remark
Year

◦ General &
adm costs
◦ Maintenance
& repair
◦ Depreciation
charge
Total Input
Productivity
Measurements
1. Total
Productivity ($/$)
Total
productivity Index
2. Productivity of
Capital ($/$)
Index of
Productivity of
Capital

100000000 100000000
30000000 27272727
30000000 24793388
30000000 22539444
30000000 20490404
30000000 18627640
0.1
0 1
1 0.9091
2 0.8264
3 0.7513
4 0.6830
5 0.6209
6 0.5644739
Top Related