


Languages
Pages
Legal


1
NOTICE: This is the author’s version of a work that was published in Agricultural Systems, 94,
2007, 341-346.
LUSE, A DECISION SUPPORT SYSTEM FOR EXPLORATION OF RURAL LAND
USE ALLOCATION: APPLICATION TO THE TERRA CHÁ DISTRICT OF GALICIA
(N.W. SPAIN)
Inés Santé∗, Rafael Crecente.
Department of Agricultural and Forestry Engineering. University of Santiago de Compostela, Spain.
Escuela Politécnica Superior, Campus universitario s/n, Lugo 27002, Spain.
This article describes LUSE, a system for exploration of rural land use allocations (total area
devoted to each kind of use) by multiobjective linear programming methods. The objectives
pursued are maximization of gross margin, employment in agriculture, land-use naturalness and
traditional rural landscape, and minimization of production costs and use of agrochemicals. The
constraints on the areas devoted to the land uses considered in addition to those imposed by
their joint and individual availabilities, are that they must reach levels considered to satisfy
existing demand for those uses or their products, and that the areas devoted to maize and fodder
must be sufficient for maintenance of dairy farm production. The program generates
comprehensive samples of the Pareto-optimal set, and also allows interactive convergence on a
solution that is satisfactory to the decision-maker or interactive exploration of the Pareto-
optimal set. The system is currently parameterized for use in an area of Galicia (N.W. Spain),
but is easily adaptable to other geographic locations.
Keywords: rural land use planning; land use allocation; multiobjective linear programming.
1. Introduction
∗ Corresponding autor. Tel.: +34982252231 ext. 23642; fax +34982285926. E-mail address: [email protected]

2
Like many other rural areas of Europe, Galicia (N.W. Spain) is undergoing rapid changes
involving depopulation, reduction of agricultural activity, scattered house building, the
destruction of the traditional landscape, and the reservation of land for recreational or
conservational roles. In this context, there is an increasing demand for land use planning tools
that are flexible enough to contribute usefully to the task of allocating land use in a way that
reconciles, as much as possible, such frequently conflicting objectives as economic viability,
maintenance of social structure, and environmental conservation. Formal multiobjective
programming techniques allow the planner to gain pre-decision insight into the problem by
examination of the advantages and disadvantages of potential allocation schemes and the
consequences of giving priority to one or another objective (van Ittersum et al. 1998).
Most applications of mathematical programming to rural land use allocation have
employed linear models. Examples of the use of single-objective linear programming models
include that of Chuvieco (1993), designed to minimize rural unemployment by maximizing the
area devoted to labour-intensive uses; and that of Campbell et al. (1992), designed to balance
local production and imports in Antigua in such a way as to minimize overall cost while
satisfying demand. In some models, the decision variables have not been the areas devoted to
each kind of land use, but rather the areas that are to undergo a change of use (Shukla et al.
2003).
The increasing complexity involved in agricultural land planning makes multiobjective
models increasingly necessary. When multiple objectives must be taken into account (total
production, gross value, net profit, cost minimization, prevention of erosion, self-sufficiency,
etc), single-objective models are of limited help to the land use planner. Multi-objective linear
programming and related techniques provide a methodology for analyzing the relationships and
conflicts among these objectives. Although there is extensive literature available on linear
programming applied to farm planning, models designed for optimization of rural land use areas
in a multi-objective context are less common. One of the most widely employed multiobjective
methods developed to tackle such situations is goal programming. This approach has been used,
for example, by Ive and Cocks (1983) in Australia; by Giupponi and Rosato (1998), who
3
considered the choice of land use and farming system in the Venice Lagoon Basin given the
joint objectives of profit maximization and risk avoidance; by Oliveira et al. (2003) for
management of a Brazilian estate combining forestry, buffalo breeding and tourism; and by
Zander and Kächele (1999), whose overall concern was sustainable development.
Multiobjective methods other than goal programming that have been employed include the
generation of a comprehensive sample of the Pareto-optimal set by the weighting method
(Shakya and Leuschner 1990) or by the constraint method (van Leeuwen et al. 2001).
Comprehensive sampling of the Pareto-optimal set, the classical way of presenting the
decision-maker with a panorama of candidate solutions, tends to generate a bewilderingly large
amount of information. It is often more helpful to impose some scheme for combining the
multiple objectives into one single objective, and then explore the consequences of varying the
relative weights or priorities given to the various objectives within this scheme. This kind of
procedure amounts to sampling only those regions of the Pareto-optimal set that correspond to a
set of diverse management philosophies regarding the relative importance of different
objectives, and is becoming increasingly useful with the growing involvement of stakeholders
with conflicting interests in land use planning (van Ittersum et al. 2004). It can be especially
enlightening when the exploration can proceed interactively, so that there is an exchange of
information between the decision-maker and the system. This allows the decision-maker’s
preferred solution to be provided using implicit information supplied by him/her. This could be,
for example, answers to questions such as “which objectives can be relaxed to improve others?”
or “which solution is preferred in this group?”. The particular approach known as Interactive
Multiple Goal Linear Programming (IMGLP) has been used in this way for land use planning
(Suhaedi et al. 2002), analysis of agricultural development policies (De Wit et al. 1998),
evaluation of land use strategies (Lu et al., 2004), and has been even implemented in an
application called GOAL-QUASI to explore future land use options in the European Union
(van Ittersum 1995). Another approach, Aspiration/Reservation-Based Decision Support
(Fischer and Makowski 1996), has been implemented in a tool called AEZWIN (Fischer et al.
1998) to expand FAO´s Agro-Ecological Zoning (AEZ). The AEZ and a multi-objective linear

4
programming model were used by Agrell et al. (2004) to develop a decision support system for
exploration of crop areas. The ADELAIS multiobjective linear programming software has been
applied by Siskos et al (1994) to cropping pattern planning.
In this paper we describe LUSE, a system that allows the exploration of rural land use
allocations by a variety of multiobjective linear programming methods. The objectives pursued
are maximization of gross margin, employment in agriculture, land-use naturalness and
traditional rural landscape, and minimization of production costs and use of agrochemicals. The
constraints on the areas devoted to the land uses considered, in addition to those imposed by
their joint and individual availabilities, are that they must reach levels considered to satisfy
existing demand for those uses or their products, and that the areas devoted to maize and fodder
must be sufficient for maintenance of dairy farm production. LUSE is currently parameterized
for use in the Terra Chá area of Galicia (N.W. Spain), but is easily adaptable to other geographic
locations. We illustrate its use here by comparing the results afforded by the various methods it
implements when three different objective-type priority philosophies are imposed: economic >
social > environmental; social > economic > environmental; and environmental > social >
economic.
2. The LUSE model
2.1. The study area
For better appreciation of the objectives and constraints incorporated in the model, it is
perhaps helpful to be familiar with the general characteristics of the area to be analysed in
Section 4, which is fairly representative of numerous other areas of Galicia and other regions of
Spain. The 1,832 km2 of Terra Chá (Fig. 1) are distributed between a broad southern plain in
which the main towns and most farming activity are located, and a more hilly northern area
devoted predominantly to forestry and environmental protection. The farms of the southern
plain are mostly dairy farms with their farmland devoted to fodder crops.
Figure 1 here
2.2. The decision variables

5
The decision variables handled by LUSE are the areas Xi devoted to the thirteen main
agroforestry crops, products or uses registered in Terra Chá in 2001: maize, wheat, other cereals
(rye, barley, oats), potatoes, perennial green fodder, other fodder crops (beet, turnip),
vegetables, fruit, meadow, pasture, eucalyptus, softwoods, and hardwoods.
2.3. The objectives of the model
The LUSE model incorporates two objectives of each of three kinds: economic, social
and environmental.
2.3.1. Economic objectives
Economic objectives include the maximization of profit (Shukla et al. 2003; Suhaedi
et al. 2002; van Leeuwen et al. 2001), of gross margin (Rehman and Romero 1993; Siskos et al
1994), and of total net agricultural return, calculated as the difference between gross production
value and total costs (Lu et al. 2004). In LUSE the first of our economic objectives, O1, is
maximization of gross margin (Eq. 1),
O1 = TGM = Σi GMiXi (1)
where GMi is the gross margin per hectare of land use i. The values of the coefficients GMi in
the model as currently parameterized for Terra Chá were obtained from the Spanish Agricultural
Census or, in the case of forestry uses, from an unpublished study of 17 areas of Galicia carried
out in collaboration with the agricultural engineering company Eido Galicia S. L. (hereinafter
"the 17-area study"); these are listed in Table 1. The Spanish Agricultural Census defines the
gross margin (Margen Bruto Estándar) as the balance between the monetary value of gross
production and the value of certain direct costs inherent in that production. This concept does
not include machinery costs or waged labour. For this reason we also sought to minimize total
production costs (Eq. 2),
O2 = TPC = Σi PCiXi (2)
where PCi is the production cost per hectare of land use i determined in the 17-area study
(Table 1). These two economic objectives are considered simultaneously in other agricultural
land use models (i.e. Dogliotti et al 2004; Lu et al 2004), as occasionally capital availability and
therefore production costs place limits on production independently of the subsequent profit.

6
2.3.2. Social objectives
Our broad social aims are the conservation of rural landscape and the maintenance of
rural population. They are closely connected, since rural landscape means farmland, and
farmland must be worked. LUSE operationalizes these concerns through two specific
objectives. The first is the maximization of the total area of land (Eq. 3) devoted to agricultural
uses (maize, wheat, other cereals, potato, perennial green fodder, other fodder crops, vegetables,
fruit and meadow),
O3 = TAL = Σi∈AU Xi (3)
where AU is the set of agricultural uses. The second is the maximization of the total number of
man-hours per year (Eq. 4) employed in the land uses considered,
O4 = TMH = Σi MHiXi (4)
where MHi is the number of man-hours required per year per hectare by land use i, as
determined in the 17-area study (Table 1). Chuvieco (1993) sought to minimize rural
unemployment by maximizing the area devoted to labour-intensive land uses, while Shukla
et al. (2003), Siskos et al. (1994), Lu et al. (2004) and Suhaedi et al. (2002) maximized the total
number of workers required for all uses or, almost equivalently, the total number of man-days of
labour required. By contrast, van Leeuwen et al. (2001) sought to limit labour requirements by
minimizing the number of man-days per year and Siskos et al. (1994) did so by minimizing
seasonal jobs.
2.3.3. Environmental objectives
Environmental objectives play a leading role in the systems developed by Suhaedi et al.
(2002), who sought to minimize erosion, and by Lu et al. (2004), who sought to minimize soil
loss, cropped land, nitrogenated fertilizer use, biocide use, and nitrogen losses. With a different
kind of target region, Chuvieco (1993) incorporated ecological concerns by means of a
constraint requiring the conservation of at least 75% of natural vegetation. Two environmental
objectives were established in LUSE: the minimization of the total use of agrochemicals (Eq. 5)
7
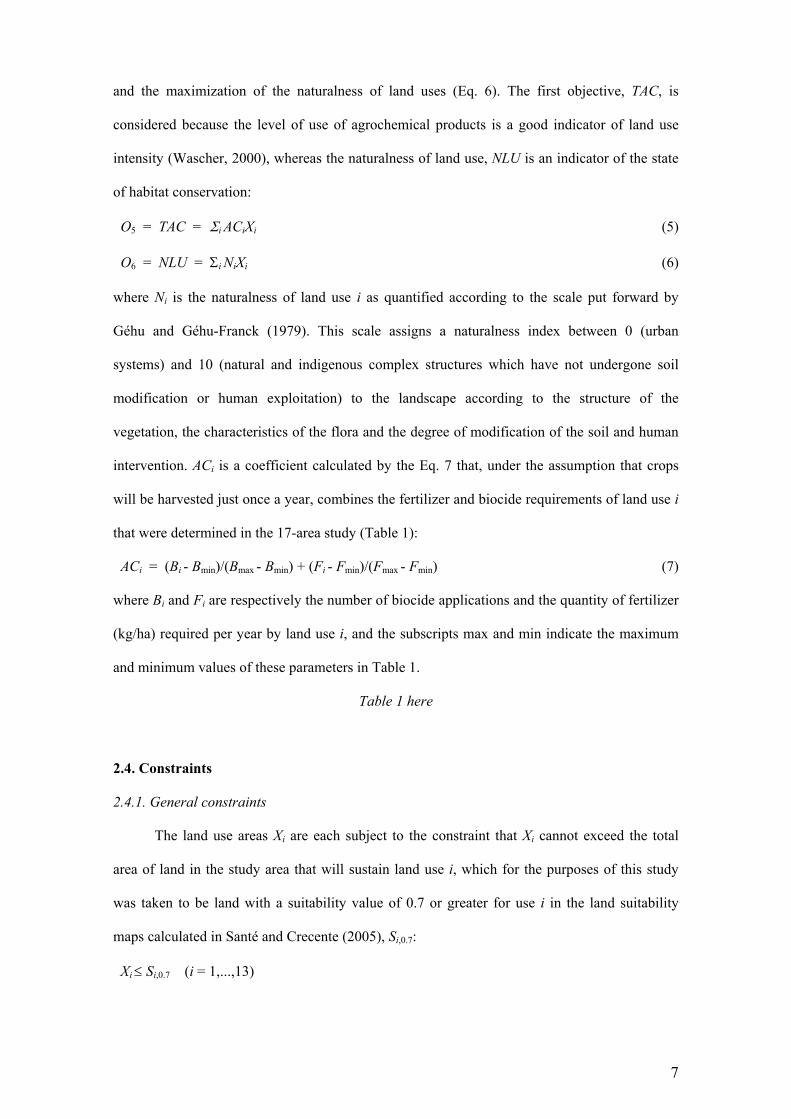
and the maximization of the naturalness of land uses (Eq. 6). The first objective, TAC, is
considered because the level of use of agrochemical products is a good indicator of land use
intensity (Wascher, 2000), whereas the naturalness of land use, NLU is an indicator of the state
of habitat conservation:
O5 = TAC = Σi ACiXi (5)
O6 = NLU = Σi NiXi (6)
where Ni is the naturalness of land use i as quantified according to the scale put forward by
Géhu and Géhu-Franck (1979). This scale assigns a naturalness index between 0 (urban
systems) and 10 (natural and indigenous complex structures which have not undergone soil
modification or human exploitation) to the landscape according to the structure of the
vegetation, the characteristics of the flora and the degree of modification of the soil and human
intervention. ACi is a coefficient calculated by the Eq. 7 that, under the assumption that crops
will be harvested just once a year, combines the fertilizer and biocide requirements of land use i
that were determined in the 17-area study (Table 1):
ACi = (Bi - Bmin)/(Bmax - Bmin) + (Fi - Fmin)/(Fmax - Fmin) (7)
where Bi and Fi are respectively the number of biocide applications and the quantity of fertilizer
(kg/ha) required per year by land use i, and the subscripts max and min indicate the maximum
and minimum values of these parameters in Table 1.
Table 1 here
2.4. Constraints
2.4.1. General constraints
The land use areas Xi are each subject to the constraint that Xi cannot exceed the total
area of land in the study area that will sustain land use i, which for the purposes of this study
was taken to be land with a suitability value of 0.7 or greater for use i in the land suitability
maps calculated in Santé and Crecente (2005), Si,0.7:
Xi ≤ Si,0.7 (i = 1,...,13)

8
Also, of course, the sum of the Xi cannot exceed ST, the total area of land in the study area that
will sustain any of the uses considered (i.e. that has a suitability of 0.7 or greater for any of
these uses):
Σi Xi ≤ ST
In addition to these upper bounds, LUSE also imposes on Xi the lower bound that it cannot be
less than the area dedicated to that land use by farms according to the Agricultural Census 2001:
Xi ≥ Xi,2001
The purpose of this lower bound is to ensure satisfaction of current demand for the use, as it is
the area required to maintain the current structure of farms and implements an ecological
requirement for conservation of 100% of current hardwood forest. The total area of all land uses
in 2001 does not coincide with the total area available in the region as there is a large area with
scrub-forest which could be dedicated to agricultural or forestry uses and in addition there are
agricultural and forestry areas that are not included in the Agricultural Census.
2.4.2. Special constraints
Two of the land uses handled by LUSE are subjected to further constraints. In order to
prevent the dependence of dairy farmers on expensive industrial concentrates, the areas of land
devoted to maize (X1) and perennial green fodder (X5) must be sufficient to maintain the number
of dairy cows in the study area, VL:
X1 ≥ 0.3 VL
X5 ≥ 0.5 VL
where the coefficients 0.3 and 0.5 have been derived from the dairy cow fodder requirements
published by López (1997).
3. The analytical tools of LUSE
The overall structure of the LUSE system is shown in Fig. 2. It comprises the model described
in the previous section; an analysis module capable of analysing this model by means of various
multiobjective methods afforded by three submodules; and a graphical user interface for
interaction with these submodules or, at a different level, for modification of the model.

9
Figure 2 here
In this figure the workflow of the system can also be seen. Firstly the decision-maker must
define the optimization model by means of the selection or editing of objectives, land uses,
production technologies available (through the modification of technological coefficients), or
the constraints of land availability and demand for each use. Once the model is defined, the
software provides several options for its resolution based on the degree of intervention of the
decision-maker. The first submodule of the system allows generating techniques to be applied in
order to approximate the set of efficient solutions. This allows the user to get an idea of the set
of possible solutions and to gain an insight into the problem. Consequently, these techniques
can be used during a first stage of the decision-making process, consisting of the learning of the
problem structure. Next the decision-maker can use this information to build his/her preference
scheme. To select the solutions closest to this scheme the decision-maker can assign his/her
preferences a priori by means of the weights allocated to each objective in goal programming or
can follow a more interactive procedure through the application of techniques with progressive
preference assignment. This type of technique provides information throughout the process on
the possible consequences of the decisions taken by means of graphs showing the achievement
rates of objectives, so that the decision-maker progressively learns the trade-offs between
objectives.
3.1. Generating techniques
The first analytical submodule allows sampling of the Pareto-optimal set by two solution-
generating techniques: the weighting method (Cohon, 1978) and the constraint method
(Goicoechea et al., 1982). To execute the weighting method, LUSE requires the user to specify
the set of weights to be applied to each objective. In applying the constraint method, LUSE is
based on the algorithm described in Azapagic and Clift (1999). All objectives but one are
10
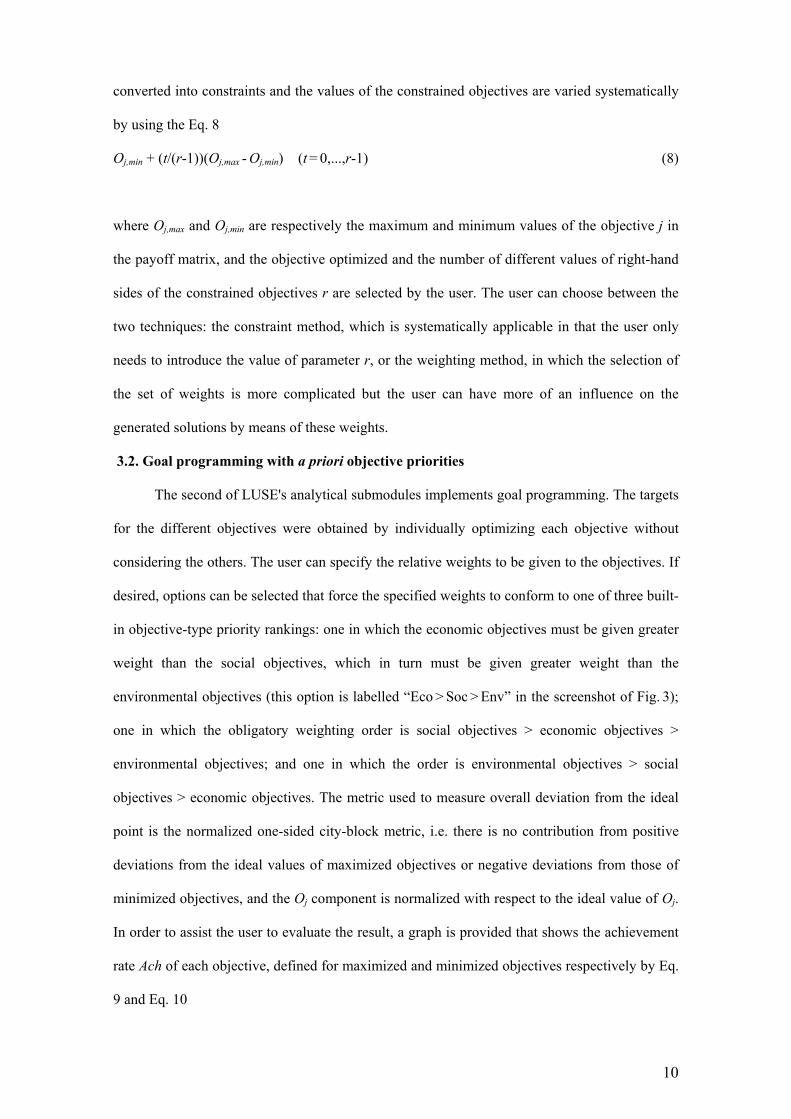
converted into constraints and the values of the constrained objectives are varied systematically
by using the Eq. 8
Oj,min + (t/(r-1))(Oj,max - Oj,min) (t = 0,...,r-1) (8)
where Oj,max and Oj,min are respectively the maximum and minimum values of the objective j in
the payoff matrix, and the objective optimized and the number of different values of right-hand
sides of the constrained objectives r are selected by the user. The user can choose between the
two techniques: the constraint method, which is systematically applicable in that the user only
needs to introduce the value of parameter r, or the weighting method, in which the selection of
the set of weights is more complicated but the user can have more of an influence on the
generated solutions by means of these weights.
3.2. Goal programming with a priori objective priorities
The second of LUSE's analytical submodules implements goal programming. The targets
for the different objectives were obtained by individually optimizing each objective without
considering the others. The user can specify the relative weights to be given to the objectives. If
desired, options can be selected that force the specified weights to conform to one of three built-
in objective-type priority rankings: one in which the economic objectives must be given greater
weight than the social objectives, which in turn must be given greater weight than the
environmental objectives (this option is labelled “Eco > Soc > Env” in the screenshot of Fig. 3);
one in which the obligatory weighting order is social objectives > economic objectives >
environmental objectives; and one in which the order is environmental objectives > social
objectives > economic objectives. The metric used to measure overall deviation from the ideal
point is the normalized one-sided city-block metric, i.e. there is no contribution from positive
deviations from the ideal values of maximized objectives or negative deviations from those of
minimized objectives, and the Oj component is normalized with respect to the ideal value of Oj.
In order to assist the user to evaluate the result, a graph is provided that shows the achievement
rate Ach of each objective, defined for maximized and minimized objectives respectively by Eq.
9 and Eq. 10

11
Ach = 100(Oj – Oj,min)/(Oj,max – Oj,min) (9)
Ach = 100(Oj,max – Oj)/(Oj,max – Oj,min) (10)
where Oj,max is the maximum value of the objective Oj in the pay-off table, and Oj,min is the
minimum value of the objective Oj in the pay-off table (note that the ideal value of Oj is Oj,max if
Oj is maximized, and Oj,min if it is minimized).
Figure 3 here
3.3. Interactive techniques
LUSE’s third analytical submodule allows the user to explore the Pareto-optimal set
interactively by means of two different approaches. The first is the STEP method, in which at
each step other than the first, what is essentially a goal-programming solution obtained by the
system in the previous step can be responded to by the user by relaxing the goal, or aspiration
level, corresponding to one of the objectives so as to favour others (see Cohon 1978). In the
LUSE implementation, goal modifications are made in terms of the tolerated percentage change
T in achievement rate Ach: for a maximized objective Oj, the goal of which is relaxed in step k,
Ach[i≥k] ≥ (1 – 0.01 T)Ach[i<k]
and so
Oj[i≥k] ≥ Oj
[k-1] - 0.01 T(Oj
[k-1] – Oj,min)
where bracketed superscripts indicate the step in which the corresponding value is obtained.
In the second interactive method (Lu et al. 2004), the various objectives are successively
optimized by means of single-objective optimizations in which the objectives preceding them in
the priority order so constructed are subject to constraints of the form Oj ≥ Oj* - εj (for a
maximized objective) or Oj ≤ Oj* + εj (for a minimized objective), where Oj
* is the value obtained
for Oj when it was optimized. Fig. 4 shows a screenshot recorded following the second
optimization in a typical run. At the top, the window still shows the values selected for the
identity of the second objective (Production costs) and the tolerance εj introduced for the
preceding objective (in this case Gross Margin O1), which is specified as a percentage of Oj,max.
At the bottom are the values of the decision variables at the solution point, the values of each
objective function, and a graph of achievement rates. Note that the negative achievement rate

12
for Agrochemicals is due to the current solution being the result of only the second of a series of
single-objective optimizations; when all optimizations have been performed, all achievement
rates are non-negative and the final solution is Pareto-optimal.
Figure 4 here
4. Illustrative analyses
To illustrate the performance of LUSE we compare the results afforded by the various methods
it implements when they are applied to the Terra Chá data in accordance with the three
objective-type priority rankings that in the case of the goal-programming method are available
as built-in options: economic > social > environmental; social > economic > environmental; and
environmental > social > economic.
4.1. Goal programming
To orient the application of goal programming, we first sampled the Pareto-optimal set
using the weighting method, with weights that ranged between 0 and 100 and summed to 100.
Several sets of weights were tried and an interval between weights of 5 units provided enough
approximation of the non inferior set with medium computational costs. For each of the three
objective-type priority rankings, all eight specific objective priority rankings that respected the
given objective-type priorities were implemented using weights of 25, 20, 15, 10, 5 and 1 (see
Table 2).
Table 2 here
The solutions obtained by goal-programming using the above weighting schemes are
compared in Fig. 5 with each other and with the status quo, i.e. the values of the decision
variables Xi in 2001. With the Eco > Soc > Env philosophy, the only uses to which more land is
devoted than in 2001 are forestry and, in some cases, meadowland (Fig. 5a). More specifically,
when gross margin is given more weight than the other economic objective, production cost
reduction, the areas of both eucalyptus and softwood forest always increase; and when
production costs are given more weight than gross margin, the area of eucalyptus – which has
lower production costs than softwood forest – rises to the maximum value allowed by the
availability constraint. In both cases, weighting naturalness more than the other environmental

13
objective, agrochemicals reduction, the area devoted to hardwood species also increases because
this is the land use with the highest naturalness index. Also, when agricultural land
maximization is given more weight than the other social objective, agroforestry man-hours, the
area of meadowland generally increases because meadowland contributes to increasing
agricultural land and forestry land uses do not.
With the Soc > Eco > Env philosophy, the only uses to which more land is devoted than
in 2001 are fruit-growing, meadow, and other fodder crops (Fig. 5b). Only the social and
economic objectives affect outcomes: when the major social objective is agricultural land
maximization and the major economic objective gross margin, then only fruit-growing – the
agricultural land use with the second highest gross margin – increases; when the major
economic objective is production cost reduction, meadowland and other fodder crops increase
instead of fruit-growing land because they have lower production costs.
With all the variants of the Env > Soc > Eco philosophy, the uses assigned larger areas
than in 2001 are meadowland, pasture and hardwood forest, with meadowland and hardwood
forest both reaching the availability limit (Fig. 5c). These land uses increase the achievement
level of both environmental objectives because they have the three highest indices of
naturalness and their coefficient of use of agrochemicals is low.
Figure 5 here
4.2. Interactive exploration using the STEP method
For each of the objective rankings used in goal programming (Table 2), the STEP
method was applied so as to reproduce the same ranking, relaxing first the goal of the least
important objective by the largest tolerated achievement relaxation T, then that of the next least
important, and so on. Thus, for ranking 1 of Eco > Soc > Env type, the objective goals were
relaxed in the order Naturalness, Agrochemicals, Agricultural land, Agroforestry man-hours,
and Production costs (the goal of the most important objective is not relaxed). As Table 3
shows, the achievement relaxations T used were numerically the same as the weights used in
goal programming.

14
The results of the STEP analyses are shown in Fig. 6. With the Eco > Soc > Env
philosophy (Fig. 6a), the areas devoted to vegetables, softwoods and other fodder crops always
rise above 2001 levels in an attempt to balance the gross margin and production cost objectives
with land uses with different characteristics. The areas devoted to maize and eucalyptus also
increase unless the prioritized social objective is agroforestry man-hours, in which case the area
devoted to fruit growing, with its greater labour needs, increases instead of those of maize and
eucalyptus.
Table 3 here
With the Soc > Eco > Env philosophy, there is always an increase in fruit growing and
other fodder crops (Fig. 6b). When the prioritized social objective is agroforestry man-hours, the
areas devoted to vegetables or to perennial green fodder and potato can also increase. In any
case, the main increments of area by order of magnitude take place in fruit-growing, other
fodder crops and vegetables. These are the agricultural land uses with the highest labour needs.
With the Env > Soc > Eco philosophy, there is always an increase in meadowland
(Fig. 6c), characterised by a high naturalness index and low use of agrochemical products. When
greatest priority is given to reducing agrochemical use, softwood forest and fruit growing also
increase. The low use of agrochemical products in softwood forests allows an increase in the
area of fruit-growing which improves social and economic objectives. When greatest priority is
given to naturalness, there is always an increase in vegetable growing and hardwood forest. The
high naturalness index of hardwood forests allows the vegetable growing area to be increased,
improving social and economic objectives.
Figure 6 here
4.3. Interactive exploration using Lu et al.'s method
For each of the objective rankings implied in Table 2, the method of Lu et al. (2004) was
applied by performing single-objective optimizations in the corresponding order. Thus, for
ranking 1 of Eco > Soc > Env type, the objectives were optimized in the order Gross margin,
Production costs, Agroforestry man-hours, Agricultural land, Agrochemicals, and Naturalness.

15
The allowed tolerances εj were always 25% for the first objective (the most important), 20% for
the second, 15% for the third, 10% for the fourth, and 5% for the fifth.
Within the Eco > Soc > Env philosophy, the prescriptions of Lu et al.'s method vary
considerably, depending on whether greatest priority is given to gross margin or production cost
reduction (Fig. 7a). In the former case, the areas devoted to vegetables and hardwood forest are
always greater than in 2001, and in the latter the areas devoted to meadow, pasture, other fodder
crops and hardwood forest. The area of vegetables increases when gross margin is prioritized
because this activity has the highest coefficient of gross margin. When production costs are
prioritized, the area of vegetables is substituted by a larger area of land uses with lower
production costs.
With the Soc > Eco > Env philosophy, the area devoted to vegetables always rises almost
to the limit imposed by the availability of suitable land, the area of hardwood forest to above
32,000 ha (Fig. 7b), and the area of softwood forest also increases slightly. Vegetables satisfy
the economic objective of gross margin and the two social objectives, as this is the agricultural
use with the highest labour needs, while hardwood and softwood forests contribute to increase
the environmental objectives.
With the Env > Soc > Eco philosophy, more land uses are assigned greater areas by
Lu et al.'s method than with either of the other objective-type rankings. However only the areas
devoted to vegetables, softwood forest and hardwood forest always increase (Fig. 7c). The
reason is the same as in the previous case, although environmental objectives are now given
more preference than social objectives, so that the increase in hardwood and softwood forest is
higher than that of vegetables.
Figure 7 here
4.4. Comparisons between methods: achievement rates
With the Eco > Soc > Env philosophy, the only analytical method affording an
achievement rate Ach greater than 45% for both economic objectives was the STEP method
(Fig. 8). With Lu et al.'s method one of these objectives always had an achievement rate lower
than 25%, and goal programming always led to a rate of almost 100% for production cost

16
reduction and less than 10% for gross margin maximization, even when gross margin
maximization was the most heavily weighted objective.
Figures 8, 9 and 10 here
With the Soc > Eco > Env philosophy, the STEP method always led to a rate of 100% for
agricultural land maximization and higher than 65% for maximization of agroforestry man-
hours. In this case Lu et al.'s method also afforded achievement rates higher than 67% for both
social objectives. As in the case of the Eco > Soc > Env objective-type ranking, goal
programming afforded an achievement rate of 100% for one of the two highest-weighted
objectives, agricultural land maximization, but a much lower value for maximization of
agroforestry man-hours (except for ranking 1 and 2).
By contrast, with the Env > Soc > Eco philosophy, goal programming always afforded
high achievement rates for the most prioritized objective type, with rates of almost 90% for
reduction of agrochemicals use and 100% for naturalness. The STEP method afforded lower
achievements for the two highest-weighted objectives, especially leading to naturalness having
very low achievement rates (25%) when greatest priority was given to reduction of
agrochemicals use. Lu et al.'s method always led to achievement rates of 70-80% for reduction
of agrochemicals use, and of only 20-35% for naturalness.
When applied in accordance with the Eco > Soc > Env philosophy, both the interactive
methods tended to respect the relative priorities established for gross margin and production
cost reduction; indeed, Lu et al.'s method practically excluded achievement of the second-
priority objective. With this method, maximization of agroforestry man-hours and agricultural
land, and minimization of agrochemicals use, were also strongly linked to maximization of
gross margin (Fig. 8c). In fact, although this link is most evident in Fig. 8c, which shows results
with both high and low gross margin achievement, the pattern high-Ach(TGM), low-Ach(TPC),
high-Ach(TMH), high-Ach(TAL), low-Ach(TAC) (or the inverse pattern low-Ach(TGM), high-
Ach(TPC), etc.) was also the outcome of a number of other methods and objective-type ranking
philosophies (see Figs. 8a, 10a, 9b, 9c and 10c). This pattern is partly explained by the high
requirement for expensive agrochemicals and labour in intensive farming schemes that afford

17
high gross margin (e.g. vegetable and fruit growing). However, generalization requires caution:
potato farming, for example, has by far the greatest agrochemical needs but not the highest
production costs, so neither of these objectives can be omitted from the analyses without loss of
information; and although TAL is high whenever TMH is (Figs. 9b, 10b and 9c) the outcome of
goal-programming when a Soc > Eco > Env philosophy is adopted shows that the reverse is not
the case (Fig. 9a).
5. Discussion and conclusions
The analyses of the previous section illustrate not only that, as would be expected, the various
ways of combining multiple objectives into a single objective afford different solutions to a
given problem, but also that examination of the results of these different approaches enriches
appreciation of the conflicts, coincidences and trade-offs among objectives, thus enabling final
decisions to be made with fuller understanding of their implications. It is therefore eminently
desirable for comprehensive decision-making tools such as LUSE, which integrate a variety of
different multiobjective optimization approaches, to be made available to the rural planner. For
the Terra Chá example considered in this work, the main conclusions that can be drawn
regarding the relationships among different objectives in the region of the Pareto-optimal set
that is sampled by the analyses may be summarized as follows.
a) Gross margin and employment in agriculture appear to be positively correlated.
b) High gross margin requires high production costs and high use of agrochemicals.
c) The solutions displaying greatest balance among the above four objectives
(maximization of gross margin and employment, and minimization of production costs and the
use of agrochemicals) manage achievement rates of at least 40% for all objectives except
naturalness by combining an increase in the area of high-yielding fruit and vegetable crops (with
respect to 2001 levels) with an increase in the area of eucalyptus and softwood forest. The
achievement rate of naturalness can be increased by reducing the area of one or more of the
above uses and increasing the area of hardwood forest or pasture.
d) The greater the priority given to environmental objectives, the greater the area of
hardwood forest and pasture. If only the minimization of the use of agrochemicals is considered

18
to be relevant, it suffices to increase forestry in general, but if maximization of naturalness is
pursued so as to conserve habitats, non-autochthonous eucalyptus and softwood forest must be
replaced by uses with greater naturalness, such as pasture.
e) The two social objectives, maximization of agroforestry employment and
maximization of agricultural land, are broadly compatible with each other and with
maximization of gross margin, and all three objectives can be achieved by increasing fruit and
vegetable growing with respect to 2001 levels. If partial sacrifice of the achievement of the
social objectives is accepted in order to increase the achievement of other objectives, then how
this should best be done depends on the relative priorities among economic and environmental
objectives.
A question that has been latent throughout the foregoing analyses and discussion is
whether there exist objective criteria for preferring one or another of the various possible
objective-type priority philosophies. One approach that might be employed when using LUSE
to plan for a given rural district is to adopt a philosophy or combination of philosophies in
accordance with the European Commission's classification of rural areas into five groups
(European Commission 1994): i) areas close to urban areas; ii) areas of pronounced
attractiveness for tourism; iii) areas with diversified activities; iv) predominantly agricultural
areas; and v) areas that are difficult to reach. In areas of pronounced attractiveness for tourism
or that are difficult to reach, it seems logical to apply an environmentally oriented philosophy
(Env > Soc > Eco) leading to promotion of native forestry species and other non-intensive land
uses. In predominantly agricultural areas, an economically oriented philosophy
(Eco > Soc > Env) would favour their main social group, farmers. In areas with diversified
activities, the presumable conflicts of interest as regards the use of land suggest that a socially
oriented philosophy (Soc > Eco > Env) might be most appropriate.
LUSE was designed to assist in defining the objectives and quantifying land use
allocation in a rural land use plan on a regional scale. Such a rural land use plan must define
which land uses must be promoted, prohibited, permitted, or subject to conditional consent in
each area of the region. In order to provide guidance in these land allocation decisions it is

19
necessary that the land use areas which maximize the achievement of each objective be known.
The stakeholders involved in the land use plan will be not only farmers, but also politicians,
land owners, environmentalists, local residents, etc. LUSE provides an opportunity for the
decision-makers to improve their understanding of the problem, as the system’s results show the
consequences of prioritising different objectives, the technical feasibility of meeting different
sets of objectives, and the trade-offs among objectives. The analysis of the scenarios generated
by the system will allow the future use of natural resources to be decided by the identification of
compromise solutions among conflicting objectives. Planning should be carried out with the
active participation of all stakeholders. The possibilities and impossibilities pointed to by a
system such as LUSE should be used throughout the process to orient and support discussion
among the groups that will be affected by the planning outcome, until successive contributions
hopefully lead to agreement on an acceptable outcome. This will allow a more ‘transparent’
plan to be obtained, based on available information and appropriate methods, consistent with
planning policies and which incorporates negotiations between conflicting interests.
LUSE is equipped with a reparameterization unit allowing its application to rural areas of
similar characteristics and it is planned to introduce further improvements both to expand its
scope and to refine its prescriptions
6. References
Agrell, P. J., Stam, A., Fischer, G. W., 2004. Interactive multiobjective agro-ecological land use
planning: The Bungoma region in Kenya. Eur. J. Oper. Res. 158, 194-217.
Azapagic, A., Clift, R., 1999. Life cycle assessment and multiobjective optimisation. J. Clean
Prod. 7, 135-143.
Campbell, J. C., Radke, J., Gless, J. T., Wirtshafter, R. M., 1992. An application of linear
programming and geographic information systems: cropland allocation in Antigua. Environ.
Plann. A 24,535-549.
Chuvieco, E., 1993. Integration of linear programming and GIS for land-use modelling. Int. J.
Geogr. Inf. Sci. 7(1), 71-83.

20
Cohon, J. L., 1978. Multiobjective Programming and Planning. Academic Press, New York.
De Wit, C. T., Van Keulen, H., Seligman, N. G., Spharim, I., 1988. Application of interactive
multiple goal programming techniques for analysis and planning of regional agricultural
development. Agr. Syst. 26, 211-230.
Dogliotti, S., van Ittersum, M. K., Rossing, W. A. H., 2004. A method for exploring sustainable
development options at farm scale: a case study for vegetable farms in South Uruguay. Agr.
Syst. 80(3), 277-302.
European Commission, 1994. Europe 2000+ Cooperation for European territorial development.
European Commission, Luxemburg.
Fischer, G., Makowski, M., 1996. Multiple Criteria Land Use Analysis. Working Paper–96–
006. International Institute for Applied Systems Analysis, Laxenburg.
Fischer, G., Makowski, M., Granat, J., 1998. AEZWIN. An Interactive Multiple-Criteria
Analysis Tool for Land Resources Appraisal. International Institute for Applied Systems
Analysis, Laxenburg.
Géhu, J.M., Géhu-Franck, J., 1979. Essai d-évaluation pytocoenotique de l’artificialisation des
paysages. In : Gehu, J. M. (Ed.), Phytosociologie et paysage. Science Publishers, Stuttgart, pp.
497-515.
Giupponi, C., Rosato, P., 1998. A farm multicriteria analysis model for the economic and
environmental evaluation of agricultural land use. In: Beinat, E., Nijkamp, P. (Eds.),
Multicriteria Analysis for Land-Use Management. Kluwer Academic Publishers, Dordrecht,
pp. 115-136.
Goicoechea, A., Hansen, D. R., Duckstein, L., 1982. Multiobjective Decision Analysis with
Engineering and Business Applications. John Wiley & Sons, United States.
Ive, J. R., Cocks, K. D., 1983. SIRO-PLAN and LUPLAN: an Australian approach to land-use
planning. 2. The LUPLAN land-use planning package. Environ. Plann. B 10, 347-355.
López, R., 1997. Estudio Socioeconómico de Terra Chá. Servicio de Publicaciones de la
Diputación Provincial, Lugo.

21
Lu, C. H., van Ittersum, M. K., Rabbinge, R., 2004. A scenario exploration of strategic land use
options for the Loess Plateau in northern China. Agr. Syst. 79, 145-170.
Oliveira, F., Patias, N. M., Sanquetta, C. R., 2003. Goal programming in a planning problem.
Appl. Math. Comput. 140, 165-178.
Rehman, T., Romero, C., 1993. The application of the MCDM paradigm to the management of
agricultural systems: some basic considerations. Agr. Syst. 41, 239-255.
Santé, I., Crecente, R., 2005. Evaluación de métodos para la obtención de mapas continuos de
aptitud para usos agroforestales. GeoFocus 5, 40-68.
Shakya, K. M., Leuschner, W. A., 1990. A multiple objective land use planning model for
Nepalese Hills farms. Agr. Syst. 34, 133-149.
Shukla, S., Yadav, P. D., Goel. R. K., 2003. Land use planning using GIS and linear
programming. In: Conference Proceedings of Map Asia 2003. GIS Development, Kuala
Lumpur.
Siskos, Y., Despotis, D. K., Ghediri, M., 1994. Multiobjective modelling for regional
agricultural planning: Case study in Tunisia. Eur. J. Oper. Res. 77, 375-391.
Suhaedi, E., Metternicht, G., Lodwick, G., 2002. Geographic information systems and multiple
goal analysis for spatial land use modelling in Indonesia. In: 23rd Asian Conference on
Remote Sensing. Assian Association on Remote Sensing (AARS), Katmandú.
van Ittersum, M. K., 1995. Description and User Guide of GOAL-QUASI: an IMGLP Model
for the Exploration of Future Land Use. DLO-Research Institute for Agrobiology and Soil
Fertilization, Wageningen.
van Ittersum, M. K., Rabbinge, R., van Latesteijn, H. C., 1998. Exploratory land use studies and
their role in strategic policy making. Agr. Syst. 58(3), 309-330.
van Ittersum, M. K., Roetter, R. P., van Keulen, H., de Ridder, N., Hoanh, C. T., Laborte, A. G.,
Aggarwal, P. K., Ismail, A. B., Tawang, A., 2004. A system network (SysNet) approach for
interactively evaluating strategic land use options at sub-national scale in South and South-
east Asia. Land Use Policy 21, 101-113.

22
van Leeuwen, C. J., Köbrich C., Maino, M., 2001. Programación lineal para la elaboración de
escenarios óptimos de uso de la tierra. FAO, Santiago de Chile.
Wascher, D. W., 2000. Agri-Environmental Indicators for Sustainable Agriculture in Europe.
European Centre for Nature Conservation, Tilburg.
Zander, P., Kächele, H., 1999. Modelling multiple objectives of land use for sustainable
development. Agr. Syst. 59, 311-325.

23
Table 1. Land use technical data required by the objective functions of LUSE.a 1
Decision variable
Land use Gross margin (€/ha)
Productioncosts (€/ha)
Labourneeds(h/ha)
Fertilizerneeds
(kg/ha)
Biocide needs
(treatments/ha)
Natural-ness
X1 Maize 970 1150 13 445 2 3 X2 Wheat 435 589 16 125 2 3 X3 Other cereals 322 572 16 114 2 3 X4 Potato 1611 2010 43 1165 7 2 X5 Perennial green fodder 490 687 12 425 2 4 X6 Other fodder crops 623 926 151 365 2 3 X7 Vegetables 4367 6024 606 698 3.6 2 X8 Fruit 2549 3796 452 394 3.5 2 X9 Meadow 140 374 7 250 0 6 X10 Pasture 140 157 2 179 0 7 X11 Eucalyptus 303 87 5 3 0 1 X12 Softwoods 293 106 13 1 0 1 X13 Hardwoods 121 149 11 1 0 10
a Data refer to a one-year, one-crop cycle. 2
3
4

24
Table 2. Weights used in goal programming. 5
Objectives Objective-type priority ranking
Objective ranking
Gross margin
Production costs
Agroforestryman-hours
Agricultural land
Agrochemicals
Naturalness
Eco > Soc > Env 1 25 20 15 10 5 1 2 25 20 15 10 1 5 3 25 20 10 15 5 1 4 25 20 10 15 1 5 5 20 25 15 10 5 1 6 20 25 15 10 1 5 7 20 25 10 15 5 1 8 20 25 10 15 1 5 Soc > Eco > Env 1 15 10 25 20 5 1 2 15 10 25 20 1 5 3 10 15 25 20 5 1 4 10 15 25 20 1 5 5 15 10 20 25 5 1 6 15 10 20 25 1 5 7 10 15 20 25 5 1 8 10 15 20 25 1 5 Env > Soc > Eco 1 5 1 15 10 25 20 2 1 5 15 10 25 20 3 5 1 10 15 25 20 4 1 5 10 15 25 20 5 5 1 15 10 20 25 6 1 5 15 10 20 25 7 5 1 10 15 20 25 8 1 5 10 15 20 25
6
7

25
Table 3. Achievement relaxations T (%) employed in applying the STEP method. 8
Objectives Objective-type priority ranking
Objective ranking
Gross margin
Production costs
Agroforestry man-hours
Agricultural land
Agrochemicals
Naturalness
Eco > Soc > Env 1 - 5 10 15 20 25 2 - 5 10 15 25 20 3 - 5 15 10 20 25 4 - 5 15 10 25 20 5 5 - 10 15 20 25 6 5 - 10 15 25 20 7 5 - 15 10 20 25 8 5 - 15 10 25 20 Soc > Eco > Env 1 10 15 - 5 20 25 2 10 15 - 5 25 20 3 15 10 - 5 20 25 4 15 10 - 5 25 20 5 10 15 5 - 20 25 6 10 15 5 - 25 20 7 15 10 5 - 20 25 8 15 10 5 - 25 20 Env > Soc > Eco 1 20 25 10 15 - 5 2 25 20 10 15 - 5 3 20 25 15 10 - 5 4 25 20 15 10 - 5 5 20 25 10 15 5 - 6 25 20 10 15 5 - 7 20 25 15 10 5 - 8 25 20 15 10 5 -
9
26
Figure 1. Location of the study area. 10
Figure 2. The overall structure of LUSE. 11
Figure 3. LUSE goal programming window. 12
Figure 4. LUSE window for application of the method of Lu et al. (2004). 13
Figure 5. Solutions obtained by goal programming within a) the Eco > Soc > Env philosophy; 14
b) the Soc > Eco > Env philosophy; and c) the Env > Soc > Eco philosophy. 15
Figure 6. Solutions obtained by the STEP method within a) the Eco > Soc > Env philosophy; 16
b) the Soc > Eco > Env philosophy; and c) the Env > Soc > Eco philosophy. 17
Figure 7. Solutions obtained by the method of Lu et al. (2004) within a) the Eco > Soc > Env 18
philosophy; b) the Soc > Eco > Env philosophy; and c) the Env > Soc > Eco philosophy. 19
Figure 8. Achievement rates Ach of the six objectives within Eco > Soc > Env philosophy for 20
solutions obtained by a) goal programming; b) the STEP method; and c) the method of Lu et al 21
(2004) (for objective abbreviations see Section 2.3). 22
Figure 9. Achievement rates Ach of the six objectives within Soc > Eco > Env philosophy for 23
solutions obtained by a) goal programming; b) the STEP method; and c) the method of Lu et al 24
(2004) (for objective abbreviations see Section 2.3). 25
Figure 10. Achievement rates Ach of the six objectives within Env > Soc > Eco philosophy for 26
solutions obtained by a) goal programming; b) the STEP method; and c) the method of Lu et al 27
(2004) (for objective abbreviations see Section 2.3). 28
29
Top Related