


Languages
Pages
Legal


Wan Ahmad et al. BioMedical Engineering OnLine (2015) 14:20 DOI 10.1186/s12938-015-0014-8
RESEARCH Open Access
Lung segmentation on standard and mobilechest radiographs using oriented Gaussianderivatives filterWan Siti Halimatul Munirah Wan Ahmad1†, W Mimi Diyana W Zaki2*† and Mohammad Faizal Ahmad Fauzi1†
* Correspondence:[email protected]†Equal contributors2Department of Electric, Electronic &Systems Engineering, Faculty ofEngineering and Built Environment,Universiti Kebangsaan Malaysia,Bangi, Selangor, MalaysiaFull list of author information isavailable at the end of the article
Abstract
Background: Unsupervised lung segmentation method is one of the mandatoryprocesses in order to develop a Content Based Medical Image Retrieval System(CBMIRS) of CXR. The purpose of the study is to present a robust solution for lungsegmentation of standard and mobile chest radiographs using fully automatedunsupervised method.
Methods: The novel method is based on oriented Gaussian derivatives filter withseven orientations, combined with Fuzzy C-Means (FCM) clustering and thresholdingto refine the lung region. In addition, a new algorithm to automatically generate athreshold value for each Gaussian response is also proposed. The algorithms areapplied to both PA and AP chest radiographs from both public JSRT dataset andour private datasets from collaborative hospital. Two pre-processing blocks areintroduced to standardize the images from different machines. Comparisons with theprevious works found in the literature on JSRT dataset shows that our method givesa reasonably good result. We also compare our algorithm with other unsupervisedmethods to provide fairly comparative measures on the performances for all datasets.
Results: Performance measures (accuracy, F-score, precision, sensitivity and specificity) forthe segmentation of lung in public JSRT dataset are above 0.90 except for the overlapmeasure is 0.87. The standard deviations for all measures are very low, from 0.01 to 0.06.The overlap measure for the private image database is 0.81 (images from standardmachine) and 0.69 (images from two mobile machines). The algorithm is fully automatedand fast, with the average execution time of 12.5 s for 512 by 512 pixels resolution.
Conclusions: Our proposed method is fully automated, unsupervised, with no training orlearning stage is necessary to segment the lungs taken using both a standard machineand two different mobile machines. The proposed pre-processing blocks are significantlyuseful to standardize the radiographs from mobile machines. The algorithm gives goodperformance measures, robust, and fast for the application of the CBMIRS.
Keywords: Chest radiograph, Unsupervised lung segmentation, Fuzzy C-means,Thresholding, Gaussian derivatives, Medical image processing, Segmentation algorithm
BackgroundChest radiography is the most frequently used diagnostic imaging examination for
chest diseases such as lung cancer, pulmonary edema (fluid in the lung), pleural effu-
sion (fluid between lung and chest cavity), pneumonia (infection by bacteria, viruses,
© 2015 Wan Ahmad et al.; licensee BioMed Central. This is an Open Access article distributed under the terms of the CreativeCommons Attribution License (http://creativecommons.org/licenses/by/4.0), which permits unrestricted use, distribution, andreproduction in any medium, provided the original work is properly credited. The Creative Commons Public Domain Dedicationwaiver (http://creativecommons.org/publicdomain/zero/1.0/) applies to the data made available in this article, unless otherwisestated.

Wan Ahmad et al. BioMedical Engineering OnLine (2015) 14:20 Page 2 of 26
fungi, or parasites) and tuberculosis (bacterial infection). More than 10 million people
worldwide die annually from chest diseases. Based on the survey done by [1], the mor-
tality rates for chest diseases in 1990 are 6.3 million (ischaemic heart disease), 4.3 mil-
lion (lower respiratory infections), 2.2 million (chronic obstructive pulmonary disease),
2 million (tuberculosis) and 0.9 million (lung cancer). For most diseases, many cures
are only effective in the early stage and symptomless stage of disease. Screening can
help early diagnosis, but a sensitive, side effect-free as well as economical method has
to be used to enable mass usage. Standard chest radiography meets these requirements,
except that current methods have moderate sensitivity. It is still more favourable des-
pite the development of advances radiological exams like Computed Tomography (CT).
The main reason is because the CT exams expose the patient to a higher dose of radi-
ation. By comparing the conventional CXR and CT chest, it is estimated that the latter
is about 400 times higher than the former, which equivalent to 3.6 years of background
exposure [2]. Another reason for the widespread use of conventional chest radiograph
over CT is its economic feasibility. The study on literature and challenges for current
direction of computer aided detection (CADe) system for lung cancer in CT scans are
reviewed by Firmino et al. in [3]. There are some recent works found on analysing
the chest in CT images, including the pulmonary fissure detection and lobe segmen-
tation [4-8]. However, the topic of interest for this research is only on chest radiog-
raphy, thus the previous literature on related work will be discussed thoroughly in
the next section.
Previous work
Medical image segmentation plays a crucial role in many imaging applications by auto-
mating or facilitating the delineation of anatomical structures and other regions of
interest. Segmentation of lung fields in CXR has received considerable attention in the
literature since the past decade. An exhaustive survey on the lung segmentation tech-
niques for chest radiographs has been done for this work, and is summarized in Table 1.
Most of the listed work used JSRT dataset as their image database. JSRT dataset is the
database of chest radiographs (with and without lung nodules) that publicly made avail-
able by the Japanese Society of Radiological Technology (JSRT), with their ground truth
clinical data [9]. This dataset only consists of posterior-anterior (PA) chest radiographs,
taken by stationary X-Ray machine. To the best of our knowledge there are only two
work [10,11] that used chest radiographs from portable device. This shows the lack of
study in mobile chest radiographs that is also relatively important especially for very
sick patients whenever their radiographs will be taken using portable X-Ray machine.
In [12], the early segmentation methods for CXR have been classified into roughly
four categories: rule-based methods, pixel classification-based methods, deformable
model-based methods and hybrid methods. A rule-based scheme consists of a sequence
of steps, tests and rules. The methods used are thresholding (local), region growing,
edge detection, ridge detection, morphological operations, fitting of geometrical
models, functions or dynamic programming. The usage of rule-based scheme is dem-
onstrated in [13], based on Bezier interpolation of salient control points is used in [10]
and based on fuzzy subsets of the image space in [14]. Pixel classification-based scheme
on the other hand is more general and mainly model the intensities of the image and

Table 1 Summary of related work on lung segmentation techniques for chest radiographs
Reference Image database Segmentation method Evaluationmeasure
Limitation
[33] - 230 chest radiographs Overlap score:
- ASM with optimal localfeatures
- ASM right:0.882 ± 0.074
- Computationallycomplex
- find optimal displacementsfor landmarks using a non-linear kNN classifier insteadof linear Mahalanobisdistance
- ASM left:0.861 ± 0.109
- Suffers thedrawback of ASM
- ASM-OF right:0.929 ± 0.026
- ASM-OF left:0.887 ± 0.114
[17] - JSRT dataset (247images)
Various methods werecompared
Overlap score: - Highly supervisedand requiredtraining
- Hybrid voting - Hybrid voting:0.949 ± 0.020
- PC postprocessed - PC postprocessed:0.945 ± 0.022
- Hybrid ASM-PC - Hybrid ASM-PC:0.934 ± 0.037
- Hybrid AAM-PC - Hybrid AAM-PC:0.933 ± 0.026
- ASM-tuned - ASM-tuned:0.903 ± 0.057
- AAM - AAM: 0.847 ±0.095
- Mean Shape - Mean Shape:0.713 ± 0.075
[10] - 24 chest radiographsfrom portable device, allwith pulmonary bacterialinfections manifested asconsolidations
- based on Bezierinterpolation of salientcontrol points
Sensitivity: 95.3% - Lack of images
Specificity: 94.3%
[11] - 58 chest radiographsfrom portable device,all with pulmonarybacterial infectionsmanifested asconsolidations
- Gray-level selectivethresholding followedby ASM
Accuracy presentedin a graph, between92.5% - 94%.
- Lack of images
- Suffers thedrawback of ASM
[15] - 52 selected imagesfrom JSRT dataset
- Gaussian kernel-basedfuzzy clustering algorithmwith spatial constraints
Accuracy: - Lack of images (only52 were selectedout of 247 imagesin JSRT dataset)
- 0.978 ± 0.0213
[13] Dice similarity: - Requires trainingand optimization
- 1,130 images - rule-based method(thresholding, morphologyand connected components)used to generate a seedmask
- 0.88 ± 0.07
- 400 from ShanghaiPulmonary Hospital(200 normal, 200 withpneumoconiosis)
- Using optimized canny edgeparameters to detect thecorner (costophrenic angle)
- 730 from differentclinical sites in China(with normal andvarious pulmonaryconditions)
Wan Ahmad et al. BioMedical Engineering OnLine (2015) 14:20 Page 3 of 26

Table 1 Summary of related work on lung segmentation techniques for chest radiographs(Continued)
[36] - JSRT dataset (247images)
Overlap score: - Requiresoptimization andtesting- Fusing shape information
with statistical model ofthe lungs’ shape
- 22 landmarks:0.92 ± 0.063
- intensity-based iterativethresholding
- 28 landmarks:0.94 ± 0.053
- optimization using ASM
[34] - JSRT dataset (247images)
- ASM for the lungsegmentation, with bonedetection algorithm
- Sensitivity: 0.956 - Suffers thedrawback of ASM
- Specificity: 0.984
[14] - JSRT dataset (247images)
Accuracy:
- based on spatial relationshipsbetween lung structures,represented as fuzzy subsetsof the image space
- Left axillary: 82.1% - Need to label thelung structures
- segment the lungstructures
- Right axillary:85.2%
- Accuracy oroverlap score ofwhole lung is notprovided- Left parahilar:
84.4%
- Right parahilar:82.8%
- Left Paracardiac:68.8%
- Right Paracardiac:86.5%
- Left Basal: 81.5%
- Right Basal: 81.7%
[35] Accuracy: - Requires shape-learning stage
- JSRT dataset (93normal images)
- Global edge and regionforce (ERF) field basedASM (ERF-ASM)
- JSRT left: 0.952 ±0.013
- CXR from University ofAlberta Hospitaldataset (50 imageswith tuberculosis)
- PCA analysis to learn thelung fields’ shape
- JSRT right:0.955 ± 0.014
- CXR left:0.946 ± 0.015
- CXR right:0.953 ± 0.017
[37] 3 stages: Overlap score:
- JSRT dataset (247images)
1. CBIR approach to identifysmall set of lung CXRusing Radon transformwith Bhattacharyyasimilarity measure
- JSRT: 0.954 - Need to be highlytrained
- Montgomery dataset(138 images – 80normal, 58 withtuberculosis)
2. Construction of patient-specific lung atlas
- Montgomery:0.941
- Computationallycomplex
- India dataset (200images – 100 normal,100 abnormal)
3. Lung segmentation usinggraph cuts discreteoptimization approach
- India: 0.917
Column ‘Reference’ refers to the citation of previous work; column ‘Image database’ describes the image database usedin the cited work; column ‘Segmentation method’ summarizes the methods used in the cited work; column ‘Evaluationmeasure’ listed all the performance measures available in the cited work; and column ‘Limitation’ gives the knownlimitation related to the cited work.
Wan Ahmad et al. BioMedical Engineering OnLine (2015) 14:20 Page 4 of 26
Wan Ahmad et al. BioMedical Engineering OnLine (2015) 14:20 Page 5 of 26
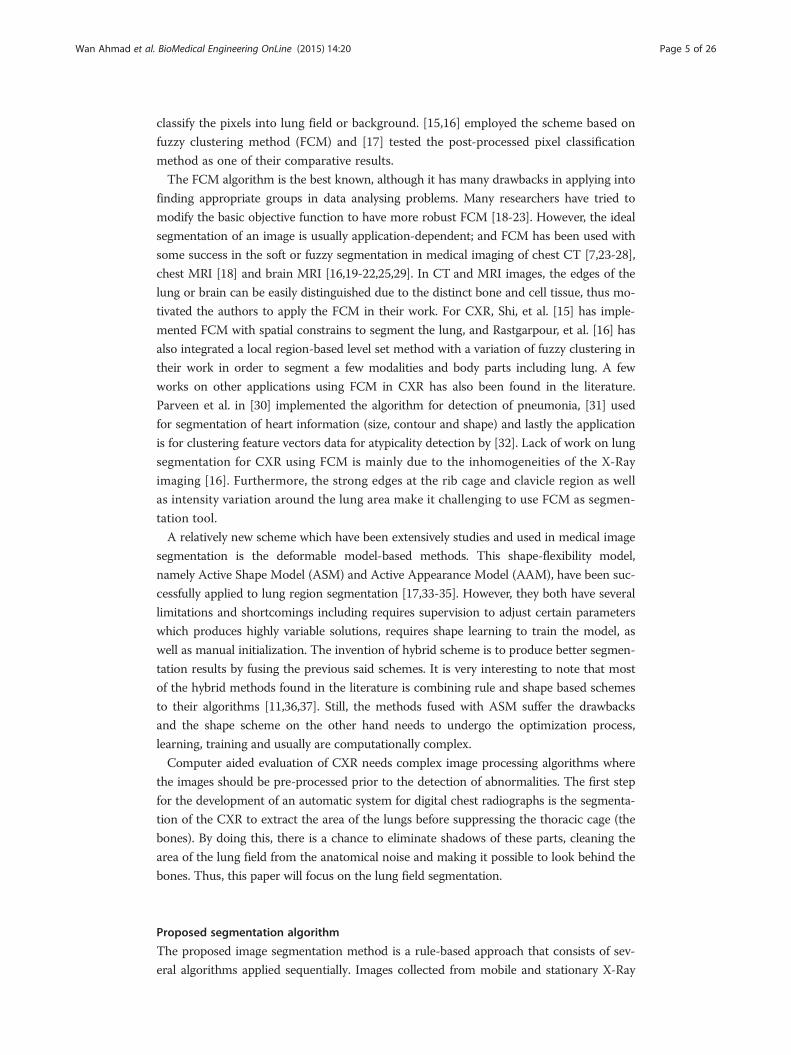
classify the pixels into lung field or background. [15,16] employed the scheme based on
fuzzy clustering method (FCM) and [17] tested the post-processed pixel classification
method as one of their comparative results.
The FCM algorithm is the best known, although it has many drawbacks in applying into
finding appropriate groups in data analysing problems. Many researchers have tried to
modify the basic objective function to have more robust FCM [18-23]. However, the ideal
segmentation of an image is usually application-dependent; and FCM has been used with
some success in the soft or fuzzy segmentation in medical imaging of chest CT [7,23-28],
chest MRI [18] and brain MRI [16,19-22,25,29]. In CT and MRI images, the edges of the
lung or brain can be easily distinguished due to the distinct bone and cell tissue, thus mo-
tivated the authors to apply the FCM in their work. For CXR, Shi, et al. [15] has imple-
mented FCM with spatial constrains to segment the lung, and Rastgarpour, et al. [16] has
also integrated a local region-based level set method with a variation of fuzzy clustering in
their work in order to segment a few modalities and body parts including lung. A few
works on other applications using FCM in CXR has also been found in the literature.
Parveen et al. in [30] implemented the algorithm for detection of pneumonia, [31] used
for segmentation of heart information (size, contour and shape) and lastly the application
is for clustering feature vectors data for atypicality detection by [32]. Lack of work on lung
segmentation for CXR using FCM is mainly due to the inhomogeneities of the X-Ray
imaging [16]. Furthermore, the strong edges at the rib cage and clavicle region as well
as intensity variation around the lung area make it challenging to use FCM as segmen-
tation tool.
A relatively new scheme which have been extensively studies and used in medical image
segmentation is the deformable model-based methods. This shape-flexibility model,
namely Active Shape Model (ASM) and Active Appearance Model (AAM), have been suc-
cessfully applied to lung region segmentation [17,33-35]. However, they both have several
limitations and shortcomings including requires supervision to adjust certain parameters
which produces highly variable solutions, requires shape learning to train the model, as
well as manual initialization. The invention of hybrid scheme is to produce better segmen-
tation results by fusing the previous said schemes. It is very interesting to note that most
of the hybrid methods found in the literature is combining rule and shape based schemes
to their algorithms [11,36,37]. Still, the methods fused with ASM suffer the drawbacks
and the shape scheme on the other hand needs to undergo the optimization process,
learning, training and usually are computationally complex.
Computer aided evaluation of CXR needs complex image processing algorithms where
the images should be pre-processed prior to the detection of abnormalities. The first step
for the development of an automatic system for digital chest radiographs is the segmenta-
tion of the CXR to extract the area of the lungs before suppressing the thoracic cage (the
bones). By doing this, there is a chance to eliminate shadows of these parts, cleaning the
area of the lung field from the anatomical noise and making it possible to look behind the
bones. Thus, this paper will focus on the lung field segmentation.
Proposed segmentation algorithm
The proposed image segmentation method is a rule-based approach that consists of sev-
eral algorithms applied sequentially. Images collected from mobile and stationary X-Ray
Wan Ahmad et al. BioMedical Engineering OnLine (2015) 14:20 Page 6 of 26
machines produce different kind of radiographs. Thus, a robust algorithm has been pro-
posed to overcome this issue that consists of two stages: the pre-processing stage and the
segmentation stage. A schematic of the image processing flow is shown in Figure 1.
Pre-processing
The radiographs produced by both stationary and portable machines have diverse pur-
poses, settings and configurations. Their varieties in position views and properties are
among the main challenges to develop a robust algorithm to extract the lung. Figure 2
shows few examples of various CXR images obtained from three different machines
and their respective histograms. It is obviously shown that histograms of different CXR
images have different intensity distribution from each other. Figure 2(a) is an example
of normal PA radiograph from a stationary machine, which is the output of common
CXR machines. In this work, this type of CXR image is set as the standard image where
no pre-processing step is needed.
In addition, Figure 2(b) and Figure 2(c) are examples of CXR images taken from two
different mobile machines, where the positions are usually in sitting or lying, as well as
standing if a patient is able to do so. Images from the first mobile machine (i.e. Figure 2
(b)) are identified ‘with unnecessary background’, thus the chest area has to be cropped
out from the images. The second mobile machine generates another type of images,
such as Figure 2(c) in which is considered as ‘inverted image with unnecessary back-
ground’. Therefore, its image histogram has to be inverted before cropping the chest
area. The contrast of the inverted image is then corrected by stretching the histogram
and eliminated 2% of the outliers. Figure 3 illustrates examples of original radiographs
and their corresponding inverted images from two different datasets.
The radiographs produced by the portable machines have extra backgrounds such as
in Figure 3 due to the nature of the mobile x-ray detector. Thus, cropping block is im-
portant to remove the unwanted backgrounds or regions. The radiographs are firstly
converted to binary images in which their threshold value are obtained using Otsu’s
thresholding method and followed by morphological dilation to preserve as much
coverage as possible. Then, any wordings or unwanted regions outside the chest area
are removed before cropping out the remaining background. Figure 4 shows some out-
put images obtained from these step-by-step procedures.
Figure 1 clearly illustrates these pre-processing steps during the first stage of the pro-
posed lung segmentation method.
Segmentation
The proposed lung segmentation consists of a scheme that based on Gaussian derivatives
(GD) filter, global thresholding and fuzzy C-means (FCM) clustering method, as clearly
presented after the pre-processing stage in Figure 1. This fully automated method has
adapted the oriented Gaussian filter to obtain responses in several directions so that a
rough lung outline can be identified. The lung outline is then filled using global threshold-
ing, and the final output is refined using a few different clusters of FCM. In addition, a
new algorithm to get an automatic threshold value for all Gaussian filters responses has
also been proposed.

Input image
Inverted?
Withbackground?
Croppingblock
Contrastadjustment blockYes
No
Yes
Pre-process
Segmentation
Rule processes
Automated thresholding
i=1
i=7?
Yes
i=i+1
Lung outline
Segmented lung
Global Thresholding
Map to original image(resize to 256 x 256)
Perform FCM (8 clusters)
Rule processes
Gaussian Derivatives
Resize image to512 x 512
No
Perform GD order 1:theta=0, 30, 60, 90, 120,150, 180 (i=1 to 7)
Generate automated thresholdvalue, th, and threshold theoutput response
Rule processes to eliminateclavicle, sides artefacts andbody artefacts
Gaussian Derivatives:
Fill the lung outline.Output: estimated lung mask
Global Thresholding:
Combine output images (i=1 toi=7 to get lung outline
Fuzzy C-Means:
Perform rule processes foreach cluster
Combine output images fromall 8 clusters to get the refinedlung region
Figure 1 Image processing flow for the proposed lung segmentation method. The diagram is dividedinto two main sections: the pre-process (with contrast adjustment and cropping block) and segmentation(with Gaussian Derivatives, global thresholding and Fuzzy C-Means algorithms).
Wan Ahmad et al. BioMedical Engineering OnLine (2015) 14:20 Page 7 of 26
Estimated lung outline using oriented derivatives of Gaussian filters
In this experimental work, an estimated outline of the lung borders is obtained by com-
bining thresholded pixels from the output responses of oriented GD order 1 in seven
directions that are θ=0°, 30°, 60°, 90°, 120°, 150° and 180°, at a scale of σ=3. Based on
distributions of the gradient values, different threshold values are generated for each
output responses. With a correct threshold value, the output responses of each

Figure 2 Example of different projection and positioning in chest radiographies with their respectivehistograms. (a) PA erect from standard machine; (b) AP sitting; and (c) AP Supine from portable machines.
Wan Ahmad et al. BioMedical Engineering OnLine (2015) 14:20 Page 8 of 26
direction may successfully depict different details of the lung outlines. For instances, at
θ=0° and θ=30° , details of the outer right lung and inner left lung are highlighted, and
the opposite directions (θ=150° and θ=180°) represent the details of the outer left lung
and inner right lung. In addition, the response at θ=60° highlights the hemidiaphragm
of the right lung and the inner-lower details of the left lung; while the other side of the
lung can be highlighted by the response at θ=120°. For θ=90°, most of the normal PA
radiographs have both right and left hemidiaphragms highlighted, whilst some of the
radiographs (especially with fluid or infection) lost this feature due to the high intensity
Figure 3 The outputs of the contrast adjustment block. The two images are from different portablemachines (a) to (c) and (d) to (f). (a) and (d) are the original images, (b) and (e) are after inverting theimage and (c) and (f) are the results after correcting the contrast.

Figure 4 The outputs of the cropping block. (a) – (f): original image, thresholded image, after dilation,outside wordings removal, mapped to original image, final output (cropped).
Wan Ahmad et al. BioMedical Engineering OnLine (2015) 14:20 Page 9 of 26
of the consolidations around the diaphragm area. Some examples of the thresholded re-
sponses are shown in Figure 5.
Novel algorithm to get automatic threshold value for each Gaussian responses
A new method is proposed to automatically compute a threshold value for each differ-
ent response by analysing its histogram obtained from the Gaussian filter.
The algorithm has been designed to obtain a threshold value that is located at the
end of the histogram peaks. This is to ensure that only important gradient intensity is
highlighted after the thresholding process, with as much noise reduction as possible.
Equation 1 mathematically represents the histogram number of occurrences for each
pixel value, called histogram numbers, HN. The input of this algorithm is the Gaussian
Figure 5 Output of the GD responses after thresholding. (a) – (g) thresholded responses forθ=0°,30°,60°,90°,120°,150° and 180°, and (h) output of the combined responses after the ‘cleaning’ processeswith rule-based algorithms.

Wan Ahmad et al. BioMedical Engineering OnLine (2015) 14:20 Page 10 of 26
response, Rσ, with floating point pixel values where its range is varying from negative of
thousands to positive thousands. The first step is to round these values to the closest
integers, and the minimum and maximum values are denoted as mn and mx. The num-
ber of occurrences, N, for each pixel value is recorded, where each single value in the
histogram is considered without discretizing it into any number of bins, and the result
is called histogram numbers, HN.
HN ið Þ ¼Xmx
i¼mn
N Rσ ið Þð Þ ð1Þ
The peaks of the HN are calculated based on the local maxima with the minimum
peak height (mph) is set to the mean of HN. For each peak found, PHN (x), its location
inside the vector HN is denoted as LP-HN (x), where x=1,2,..m; and m is the total num-
ber of peak found.
PHN xð Þ ¼ HN ið Þ; ð2Þ
if HN(i − 1) <HN(i) >HN(i + 1) and H > HN
N ið Þ mx−mnThe PHN (x) are then analysed to get the chosen peak values, PHN (c), which fulfil
these criterion:
– LP-HN (x) has to be located after the maximum HN
– PHN (x) has to be at least 3 times of mph and at most 8 times of mph. This is to
ensure that the values are to be ‘true peaks’ and above average, but not too high to
exclude the ‘oddly high peaks’.
The locations of the chosen peak, LP-HN (c) are mapped to the original pixel values, and
a list of possible threshold values, LTH, is created. Lastly, the maximum value of LTH that is
located at the end of the histogram peaks is chosen as the output of this algorithm.
Rule-based algorithms
The rule-based algorithms are important steps before the lung area is segmented from
its radiograph. They involve border cleaning, noise removal, clavicles elimination, and
removal of body and sides’ artefacts for each thresholded response. The unwanted details
that are located along the image margins are contributed by noise from the acquisition
system. Some radiographs contain clavicles or body artefacts. These unnecessary details
are eliminated by removing the pixels connected to the borders. The connected pixel
areas which are less 0.5% of the image size are also eliminated. The three proposed rules
are presented below to get the most optimum lung outlines, and clear output responses.
To eliminate clavicle
The clavicles are located at the top-side of the lungs; top-right for right lung and top-
left for left lung, and often located close enough to the image top and sides margins.
To eliminate the clavicle for the right side, a rule to filter the regions is proposed where
the area with the connected pixels located between 0% and 35% of the image height, r0,
are removed. The location of minimum row has to be at most 20% of the r0; and the
pixels that are located between 0% and 50% of the image width, c0, are removed, where
the location of minimum column has to be at most of 25% of the c0. The clavicle

Wan Ahmad et al. BioMedical Engineering OnLine (2015) 14:20 Page 11 of 26
normally has a broad width; hence the width of the area has to be at least 15% of the
image width, c0. Same rules are applied to the left side, except the pixels has to be located
between 50% and c0, where the location of maximum column has to be at least 75% of c0.
To eliminate sides’ artefacts
These noises are normally caused by shadows inside the radiographs and they are lo-
cated at the right or left sides of the image. The rule is carefully defined in such a way
that only the most minimal side regions are removed. For the right side, the region has
to be at most only 15% of c0, with the location of minimum column at 5% of c0 or
lesser. Same portion of limit is applied to the left side, with the location of maximum
column at least 85% of c0.
To eliminate body artefacts
This rule is proposed mainly to tackle the remaining body artefacts that are not re-
moved during the image margin cleanings. These noises are not connected to the
border, but they are located very close to the bottom image’s margins. Based on these
characteristics, a rule such that, the minimum row has to be located at 25% of the r0 or
more, and location of maximum row has to be at least 90% of the r0 is defined. Area of
the connected pixels is set to be at least 2.5% of the image size to preserve important
lung outline such as the hemidiaphragm which is normally located at the bottom of the
image and very close to the margin .The limit for minimum column for the right side
is set to be at most 5% of the c0 and the limit for maximum column for the left side is
set to be at least 95% of the c0.
After the noise elimination steps, the output of each response is then combined to form
a rough lung outline. The last rule is to eliminate small region so that only clean lung out-
line information is stored. The area of each connected region found in the image is calcu-
lated, and the value of largest area, Amax, is stored. Any region that is smaller than 15% of
the Amax and maximum column located less than 20% of c0 (right side) or minimum col-
umn located more than 80% of the c0 (left side), are discarded. The summary of this pro-
posed rule-based algorithms are summarized in Table 2. At the end of this process, the
estimated lung outline, Loutline, as in Figure 5 (h) is obtained, and another simple algorithm
based on thresholding and convex hull is developed to fill in the lung outline.
Fill the lung outline based on global thresholding and convex hull
Figure 6 (a) and Figure 6 (b) show images obtained from previous processing steps de-
noted as Loutline and normalized image using high frequency emphasis filtering (HFEF),
IHFEF, respectively. The IHFEF is smoothed using Gaussian blurring with filter size of 32
by 32 and standard deviation, σ = 10. From our observation the chosen filter size and σ
value are able to successfully smooth out the obvious edge details in IHFEF, and to pre-
serve the important lung region information. A global Otsu thresholding is then ap-
plied to the smoothed IHFEF and the outputs are Ith, Figure 6 (c). A convex hull of
Loutline is obtained and denoted as LCH (Figure 6 (d)), and Ith is combined with LCH to
get the ROI of Ith within LCH (Figure 6 (e)), hence to produce Ith-roi (Figure 6 (f )). The
final estimated lung mask, Lmask (Figure 6 (g-h)), is obtained by combining Loutline and
Ith-roi, followed by basic morphological operations (dilation, filling, erosion and remov-
ing small regions).

Table 2 Summary of the rule-based algorithms for noise removal
Steps Location Area
To remove small connected pixel Anywhere < 0.005 of image size
To eliminate clavicle Near to top: (0 < pixel < 0.35 of r0) and (minimumrow ≤ 0.2 of r0)
≥ 0.15 of c0
Right lung: Top-right (0 < pixel < 0.5 of c0) and(minimum column ≤ 0.25 of c0)
Left lung: Top-left (0.5 of c0 < pixel < c0) and(maximum column ≥ 0.75 of c0)
To eliminate sides’ artefacts (region ≤ 0.15 of c0)
Right side: (minimum column ≤ 0.05 of c0)
Left side: (maximum column ≥ 0.85 of c0)
To eliminate body artefacts Near the bottom image’s margins: (minimumrow ≥ 0.25 of r0) and (maximum row ≥ 0.9 of r0)
≥ 0.25 of image size
Right side: (minimum column ≤ 0.05 of c0)
Left side: (maximum column ≥ 0.95 of c0)
To eliminate small region after lungoutline is formed
Right side: (maximum column < 0.2 of c0) ≤ 0.15 of Amax
Left side: (minimum column > 0.8 of c0)
Wan Ahmad et al. BioMedical Engineering OnLine (2015) 14:20 Page 12 of 26
Refine the lung region using FCM clustering
This work has proposed a rule-based algorithm using FCM clustering to further refine the
lung mask. The FCM method that was improved by [38-40] is used for this purpose because
of its ability to automatically cluster the pixels into the defined number of clusters. FCM
has been used previously in segmenting lung in chest X-Ray [15,16], chest CT [7,23-28],
chest MRI [18] as well as segmenting brain matter in MRI images [16,19-22,25,29].
In this algorithm, input images for FCM are the estimated lung mask, Lmask that is il-
lustrated in Figure 6 (h) obtained from the previous algorithm. Lmask is then mapped to
the original CXR to produce its Imask (Figure 7 (b). FCM with several numbers of clus-
ters, n = 3 to 8, are tested (as shown in Figure 7) to get closest segmented lung areas as
Figure 6 Filling the lung outline based on global thresholding and convex hull. (a) Input imageLoutline (b) smoothed IHFEF, (c) thresholded IHFEF (Ith), (d) convex hull of Loutline (LCH), (e) ROI of Ith within LCH(f) Ith-roi, (g) Ith-roi + Loutline, and (h) final estimated lung mask, Lmask.
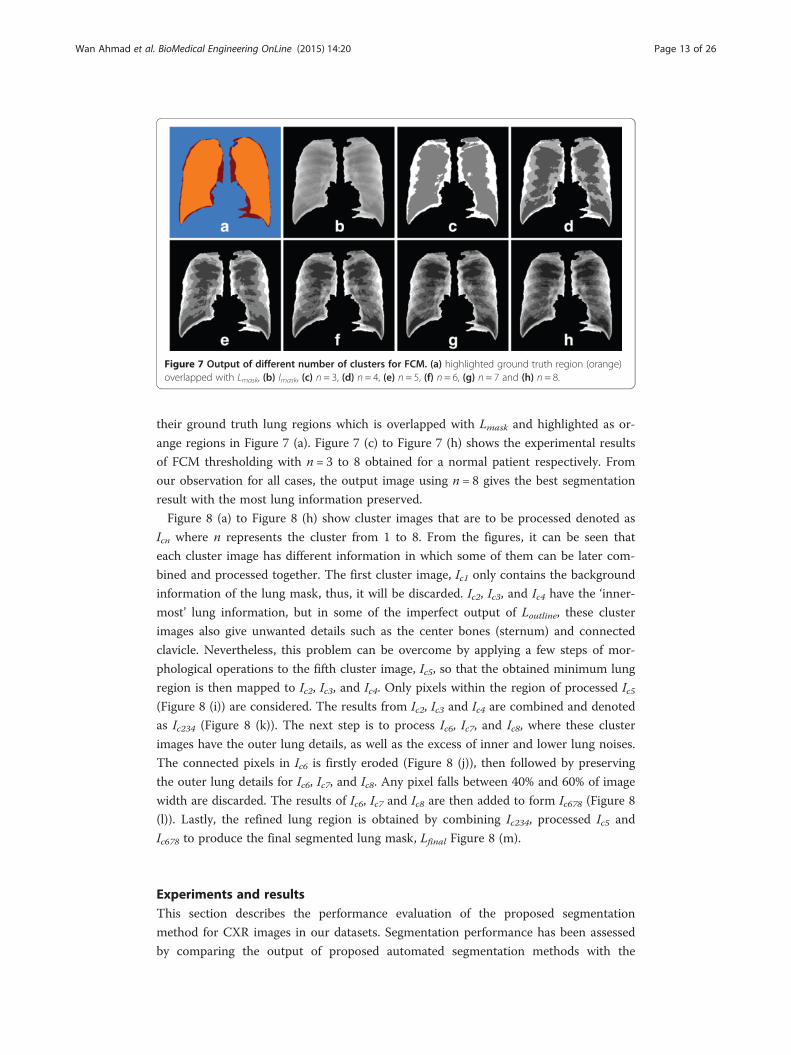
Figure 7 Output of different number of clusters for FCM. (a) highlighted ground truth region (orange)overlapped with Lmask, (b) Imask, (c) n = 3, (d) n = 4, (e) n = 5, (f) n = 6, (g) n = 7 and (h) n = 8.
Wan Ahmad et al. BioMedical Engineering OnLine (2015) 14:20 Page 13 of 26
their ground truth lung regions which is overlapped with Lmask and highlighted as or-
ange regions in Figure 7 (a). Figure 7 (c) to Figure 7 (h) shows the experimental results
of FCM thresholding with n = 3 to 8 obtained for a normal patient respectively. From
our observation for all cases, the output image using n = 8 gives the best segmentation
result with the most lung information preserved.
Figure 8 (a) to Figure 8 (h) show cluster images that are to be processed denoted as
Icn where n represents the cluster from 1 to 8. From the figures, it can be seen that
each cluster image has different information in which some of them can be later com-
bined and processed together. The first cluster image, Ic1 only contains the background
information of the lung mask, thus, it will be discarded. Ic2, Ic3, and Ic4 have the ‘inner-
most’ lung information, but in some of the imperfect output of Loutline, these cluster
images also give unwanted details such as the center bones (sternum) and connected
clavicle. Nevertheless, this problem can be overcome by applying a few steps of mor-
phological operations to the fifth cluster image, Ic5, so that the obtained minimum lung
region is then mapped to Ic2, Ic3, and Ic4. Only pixels within the region of processed Ic5(Figure 8 (i)) are considered. The results from Ic2, Ic3 and Ic4 are combined and denoted
as Ic234 (Figure 8 (k)). The next step is to process Ic6, Ic7, and Ic8, where these cluster
images have the outer lung details, as well as the excess of inner and lower lung noises.
The connected pixels in Ic6 is firstly eroded (Figure 8 (j)), then followed by preserving
the outer lung details for Ic6, Ic7, and Ic8. Any pixel falls between 40% and 60% of image
width are discarded. The results of Ic6, Ic7 and Ic8 are then added to form Ic678 (Figure 8
(l)). Lastly, the refined lung region is obtained by combining Ic234, processed Ic5 and
Ic678 to produce the final segmented lung mask, Lfinal Figure 8 (m).
Experiments and resultsThis section describes the performance evaluation of the proposed segmentation
method for CXR images in our datasets. Segmentation performance has been assessed
by comparing the output of proposed automated segmentation methods with the

Figure 8 Process of refining the lung region using FCM cluster images for n = 8. (a) – (h) clusterimage Ic1, Ic2, Ic3, Ic4, Ic5, Ic6, Ic7, Ic8, (i) processed Ic5, (j) processed Ic6, (k) Ic234, (l) Ic678, (m) final output, Lfinaland (n) highlighted ground truth region (orange) overlapped with Lfinal.
Wan Ahmad et al. BioMedical Engineering OnLine (2015) 14:20 Page 14 of 26
ground truth images prepared by the experts. Pixel-by-pixel analyses are performed to
measure a similarity between the set of non-zero pixels of the two segmentation masks.
Image data
For this experimental work, images from both public (JSRT) and private (SH) image data-
sets have been collected. Images in the former database are the standard PA chest radio-
graphs, 247 in total and collected from 13 institutions in Japan and one in the United
States. The images are a collection of normal images (93) and with exactly one nodule
(154). The images were scanned from films to a size of exactly 2048 by 2048 pixels [9].
The latter database is our own private database collected from Hospital Serdang (SH),
Malaysia. It contains both PA and anterior-posterior (AP) radiographs produced by three
different machines: one is stationary machine to produce PA radiographs and two mobile
(portable) machines specifically for ill patient which can produce both PA and AP radio-
graphs. The database collection consists of 86 normal images and 42 images with various
types of consolidations such as but not limited to fluids, infections and cavitation. The
image resolutions vary and they are in DICOM file format with 12-bit grey levels.
The image projection and patient positioning in SH datasets consists of three posi-
tioning: PA erect, AP sitting and Supine. The commonly used projection in CXR are
from posterior to anterior (PA), with the X-ray source situated posterior (behind) to
the patient and the X-ray plate positioned immediately anterior (frontal) to the patient’s
chest. If the patient is ill and unable to stand or suffers with general immobility, the
CXR may be taken anterior to posterior (AP) in sitting or supine (lying) position. Only
mobile machine is able to take CXR images in sitting and lying position.
Performance measure/evaluation
The performance of the proposed segmentation algorithm is measured using a ‘good-
ness’ index. For two class segmentation problems such as lung and background in this
work, one can distinguish true positive (TP) area (correctly classified as lung), false

Wan Ahmad et al. BioMedical Engineering OnLine (2015) 14:20 Page 15 of 26
positive (FP) area (background incorrectly classified as lung), false negative (FN) area
(lung incorrectly classified as background) and true negative (TN) area (correctly classi-
fied as background). Measures such as sensitivity, specificity, accuracy and overlap
score can be computed using these values. In this work, the analyses have been per-
formed to both right and left lungs using the following formulas:
Accuracy ¼ TP þ TNTP þ TN þ FP þ FN
OverlapScore ¼ AreaOfInter section;TPAreaOfTheUnion;TP þ FP þ FN
Sensitivity=Recall;R ¼ TPTP þ FN
Specificity ¼ TNTN þ FP
Precision; P ¼ TPTP þ FP
F−score; F ¼ 2� P � RP þ R
Accuracy defines the amount of true results (both true negatives and true positives)
[14]. Overlap score is defined as the agreement between the ground truth and the esti-
mated segmentation mask over all pixels in the image [37]. This measure is well ac-
cepted and has been used widely in the lung field segmentation of chest radiographs
[17]. Sensitivity or recall is corresponds to the proportion of true positives relative to
the lung field that should be segmented. Sensitivity tends to 1 (or 0) if there is little (or
many) false negatives [14]. Specificity is the proportion of true negatives relative to the
lung field that should be segmented. Specificity tends to 1 (or 0) if there is little (or
many) false positives [14]. Precision is corresponds to the proportion of true positives
relative to the segmented lung field (true positives and false positives). F-Score is de-
fined as a weighted average of both precision and recall. The best value is 1 and vice
versa. Standard deviation (for all measures) is defined as the amount of disparity of the
measure from its average value. The lower the standard deviation value means that the
measured values are very close to their expected value. Whilst a high standard devi-
ation value means that the measured values are varied over a large range of values.
Minimum value (for all measures) defines the lowest value of the measure. A good
measure shall produce a high minimum value. Maximum value (for all measures) de-
fines the highest value of the measure. A good measure shall produce a high maximum
value.
Execution time of the proposed methods
Table 3 presents the obtained computational speed of each level in the proposed seg-
mentation method. Different stage of level may use different image sizes, thus their re-
spective sizes are also portrayed in the table for comparison. All algorithms are
developed using Matlab 7.10 as the software tool on a desktop personal computer with
a 3.10-Ghz Intel i5 CPU and 8 GB memory as a testing platform. The total execution
time per dataset is slightly different; where it depends on the pre-processing steps (level

Table 3 Average execution time for each proposed level with the respected image size
No Level (image size) Average execution time (s)
1 Contrast adjustment block (original size) 0.68
2 Cropping block (original size) 0.15
3 Get spine axis (512 by 512 to get the spine, then reduced 256 by256 when using HT)
0.29
4 Segmentation using GD, thresholding and FCM 13.71
- Estimate lung outline (GD) (512 by 512) (9.79)
- Fill the lung outline (thresholding) (256 by 256) (0.96)
- Refine lung region (FCM) (256 by 256) (2.96)
Wan Ahmad et al. BioMedical Engineering OnLine (2015) 14:20 Page 16 of 26
number 1, 2 and 3) before the segmentation stage (refer Figure 1). Comparing the three
segmentation stages (level number 4), GD stage takes the longest time, with more than
70% of the time is taken to estimate the lung outline and to generate the threshold
value for each Gaussian orientation (total of 7 orientations). However, the main seg-
mentation processes are relied on the GD method, thus, the relatively high execution
time is still tolerable because the main crucial issue is to achieve high segmentation ac-
curacy. Furthermore, the retrieval system for medical image application consists of two
stages: the offline feature extraction stage and the online retrieval stage. During the off-
line stage, features are computed for all database images; while during the online stage,
only the FV of the query image is computed. It is important to take note that the un-
supervised method is mandatory for a robust retrieval system.
Experiments, results and discussion
Performance of our unsupervised method will be separately evaluated for each public
and private datasets in term of average (mean), standard deviation (std), minimum
(min) and maximum (max) values for recall, precision and F-score performance mea-
sures. All performance measures range from 0 to 1.
Experiment on public image dataset (JSRT)
The JSRT dataset consists of standard PA chest radiographs from stationary machine.
The radiographs are inverted images (refer Figure 3(d)), thus they have to undergo con-
trast adjustment process during the pre-processing stage. Table 4 presents the perform-
ance measures for this dataset. It can be seen that most performance measures are
above 0.90, except the rounded overlap measure is 0.87, which is still above satisfactory.
The standard deviations for all measures are also very low, which indicates the low
variation of the performance measures from the mean values. The lowest value is
Table 4 Lung field segmentation for standard PA chest radiographs using the publicimage database (JSRT)
Overlap Accuracy F-score Precision Sensitivity Specificity
mean 0.8695 0.9577 0.9289 0.9332 0.9279 0.9707
std 0.0599 0.0240 0.0414 0.0327 0.0628 0.0147
min 0.3156 0.6873 0.4798 0.7997 0.3255 0.9041
max 0.9365 0.9800 0.9672 0.9886 0.9905 0.9958

Wan Ahmad et al. BioMedical Engineering OnLine (2015) 14:20 Page 17 of 26
corresponding to the specificity (0.0147) and the highest is only 0.0628 of the sensitiv-
ity. The minimum value is however quite low for certain measures, due to a few images
that are difficult to segment.
The quantitative results for this standard PA dataset are tabulated in a scattered graph
as in Figure 9. The accuracy and F-score of almost all images (98% and 92% of all cases re-
spectively) are higher than 0.90. 24% of the images achieve above 0.90 overlap score, 78%
are above 0.85 and 95% are above 0.80. From the experimental work, four cases obtained
about 0.60 and one case of 0.32, where the method failed to get suitable automatic thresh-
old value when thresholding the GD responses. For these cases, the outputs led to the loss
of lung outline information, thus affecting the rest of the segmentation process. This prob-
lem is due to the difference in the responses intensity, where their fit threshold values are
located slightly to the centre of the histogram peaks.
Figure 10 shows the qualitative segmentation results that are the lung contours gen-
erated by the proposed method superimposed on the original images ((a) to (c) and (g)
to (i)), together with the confusion matrix ((d) to (f ) and (j) to (l)), corresponding to
the best and worst three segmentation outputs.
Performance comparison on JSRT dataset with existing methods
Several studies have reported their lung segmentation results on various chest radio-
graphs as comprehensively presented in the literature. In this work, we had compared
the performance measures between the proposed method and previous studies as sum-
marized in Table 5. We only chose the quantitative results that were achieved using all
247 images of JSRT dataset. By comparing the overlap score with the supervised
hybrid-based methods in [17,36,37], our method performs reasonably well with the
overlap difference of 0.07 to 0.084 and 6 to 8.5 times faster execution time. In addition,
our proposed method is an unsupervised and fully automated where no training or
learning stage is necessary. The proposed method also performs favourably with the su-
pervised model-based method in [34] with the sensitivity and specificity difference of
0.028 and 0.013, respectively. Comparing with the rule-based method presented in [14],
where the segmentation was done based on the lung structures and extensive
0 50 100 150 200 250
0.4
0.5
0.6
0.7
0.8
0.9
1
Images
Per
form
ance
Mea
sure
overlapf-scoreaccuracy
Figure 9 Performance measures of the proposed method for each image using the public JSRTdataset (247 images).

Figure 10 Segmentation outputs (contours and confusion matrix) using the public JSRT dataset.Results are shown for the best ((a) to (f)) and worst ((g) to (l)) 3 of 247 images. TN pixels are dark grey,TP are light grey, FP are white and FN are black.
Table 5 Segmentation methods for comparison (for 247 images in JSRT database)
Reference Method Complexity Overlap Sensitivity Specificity Accuracy ExecutionTime
Proposedmethod
Rule Unsupervisedand fullyautomated
0.870 ± 0.059 0.928 0.971 0.958 10-15 s (512by 512)
[14] Rule Labelling N/A N/A N/A 0.816 N/A
[34] Model Supervised N/A 0.956 0.984 N/A N/A
[17] Hybrid:Model + pixel
Supervised 0.949 ± 0.020 N/A N/A N/A N/A
[36] Hybrid:Model + rule
Supervised 0.94 ± 0.053 N/A N/A N/A N/A
[37] Hybrid:Rule + Shape
Supervised 0.954 ± 0.015 N/A N/A N/A 85-90s (512by 512)
Wan Ahmad et al. BioMedical Engineering OnLine (2015) 14:20 Page 18 of 26

Wan Ahmad et al. BioMedical Engineering OnLine (2015) 14:20 Page 19 of 26
knowledge was needed to label each structure, our method performs much better with
the accuracy difference of 0.142. The proposed approach is unsupervised, low complex-
ity and computationally tolerable, yet provides satisfactory results.
Experiment on private datasets (SH)
To test the robustness of our unsupervised segmentation method, we have tested the algo-
rithm using a private chest radiographs database collected from Hospital Serdang,
Malaysia. Images in the private SH database contains both PA and AP chest radiographs,
obtained from three different machines: one standard stationary machine (Siemens FD-X)
and the other two are the mobile machines (ADC5146 and CR0975). The images from
Siemens FD-X machine are the standard radiograph and do not need any pre-processing
prior to the segmentation. Whilst the images from the two mobile machines have very dif-
ferent properties: CR0975 are with unnecessary background, thus need to be pre-
processed by the cropping block; and ADC5146 are inverted image with unnecessary back-
ground, and need to be pre-processed by both contrast adjustment and cropping block.
The performance measures for standard PA chest radiographs from the private data-
set (Siemens FD-X) are shown in Table 6. The segmentation results using the JSRT
dataset outperforms the private dataset by 0.06 of the overlap measure. This is due to
the homogenous intensity appearance of JSRT dataset, especially after pre-processed by
the contrast adjustment block, whilst Siemens FD-X dataset performs above average
despites not being pre-processed.
The quantitative results for the private PA datasets are shown in Figure 11. Perform-
ance measures for this dataset can be loosely compared with those obtained from the
JSRT dataset. Strict comparison is not possible since they were applied on different sets
of data. It can be seen that the accuracy for 85% of the images are higher than 0.90,
and the F-score gives 58% of measure above 0.90 and 92% are above 0.80. The overlap
score achieves above 0.80 for 71% of the whole image, thirteen images having scores
between 0.70 and 0.79, nine images with 0.60 to 0.69 and one with the lowest score of
0.59. The same cause as JSRT dataset can be deduced as the culprit of the low overlap
measures. Besides, the overall performance of the private dataset is affected by the het-
erogeneous intensity of the images, while the public dataset contains images of good
technical quality. The segmentation results are visually presented in Figure 12, with the
lung contours generated by the proposed method superimposed on the original images,
together with the confusion matrix, corresponding to the best and worst three segmen-
tation outputs.
Table 7 presents the performance measures for mobile images obtained from two
portable machines which contain both PA and AP radiographs from the private image
database (CR0975 and ADC5146). The overall performances of both datasets are below
Table 6 Lung field segmentation for standard PA chest radiographs using the privateimage database (SH: Siemens FD-X)
Overlap Accuracy F-score Precision Sensitivity Specificity
mean 0.8084 0.9381 0.8922 0.8607 0.9340 0.9395
std 0.0723 0.0297 0.0468 0.0626 0.0765 0.0379
min 0.5931 0.8540 0.7446 0.6594 0.6491 0.7890
max 0.9071 0.9750 0.9513 0.9493 0.9986 0.9868

0 20 40 60 800.5
0.6
0.7
0.8
0.9
1
Images
Per
form
ance
Mea
sure
overlapf-scoreaccuracy
Figure 11 Performance measures of the proposed method for each image using the private SH:Siemens FD-X dataset (79 images).
Figure 12 Segmentation outputs (contours and confusion matrix) using the private Siemens FD-Xdataset. Results are shown for the best ((a) to (f)) and worst ((g) to (l)) 3 of 79 images. TN pixels are darkgrey, TP are light grey, FP are white and FN are black.
Wan Ahmad et al. BioMedical Engineering OnLine (2015) 14:20 Page 20 of 26

Table 7 Lung field segmentation for mobile PA and AP chest radiographs using theprivate image database (SH: CR0975 and ADC5146)
Overlap Accuracy F-score Precision Sensitivity Specificity
SH: CR0975
mean 0.6902 0.9020 0.7958 0.8149 0.8393 0.9258
std 0.2049 0.0642 0.1795 0.0996 0.2532 0.0604
min 0.1227 0.7287 0.2186 0.5527 0.1310 0.7458
max 0.8827 0.9677 0.9377 0.9910 0.9985 0.9989
SH: ADC5146
mean 0.6977 0.9195 0.8121 0.8555 0.8095 0.9501
std 0.1472 0.0442 0.1252 0.0841 0.2004 0.0532
min 0.2841 0.8183 0.4424 0.6773 0.3021 0.8047
max 0.8328 0.9698 0.9088 0.9543 0.9978 0.9928
Wan Ahmad et al. BioMedical Engineering OnLine (2015) 14:20 Page 21 of 26
average, due to most abnormalities present in the radiograph. The former dataset con-
tains 14 abnormal cases (out of 34 images), and 9 from 12 images in the latter dataset
are abnormal. However, the segmentation outputs show that almost all images from
both datasets have their bottom lung border (at least one side of the lung) around the
costophrenic angle are detected. A normal chest has almost symmetry shape (except
the heart area in the left lung) with same level of costophrenic angle, thus, this infor-
mation can be used to detect the consolidations.
Figure 13 illustrates the quantitative results of the segmentation performance using
the private database. The three best and worst segmentation outputs are qualitatively
presented in Figure 14. The lung contours are superimposed on the pre-processed
image instead of original image. From the results, we can see that 16 images achieve
overlap score above 0.80, 28 images are above 0.70, and the worst 6 are below 0.50,
generated from AP radiographs. It is interesting to note that the top 13 scores are
mostly from mobile PA radiographs, and the last 15 scores are all AP images. This
shows that the proposed method is more suitable to segment out the lung field in PA
radiographs, either acquired by mobile or standard X-Ray machine.
Performance comparison on all datasets with other unsupervised methods
In this section, we compare the proposed unsupervised method with other commonly
used unsupervised segmentation methods: the Fuzzy C- Means (FCM) clustering and
Otsu thresholding. Clustering using FCM is widely used for lung segmentation in CT
thorax because of the distinct bone and cell tissue. For lung segmentation in CXR, we
use four clusters FCM with combinations of several morphological operations. This
work has applied Otsu’s thresholding with slope information based on the pixels distri-
butions. In addition, it is also combined with few sequential morphological operations
to clear the image from the remaining noises and refine the lung edges. The results are
compared with the proposed method using both datasets (public and private) to see the
effectiveness of all unsupervised methods. The results are presented in Table 8.
From the overall results of both FCM and thresholding, we can see that FCM performs
better for all datasets. The differences of the overlap measures between these two methods
are 0.060 for JSRT, 0.078 for Siemens FD-X, 0.091 for CR0975 and 0.044 for ADC5146
datasets. The accuracy and specificity of all datasets are above 0.90 when using FCM,

0 10 20 30 40 500
0.2
0.4
0.6
0.8
1
Images
Per
form
ance
Mea
sure
overlapf-scoreaccuracy
Figure 13 Performance measures for each image of both private mobile datasets (CR0975 andADC5146) with 46 images in total.
Figure 14 Segmentation outputs (contours and confusion matrix) on combined private mobiledataset (CR0975 and ADC5146). Results are shown for the best ((a) to (f)) and worst ((g) to (l)) 3 of 46images. TN pixels are dark grey, TP are light grey, FP are white and FN are black.
Wan Ahmad et al. BioMedical Engineering OnLine (2015) 14:20 Page 22 of 26

Table 8 Lung field segmentation using other unsupervised methods (FCM andthresholding)
Overlap Accuracy F-score Precision Sensitivity Specificity
FCM on JSRT
mean 0.7896 0.9334 0.8783 0.9202 0.8514 0.9652
std 0.1031 0.0277 0.0734 0.0475 0.1175 0.0257
min 0.2513 0.8239 0.4017 0.6417 0.2589 0.7669
max 0.9048 0.9723 0.9500 0.9897 0.9882 0.9982
FCM on SH: Siemens FD-X
mean 0.8011 0.9396 0.8865 0.8796 0.9044 0.9530
std 0.0904 0.0250 0.0626 0.0813 0.0869 0.0309
min 0.4459 0.8312 0.6168 0.5071 0.4672 0.8224
max 0.9082 0.9804 0.9519 0.9707 0.9822 0.9896
FCM on SH: CR0975
mean 0.7282 0.9146 0.8353 0.8243 0.8661 0.9316
std 0.1282 0.0448 0.1041 0.0871 0.1540 0.0413
min 0.2725 0.7511 0.4283 0.6013 0.3326 0.8295
max 0.8724 0.9618 0.9318 0.9739 0.9879 0.9932
FCM on SH: ADC5146
mean 0.4941 0.8601 0.6464 0.6062 0.7245 0.8895
std 0.1581 0.0627 0.1547 0.1721 0.1823 0.0675
min 0.2045 0.7227 0.3396 0.3398 0.3021 0.7340
max 0.6571 0.9250 0.7931 0.8571 0.9108 0.9733
Thresholding on JSRT
mean 0.7293 0.8963 0.8396 0.7876 0.9117 0.8875
std 0.0980 0.0443 0.0686 0.0944 0.0853 0.0648
min 0.3865 0.7381 0.5575 0.4352 0.4738 0.6374
max 0.9206 0.9682 0.9587 0.9526 0.9973 0.9815
Thresholding on SH: Siemens FD-X
mean 0.7232 0.8993 0.8361 0.7514 0.9539 0.8789
std 0.0908 0.0364 0.0624 0.0993 0.0422 0.0522
min 0.4931 0.8017 0.6605 0.4981 0.7510 0.7499
max 0.8953 0.9665 0.9448 0.9304 0.9967 0.9741
Thresholding on SH: CR0975
mean 0.6376 0.8479 0.7667 0.6738 0.9294 0.8167
std 0.1578 0.0862 0.1290 0.1505 0.1278 0.1200
min 0.2182 0.6509 0.3582 0.3444 0.2526 0.5813
max 0.8810 0.9687 0.9367 0.9306 0.9999 0.9770
Thresholding on SH: ADC5146
mean 0.4502 0.8209 0.6075 0.5233 0.7777 0.8271
std 0.1423 0.0676 0.1492 0.1711 0.1949 0.0796
min 0.1346 0.6709 0.2373 0.1884 0.3206 0.7339
max 0.6230 0.9150 0.7677 0.7306 0.9548 0.9647
Wan Ahmad et al. BioMedical Engineering OnLine (2015) 14:20 Page 23 of 26

Wan Ahmad et al. BioMedical Engineering OnLine (2015) 14:20 Page 24 of 26
except the second mobile CXR machine (ADC5146), which is considerably high at above
0.86. Other performance measures are more than 0.80 for all datasets except the same
ADC5146. This is due to the poor image quality in the dataset and most of the images
contain severe diseases that cause lung shape deformation. The results from thresholding
method give similar pattern, where poorer results are obtained for ADC5146 dataset.
By comparing the overlap measures for FCM and the proposed method, most of the
datasets perform better with the proposed method, except on mobile machine CR0975
where FCM is higher by 0.038. For other datasets, our method is higher by 0.08 for
JSRT, 0.007 for Siemens FD-X, and significantly higher on ADC5146 which is by 0.204.
The accuracy and specificity of the method are above 0.90 for all datasets, and other
performance measures are above 0.80, including the rounded F-score measure for
CR0975 dataset. The proposed method also recorded low standard deviation measure,
and high minimum and maximum measures on most datasets. This portrays that our
unsupervised algorithm is more robust and perform reasonably better with any CXR
dataset, either the standard PA or mobile PA and AP radiographs.
ConclusionsThis paper has realized a novel lung segmentation algorithm for chest radiographs in-
cluding the image pre-processing stages with contrast adjustment and cropping blocks
to standardize the images especially for the radiograph acquired by the mobile ma-
chines. The main contribution of this paper lies in the use of fully automated proposed
segmentation method to isolate the lung field from PA and mobile AP chest radio-
graphs for the application of CBMIRS. The technique is based on Gaussian oriented
derivatives filter with integration of FCM and thresholding to refine the lung outline.
Another novel algorithm to generate an automatic threshold value for each orientation
responses was also proposed. Our proposed method is fully automated, unsupervised
and no training or learning stage is necessary.
We also compared the proposed method with the existing methods from the litera-
ture on the public JSRT dataset, and applied other unsupervised methods based on
FCM and Otsu thresholding to compare the results with both public and private data-
sets. Our method gives better performance measures on standard PA radiographs, with
overlap score and accuracy of 0.870 and 0.958 respectively for JSRT dataset, and 0.808
and 0.938 for Siemens FD-X dataset. The measures from JSRT compares satisfactorily
with the existing methods from the literature. For mobile PA and AP radiographs, both
datasets performs below average with any of the unsupervised methods, due to the
most abnormalities present. For CR0975 dataset, highest overlap score and accuracy
are obtained using FCM based approach, where the measures are 0.728 and 0.915 re-
spectively. Whilst for ADC5146 dataset, the performance measures are significantly
higher using our proposed method; 0.698 and 0.920 for both overlap and accuracy.
Even though the algorithm fails to accurately segment the lung field in mobile radio-
graphs, information on general lung outline can still be used to detect the consolida-
tions in the lung field, which will be studied in our next work. In addition, the ultimate
goal of this work is to incorporate the proposed method in the Content-based Medical
Image Retrieval System (CBMIRS) for Chest X-Ray. It is important to take note that
the unsupervised method is mandatory for a robust retrieval system.

Wan Ahmad et al. BioMedical Engineering OnLine (2015) 14:20 Page 25 of 26
Competing interestsThe authors declare that they have no competing interests.
Authors’ contributionsWSHMWA carried out the experiments and draft out the manuscript. The experiments were supervised by bothsupervisors, MFAF and WMDWZ. Eleven drafts of the manuscript were checked thoroughly by MFAF and WMDWZ andrevised by WSHMWA until the final version was approved by all authors.
AcknowledgementsThe authors would like to thank Dr. Fadzilah Hashim, Radiologists in Diagnostic Imaging Department, SerdangHospital, Malaysia, for providing the chest radiographs dataset and medical advice. This research is supported in partby GGPM-2013-012 and FRGS/1/2012/TK06/UKM/03/2.
Author details1Faculty of Engineering, Multimedia University, Persiaran Multimedia, Cyberjaya, Selangor, Malaysia. 2Department ofElectric, Electronic & Systems Engineering, Faculty of Engineering and Built Environment, Universiti KebangsaanMalaysia, Bangi, Selangor, Malaysia.
Received: 22 September 2014 Accepted: 11 February 2015
References
1. Murray CJ, Lopez AD. Mortality by cause for eight regions of the world: global burden of disease study. Lancet.1997;349(9061):1269–76.2. Goldstone K, Yates SJ. Radiation issues governing radiation protection and patient doses in diagnostic imaging. In:
Adam A, Dixon AK, editors. Grainger & Allison’s diagnostic radiology. New York: Churchill Livingstone; 2008.3. Firmino M, Morais A, Mendoça R, Dantas M, Hekis H, Valentim R. Computer-aided detection system for lung cancer
in computed tomography scans: Review and future prospects. BioMedical Engineering OnLine. 2014;13(1):1–16.4. Qi S, van Triest HJ, Yue Y, Xu M, Kang Y. Automatic pulmonary fissure detection and lobe segmentation in CT
chest images. BioMedical Engineering OnLine. 2014;13(1):59.5. Lassen B, van Rikxoort EM, Schmidt M, Kerkstra S, van Ginneken B, Kuhnigk JM. Automatic Segmentation of the
Pulmonary Lobes From Chest CT Scans Based on Fissures, Vessels, and Bronchi. Medical Imaging, IEEE Transactionson. 2013;32(2):210–22.
6. Lo P, van Rikxoort EM, Abtin F, Ahmad S, Ordookhani A, Goldin J, et al. Automated segmentation of pulmonarylobes in chest CT scans using evolving surfaces. 2013.
7. Zhou S, Cheng Y, Tamura S. Automated lung segmentation and smoothing techniques for inclusion ofjuxtapleural nodules and pulmonary vessels on chest CT images. Biomed Signal Process Control. 2014;13:62–70.
8. Chen B, Kitasaka T, Honma H, Takabatake H, Mori M, Natori H, et al. Automatic segmentation of pulmonary bloodvessels and nodules based on local intensity structure analysis and surface propagation in 3D chest CT images.International Journal of Computer Assisted Radiology and Surgery. 2012;7(3):465–82.
9. Shiraishi J, Katsuragawa S, Ikezoe J, Matsumoto T, Kobayashi T, Komatsu K, et al. Development of a digital imagedatabase for chest radiographs with and without a lung nodule: receiver operating characteristic analysis ofradiologists' detection of pulmonary nodules. AJR Am J Roentgenol. 2000;174(1):71–4.
10. Iakovidis DK, Papamichalis G. Automatic segmentation of the lung fields in portable chest radiographs based onBézier interpolation of salient control points. In: Imaging systems and techniques, 2008. IST 2008. IEEEInternational Workshop on. 2008.
11. Iakovidis DK, Savelonas M. Active shape model aided by selective thresholding for lung field segmentation inchest radiographs. In: Information technology and applications in biomedicine, 2009. ITAB 2009. 9th InternationalConference on. 2009.
12. van Ginneken B, ter Haar Romeny BM, Viergever MA. Computer-aided diagnosis in chest radiography: a survey.Med Imaging IEEE Trans. 2001;20(12):1228–41.
13. Annangi P, Thiruvenkadam S, Raja A, Xu H, XiWen S, Ling M. A region based active contour method for x-ray lungsegmentation using prior shape and low level features. in Biomedical Imaging: From Nano to Macro, 2010 IEEEInternational Symposium on. 2010.
14. Ben Hassen D, Taleb H, Ben Yaakoub I, Mnif N. A Fuzzy Approach to Chest Radiography Segmentation involvingSpatial Relations. In: IJCA Special Issue on Novel Aspects of Digital Imaging Applications (DIA). 2011. p. 40–7.
15. Shi Z, Zhou P, He L, Nakamura T, Yao Q, Itoh H. Lung Segmentation in Chest Radiographs by Means of GaussianKernel-Based FCM with Spatial Constraints. 2009. p. 428–32.
16. Rastgarpour M, Shanbehzadeh J, Soltanian-Zadeh H. A hybrid method based on fuzzy clustering and localregion-based level set for segmentation of inhomogeneous medical images. J Med Syst. 2014;38(8):1–15.
17. van Ginneken B, Stegmann MB, Loog M. Segmentation of anatomical structures in chest radiographs usingsupervised methods: a comparative study on a public database. Med Image Anal. 2006;10(1):19–40.
18. Osareh A, Shadgar B. A segmentation method of lung cavities using region aided geometric snakes. J Med Syst.2010;34(4):419–33.
19. Verma NK, Roy A, Vasikarla S. Medical image segmentation using improved mountain clustering techniqueversion-2. 2010. p. 156–61.
20. Long C, Chen CLP, Mingzhu L. A multiple-kernel fuzzy C-means algorithm for image segmentation. IEEE Trans SystMan Cybern B Cybern. 2011;41(5):1263–74.
21. Zhao Z, Cheng L, Cheng G. Neighbourhood weighted fuzzy c-means clustering algorithm for image segmentation.Image Process IET. 2014;8(3):150–61.

Wan Ahmad et al. BioMedical Engineering OnLine (2015) 14:20 Page 26 of 26
22. Chen Y, Zhang J, Wang S, Zheng Y. Brain magnetic resonance image segmentation based on an adaptednon-local fuzzy c-means method. IET Computer Vision. 2012;6(6):610–25.
23. Gomathi M, Thangaraj. A new approach to lung image segmentation using fuzzy possibilistic c-means algorithm.CoRR. 2010. abs/1004.1768.
24. Antonelli M, Frosini G, Lazzerini B, Marcelloni F. A CAD System for Lung Nodule Detection based on anAnatomical Model and a Fuzzy Neural Network. in Fuzzy Information Processing Society, 2006. NAFIPS 2006.Annual meeting of the North American. 2006.
25. El-Sonbaty Y, Youssef S, Fathalla K. Enhanced fuzzy-based models for ROI extraction in medical images. In: Kim T-Het al., editors. Signal processing, image processing and pattern recognition. Berlin Heidelberg: Springer; 2011.p. 26–35.
26. Jaffar MA, Hussain A, Mirza A. Fuzzy entropy based optimization of clusters for the segmentation of lungs in CTscanned images. Knowl Inf Syst. 2010;24(1):91–111.
27. Karthikeyan CRB, Baskar S. Segmentation algorithm for CT images using morphological operation and artificialneural network. Int J Signal Process Image Process Pattern Recognit. 2012;5(2):115–22.
28. Moon WK, Lo CM, Goo JM, Bae MS, Chang JM, Huang CS, et al. Quantitative analysis for breast density estimationin low dose chest CT scans. J Med Syst. 2014;38(3):21.
29. Pham DL, Prince JL. Adaptive fuzzy segmentation of magnetic resonance images. IEEE Trans Med Imaging.1999;18(9):737–52.
30. Parveen NR, Sathik MM. Detection of pneumonia in chest X-ray images. J Xray Sci Technol. 2011;19(4):423–8.31. Mehta IC, Khan ZJ, Khotpal RR, et al. Volumetric measurement of heart using PA and lateral view of chest
radiograph. In: Manandhar S, editor. Applied computing. Berlin Heidelberg: Springer; 2004. p. 34–40.32. Alzubaidi M, Balasubramanian VN, Patel A, Panchanathan S, Black JA. Efficient atypicality detection in chest
radiographs. in Information Science, Signal Processing and their Applications (ISSPA), 2012 11th InternationalConference on. 2012.
33. van Ginneken B, Frangi AF, Staal JJ, ter Haar Romeny BM, Viergever MA. Active shape model segmentation withoptimal features. IEEE Trans Med Imaging. 2002;21(8):924–33.
34. Juhász S, Horváth A, Nikházy L, Horváth G, Horváth A. Segmentation of Anatomical Structures on ChestRadiographs. In: Bamidis P, Pallikarakis N, editors. XII Mediterranean Conference on Medical and BiologicalEngineering and Computing 2010. Berlin Heidelberg: Springer; 2010. p. 359–62.
35. Xu T, Mandal M, Long R, Cheng I, Basu A. An edge-region force guided active shape approach for automatic lungfield detection in chest radiographs. Comput Med Imaging Graph. 2012;36(6):452–63.
36. Dawoud A. Fusing shape information in lung segmentation in chest radiographs. 2010.37. Candemir S, Jaeger S, Palaniappan K, Musco JP, Singh RK, Zhiyun X, et al. Lung Segmentation in Chest Radiograps
Using Anatomical Atlases with Non-rigid Registration. IEEE Trans Med Imaging. 2014;33(2):577–90.38. Bezdek JC, Dunn JC. Optimal fuzzy partitions: a heuristic for estimating the parameters in a mixture of normal
distributions. Comput IEEE Trans. 1975;C-24(8):835–8.39. Bezdek JC. A convergence theorem for the fuzzy ISODATA clustering algorithms. IEEE Trans Pattern Anal Mach
Intell. 1980;2(1):1–8.40. Bezdek JC, Pal SK. Fuzzy models for pattern recognition. 267th ed. New York: IEEE press; 1992.
Submit your next manuscript to BioMed Centraland take full advantage of:
• Convenient online submission
• Thorough peer review
• No space constraints or color figure charges
• Immediate publication on acceptance
• Inclusion in PubMed, CAS, Scopus and Google Scholar
• Research which is freely available for redistribution
Submit your manuscript at www.biomedcentral.com/submit