![el-conf.com · ± з віком однолітки все менше співчувають жертві [3, с. 71 ± 79]. Аналіз педагогічної літератури](https://static.fdocuments.us/doc/165x107/5ebde75d42c1fd475e651b2f/el-confcom-foe.jpg)


Languages
Pages
Legal

The potential for low cost manufacturing of safe plasma products
John Curling, Christopher Bryant, Tom Chen, Timothy HayesProMetic BioTherapeutics, Inc.
Neil Goss, Further Options Ltd.
Andrew Sinclair, Janice Lim, BioPharm Services Ltd.
Mahesh Prashad, Sartorius Stedim Biotech
PPB09 Menorca, SpainMay 11th - 15th, 2009

2 © JMC/JCC AB May 2009
Viral safety at the plasma stage
0
200
400
600
800
1000
1200
1400
1600
HIV HBV HCV
USPopulationDonorApplicantsQualifiedDonations
Rat
es p
er 1
00,0
00 P
opul
atio
n
Adap
ted f
rom
Kre
il, T
, IP
PC 2
004
• 100 fold reduction of risk by selection• 100,000,000 fold reduction of risk
in production• 100 fold reduction of risk by testing
• 56% (15 M litres) of the world supply of plasma (26.5 M litres) comes from North America (2008)
• Current pricing is ca. $148/litre• Range $140 - $160 (2008)
(MRB April 2009)
• Collection + testing >$100/litre

3 © JMC/JCC AB May 2009
Recalls, withdrawals, quarantines
• 1997/1998 vCJD effect• 5-10% reduction in IVIG output from
quarantine or destruction in 1997• End product manufacturing limited by
withdrawals and quarantines
• Qualified donors: 2-4% drop in collections
• 1.2% of collections destroyed• Hold cost: + $0.25/L• NAT testing: +$5-$15/L• Minipool testing• Retesting of final products
Adapted from Rankin, PJ, IPPC 2004 and Robert P, IPPC 2007

4 © JMC/JCC AB May 2009
Processing safety: safety adds cost
Instituto Grifols, S. A. Barcelona, November, 2006
Specific viral inactivation/removal steps add cost:
• Cost for the step• Cost for the additional steps• Cost for the work in progress
TSE clearance

5 © JMC/JCC AB May 2009
Capex/Opex calculation model
Economic Benefits of Single-Use Membrane Chromatography in Polishing. A Cost of Goods Model.Janice Ai Chye Lim, Andrew Sinclair, Doug Sang Kim, and Uwe Gottschalk BioProcess International Vol. 5, No. 2: pp 60-64 (February 2007)
COG CAPITAL
User InterfaceUser Interface Utilities
Labour MaterialsMaterialsEquipment
List ConsumablesProductionProduction
SiteReference
Process DefinitionUSP, Recovery, DSP
Process Definition

6 © JMC/JCC AB May 2009
Revenue calculation summary
Product Plasma conc./L
Yield, g or IU/L
Yield, % US$/g or IU
Revenue/L(Potential)
Revenue/L(Adjusted)
vWF/Factor VIII 1,000 IU 450 IU 45% 0.7 $315 $158 (50%)
IVIG 8 g/L 5.6 70% 70 $392 $392
A1PI 1.2 g/L 0.8 67% 400 $320 $64 (20%)
HSA 35 g/L 25 71% 4 $100 $100
Total potential revenue/litre plasma $1,127
Total adjusted revenue/litre plasma $714
vWF/FVIII calculated as FVIII:C
• CSL: A$ 900/litre plasma, currently US$640• Talecris: A$ 580/litre plasma, currently US$413(Helen Cameron of Citigroup, quoted by Bloomberg, August 2008)
7 © JMC/JCC AB May 2009
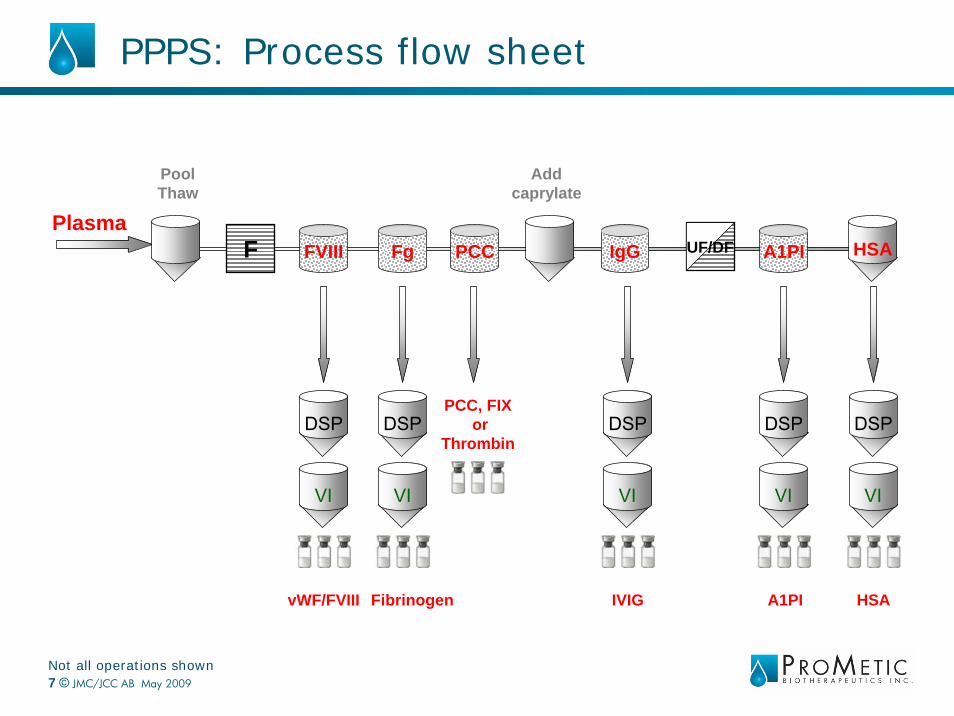
PPPS: Process flow sheet
PoolThaw
Addcaprylate
PlasmaFVIII IgGF UF/DFPCC A1PI HSAFg
FibrinogenvWF/FVIII
DSP
VI
DSP
VI
PCC, FIXor
ThrombinDSP
VI
IVIG
DSP
VI
A1PI
DSP
VI
HSA
Not all operations shown

8 © JMC/JCC AB May 2009
Basic unit operations
Number % of total
Bind-elute chromatography 5 14%
Flow-though chromatography 5 14%
Filtration (clarification) 4 11%
TFF (UF/DF) 9 26%
Nanofiltration 2 6%
Sterile filtration 4 11%
Others (incl. precipitation) 6 17%
Total 35 100%
• 2/3 of all operations are membrane based• <1/3 are chromatographic

9 © JMC/JCC AB May 2009
Input variables
• 100,000 litre or 500,000 L annual plasma throughput capacity
• Capacity utilization ca. 100%• At 100,000 L: 450 litre lot size, started 5 times/week• At 500,000 L: 2,200 litre lot size, started 5 times/week• 45 weeks operation/year• Operator hours/week = 40
• Concentrated solutions prepared for 5 batches• Disposable options for product and solution hold up to 3,000 L• Liner disposable system

10 © JMC/JCC AB May 2009
Capital cost summary
Description Investment cost
100,000 litres 500,000 litres
Equipment $13.4 M $ 21.4 M
Sub-contractors $35.0 M $ 58.4 M
Total Cost of Works $48.4 M $ 79.8 M
Engineering fees + Validation $16.9 M $ 27.9 M
Total Project Cost $65.3 M $ 107.7 M
vWF/FVIII15%
IgG32%
A1PI32%
HSA21%
Investment by product

11 © JMC/JCC AB May 2009
Engineering and validation fees: 100,000 L
Cost category Engineering ratio*
Validation costs 15%
Engineering fees 20%
Total fees $28 M
*Experience based engineering ratios provided by BioPharm ServicesAs % of Cost of Works - $79.8 M

12 © JMC/JCC AB May 2009
Capital cost references
Company Capacity, Litres CAPEX, US$, M Date
Alfa Laval Biokinetics/ProMetic 500,000 $129 PPB 2005
BioPharm Services/ProMetic 500,000 $107 PPB2009
Contractor 500,000 $100 -125 2007
Kedrion/Glatt Engineering, Russia 300,000 up to 600,000 $119 Feb. 2006
Jeddah Biotechnical Co., Saudi Arabia 500,000 $200 March 2007
NACO/Govt. of India (Chennai?) 150,000 $37 (Rs 185 crore) Oct 2008
Intas (Celestial Biologics) (GE) 150,000 up to 300,000 $20 Jan 2009

13 © JMC/JCC AB May 2009
Cost distribution at 500,000 litre scale
Plasma43%
Buffers + solids10%
Resins5%
Other3%
Filters + bags25%
Utilities2%
Labour/QC12%
Cost distribution per litre plasma fractionated at 500,000 litre plant capacity, excluding capital costsBatch size: 2,200 litres. Plasma = $120/litre. Fractionation cost = $154. Σ = $274

14 © JMC/JCC AB May 2009
Distribution of costs at 100,000 L
Plasma22%
Resins2%
Filters/bags17%
Labour22%
Capital23%
Utilities4%
Engineering 5%
Buffers/Solns5%
Plasma28%
Resins3%
Filters/bags22%
Labour29%
Utilities5%
Engineering 5%
Buffers/Solns5%

15 © JMC/JCC AB May 2009
Cost per gram of product at 100,000 L
• Excluding capital• Plasma cost allocation: vWF/FVIII 20%, IgG 40%, A1PI 20%, Albumin 20%
vWF/FVIII15%
IgG40%
A1PI28%
Albumin17%
Product Cost, $/g Revenue, $/g
vWF/FVIII 23,741 3.5 M*
IgG 29 70
A1PI 147 400
HSA 3 4* Equivalent to $0.7/IU

16 © JMC/JCC AB May 2009
Costs compared to PPTA model
Cost distribution per litre plasma including capital costs.PPTA costs adapted from Bult, J. IPPC, Warszawa 2008.PPPS costs from BioPharm Services model, January 2009
Plasma Plasma
Fractionation
FractionationOperations
Operations
Fixed costs
Fixed costs
0
50
100
150
200
250
300
PPTA Est. BioPharm Est.
US$/Litre plasma

17 © JMC/JCC AB May 2009
Costs at different scales
Values in US$ Scale, L
10,000 100,000 500,000 Grifols*
Cost/g IgG 64 31 23 27.0
Cost/g HSA 9 4 2 1.46
Cost/g FVIII 60,000 27,000 17,000 0.16/IU
Scale, L
10,000 100,000 500,000 Grifols*
Cost/L IgG 33% 37% 48% 51%
Cost/L HSA 19% 19% 16% 21%
Cost/L FVIII 14% 15% 15% 20%
* Financing plasma proteins: Unique challenges, Pharmaceuticals Policy and Law 2005/2006

18 © JMC/JCC AB May 2009
CAPEX/OPEX cost summary
Scale, L
10,000 100,000 500,000
Total CAPEX 52.5 M 68.5 M 108 M
Total OPEX* 1,095/L 476/L 274/L
Values in US$
* Includes plasma @ $120/L, excludes capital charge
Grifols reports fractionation cost range of €120 - €140/LFinancing plasma proteins: Unique challenges, Pharmaceuticals Policy and Law 2005/2006

19 © JMC/JCC AB May 2009
The low CAPEX model – Myth or reality?
CAPEX $ M
Cost category BioPharm Contractor Low cost alt.* % discount
Process equipment 15.5 14 7 50%
Process utilities 5.6 14 incl. HVAC 7 50%
Installation + Pipework 17.8 13 7 50%
HVAC 7.1
Instrumentation + Control 12.1 13 7 50%
Electrical power 5.2
Building + fit out 16.4 35 11 70%
Fees and validation 28.0 12 6 50%
Total $107.7 M $101 M $45 M
* An Indian dream?
20 © JMC/JCC AB May 2009
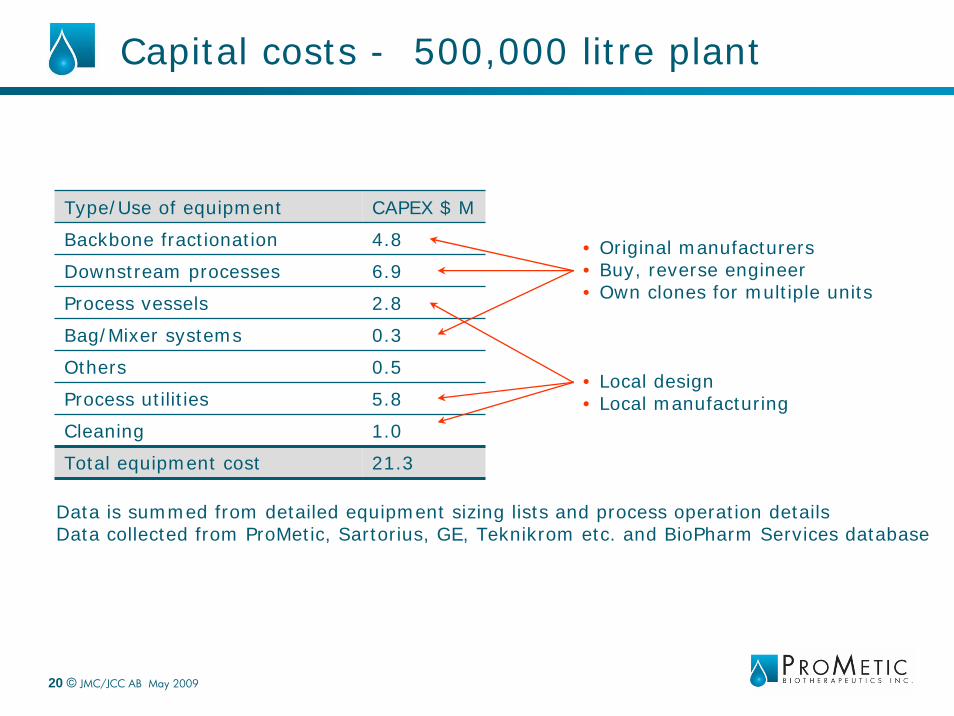
Capital costs - 500,000 litre plant
Type/Use of equipment CAPEX $ M
Backbone fractionation 4.8
Downstream processes 6.9
Process vessels 2.8
Bag/Mixer systems 0.3
Others 0.5
Process utilities 5.8
Cleaning 1.0
Total equipment cost 21.3
Data is summed from detailed equipment sizing lists and process operation detailsData collected from ProMetic, Sartorius, GE, Teknikrom etc. and BioPharm Services database
• Original manufacturers• Buy, reverse engineer• Own clones for multiple units
• Local design• Local manufacturing

21 © JMC/JCC AB May 2009
Sub-contractor capital costs: 100,000 L
Cost category CAPEX $ M
Installation + Pipework 17.6
HVAC 7.1
Instrumentation + Control 12.1
Electrical power 5.2
Building 13.4
Fit out 3.0
Total sub-contractors $58.4 M
Experience based engineering ratios provided by BioPharm ServicesAs % of Equipment Cost - $21.3 M
• OEM
• Local design• Local fabrication

22 © JMC/JCC AB May 2009
Labour costs and opportunities
Personnel Salary
Production supervisors $68,000
Production and Engineering $60,000
Administration etc. $40,000
Laboratory staff $48,000
QA/Regulatory affairs $61,500
Validation $64,000
Overhead calculated at 55%
Personnel Number
Production supervisors 153
All others 53
Total 206
500,000 Litre Plant
100
312 12
9488
33
0
20
40
60
80
100
120
USA China Brazil Mexico EU (15) Japan Asia (NIEs)US Bureau of Labor Statistics: Production workers in manufacturing
US = $21.11, 2002

23 © JMC/JCC AB May 2009
Design opportunities and fear of the new
• Made in India• Designed in India?
• Made in China• Designed in China?
Antonio Gaudi, Casa Batlló, Barcelona (1905-1907)
Diagram from: Mottl, H. 3A Global Markets. Opportunities for outsourcing, Cambridge, 2005.

24 © JMC/JCC AB May 2009
Comparative R & D cost opportunities
Mottl, H. 3A Global Markets. Opportunities for outsourcing, Cambridge, 2005.
• Discovered, researched, developed, manufactured and marketed?

25 © JMC/JCC AB May 2009
Comparison with outsourcing, risks
PricewaterhouseCoopers: The changing dynamics of outsourcing in Asia, 2008
26 © JMC/JCC AB May 2009
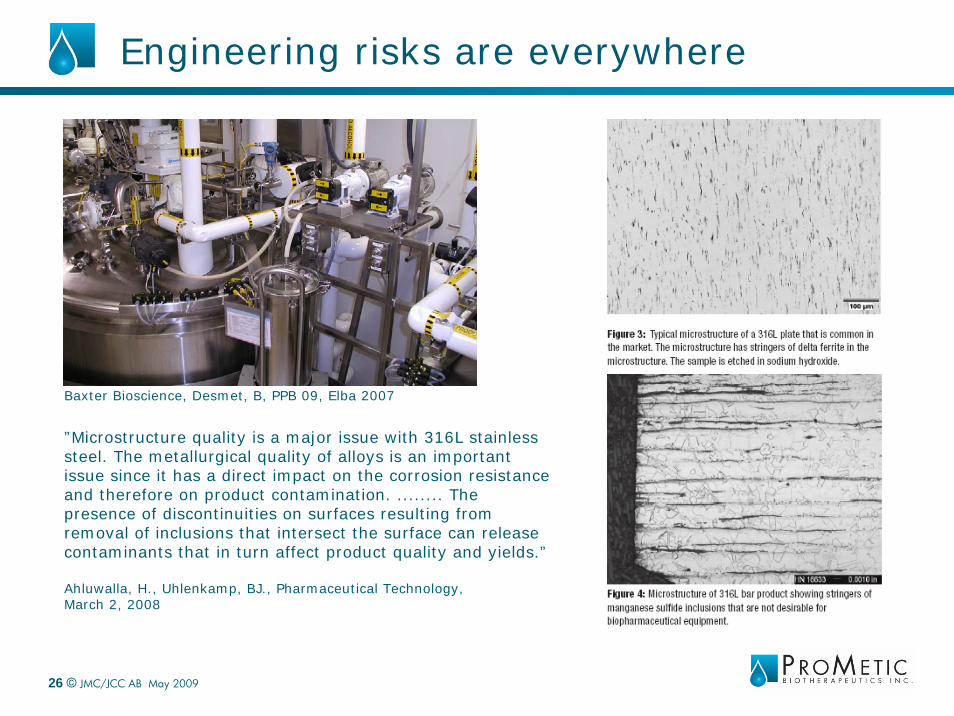
Engineering risks are everywhere
Baxter Bioscience, Desmet, B, PPB 09, Elba 2007
”Microstructure quality is a major issue with 316L stainless steel. The metallurgical quality of alloys is an important issue since it has a direct impact on the corrosion resistance and therefore on product contamination. ........ The presence of discontinuities on surfaces resulting from removal of inclusions that intersect the surface can release contaminants that in turn affect product quality and yields.”
Ahluwalla, H., Uhlenkamp, BJ., Pharmaceutical Technology,March 2, 2008

27 © JMC/JCC AB May 2009
Quality risks – still learning
” I don’t understand what’s wrong with yesterday’s quality”(R & D Director, Biopharmaceuticals)
• 1820 US Pharmacopoeia established• 1902 The Biologics Control Act – purity and safety of sera and vaccines• 1906 Food and Drugs Act• 1933 – 1938. Revision of 1906 Act, ”Elixir of sulfanilamide” incident (1937),
The Federal Food, Drug, and Cosmetics Act (1938)• 1941 ”Sulfathiazole” incident leads to establishing GMP • 1941 Insulin amendment – FDA must test and certify purity and potency• 1945 Penicillin amendment – FDA must test safety and efficacy• 1952 ”Chloramphenicol” incident leads to adverse event reporting• 1953 Factory Inspection Amendment• 1962 ”Thalidomide”. Introduction of approval for sale• 1972 Regulation of biologics – sera, vaccines, blood products transferred
from NIH to FDA• 1983 Orphan Drug Act• 1997 FDA Modernization Act• 2005 Drug Safety Board
• 21stC: New FDA paradigms: Critical path, evidence-based, PAT, QbD• Don’t forget ICH!

28 © JMC/JCC AB May 2009
Regulatory challenges
In the last analysis, it is our conception of death which decides our answers to all the questions that life puts to us.
Dag Hammarskjöld, UN Secretary-General, 1953-1961
PopulationMillions
Under $1/day
Per capita expense
Life expectancy
Infant mortality
USA 302.8 - $3,074 69 7
Spain 44 - $1,641 73 4
India 1,151 34.3% $8 53 57
China 1,328 9.9% $38 64 20
USA Spain India China
Communicable 52.6 41.3 366.2 73.6
Non-communicable 722.4 773.1 462.6 562
Injuries 56.8 33.6 106.1 72Deaths/100,000 (2004)WHOSIS
Health indicatorsWHOSIS

John Curling Consulting ABSwedenborgsgatan 3-5, SE-753 34 Uppsala, Sweden
Acknowledgement
Friends and colleagues in the plasma and separation technologies industries
Top Related