


Languages
Pages
Legal

Limited Farsightedness in Network Formation
Georg Kirchsteiger, Marco Mantovani, Ana Mauleon,and Vincent Vannetelbosch †
Abstract
Pairwise stability Jackson and Wolinsky [1996] is the standard stability con-
cept in network formation. It assumes myopic behavior of the agents in the sense
that they do not forecast how others might react to their actions. Assuming that
agents are perfectly farsighted, related stability concepts have been proposed.
We design a simple network formation experiment to test these extreme theo-
ries, but find evidence against both of them: the subjects are consistent with an
intermediate rule of behavior, which we interpret as a form of limited farsight-
edness. On aggregate, the selection among multiple pairwise stable networks
(and the performance of farsighted stability) crucially depends on the level of
farsightedness needed to sustain them, and not on efficiency or cooperative con-
siderations. Individual behavior analysis corroborates this interpretation, and
suggests, in general, a low level of farsightedness (around two steps) on the part
of the agents.
JEL classification: D85, C91, C92
Keywords: Network formation, experiment, myopic and farsighted stability.
†Kirchsteiger: ECARES, Université Libre de Bruxelles, 44 Avenue Jeanne, B-1050 BrusselsBelgium (e-mail: [email protected]); Mantovani: Università degli studi di Milano, Conserva-torio 7, I-20122 Milan, Italy (e-mail: [email protected]); Mauleon: CEREC, UniversitéSaint-Louis - Bruxelles, Boulevard du Jardin Botanique 43, B-1000 Brussels, Belgium (e-mail:[email protected]); Vannetelbosch: CORE, Université catholique de Louvain, 34 voie du RomanPays, B-1348 Louvain-la-Neuve, Belgium (e-mail: [email protected]). AnaMauleon and Vincent Vannetelbosch are, respectively, Research Associate and Senior ResearchAssociate of the National Fund for Scientific Research (FNRS), Belgium.The authors would like to thank Matthew Jackson, Arno Riedl, Nagore Iriberri, Bram De Rock,Antonio Filippin, Francesco Guala, as well as participants to presentations in Barcelona, Bilbao,Bloomington, Bordeaux, Brussels, Cologne, Faro, Granada, Milan, Oxford, Paris and Utrecht forvaluable comments and suggestions to improve the paper. Financial support from Spanish Min-istry of Sciences and Innovation under the project ECO2009-09120 and from the Spanish Ministryof Economy and Competition under the project ECO2012-35820 are gratefully acknowledged.Kirchsteiger acknowledges financial support by the BNB (Banque National de Belgique) grant on"The Evolution of Market Institutions" and by the ARC grant on "Market Evolution, Competitionand Policy" (AUWB-08/13-ULB6).This paper supersedes “Myopic or farsighted? An experiment on network formation”, CEPRDiscussion Paper Nr. 8263, 2011.
1 Introduction
The network structure of social interactions influences a variety of behaviors and
economic outcomes, including the formation of opinions, decisions on which
products to buy, investment in education, access to jobs, and informal borrow-
ing and lending. A simple way to analyze the networks that one might expect
to emerge in the long run is to examine the requirement that individuals do not
benefit from altering the structure of the network. Any such requirement must
answer the question of how individuals assess those benefits.
An extreme answer to this problem is to assume perfect myopia on the part of
the agents, as in the pairwise stability notion, defined by Jackson and Wolinsky
[1996]. A network is pairwise stable if no individual benefits from severing one
of her links and no two individuals benefit from adding a link between them,
with one benefiting strictly and the other at least weakly. Individuals are myopic,
and not farsighted, in the sense that they do not forecast how others might react to
their actions. Indeed, the adding or severing of one link might lead to subsequent
addition or severing of another link, and so on. For instance, individuals might
not add a link that appears valuable to them given the current network, as that
might induce the formation of other links, ultimately leading to lower payoffs for
the original individuals.
The von Neumann - Morgenstern pairwise farsightedly stable set (VNMFS)
of networks predicts which networks one might expect to emerge in the long run
when individuals are farsighted. As the other approaches to farsighted stability,1
it incorporates the assumption that agents are perfectly farsighted, meaning they
can consider sequences of reactions to their moves of any length. As this consti-
tutes the exact opposite of perfect myopia, there appears to be an unbridged gap
between those extreme theories.
The closest attempt in this direction is the work of Dutta et al. [2005], which
allows for different degrees of farsightedness. In their equilibrium concept, for
a dynamic Markovian process of network formation,2 farsightedness is captured
by a discount factor, that applies to the stream of future payoffs. But as such it en-
tangles patience and farsightedness. Moreover, their dynamic equilibrium model
1See the work of Chwe [1994], Xue [1998], Herings et al. [2004, 2009], Mauleon and Vannetel-bosch [2004], Page et al. [2005], and Page and Wooders [2009].
2See Konishi and Ray [2003] for a similar approach to the formation of coalitions.
1
is hardly comparable to the static stability notions,3 in particular for intermediate
values of farsightedness.4
In our paper we test the myopic and the (possibly limited) farsighted types of
behaviors in the context of network formation and compare the stability notions
that are based on them. Network formation is hard to study in the field, as many
potentially conflicting factors are at work. Consequently, we run laboratory ex-
periments. To the best of our knowledge, this constitutes the first experimental
test of farsightedness versus myopia in network formation.
In the experiment, groups of four subjects had to form a network. More specif-
ically, they were allowed sequentially to add or sever one link at a time: a link
was chosen at random and the agents involved in the link had to decide if they
wanted to form it (if it had not been formed yet) or to sever it (if it had been
already formed). The process was repeated until all group members declared
they did not want to modify the existing network. In all of the three treatments,
the payoffs were designed such that a group consisting of myopic agents would
never form any link. The treatments are characterized by slight manipulations of
the payoffs, resulting in networks in VNMFS sets featuring different properties.
In treatment 1, a group composed of farsighted agents would form the com-
plete network. This network provides the players with equal payoffs, is strongly
stable, in the sense that no coalition can improve upon it, and features no far-
sighted deviations. Thus, beyond being VNMFS set, the complete network can
be seen as attractive in many ways.5 In the other two treatments we vary those
features to ascertain their contribution to the stability of an outcome.
A group composed of farsighted agents would form a triangle “club” net-
work6 or a line network among all the players, in treatments 2 and 3, respectively.
In both, the payoffs are unequal, with the disadvantaged players earning around
half the payoffs of the others. We remove strong stability in treatment 2, as a
3There are some random dynamic models of network formation that are based on incentivesto form links such as Watts [2002], Jackson and Watts [2002], and Tercieux and Vannetelbosch[2006]. These models aim to use the random process to select from the set of pairwise stablenetworks.
4A discount factor of zero, properly corresponds to myopia. At the same time, we argue thata discount factor of one leads the process close to one in which people only care about the endstate, as in the notions of farsighted stability. For intermediate values, the stream of future payoffsmatters in a way that cannot be captured by static stability notions.
5The complete network can be a focal point in itself - only for being the complete network.6A network formed by a single clique (complete sub-network) of three players.
2
coalition of three players can improve upon the networks in the VNMFS. In treat-
ment 3 the networks in the VNMFS are strongly stable, but feature a farsighted
deviation in two steps. We derive across-treatment hypothesis based on those
properties.
In all the treatments farsighted stability refines the set of pairwise stable net-
works (PWS) by selecting the (unique) Pareto dominant network within the set
of PWS.7 Note, however, that the underlying behavioral assumptions of both no-
tions - myopia versus farsightedness - are at odds with each other, providing us
with general within-treatment hypothesis.
On aggregate, 75 percent of the network finally reached are pairwise stable. In
treatments 1 and 2 most of the groups (up to 70 percent of the overall population)
reach a VNMFS set, supporting farsighted network formation. In treatment 3,
only one out of five groups reach a VNMFS set, with half of the groups ending the
game in the empty network. In this treatment, VNMFS sets are accessed almost
as often as in the other treatments, but, after some time, most groups leave them.
Given the properties of the VNMFS sets, this asymmetric result is inconsis-
tent with strong stability - present in treatment 1 and 3, absent in treatment 2 -
and can not be attributed to the inequality in the payoffs - equal in treatment 1,
unequal in treatment 2 and 3. Nor it can be explained by other refinements of
pairwise stabilility, such as Nash stability, or Pareto dominance - both present in
all treatments. It is, however, perfectly consistent with the hypothesis derived
from limited farsightedness.
We then show that individual behavior supports the interpretation of the ag-
gregate results as an instance of limited farsightedness. Subjects respond to my-
opic incentives as well as to farsighted improving paths of short length. As a
consequence if a farsightedly stable outcome features a farsighted deviation of
limited length, the subjects are likely to follow it: they do not recognize the full
chain of reactions that would prevent a fully farsighted agent to deviate.
Consequently, neither perfect myopia nor perfect farsightedness seem to be
good models of actual behavior. A model of limited farsightedness would be a
valuable development in network formation.
The number of experiments addressing networks and network formation is
7The farsightedly stable networks, however, are not Pareto dominant within the set of allnetworks. Actually no network Pareto dominates all other networks in our treatments.
3
rapidly increasing. Relatively few of them, however, deal with pure network for-
mation, intended as a setting where no strategic interactions take place on the
network once it has been formed. Among the notable exceptions stand the exper-
iments of Goeree et al. [2009] and Falk and Kosfeld [2012]. They investigate the
predictive power of a strict Nash network in the framework of Bala and Goyal
[2003]. They find low support for this concept when the Nash network is asym-
metric and the agents homogeneous. The main difference with our design is that
they consider a model with unilateral link formation and apply non-cooperative
solution concepts, while in our context of bilateral link formation those concepts
provide implausible predictions [see Bloch and Jackson, 2006].
Closer to our approach is the work of Ziegelmeyer and Pantz [2005], where
R&D networks in a Cournot oligopoly are investigated. Their results generally
support pairwise stability. In their design pairwise stable networks are also far-
sightedly stable and thus there is no tension between myopia and farsighted-
ness.8
Finally, Berninghaus et al. [2012] address limited forward-looking behavior
with an experiment on network formation. Relevant features distinguish our
work from their model: (i) they assume unilateral link formation; (ii) players play
a coordination game on the endogenously formed network and thus the assump-
tion on the beliefs about this latter game affects the predictions; (iii) the forward-
looking notion they consider relates specifically to the interaction between the
linking strategies and the strategies in the coordination game. So their experi-
ment combines a test of network formation and strategic behavior in the coordi-
nation game, while our paper is the first to directly investigate farsightedness and
myopia in a network formation context unaffected by any other considerations.
The paper is organized as follows. In Section 2 we introduce the necessary
notation and definitions. Section 3 presents the experimental design and proce-
dures. Section 4 reports the experimental results. Section 5 concludes.
8They observe huge differences between the case in which the Cournot profits are consideredas exogenously given and identified with the payoffs of the players in the network, and the case inwhich players play the production stage after forming the network. This supports pure networkformation as the cleanest setting to study network formation.
4
2 Networks: notation and definitions
Let N = {1, . . . ,n} be the finite set of players who are connected in some network
relationship. The network relationships are reciprocal and the network is thus
modeled as a non-directed graph. Individuals are the nodes in the graph and
links indicate bilateral relationships between individuals. Thus, a network g is
simply a list of which pairs of individuals are linked to each other. We write ij ∈ g
to indicate that i and j are linked under the network g. Let gN be the collection of
all subsets of N with cardinality 2, so gN is the complete network. The set of all
possible networks or graphs on N is denoted by G and consists of all subsets of
gN. The network obtained by adding link ij to an existing network g is denoted
g + ij and the network that results from deleting link ij from an existing network
g is denoted g − ij. We say that g′ is adjacent to g if g′ = g + ij or g′ = g − ij
for some ij. Let us denote with Ag the networks that are adjacent to g so that
Ag = {g′ | g′ = g + ij ∨ g′ = g− ij, for some ij}, and let Ag be its complement.
The material payoffs associated to a network are represented by a function
x : G→ Rn where xi(g) represents the material payoff that player i obtains in
network g. The overall benefit net of costs that a player enjoys from a network g
is modeled by means of a utility function ui(g) : Rn → R that associates a value
to the vector of material payoffs associated to network g . This might include all
sorts of costs, benefits, and externalities.
Let Ni(g) = {j | ij ∈ g} be the set of nodes that i is linked to in network g.
The degree of a node is the number of links that involve that node. Thus node i’s
degree in a network g, denoted di(g), is di(g) = #Ni(g). Let Sk(g) be the subset
of nodes that have degree k in network g: Sk(g) = {i ∈ N | di(g) = k} with k ∈{0,1, ...,n− 1}. The degree distribution of a network g is a description of the relative
frequencies of nodes that have different degrees. That is, P(k) is the fraction of
nodes that have degree k under a degree distribution P, i.e., P(k) = (#Sk(g))/n.
Given a degree distribution, P, we define a class of networks as CP = {g ∈ G |P(k) = P(k),∀k}. A class of networks is the subset of G with the same degree
distribution.
Consider a network formation process under which mutual consent is needed
to form a link and link deletion is unilateral. A network is pairwise stable if no
player benefits from severing one of their links and no other two players benefit
5
from adding a link between them, with one benefiting strictly and the other at
least weakly. Formally, a network g is pairwise stable if
(i) for all ij ∈ g, ui(g) ≥ ui(g− ij) and uj(g) ≥ uj(g− ij), and
(ii) for all ij /∈ g, if ui(g) < ui(g + ij) then uj(g) > uj(g + ij).
A network g′ defeats g if either g′ = g− ij and ui(g′)> ui(g) or uj(g′)> uj(g),
or if g′ = g + ij with ui(g′)≥ ui(g) and uj(g′)≥ uj(g) with at least one inequality
holding strictly. Pairwise stability is equivalent to the statement of not being de-
feated by an adjacent network. Agents are assumed to consider only their own
incentives when making their linking choices and not that of other agents. In
particular, agents do not take into account the likely chain of reactions that fol-
low an action, but only its immediate profitability. Thus, PWS implicitly assumes
myopic behavior on the part of the agents.
Farsightedness captures the idea that agents will consider the chain of reac-
tions that could follow when deviating from the current network, and evaluate
the profitability of such deviation with reference to the final network of the chain
of reactions. As a consequence, a farsighted agent will eventually choose against
her immediate interest if she believes that the sequence of reactions that will fol-
low her action could make her better off.
A farsighted improving path is a sequence of networks that can emerge when
players form or sever links based on the improvement the end network offers
relative to the current network. Each network in the sequence differs by one link
from the previous one. If a link is added, then the two players involved must
both prefer the end network to the current network, with at least one of the two
strictly preferring the end network. If a link is deleted, then it must be that at
least one of the two players involved in the link strictly prefers the end network.
We now introduce the formal definition of a farsighted improving path.
Definition 1. A farsighted improving path from a network g to a network g′ 6= g is
a finite sequence of graphs g1, . . . , gK with g1 = g and gK = g′ such that for any k ∈{1, . . . , K− 1} either:
(i) gk+1 = gk − ij for some ij such that ui(gK) > ui(gk) or uj(gK) > uj(gk) or
(ii) gk+1 = gk + ij for some ij such that ui(gK) > ui(gk) and uj(gK) ≥ uj(gk).
6
If there exists a farsighted improving path from g to g′, then we write g→ g′.
For a given network g, let F(g) = {g′ ∈ G | g→ g′}. This is the set of networks
that can be reached by a farsighted improving path from g. The von Neumann-
Morgenstern pairwise farsightedly stable set is obtained by introducing the no-
tion of farsighted improving path into the standard definition of a von Neumann-
Morgenstern stable set. In other words, we define a set of networks G to be von
Neumann-Morgenstern pairwise farsightedly stable (VNMFS) if there is no far-
sighted improving path connecting any two networks in G and if there exists a
farsighted improving path from any network outside G leading to some network
in G. Formally,
Definition 2. The set of networks G is a von Neumann-Morgenstern pairwise farsight-
edly stable set if
(i) ∀g ∈ G, F(g) ∩ G =∅ (internal stability) and
(ii) ∀g′ ∈G\G, F(g′) ∩ G 6=∅ (external stability).
Although the existence of a VNMFS set is not guaranteed in general, when
a VNMFS set exists it provides narrower predictions than other definitions of
farsighted stability, a feature that is particularly welcome in experimental testing.
For instance, a VNMFS set is always included within the pairwise farsightedly
stable sets, as defined by Herings et al. [2009].9
We now turn to individual behavior. We provide a comprehensive evaluation
of the players’ actions by assessing their consistency with progressive levels of
farsightedness. The definition states that an action prescribing to form (break) a
link that is not formed (has been formed) is consistent with farsightedness of level
k, if building (breaking) the link lies on a farsighted improving path of length
smaller or equal than k. An action prescribing not to form (keep) a link that is not
formed (has been formed) is consistent with farsightedness of level k if forming
(breaking) the link does not lie on a farsighted improving path of length smaller
or equal than k. Let the length of a path be the number of steps in the sequence.
9A set of networks G ⊆ G is pairwise farsightedly stable if (i) all possible pairwise deviationsfrom any network g ∈ G to a network outside G are deterred by a credible threat of ending worseoff or equally well off, (ii) there exists a farsighted improving path from any network outsidethe set leading to some network in the set, and (iii) there is no proper subset of G satisfyingConditions (i) and (ii).
7
Call P kg a generic farsighted improving path of length k, starting from network g,
and {P kg} be the set containing all such paths.10 At time t the link ij is selected, the
action of agent i is ait ∈ {0,1}, where 0 means not to form (to break) the selected
link ij, and 1 means to form (to keep) the link ij.
Definition 3. An action ait is consistent with farsightedness of level k if either
(i) ij /∈ gt and ((∃l ≤ k and a P lgt∈ {P l
gt} s.t gt + ij ∈ P l
gt) and ait = 1)∨
((@l ≤ k and a P lgt∈ {P l
gt} s.t gt + ij ∈ P l
gt) and ait = 0)
or
(ii) ij ∈ gt and ((∃l ≤ k and a P lgt∈ {P l
gt} s.t gt − ij ∈ P l
gt) and ait = 0)∨
((@l ≤ k and a P lgt∈ {P l
gt} s.t gt − ij ∈ P l
gt) and ait = 1)
As they are equivalent, we call myopic an action that is consistent with far-
sightedness of level one - i.e. one that looks at the profitability of adjacent net-
works. Two aspects in this definition should be noted. First, an action that aims at
changing the current network and is consistent with some level of farsightedness,
including myopia, is also consistent with higher levels. Second, for an action that
does not change the current network, we implicitly impose a strong assumption
on farsighted behavior: that a farsighted agent should always take a profitable
deviation, if available.
Indeed, given that the building blocks of farsightedness are sequences of net-
works, farsighted behavior is unambiguously defined only if a choice aims at
changing the current network. When it does not, we are forced either to draw
some further assumptions or give up categorizing those choices. In the statistical
analysis of individual behavior we pursue both of the alternatives.
10Note that a path of length k will have a sequence of k + 1 networks.
8
3 Experimental design and procedures
3.1 The game
We consider a simple dynamic link formation game, almost identical to that pro-
posed by Watts [2001]. Time is a countable infinite set: T = 0,1, ..., t, ...; gt denotes
the network that exists at the end of period t. The process starts at t = 0 with
n = 4 unconnected players (g0 coincides with the empty network, g∅). The play-
ers meet over time and have the opportunity to form links with each other.
At every stage t > 0, a link ijt is randomly identified to be updated. At t = 1
each link from the set gN is selected with uniform probability. At every t > 1,
a link ij from the set gN \ ijt−1 is selected with uniform probability. Thus, a link
cannot be selected twice in two consecutive stages. If the link ij ∈ gt−1, then both i
and j can decide unilaterally to sever the link; if the link ij /∈ gt−1, then i and j can
form the link ij if they both agree. Once the individuals involved in the link have
taken their decisions, gt−1 is updated accordingly and we move to gt. All group
members are informed about both the decisions taken by the players involved in
the selected link and the consequences on that link. They are informed through
a graphical representation of the current network gt and the associated payoffs.
After every stage all group members are asked whether they want to modify the
current network or not. If they unanimously declare they do not want to, the
game ends; otherwise, they move to the next stage.11 To ensure that an end is
reached, a random stopping rule is added after stage 25: at every t≥ 26 the game
ends anyway with probability 0.2.
The game is repeated three times to allow for learning: groups are kept the
same throughout the experiment. Group members are identified through a capi-
tal letter (A, B, C or D). These identity letters are reassigned at every new repeti-
tion.
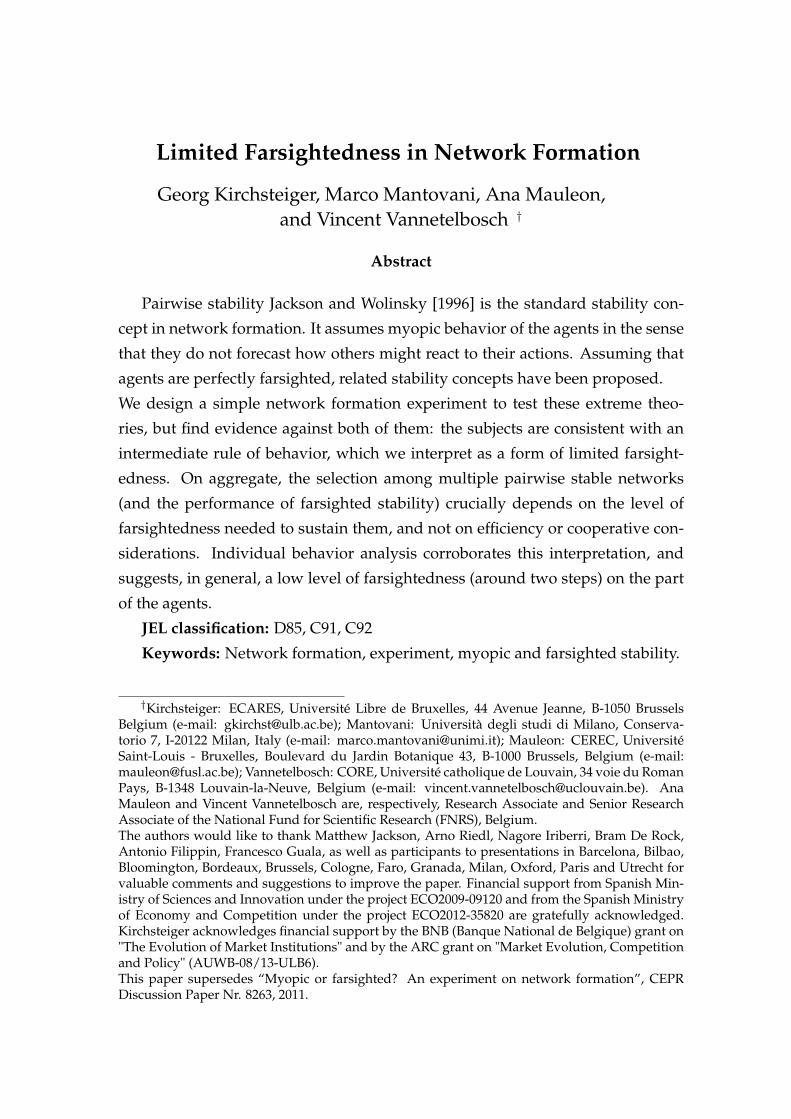
A vector of payoffs is associated to every network: it allocates a number of
points to each player in the network. The subjects receive points depending only
on the final network of each repetition. Thus, their total points are given by the
sum of the points achieved in the final networks of the three repetitions. At the
end of the experiment the points are converted into Euro at the exchange rate of
11Subjects are informed about the outcome of the satisfaction choices - i.e. end of the repetitionor not - but not about individual choices.
9
1 Euro = 6 points.
The subjects are informed about the payoffs associated to every possible net-
work and know the whole structure of the game from the beginning. Before start-
ing the first repetition the participants have the opportunity of practicing the re-
lation between networks and payoffs and the functioning of the stages through a
training stage and three trial stages.
C1(g∅) C2 C3 C4r rrr A:20
D:20
C:20
B:20
rr r r@@
2
26
26
2
r rrr 10
10
10
10
r rrr @@
60
9
9
36
C5 C6 C7 C8r rrr @@��
12
12
12
32
rr r r@@
��
0
36
36
36
r rrr �� 6
24
24
6
r rrr @@
��
��@
@
18
18
18
18
C9 C10 C11(gN)r rrr @@
��@@
15
15
22
120
rr r r@@
��@@��
34
24
34
24
r rrr @@
��
��
@@
40
40
40
40
Figure 1: Payoffs for T1
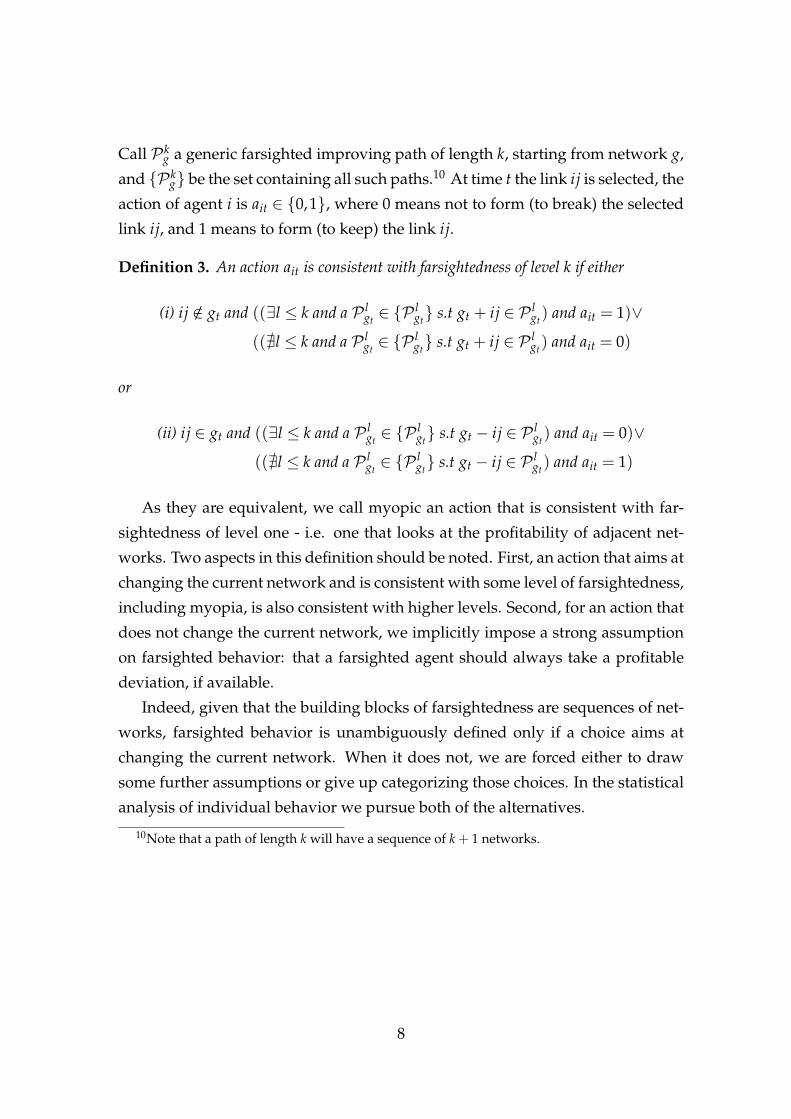
3.2 Treatments and hypothesis
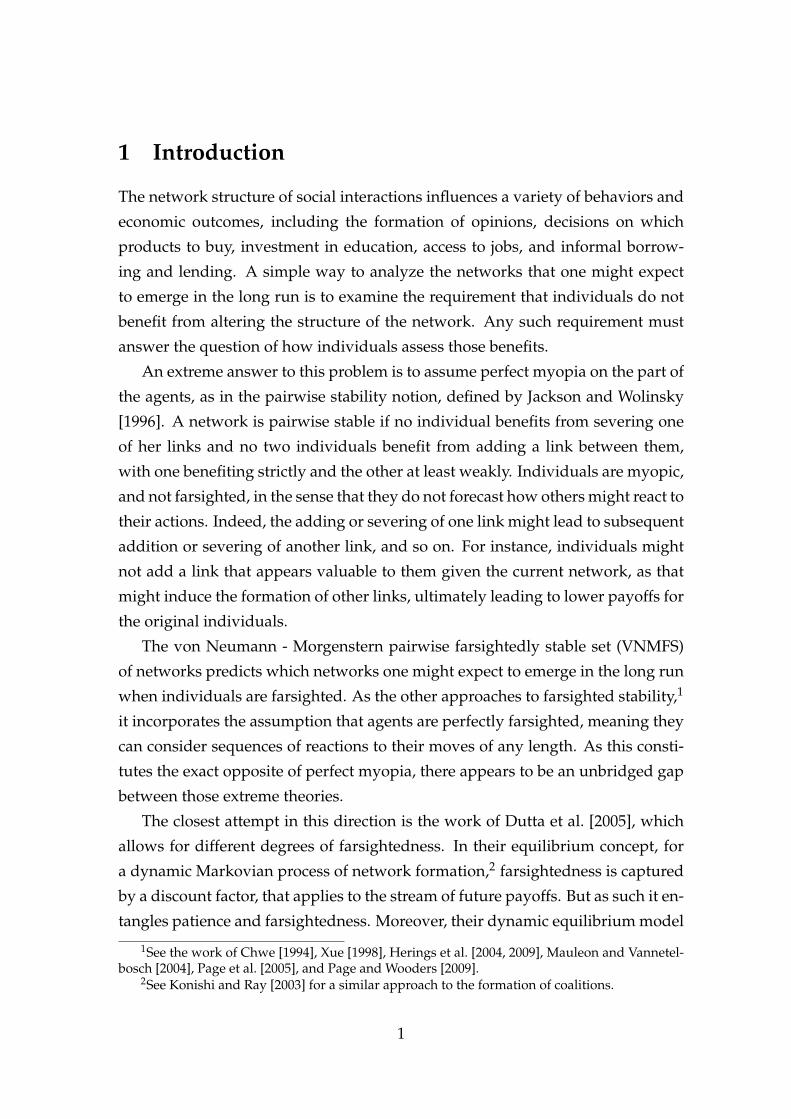
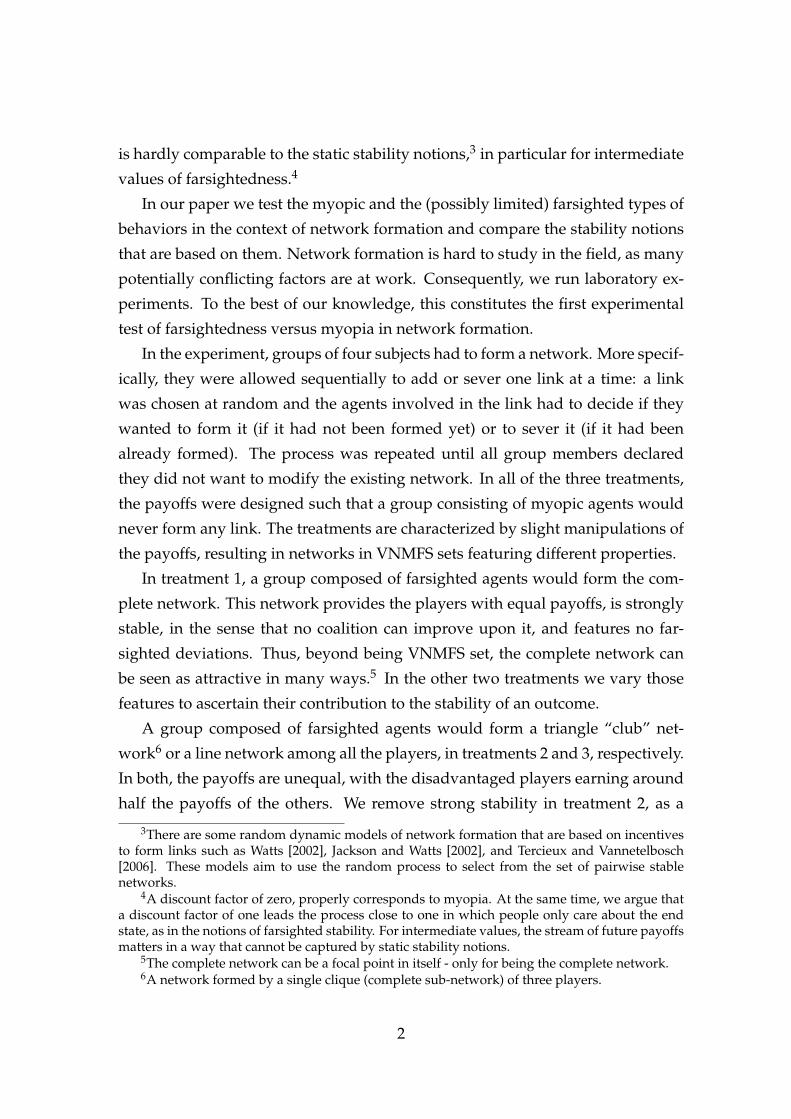
Since n = 4, it follows that #gN = 6 and #G = 64.
We run three treatments (T1, T2, T3) where we manipulate the payoffs in some
networks to obtain VNMFS set(s) with different properties. Figures 1, 2 and 3 dis-
play the payoffs that were used in the three treatments for each class of networks,
10
C1(g∅) C2 C3 C4r rrr A:20
D:20
C:20
B:20
rr r r@@
2
26
26
2
r rrr 10
10
10
10
r rrr @@
60
9
9
36
C5 C6 C7 C8r rrr @@��
47
47
47
20
rr r r@@
��
0
36
36
36
r rrr �� 6
24
24
6
r rrr @@
��
��@
@
18
18
18
18
C9 C10 C11(gN)r rrr @@
��@@
55
55
5
100
rr r r@@
��@@��
50
16
50
16
r rrr @@
��
��
@@
40
40
40
40
Figure 2: Payoffs for T2
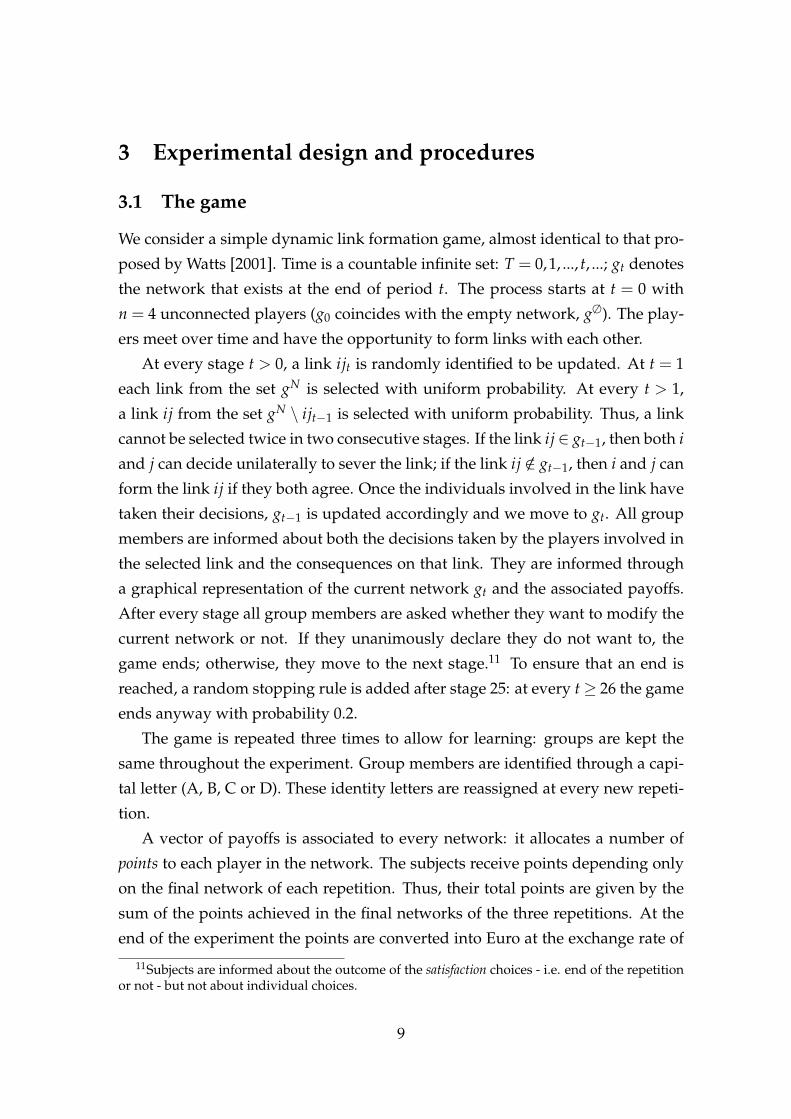
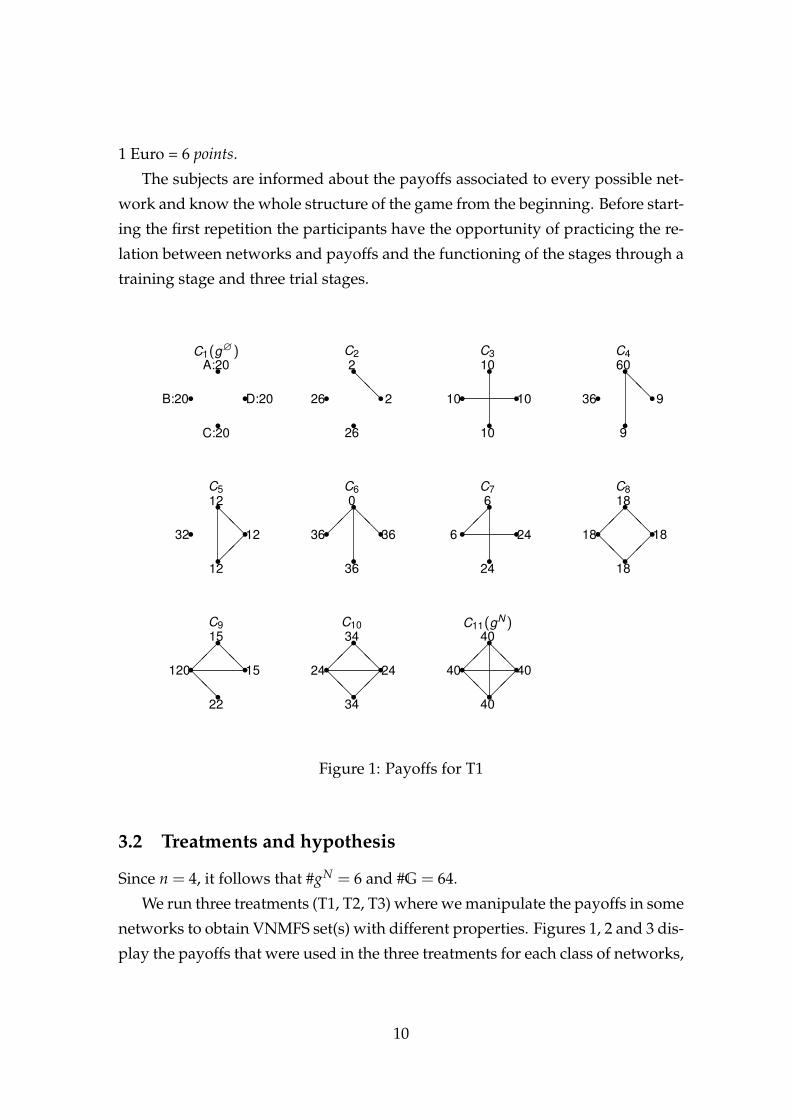
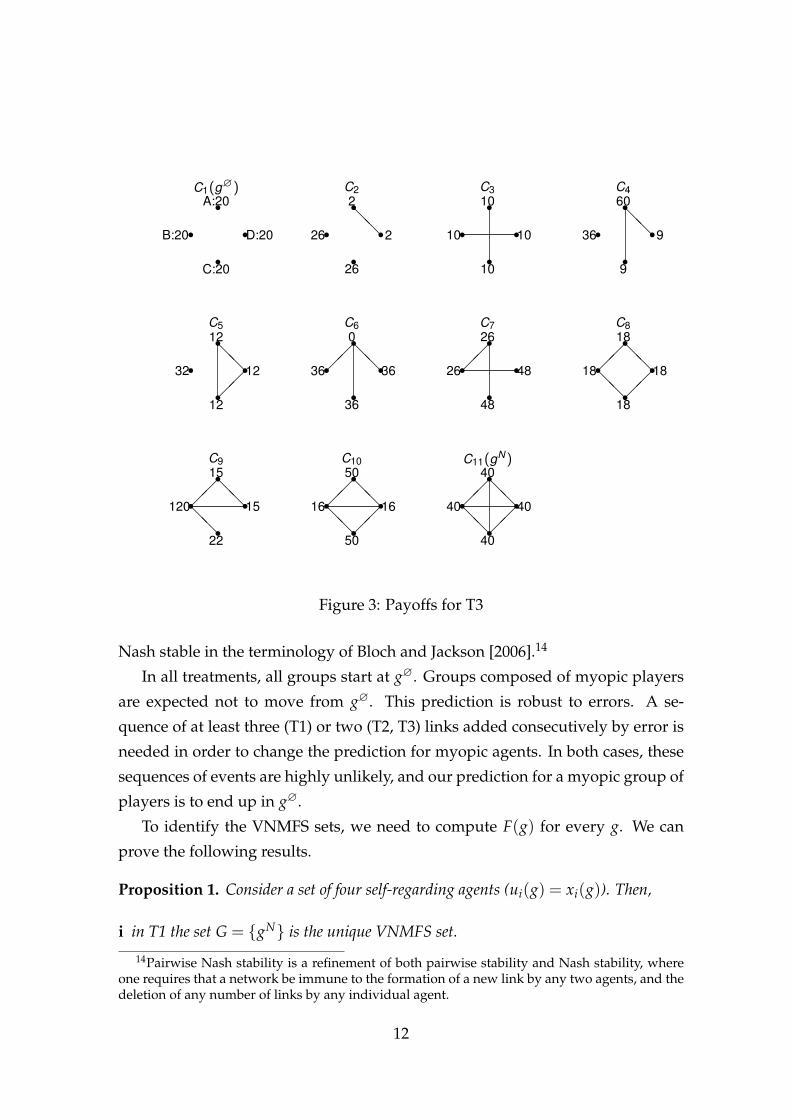
CP. Since the function of material payoffs satisfies anonymity,12 this representa-
tion is sufficient to assign a payoff to each player in each possible network config-
uration. The numbers were chosen in order to provide the resulting predictions
with a set of nice properties for each treatment that are described below and are
summarized in Table 1.13
The empty network, g∅, and the four networks in class C5 are PWS in all
treatments. These are the only PWS networks in T2, whereas gN is also PWS
under T1, and the networks in C7 are also PWS in T3. Furthermore, in T1 and
T3, in every network in C5, the connected agents can improve their situation by
cutting both of their links. These networks (contrary to the others PWS) are not
12Anonimity holds if payoffs in a network are assigned to each player independently of his orhis partners’ identity.
13In general, the following considerations are valid for self-regarding agents. In some casesthey hold for other-regarding preferences (for an overview, see Sobel [2005]). Most notably, in T1,applying the inequity model of Fehr and Schmidt [1999] does not affect our predictions.
11
C1(g∅) C2 C3 C4r rrr A:20
D:20
C:20
B:20
rr r r@@
2
26
26
2
r rrr 10
10
10
10
r rrr @@
60
9
9
36
C5 C6 C7 C8r rrr @@��
12
12
12
32
rr r r@@
��
0
36
36
36
r rrr �� 26
48
48
26
r rrr @@
��
��@
@
18
18
18
18
C9 C10 C11(gN)r rrr @@
��@@
15
15
22
120
rr r r@@
��@@��
50
16
50
16
r rrr @@
��
��
@@
40
40
40
40
Figure 3: Payoffs for T3
Nash stable in the terminology of Bloch and Jackson [2006].14
In all treatments, all groups start at g∅. Groups composed of myopic players
are expected not to move from g∅. This prediction is robust to errors. A se-
quence of at least three (T1) or two (T2, T3) links added consecutively by error is
needed in order to change the prediction for myopic agents. In both cases, these
sequences of events are highly unlikely, and our prediction for a myopic group of
players is to end up in g∅.
To identify the VNMFS sets, we need to compute F(g) for every g. We can
prove the following results.
Proposition 1. Consider a set of four self-regarding agents (ui(g) = xi(g)). Then,
i in T1 the set G = {gN} is the unique VNMFS set.
14Pairwise Nash stability is a refinement of both pairwise stability and Nash stability, whereone requires that a network be immune to the formation of a new link by any two agents, and thedeletion of any number of links by any individual agent.
12
ii in T2 the set G = {g|g ∈ C5} is the unique VNMFS set.
iii in T3 a set G is a VNMFS set if and only if G = {g | g ∈ C7 and ,di(g) = di(g′),∀i ∈N, g′ ∈ G}.
The proof of this proposition can be found in Appendix A.
In T1 and T2 there is a unique VNMFS set: the complete network (i) and the
set composed of the four networks in C5 (ii), respectively. We will refer to the
latter as club networks. In T3 there are six VNMFS sets. Their union is C7, i.e. it
encompasses all line networks. Each set consists of a pair of line networks with
identical degree distribution (iii).15
We expect a group composed by farsighted agents to end up in a network
included in some VNMFS set. This prediction is robust to errors in the sense that
the farsighted prediction does not depend on the starting point: from any other
network, there is a farsighted improving path leading to a network in G.
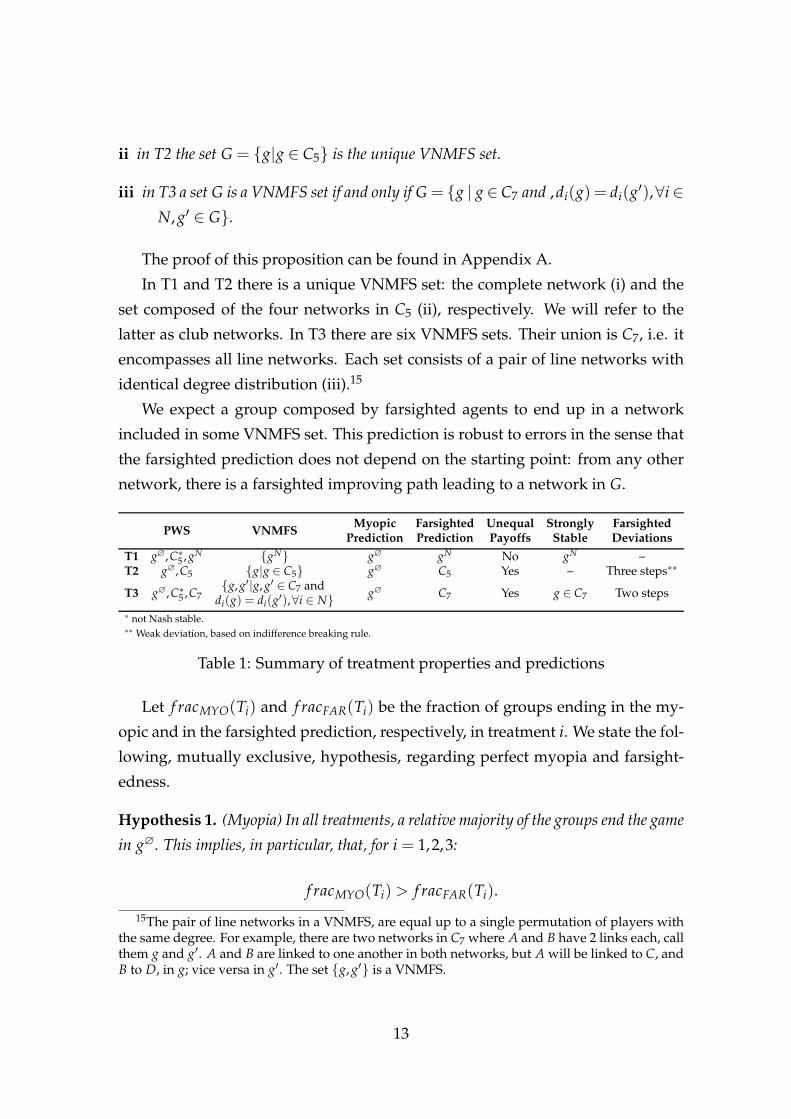
PWS VNMFS MyopicPrediction
FarsightedPrediction
UnequalPayoffs
StronglyStable
FarsightedDeviations
T1 g∅,C∗5 , gN {gN} g∅ gN No gN –T2 g∅,C5 {g|g ∈ C5} g∅ C5 Yes – Three steps∗∗
T3 g∅,C∗5 ,C7{g, g′|g, g′ ∈ C7 and
di(g) = di(g′),∀i ∈ N} g∅ C7 Yes g ∈ C7 Two steps
∗ not Nash stable.∗∗ Weak deviation, based on indifference breaking rule.
Table 1: Summary of treatment properties and predictions
Let f racMYO(Ti) and f racFAR(Ti) be the fraction of groups ending in the my-
opic and in the farsighted prediction, respectively, in treatment i. We state the fol-
lowing, mutually exclusive, hypothesis, regarding perfect myopia and farsight-
edness.
Hypothesis 1. (Myopia) In all treatments, a relative majority of the groups end the game
in g∅. This implies, in particular, that, for i = 1,2,3:
f racMYO(Ti) > f racFAR(Ti).
15The pair of line networks in a VNMFS, are equal up to a single permutation of players withthe same degree. For example, there are two networks in C7 where A and B have 2 links each, callthem g and g′. A and B are linked to one another in both networks, but A will be linked to C, andB to D, in g; vice versa in g′. The set {g, g′} is a VNMFS.
13
Hypothesis 2. (Farsightedness) In all treatments, a relative majority of the groups end
the game in a VNMFS set. This implies, in particular, that, for i = 1,2,3:
f racMYO(Ti) < f racFAR(Ti).
In our experiment, if a network is in a VNMFS set, it is also PWS. Even myopic
agents will stay at the farsighted stable network once it is reached. Therefore, one
cannot find direct experimental evidence against PWS as opposed to farsighted
stability. But our experiment discriminates between the different behavioral mod-
els that lie behind both stability concepts. In this way our experiment can provide
evidence in favor or against the farsighted models of network formation in cases
where they refine PWS.
The payoffs guarantee that the predicted networks are essentially unique, in
the sense that all the networks included in a VNMFS set are isomorphic. More-
over, the predicted networks are neither strongly efficient in the sense of Jackson
and Wolinsky [1996]16 nor Pareto dominant within the set of all networks. Pre-
vious experimental studies have shown that efficiency considerations can drive
individual’s behavior (see Engelmann and Strobel [2004]). But generic efficiency
arguments could not explain if a network in some VNMFS set or g∅ were ob-
served in the experiment. The networks included in VNMFS sets are (weakly)
Pareto dominant within the set of pairwise Nash stable networks.17
On top of these general hypothesis, the different VNMFS sets differ on three
important properties, providing some testable across-treatment hypothesis (see
Table 1).
First, the payoffs are equal in the VNMFS set in T1 (gN) and unequal in T2 (C5)
and T3 (C7). In the latter, the players gaining more obtain around twice as much
as the least well off. Under both conditions, the disadvantaged players can lead
the group to leave the VNMFS set, if they so wish, by severing a link in T3, by
adding a link in T2.18 If other-regarding preferences are sufficiently strong, the
VNMFS sets could be less stable in T2 and in T3, with respect to T1.
16A network g ∈G is strongly efficient if ∑i∈N
xi(g) ≥ ∑i∈N
xi(g′) for all g′ ∈G.
17Recently, Carrillo and Gaduh [2012] suggested that the players are able to select the PWSnetworks that are Pareto dominant. Our results show that Pareto dominance is not a sufficientcriterion to select among PWS networks.
18Despite needing the agreement of his partner to add a link, adding a link in C5 is highlybeneficial to the already connected agents, so that they are likely to agree on that.
14

Hypothesis 3. The fraction of groups ending the game in a VNMFS set is higher if the
networks that are there included feature equal payoffs for the players. Thus:
i f racFAR(T1) > f racFAR(T2), and
ii f racFAR(T1) > f racFAR(T3).
Second, we also consider stability against changes in links by any coalition
of individuals - i.e. look for strongly stable networks (immune to coalitional de-
viations). In T1 and T3 the networks included in VNMFS sets are also strongly
stable. This is not true in T2, where strongly stable networks fail to exist.19 In this
view the VNMFS set seems more robust in T1 and in T3 than in T2.
Hypothesis 4. The fraction of groups ending the game in a VNMFS set is higher if the
networks that are there included are strongly stable. Thus:
i f racFAR(T1) > f racFAR(T2), and
ii f racFAR(T3) > f racFAR(T2).
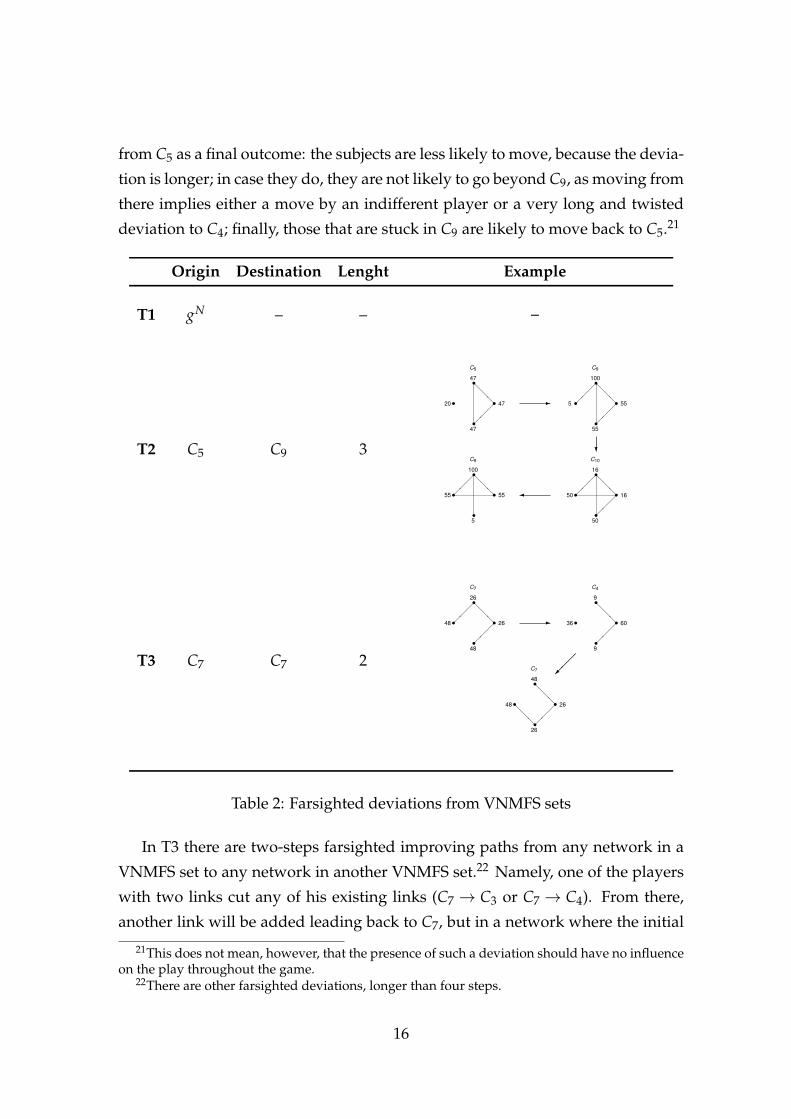
Finally, the networks belonging to the VNMFS sets differ with respect to the
presence and length of farsighted deviations leaving the set. Table 2 provides
an overview and an example for each treatment. In T1, there are no farsighted
improving paths leaving the complete network (F(gN) =∅).
In T2, F(g ∈ C5) = {g′ | g′ ∈ C9 ∧ g′ /∈ Ag}. This means that there are farsighted
improving paths leaving the VNMFS set and leading to networks in C9 that are
not adjacent to the initial network g. The path is built as follows: from C5 players
move to C9, then to C10 and finally back to another network in C9. This path re-
lies on the indifference-breaking convention stating that, in C9, a player with two
links is willing to build another one in order to (move to C10 and then) be exactly
in the same situation in another network in C9.20 Finally, F(g ∈ C9) includes,
beyond the neighboring network in C5 and the other networks in C9, only the
networks in C4, reached with a four-step farsighted improving path. This implies
that even groups that leave the VNMFS set for C9 are somewhat stuck there. As
such, this is a “weak” deviation, that is unlikely to drive the subjects elsewhere
19As shown by Jackson and van den Nouweland [2005] this is equivalent to an empty core inthe derived cooperative game.
20One may question how reasonable it is to keep the same indifference-breaking conventionsin the case of farsighted moves as in the myopic case.
15
from C5 as a final outcome: the subjects are less likely to move, because the devia-
tion is longer; in case they do, they are not likely to go beyond C9, as moving from
there implies either a move by an indifferent player or a very long and twisted
deviation to C4; finally, those that are stuck in C9 are likely to move back to C5.21
Origin Destination Lenght Example
–T1 gN – –
C5 C9
C10C9
ss
ss @
@@�
��
47
47
47
20
ss
ss@
@@
���
���
100
5
55
55
ss
ss
���
@@@
���
16
16
50
50
ss
ss @
@@
���
100
55
5
55
-
�
?T2 C5 C9 3
C7 C4
C7
ss
ss ���
@@@�
��
26
26
48
48
ss
ss@
@@���
9
36
9
60
ss
ss@@@
���
@@@
48
26
26
48
-
���
T3 C7 C7 2
Table 2: Farsighted deviations from VNMFS sets
In T3 there are two-steps farsighted improving paths from any network in a
VNMFS set to any network in another VNMFS set.22 Namely, one of the players
with two links cut any of his existing links (C7 → C3 or C7 → C4). From there,
another link will be added leading back to C7, but in a network where the initial
21This does not mean, however, that the presence of such a deviation should have no influenceon the play throughout the game.
22There are other farsighted deviations, longer than four steps.
16
deviator is better off (because he has only one link). After the first move away
from C7 is made, other (short) deviations are feasible, driving the group away
from the VNMFS set (and, most notably, toward g∅). Those differences bare little
meaning in the context of perfect farsightedness. However, to the extent that
the agents may be bounded in their ability to pursue farsighted deviations, the
VNMFS set seems more robust in T1 and in T2 than in T3.
Hypothesis 5. The fraction of groups ending the game in a VNMFS set is higher if the
networks that are there included are robust to short farsighted deviations. Thus:
i f racFAR(T1) > f racFAR(T3), and
ii f racFAR(T2) > f racFAR(T3).
3.3 Experimental procedures
The experiment took place at the EELAB of the University of Milan-Bicocca in
June 2010 (T1) and April/May 2012 (T2,T3). The computerized program was de-
veloped using Z-tree [Fischbacher, 2007]. We run 16 sessions for a total of 288 par-
ticipants and 72 groups. Those corresponds to 36 independent observations for
T1, and 18 independent observations for T2 and T3. Table 3 summarizes sessions’
details. Participants were undergraduate students from various disciplines,23 re-
cruited through an announcement on the EELAB website. No subject participated
in more than one session.
Subjects were randomly assigned to individual terminals and were not al-
lowed to communicate during the experiment. Instructions were read aloud (see
Appendix B for an English translation of the instructions). Participants were
asked to fill in a control questionnaire; the experiment started only when all the
subjects had correctly completed the task.
Sessions took on average 90 minutes, including instructions, control and final
questionnaire phases. Average payment was 16.10 Euro (no show up fee was
paid) with a minimum of 4.70 and a maximum of 32.40 Euro.
23Sociology, economics, business, psychology, statistics, computer science, law, biology,medicine, mathematics, pedagogy and engineering.
17
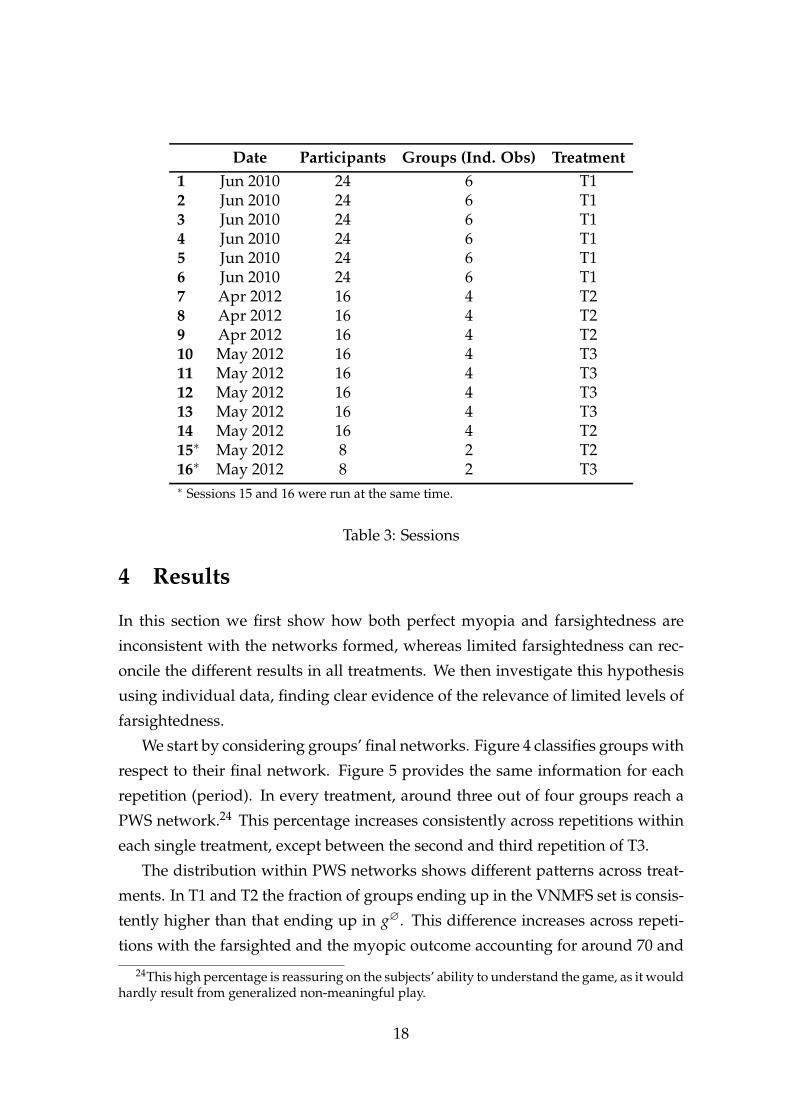
Date Participants Groups (Ind. Obs) Treatment1 Jun 2010 24 6 T12 Jun 2010 24 6 T13 Jun 2010 24 6 T14 Jun 2010 24 6 T15 Jun 2010 24 6 T16 Jun 2010 24 6 T17 Apr 2012 16 4 T28 Apr 2012 16 4 T29 Apr 2012 16 4 T210 May 2012 16 4 T311 May 2012 16 4 T312 May 2012 16 4 T313 May 2012 16 4 T314 May 2012 16 4 T215∗ May 2012 8 2 T216∗ May 2012 8 2 T3∗ Sessions 15 and 16 were run at the same time.
Table 3: Sessions
4 Results
In this section we first show how both perfect myopia and farsightedness are
inconsistent with the networks formed, whereas limited farsightedness can rec-
oncile the different results in all treatments. We then investigate this hypothesis
using individual data, finding clear evidence of the relevance of limited levels of
farsightedness.
We start by considering groups’ final networks. Figure 4 classifies groups with
respect to their final network. Figure 5 provides the same information for each
repetition (period). In every treatment, around three out of four groups reach a
PWS network.24 This percentage increases consistently across repetitions within
each single treatment, except between the second and third repetition of T3.
The distribution within PWS networks shows different patterns across treat-
ments. In T1 and T2 the fraction of groups ending up in the VNMFS set is consis-
tently higher than that ending up in g∅. This difference increases across repeti-
tions with the farsighted and the myopic outcome accounting for around 70 and
24This high percentage is reassuring on the subjects’ ability to understand the game, as it wouldhardly result from generalized non-meaningful play.
18
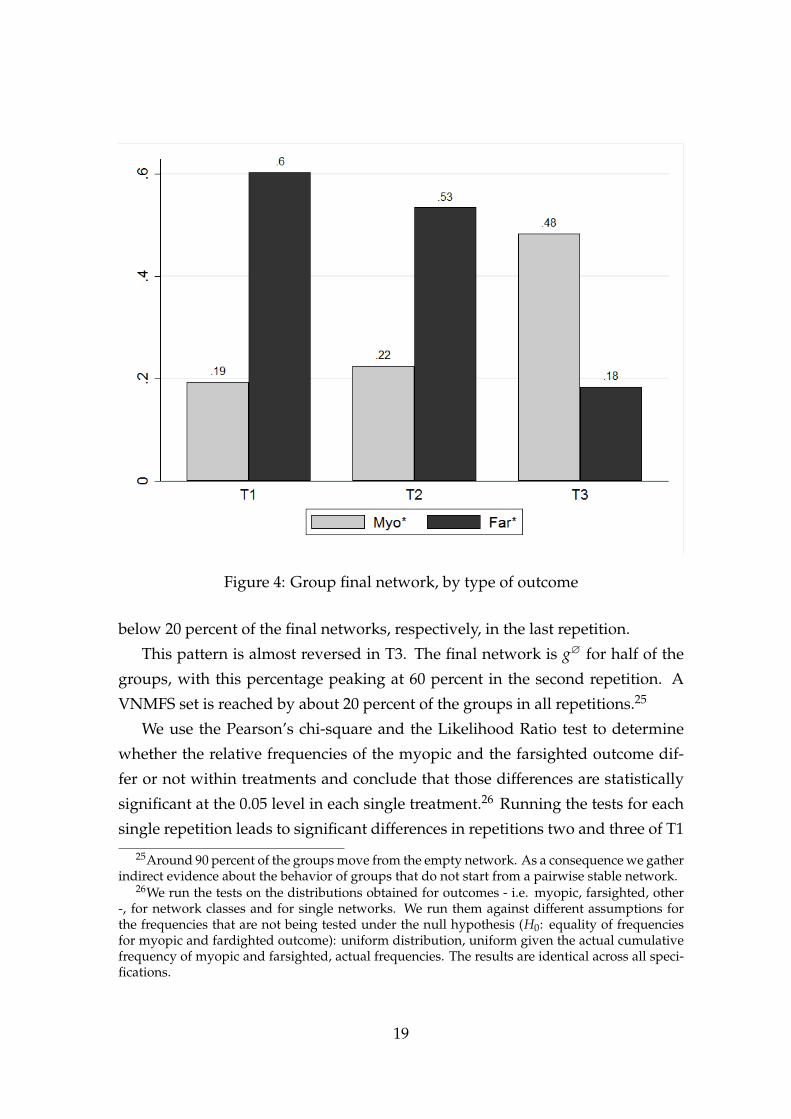
Figure 4: Group final network, by type of outcome
below 20 percent of the final networks, respectively, in the last repetition.
This pattern is almost reversed in T3. The final network is g∅ for half of the
groups, with this percentage peaking at 60 percent in the second repetition. A
VNMFS set is reached by about 20 percent of the groups in all repetitions.25
We use the Pearson’s chi-square and the Likelihood Ratio test to determine
whether the relative frequencies of the myopic and the farsighted outcome dif-
fer or not within treatments and conclude that those differences are statistically
significant at the 0.05 level in each single treatment.26 Running the tests for each
single repetition leads to significant differences in repetitions two and three of T1
25Around 90 percent of the groups move from the empty network. As a consequence we gatherindirect evidence about the behavior of groups that do not start from a pairwise stable network.
26We run the tests on the distributions obtained for outcomes - i.e. myopic, farsighted, other-, for network classes and for single networks. We run them against different assumptions forthe frequencies that are not being tested under the null hypothesis (H0: equality of frequenciesfor myopic and fardighted outcome): uniform distribution, uniform given the actual cumulativefrequency of myopic and farsighted, actual frequencies. The results are identical across all speci-fications.
19
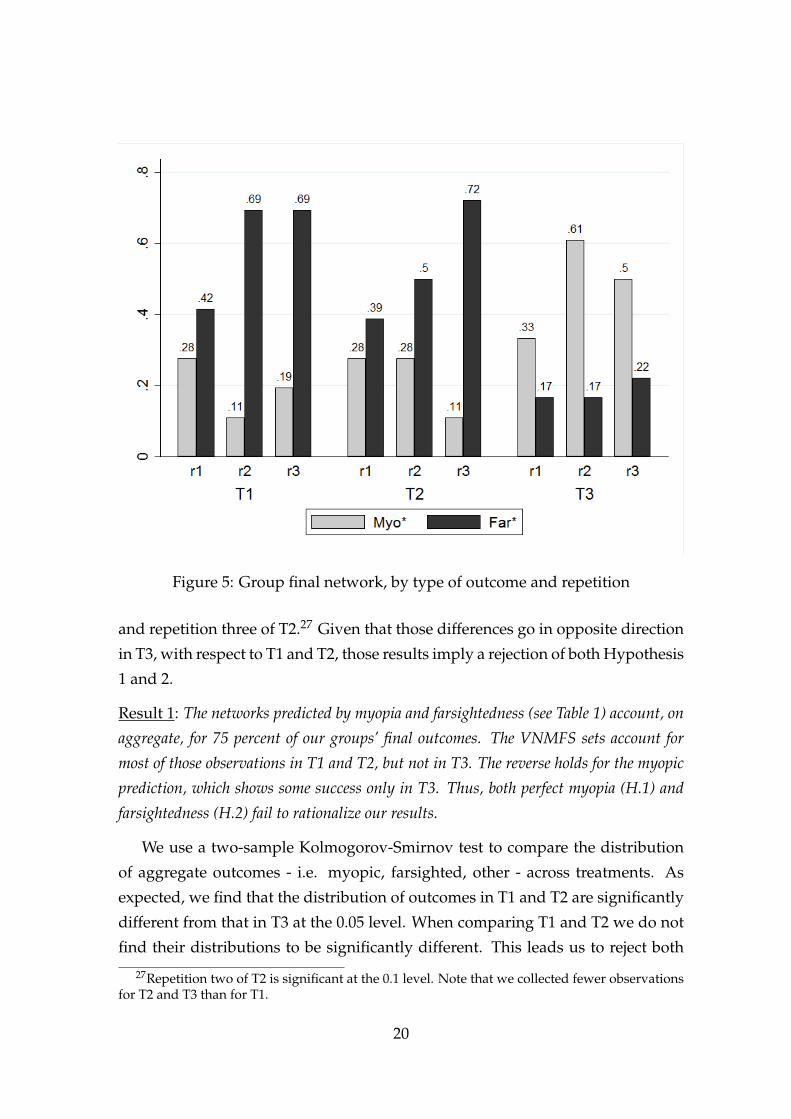
Figure 5: Group final network, by type of outcome and repetition
and repetition three of T2.27 Given that those differences go in opposite direction
in T3, with respect to T1 and T2, those results imply a rejection of both Hypothesis
1 and 2.
Result 1: The networks predicted by myopia and farsightedness (see Table 1) account, on
aggregate, for 75 percent of our groups’ final outcomes. The VNMFS sets account for
most of those observations in T1 and T2, but not in T3. The reverse holds for the myopic
prediction, which shows some success only in T3. Thus, both perfect myopia (H.1) and
farsightedness (H.2) fail to rationalize our results.
We use a two-sample Kolmogorov-Smirnov test to compare the distribution
of aggregate outcomes - i.e. myopic, farsighted, other - across treatments. As
expected, we find that the distribution of outcomes in T1 and T2 are significantly
different from that in T3 at the 0.05 level. When comparing T1 and T2 we do not
find their distributions to be significantly different. This leads us to reject both
27Repetition two of T2 is significant at the 0.1 level. Note that we collected fewer observationsfor T2 and T3 than for T1.
20
Hypothesis 3 and 4, as we do not find the inequality of the payoffs nor strong
stability to affect systematically the stability of the VNMFS sets. The results are,
instead, consistent with Hypothesis 5, supporting limited farsightedness.
Result 2: The different performance of the VNMFS sets in T3, compared to T1 and T2,
can not be explained by payoff inequality or coalitional stability, leading to a rejection of
both Hypothesis 3 and 4. The results are, instead, consistent with limited farsightedness
(H.5).
Between one fifth and one third of the groups did not end up neither in the
myopic nor in the farsighted prediction; we generally refer to this category as
“other”. Remarkably, a vast majority of those, between 72 and 77 percent, ended
the game in networks that are direct neighbors of either of the two. The specific
figures are as follows: in T1, 50 and 23 percent of those ended up at one step from
the empty and the complete network, and thus in C2 and C10, respectively; in T2,
61 percent resulted in C9, at one step from the VNMFS set, 16 percent in C2; in
T3, 39 percent were in C2, while 33 percent in C4. We note that in T2 and T3, the
groups that were close to a VNMFS set happened to be precisely on the first step
of the farsighted deviations outlined above.
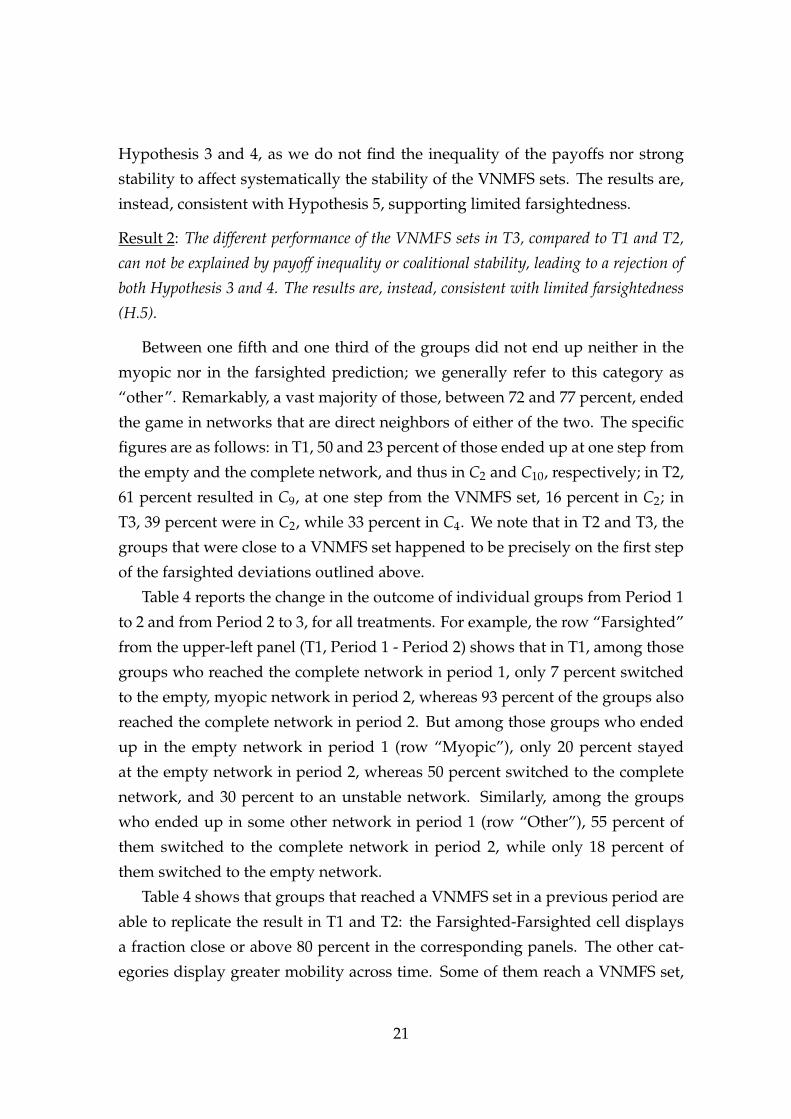
Table 4 reports the change in the outcome of individual groups from Period 1
to 2 and from Period 2 to 3, for all treatments. For example, the row “Farsighted”
from the upper-left panel (T1, Period 1 - Period 2) shows that in T1, among those
groups who reached the complete network in period 1, only 7 percent switched
to the empty, myopic network in period 2, whereas 93 percent of the groups also
reached the complete network in period 2. But among those groups who ended
up in the empty network in period 1 (row “Myopic”), only 20 percent stayed
at the empty network in period 2, whereas 50 percent switched to the complete
network, and 30 percent to an unstable network. Similarly, among the groups
who ended up in some other network in period 1 (row “Other”), 55 percent of
them switched to the complete network in period 2, while only 18 percent of
them switched to the empty network.
Table 4 shows that groups that reached a VNMFS set in a previous period are
able to replicate the result in T1 and T2: the Farsighted-Farsighted cell displays
a fraction close or above 80 percent in the corresponding panels. The other cat-
egories display greater mobility across time. Some of them reach a VNMFS set,
21
T1
T2
T3
Peri
od2
Peri
od2
Peri
od2
Myo
pic
Fars
ight
edO
ther
Myo
pic
Fars
ight
edO
ther
Myo
pic
Fars
ight
edO
ther
Peri
od1
Myo
pic
0.20
0.50
0.30
0.60
0.20
0.20
0.67
0.17
0.17
Fars
ight
ed0.
070.
930.
000.
000.
860.
140.
330.
330.
33O
ther
0.18
0.55
0.27
0.33
0.33
0.33
0.67
0.11
0.22
Peri
od3
Peri
od3
Peri
od3
Myo
pic
Fars
ight
edO
ther
Myo
pic
Fars
ight
edO
ther
Myo
pic
Fars
ight
edO
ther
Peri
od2
Myo
pic
0.60
0.00
0.40
0.20
0.40
0.40
0.64
0.09
0.27
Fars
ight
ed0.
000.
920.
080.
110.
780.
110.
000.
330.
67O
ther
0.67
0.34
0.00
0.00
1.00
0.00
0.50
0.50
0.00
Tabl
e4:
Gro
upflo
ws
bytr
eatm
enta
ndpe
riod
22
others fluctuate among the empty network and the Other category. Again, a strik-
ing difference appears comparing those results with the right-hand side panels,
corresponding to T3. Around two thirds of the groups that end in the empty net-
work in one repetition, replicate this outcome in the subsequent one. This is the
only outcome showing some persistence; the farsighted outcome, in particular is
much less stable across repetitions.
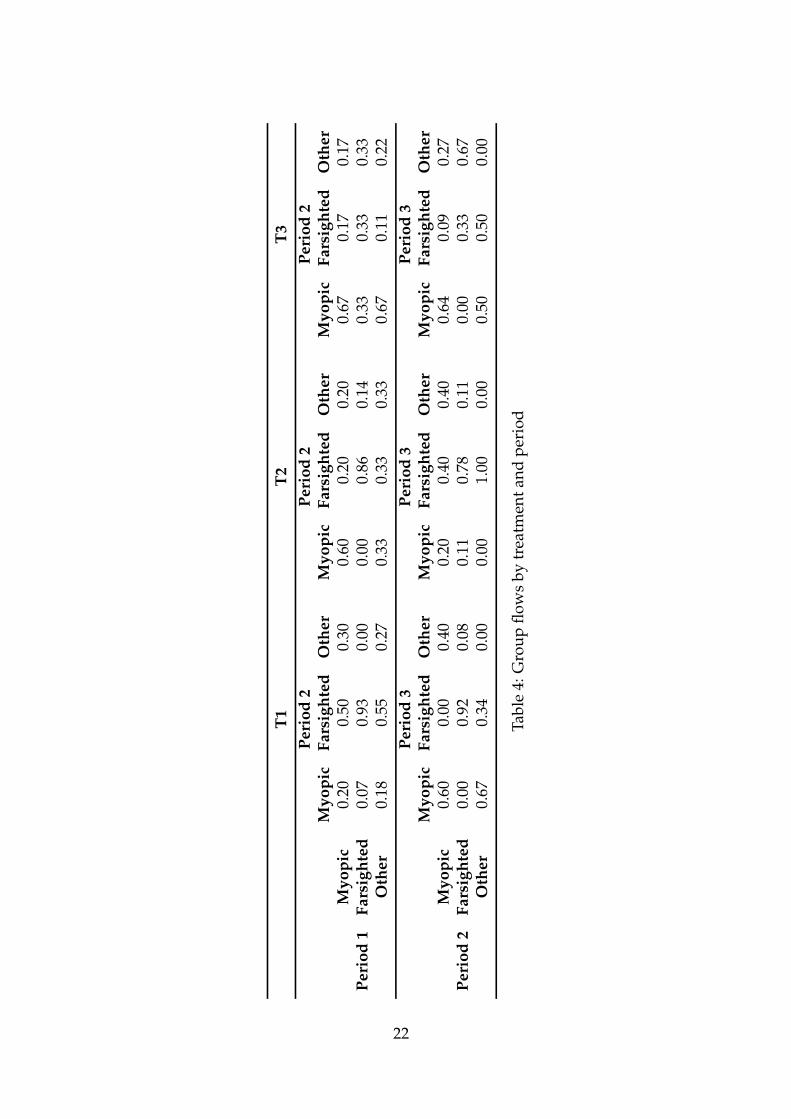
Table 5 displays, for each class of networks, a set of descriptive statistics re-
garding the groups’ decision throughout the game, thus moving beyond the anal-
ysis of the final outcomes. The first three columns give us for each treatment the
number of times groups leave and access each class of networks, together with
their ratio. It is not surprising, from the previous analysis, that most networks are
always left. More interesting is that even the networks that account for a signifi-
cant fraction of the final outcomes, with the exception of the complete network in
T1, are often left once accessed. This happens 47 percent of the time for C5 in T2,
and 71 and 76 percent for C1 and C7, respectively, in T3.
The columns labeled ”Destinations” in Table 5 report the major receivers of the
outflows from each class of network, and their share of those outflows. We are
particularly interested in the results for C7 in T3. It turns out that two thirds of the
groups that left a VNMFS set in T3 did so consistently with the short farsighted
deviation described above (destinations C3 and C4, see Table 2). Note also that
of the groups that left the VNMFS set in T2 (C5), more than 90 percent did so
consistently with a farsighted deviation (destination C9).
The last three columns display the average number of consecutive stages the
groups stayed in a network, which we consider as another marker of the absorb-
ing power of a network. In T1, when groups reach the complete network, they
immediately decide to end the game.28 In T2 and T3 the players cannot decide to
stop the game when they reach a VNMFS set, probably due to the asymmetries
in their payoffs. Nevertheless they spend more consecutive stages there than in
any other class. In T2 this results in a high percentage of groups ending the game
in C5. In T3 the players leave C7 more often before the end of the game, despite
staying there for more than five rounds, on average. 29 Consistently, on average
28This fact explains why gN displays a low average stay, despite it is the final network for amajority of the groups.
29Note the relatively high numbers for C5 in T1 and T3; those networks feature relatively lowpayoffs and are not Nash stable (the connected players can be better off by cutting two of their
23

Out
,In
(Rat
io)
Des
tina
tion
s(S
hare
)A
vera
gest
ay
T1
T2
T3
T1
T2
T3
T1
T2
T3
C1
115,
136
(.85)
60,7
2(.8
3)65
,91
(.71)
C2(
100%
)C
2(10
0%)
C2(
100%
)2.
283.
003.
67
C2
135,
146
(.92)
75,7
7(.9
7)96
,103
(.93)
C1(
21%
),C
3(12
%),
C4(
67%
)C
1(24
%),
C3(
7%),
C4(
69%
)C
1(39
%),
C3(
10%
),C
4(51
%)
2.60
2.90
3.24
C3
18,1
8(1
)10
,10
(1)
21,2
1(1
)C
2(18
%),
C7(
82%
)C
2(20
%),
C7(
80%
)C
2(76
%),
C7(
24%
)1.
611.
101.
43
C4
129,
135
(.96)
66,6
6(1
)70
,76
(.92)
C2(
26%
),C
5(30
%),
C7(
24%
)C
2(23
%),
C5(
43%
),C
7(26
%)
C2(
31%
),C
5(30
%),
C7(
33%
)2.
121.
991.
84
C5
46,4
7(.9
8)26
,55
(.47)
24,2
5(.9
6)C
4(50
%),
C9(
50%
)C
4(8%
),C
9(92
%)
C4(
58%
),C
9(42
%)
4.49
4.42
3.44
C6
35,3
5(1
)8,
8(1
)10
,10
(1)
C4(
43%
),C
9(57
%)
C4(
37%
),C
9(62
%)
C4(
90%
),C
9(10
%)
2.89
1.00
3.00
C7
49,5
0(.9
8)34
,36
(.94)
32,4
2(.7
6)C
4(10
%),
C8(
22%
),C
9(61
%)
C3(
15%
),C
4(26
%),
C9(
50%
)C
3(41
%),
C4(
25%
),C
9(31
%)
1.54
1.28
5.05
C8
16,1
6(1
)11
,11
(1)
13,1
3(1
)C
7(19
%),
C10
(81%
)C
7(82
%),
C10
(18%
)C
7(69
%),
C10
(31%
)2.
871.
541.
38
C9
96,9
6(1
)51
,59
(.86)
31,3
1(1
)C
5(12
%),
C6(
12%
),C
10(6
7%)
C5(
53%
),C
10(3
9%)
C6(
19%
),C
7(16
%),
C10
(51%
)1.
944.
031.
32
C10
72,7
7(.9
3)24
,24
(1)
19,2
1(.9
0)C
9(9%
),C
11(9
0%)
C8(
33%
),C
9(54
%),
C11
(12%
)C
8(47
%),
C9(
37%
),C
11(1
7%)
4.06
2.96
3.05
C11
0,65 (0)
2,3
(.66)
2,3
(.66)
–C
10(1
00%
)C
10(1
00%
)1.
521.
671.
00
Tabl
e5:
Des
crip
tive
stat
isti
cs,b
ytr
eatm
enta
ndcl
ass
ofne
twor
ks
24
a game lasted longer in T3 (22.93 stages), followed by T2 (21.5) and T1 (17.73).
All the results presented are in line with Hypothesis 5. Furthermore, they
cannot be reconciled using traditional theoretical arguments. In T3, the VNMFS
sets are Pareto efficient, Pareto dominant among the PWS networks, and strongly
stable (a condition not met in T2). Our interpretation is that the VNMFS sets are
less robust to limitedly farsighted deviations in T3. As discussed in Section 3.2
there are farsighted improving paths in two steps leaving any g∈C7 and reaching
another network in the same class. Both steps imply a strict improvement in the
final network with respect to the current one (see table 2). Deviations leaving the
VNMFS set in T2 are longer and less feasible as they include some players adding
a link only to be as well off in the final network as they are in the current one.
An alternative interpretation would be that the multiplicity of networks that
are in a VNMFS set generate coordination problems among the players. This
problem is not present in T1 and has an obvious solution in T2, given the se-
quential nature of the game.30 In T3, agents with two links are worse off than
the agents with one link, in network class C7. Hence, agents have a strategic
incentive to build only one link, and let the others build two. However, this in-
terpretation is refuted by our data. According to it, we would observe the agents
having problems in reaching C7, and not moving away once they are there. We
observe almost the opposite. As shown in Table 5, in T3 the groups ended the
game in C7 only in ten out of the forty-two times they accessed it. The same ratio
(for C5) is twenty-nine out of fifty-five in T2. Thus, in T3 the groups have more
problems staying in C7 than accessing it.
Next we explore the relevance of limited farsightedness, analyzing individ-
ual behavior. Before doing so, we should stress that limited farsightedness, as
its extreme counterparts, is meant to be a tool for assessing the stability of a cer-
tain state. As such, it should not be interpreted as a proper model of individual
strategic behavior, and the following analysis should be understood accordingly.
We build the vectors of choices of virtual players endowed with different lev-
els of limited farsightedness, including myopia, according to Definition 3. Those
existing links), though they are PWS. Note also the high number for C9 in T2. Those networks areoften reached when an unsatisfied player in a VNMFS set takes a non-myopic move. As expected,this deviation is generally unsuccessful, in the sense that the group is stuck in C9 until a backwardmove is taken by the same player.
30As the connected agents in a VNMFS set are better off, the first agents that are proposed alink on a path to C5 should build them.
25
are vectors of dummies, f ijikgt
, for k = 1,2, . . . , containing the ideal actions of an
individual i, with level of farsightedness k, choosing with respect to link ij in
network gt.
Recall that an action is consistent with farsightedness of level k if it lies on
a farsighted improving path of length (weakly) shorter than k; k = 1 is identical
to myopia. To lie on a farsighted improving path, an action must imply moving
from the current network. Categorizing choices that imply inaction - i.e. staying
in the current network - is more problematic. According to Definition 3, those
actions are consistent with farsightedness of level k if moving would not be far-
sighted of level k, which equals assuming that a farsighted agent should always
take any farsighted improving path, imposing a strong restriction on farsighted
behavior.31 As a throughout theoretical analysis of limited farsightedness goes
beyond the scope of the present paper, we will tackle this issue by running the
analysis twice, on two set of decisions: the full set of choices, and its restriction
to the actions that imply moving from the current network - i.e. excluding those
that result in inaction. We will refer to the former set as choices, and to the latter
as moves.32
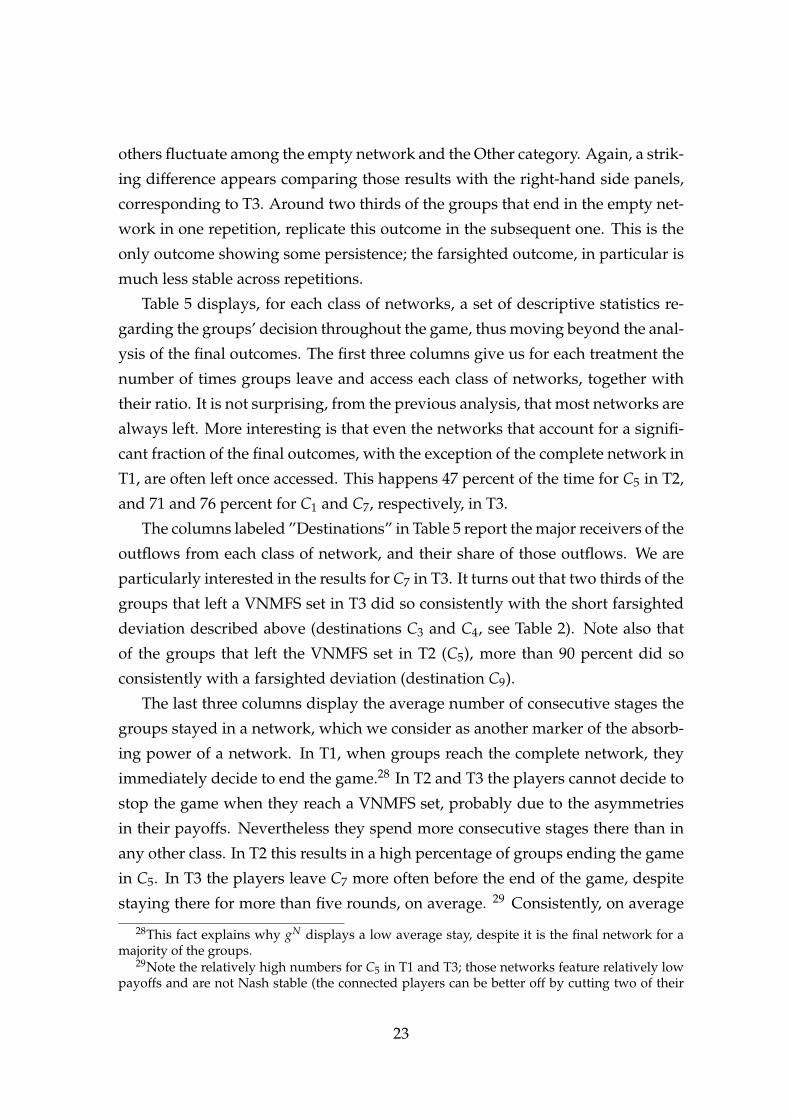
In Figure 6 we represent the fraction of choices that are consistent with my-
opia and progressive levels of limited farsightedness, over stages. Starting rela-
tively low, the fraction of choices that are consistent with myopia remains approx-
imately stable, above 60 percent, in the central part of the game, and is somewhat
higher in the last stages. Including farsightedness of level two increases the frac-
tion of consistent choices by about 15 percentage points. Another 10 percent is
added by farsightedness of level three, whilst higher level of farsightedness re-
sult in improvements that are only marginal.33 This picture suggests, once more,
that myopic incentives were a main guide for decision making in our framework;
however agents often departed from those, following short farsighted deviations,
with relevant consequences on the final outcomes.
We perform a regression analysis to explore the relation between the actual
choices, aijigt
, and the ideal benchmarks, f ijikgt
, up to a level of farsightedness of
four. This exercise suffers from many statistical limitations. In particular, the
number of choices each agent takes is endogenous, as groups can decide when to
31This restriction is of course not problematic for myopic behavior.32This set identifies the paths - i.e. sequences of different networks - the groups walk through.33The picture is qualitatively similar across treatments.
26
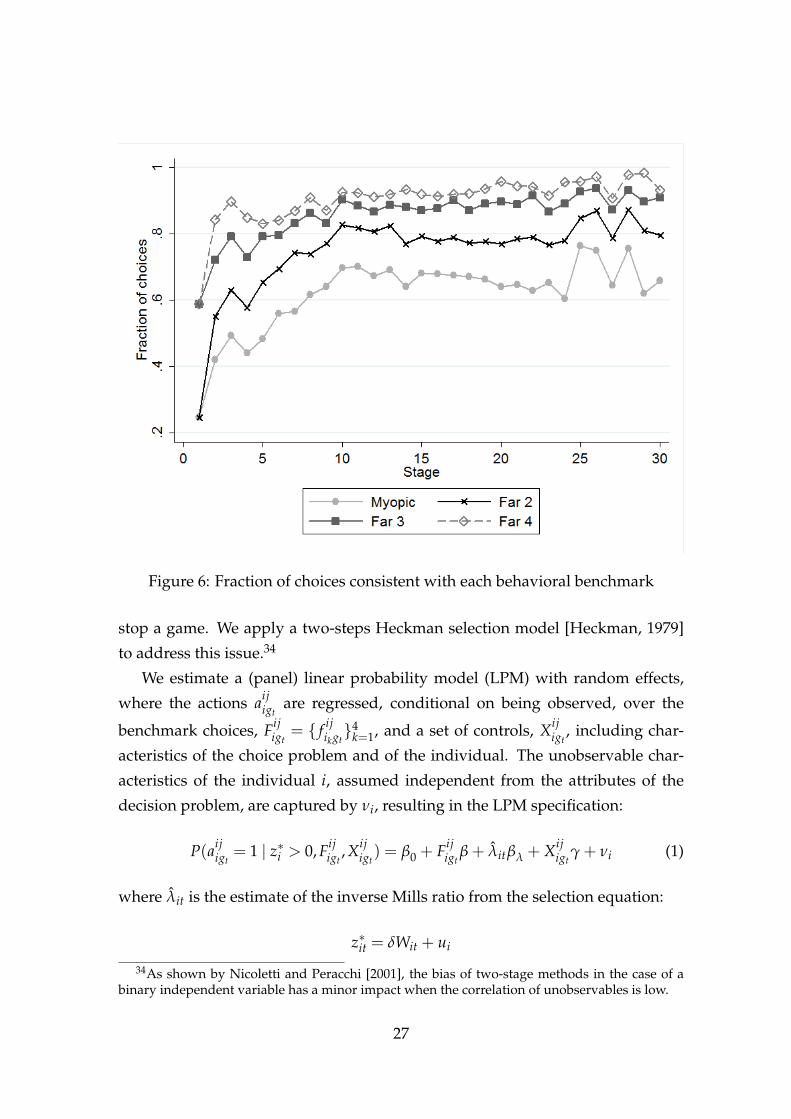
Figure 6: Fraction of choices consistent with each behavioral benchmark
stop a game. We apply a two-steps Heckman selection model [Heckman, 1979]
to address this issue.34
We estimate a (panel) linear probability model (LPM) with random effects,
where the actions aijigt
are regressed, conditional on being observed, over the
benchmark choices, Fijigt
= { f ijikgt}4
k=1, and a set of controls, Xijigt
, including char-
acteristics of the choice problem and of the individual. The unobservable char-
acteristics of the individual i, assumed independent from the attributes of the
decision problem, are captured by νi, resulting in the LPM specification:
P(aijigt
= 1 | z∗i > 0, Fijigt
, Xijigt) = β0 + Fij
igtβ + λitβλ + Xij
igtγ + νi (1)
where λit is the estimate of the inverse Mills ratio from the selection equation:
z∗it = δWit + ui
34As shown by Nicoletti and Peracchi [2001], the bias of two-stage methods in the case of abinary independent variable has a minor impact when the correlation of unobservables is low.
27
zit =
1 if z∗it > 0
0 if z∗it ≤ 0(2)
where z∗it is the latent variable capturing the propensity of a choice to be selected,
zit is a dummy variable indicating whether we observe the choice or not, and ui is
a normal error term. Wit is the set of regressors that explain the selection of obser-
vations, including all controls Xijigt
that are applicable,35 plus a set of restrictions.
We use as restrictions36 in the selection equation dummies for each treatment
and for each type of final outcome (myopic, farsighted, other). We do not include
the treatments in the main regression because we have no reason to think that
they have any effect on single decisions, but for the effect of the different payoffs,
which are already accounted for through our main regressors. A similar reason-
ing holds for the final outcomes of the groups. The restrictions are justified as
both the treatments and the group final outcomes are relevant determinants of
the time when the agents stop the game.
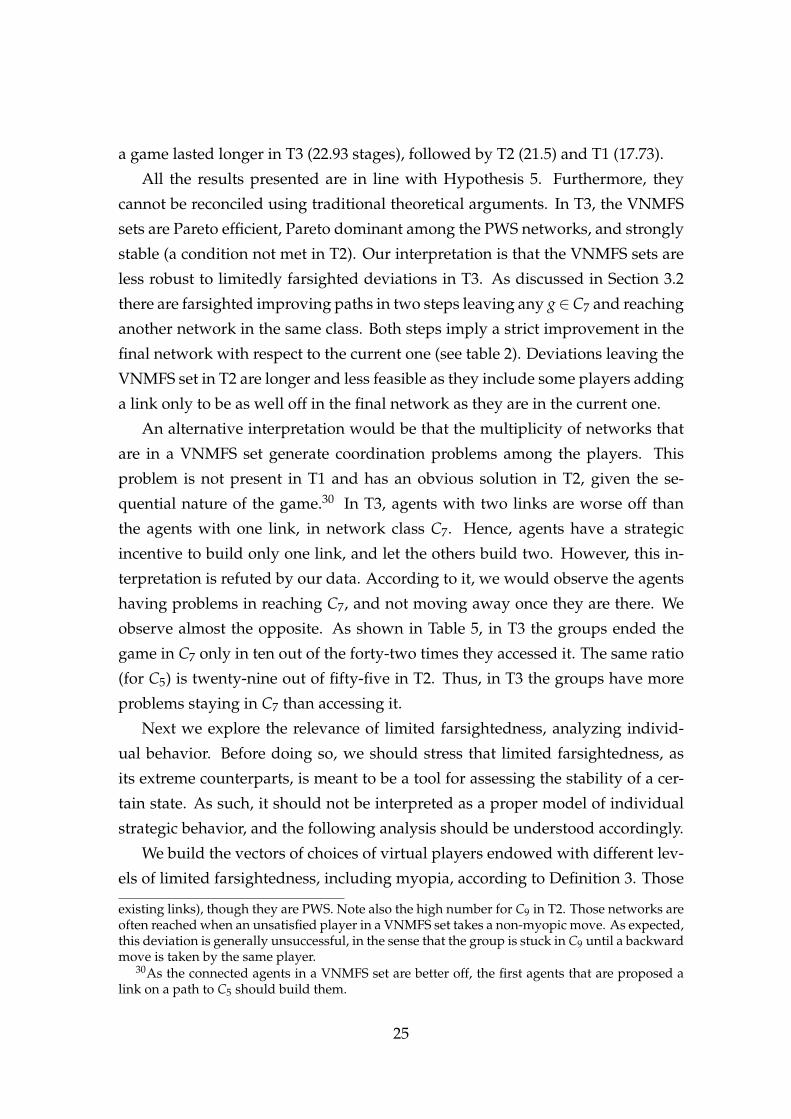
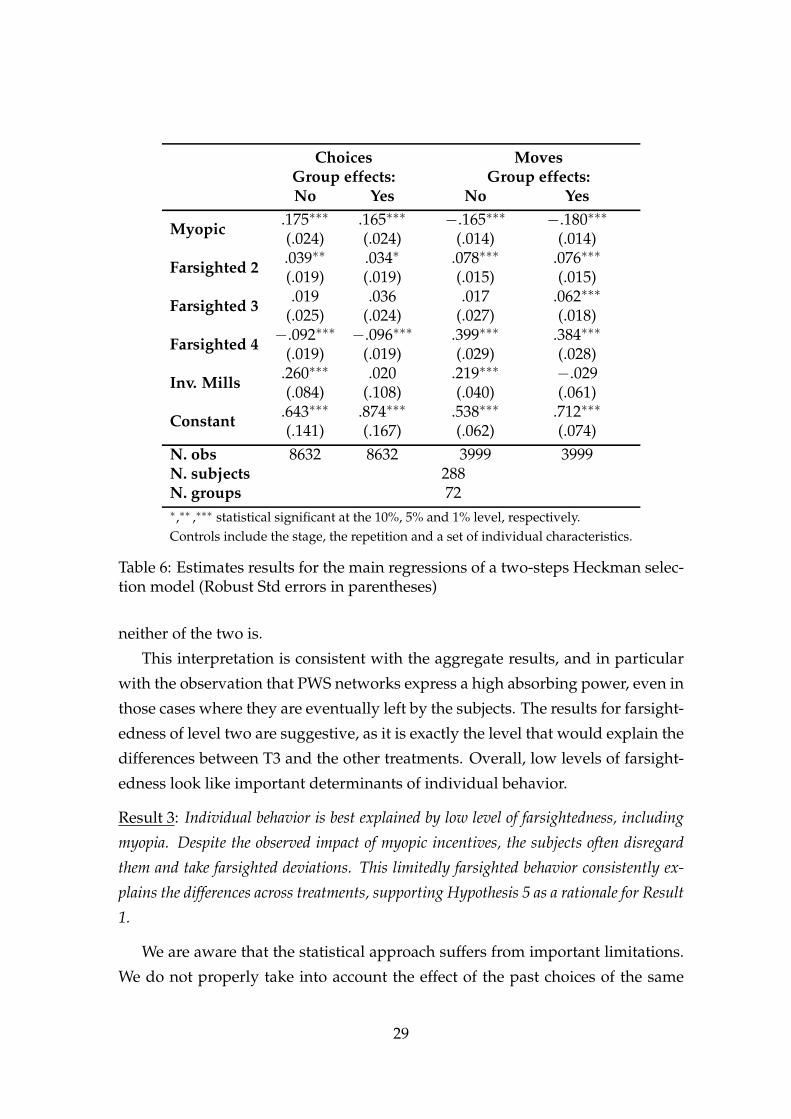
We run this specification on both choices and moves, with and without group
fixed effects,37 giving the four specifications shown in Table 6. There is a ma-
jor shift between the left-hand side and the right-hand side specifications. When
considering choices, myopic behavior and farsightedness of level two have a pos-
itive and significant coefficient. For higher levels of farsightedness the coefficient
is insignificant and eventually turns negative (and significant). The picture is re-
verted with moves. Myopia has a negative and significant coefficient, and those
for all farsightedness levels are positive and significant. Level two is the only
variable to show a stable explanatory power across specifications.
Combining the results, we see that subjects often refused to move from the
current network, because of myopic incentives. When they move, they do so also
against their immediate interest, following farsighted improving paths (even of
relatively high length); nevertheless, they regularly do not move even if a lengthy
farsighted improving path is available. The coefficients for farsightedness of level
two (and myopia) suggest that agents generally take myopic and farsighted im-
proving paths of length two when those are available, and refuse to move when
35The controls that refer to the decision problem are unobservable is the observation is notselected.
36That is, we include those variables in Wit, but not in Xijigt
.37Errors are always clustered at the group level.
28
Choices MovesGroup effects: Group effects:No Yes No Yes
Myopic .175∗∗∗ .165∗∗∗ −.165∗∗∗ −.180∗∗∗
(.024) (.024) (.014) (.014)
Farsighted 2 .039∗∗ .034∗ .078∗∗∗ .076∗∗∗
(.019) (.019) (.015) (.015)
Farsighted 3 .019 .036 .017 .062∗∗∗
(.025) (.024) (.027) (.018)
Farsighted 4 −.092∗∗∗ −.096∗∗∗ .399∗∗∗ .384∗∗∗
(.019) (.019) (.029) (.028)
Inv. Mills .260∗∗∗ .020 .219∗∗∗ −.029(.084) (.108) (.040) (.061)
Constant .643∗∗∗ .874∗∗∗ .538∗∗∗ .712∗∗∗
(.141) (.167) (.062) (.074)N. obs 8632 8632 3999 3999N. subjects 288N. groups 72∗,∗∗ ,∗∗∗ statistical significant at the 10%, 5% and 1% level, respectively.Controls include the stage, the repetition and a set of individual characteristics.
Table 6: Estimates results for the main regressions of a two-steps Heckman selec-tion model (Robust Std errors in parentheses)
neither of the two is.
This interpretation is consistent with the aggregate results, and in particular
with the observation that PWS networks express a high absorbing power, even in
those cases where they are eventually left by the subjects. The results for farsight-
edness of level two are suggestive, as it is exactly the level that would explain the
differences between T3 and the other treatments. Overall, low levels of farsight-
edness look like important determinants of individual behavior.
Result 3: Individual behavior is best explained by low level of farsightedness, including
myopia. Despite the observed impact of myopic incentives, the subjects often disregard
them and take farsighted deviations. This limitedly farsighted behavior consistently ex-
plains the differences across treatments, supporting Hypothesis 5 as a rationale for Result
1.
We are aware that the statistical approach suffers from important limitations.
We do not properly take into account the effect of the past choices of the same
29
individual and of the group, though it is likely that the path of a group has a
huge influence on the behavior of the subjects. Moreover, the different results
for moves and choices are, at least partially, an artifact of the way in which the
regressors are constructed. In particular, the ex ante probability that modifying a
network is consistent with some level of farsightedness is increasing in the level
itself.
Although statistical problems notwithstanding, we think that our results clearly
show that individual behavior is consistent with limited farsightedness.
5 Conclusion
This paper reports an experimental test of the most used stability notions for net-
work formation. In particular, by studying the performance of pairwise stability
and of von Neumann-Morgenstern farsighted stability, we test whether subjects
behave according to myopia or farsightedness when forming a network, allowing
for limited levels of farsightedness. As far as we know this is the first experimen-
tal investigation into this issue.
The results show that both of the extreme theories, perfect myopia and far-
sightedness, are inconsistent with our data, and suggest that the subjects are only
limitedly farsighted. Agents reach a stable network in 75 percent of the cases, and
more so as the game is repeated. In two of the treatments, a vast majority reach a
von Neumann-Morgenstern farsightedly stable set. In the third treatment, where
the farsighted prediction is not robust to limitedly farsighted deviations, they fail
to do so, and 50 percent of them end up in the myopic prediction.
The properties of the treatments enable us to attribute this asymmetry to a
form of limited farsightedness, and individual behavior analysis confirms this
interpretation: low levels of farsightedness, nesting myopia as the lowest level,
best explain our data.
Our results opens the way to new interesting research questions. While the
literature has concentrated on the extreme cases of perfect myopia and perfect
farsightedness, our experimental results suggests that an intermediate approach
could provide a valuable alternative and a promising refinement of pairwise sta-
bility.
30
References
Bala, Venkatesh and Sanjeev Goyal, “A noncooperative model of network formation,”
Econometrica, 2003, 68 (5), 1181–1229.
Berninghaus, Siegfried K, Karl-Martin Ehrhart, and Marion Ott, “Forward-looking
behavior in Hawk–Dove games in endogenous networks: Experimental evidence,”
Games and Economic Behavior, 2012, 75 (1), 35–52.
Bloch, Francis and Matthew O Jackson, “Definitions of equilibrium in network forma-
tion games,” International Journal of Game Theory, 2006, 34 (3), 305–318.
Carrillo, Juan and Arya Gaduh, “The strategic formation of networks: experimental
evidence,” 2012.
Chwe, Michael Suk Young, “Farsighted coalitional stability,” Journal of Economic Theory,
1994, 63 (2), 299–325.
Dutta, Bhaskar, Sayantan Ghosal, and Debraj Ray, “Farsighted network formation,”
Journal of Economic Theory, 2005, 122 (2), 143–164.
Engelmann, Dirk and Martin Strobel, “Inequality aversion, efficiency, and maximin
preferences in simple distribution experiments,” The American Economic Review, 2004,
94 (4), 857–869.
Falk, Armin and Michael Kosfeld, “It’s all about connections: evidence on network
formation,” Review of Network Economics, 2012, 11 (3).
Fehr, Ernst and Klaus M Schmidt, “A theory of fairness, competition, and cooperation,”
The Quarterly Journal of Economics, 1999, 114 (3), 817–868.
Fischbacher, Urs, “z-Tree: Zurich toolbox for ready-made economic experiments,” Ex-
perimental Economics, 2007, 10 (2), 171–178.
Goeree, Jacob K, Arno Riedl, and Aljaž Ule, “In search of stars: Network formation
among heterogeneous agents,” Games and Economic Behavior, 2009, 67 (2), 445–466.
Heckman, James J, “Sample selection bias as a specification error,” Econometrica, 1979,
pp. 153–161.
Herings, P, Ana Mauleon, and Vincent J Vannetelbosch, “Rationalizability for social
environments,” Games and Economic Behavior, 2004, 49 (1), 135–156.
31

, , and Vincent Vannetelbosch, “Farsightedly stable networks,” Games and Economic
Behavior, 2009, 67 (2), 526–541.
Jackson, Matthew O and Alison Watts, “The evolution of social and economic net-
works,” Journal of Economic Theory, 2002, 106 (2), 265–295.
and Anne van den Nouweland, “Strongly stable networks,” Games and Economic Be-
havior, 2005, 51 (2), 420–444.
and Asher Wolinsky, “A strategic model of social and economic networks,” Journal of
Economic Theory, 1996, 71 (1), 44–74.
Konishi, Hideo and Debraj Ray, “Coalition formation as a dynamic process,” Journal of
Economic Theory, 2003, 110 (1), 1–41.
Mauleon, Ana and Vincent Vannetelbosch, “Farsightedness and cautiousness in coali-
tion formation games with positive spillovers,” Theory and Decision, 2004, 56 (3), 291–
324.
Nicoletti, Cheti and Franco Peracchi, “Two-step estimation of binary response models
with sample selection,” in “first British Household Panel Survey research conference
held in Colchester, July” Citeseer 2001.
Page, Frank H and Myrna Wooders, “Strategic basins of attraction, the path dominance
core, and network formation games,” Games and Economic Behavior, 2009, 66 (1), 462–
487.
, Myrna H Wooders, and Samir Kamat, “Networks and farsighted stability,” Journal of
Economic Theory, 2005, 120 (2), 257–269.
Sobel, Joel, “Interdependent preferences and reciprocity,” Journal of Economic Literature,
2005, 43 (2), 392–436.
Tercieux, Olivier and Vincent Vannetelbosch, “A characterization of stochastically sta-
ble networks,” International Journal of Game Theory, 2006, 34 (3), 351–369.
Watts, Alison, “A dynamic model of network formation,” Games and Economic Behavior,
2001, 34 (2), 331–341.
, “Non-myopic formation of circle networks,” Economics Letters, 2002, 74 (2), 277–282.
Xue, Licun, “Coalitional stability under perfect foresight,” Economic Theory, 1998, 11 (3),
603–627.
32
Ziegelmeyer, Anthony and Katinka Pantz, “Collaborative networks in experimental tri-
opolies,” Technical Report, Max Planck Institute of Economics, Strategic Interaction
Group 2005.
33
A Proofs
Proof of Proposition 1. To avoid reporting the farsighted improving path for
each single network, let gi be a generic network in class Ci and ci ⊂ Ci a generic
proper subset of the corresponding class. We will write gi → g with g ∈ Cj, and
gi → g with g ∈ cj, when the generic network gi in class Ci reaches with a far-
sighted improving path all the networks in class Cj or only a proper subset cj of
Cj, respectively.
i In T1 the list of farsighted improving paths among the networks in G is the
following:
F(g∅) = {g | g ∈ C10 ∪ C11}F(g2) = {g | g ∈ C1 ∪ C10 ∪ C11}F(g3) = {g | g ∈ C1 ∪ c2 ∪ c5 ∪ C10 ∪ C11}F(g4) = {g | g ∈ C1 ∪ c2 ∪ c5 ∪ C10 ∪ C11}F(g5) = {g | g ∈ C1 ∪ c2 ∪ C10 ∪ C11}F(g6) = {g | g ∈ C1 ∪ c2 ∪ c4 ∪ c5 ∪ C10 ∪ C11}F(g7) = {g | g ∈ C1 ∪ c2 ∪ c3 ∪ c4 ∪ C5 ∪ C10 ∪ C11}F(g8) = {g | g ∈ C1 ∪ c2 ∪ c4 ∪ C5 ∪ c7 ∪ C10 ∪ C11}F(g9) = {g | g ∈ C1 ∪ c2 ∪ c4 ∪ c5 ∪ c6 ∪ c7 ∪ C10 ∪ C11}F(g10) = {g | g ∈ c2 ∪ c4 ∪ c5 ∪ c6 ∪ C11}F(gN) =∅.
It follows that gN ∈ F(g), for all g in G \ gN and F(gN) = ∅. Thus {gN} is
the unique VNMFS set.
ii In T2 the list of farsighted improving paths among the networks in G is the
following:
F(g∅) = {g | g ∈ C5}F(g2) = {g | g ∈ C1 ∪ C5 ∪ c9}F(g3) = {g | g ∈ C1 ∪ c2 ∪ C5 ∪ C9}F(g4) = {g | g ∈ C1 ∪ c2 ∪ c4 ∪ C5 ∪ c9}F(g5) = {g | g ∈ C9 ∩ Ag5}F(g6) = {g | g ∈ C1 ∪ c2 ∪ c4 ∪ C5 ∪ C9}F(g7) = {g | g ∈ C1 ∪ c2 ∪ c3 ∪ c4 ∪ C5 ∪ C9}F(g8) = {g | g ∈ C1 ∪ c2 ∪ c4 ∪ C5 ∪ c7 ∪ C9}F(g9) = {g | g ∈ c4 ∪ (C5 ∩ Ag9) ∪ (C9 \ g9)}
34

F(g10) = {g | g ∈ C1 ∪ c2 ∪ c4 ∪ C5 ∪ c7 ∪ c8 ∪ C9}F(gN) = {g | g ∈ C5 ∪ C9 ∪ C10}The set {g | g ∈ C5} is a VNMFS set. It is reached by any network outside
the set and there are no paths between any two networks in the set. Let us
check that it is unique.
Consider first a candidate set that does not include any network in C5. It
must then be reached by each single network in C5, which implies this set
should include at least two networks that belong to C9. Given that {g′ | g′ ∈C9 \ g} ⊂ F(g) for every g ∈ C9, a set including two networks in C9 is not
internally stable.
Now consider a candidate that includes at least one network g ∈ C5. Then
it should include at least one network g′ ∈ C9, such that g′ /∈ F(g) and g /∈F(g′). This condition is impossible as all networks in C9 that are not adjacent
to a network in C5 are reached by a farsighted improving path from this
network, and all networks in C9 that are adjacent to a network in C5 reach
this network with a farsighted improving path. We conclude that {g | g ∈C5} is the unique VNMFS set.
iii In T3 the list of farsighted improving paths among the networks in G is the
following:
F(g∅) = {g | g ∈ C7}F(g2) = {g | g ∈ C1 ∪ C7 ∪ c10}F(g3) = {g | g ∈ C1 ∪ c2 ∪ C7 ∪ C10}F(g4) = {g | g ∈ C1 ∪ c2 ∪ c5 ∪ C7 ∪ c10}F(g5) = {g | g ∈ C1 ∪ c2 ∪ C7 ∪ c10}F(g6) = {g | g ∈ C1 ∪ c2 ∪ c4 ∪ c5 ∪ C7 ∪ C10}F(g7) = {g | (g ∈ C7 ∧ ∃i s.t. di(g) 6= di(g′)) ∨ g ∈ C10}F(g8) = {g | g ∈ C1 ∪ c4 ∪ C7 ∪ C10}F(g9) = {g | g ∈ C1 ∪ c2 ∪ c4 ∪ c5 ∪ c6) ∪ C7 ∪ C10}F(g10) = {g | g ∈ C1 ∪ c2 ∪ c4 ∪ c5 ∪ c6 ∪ C7 ∪ c8 ∪ C10 \ g10}F(gN) = {g | g ∈ C7 ∪ C10}A network g ∈ C7 is reached with a farsighted improving path from any
other network except for the network g′ ∈ C7, where each single agent has
the same degree as in g. By definition each dyad {g, g′} is a VNMFS set. Let
35

us check there is no other VNMFS set.
Given the previous argument, any set containing g ∈ C7 and any other net-
work g′′ 6= g′ (as defined above) does not satisfy internal stability. Consider
now a candidate set that does not include any network in C7. As it must
be reached by networks in C7, it will necessarily include one and only one
(for internal stability) network in C10. Then it must necessarily include g∅,
which violates internal stability.
36

B Experimental Instructions
Welcome to this experiment in decision-making. In this experiment you can earn
money. The amount of money you earn depends on the decisions you and other
participants make. Please read these instructions carefully. In the experiment you
will earn points. At the end of the experiment we will convert the points you have
earned into euros according to the rate: 6 points equal 1 Euro. You will be paid
your earnings privately and confidentially after the experiment. Throughout the
experiment you are not allowed to communicate with other participants in any
way. If you have a question please raise your hand. One of us will come to
your desk to answer it.
Groups
• At the beginning of the experiment the computer will randomly assign you -
and all other participants - to a group of 4 participants. Group compositions
do not change during the experiment. Hence, you will be in the same group
with the same people throughout the experiment.
• The composition of your group is anonymous. You will not get to know the
identities of the other people in your group, neither during the experiment
nor after the experiment. The other people in your group will also not get
to know your identity.
• Each participant in the group will be assigned a letter, A, B, C, or D, that
will identify him. On your computer screen, you will be marked ‘YOU’ as
well as with your identifying letter (A, B, C or D). You will be marked with
your identifying letter (A, B, C or D) on the computer screens of the other
people in your group.
• Those identifying letters will be kept fixed within the same round, but will
be randomly reassigned at the beginning of every new round.
Length and articulation of the experiment
• The experiment consists of 3 rounds, each divided into stages.
37
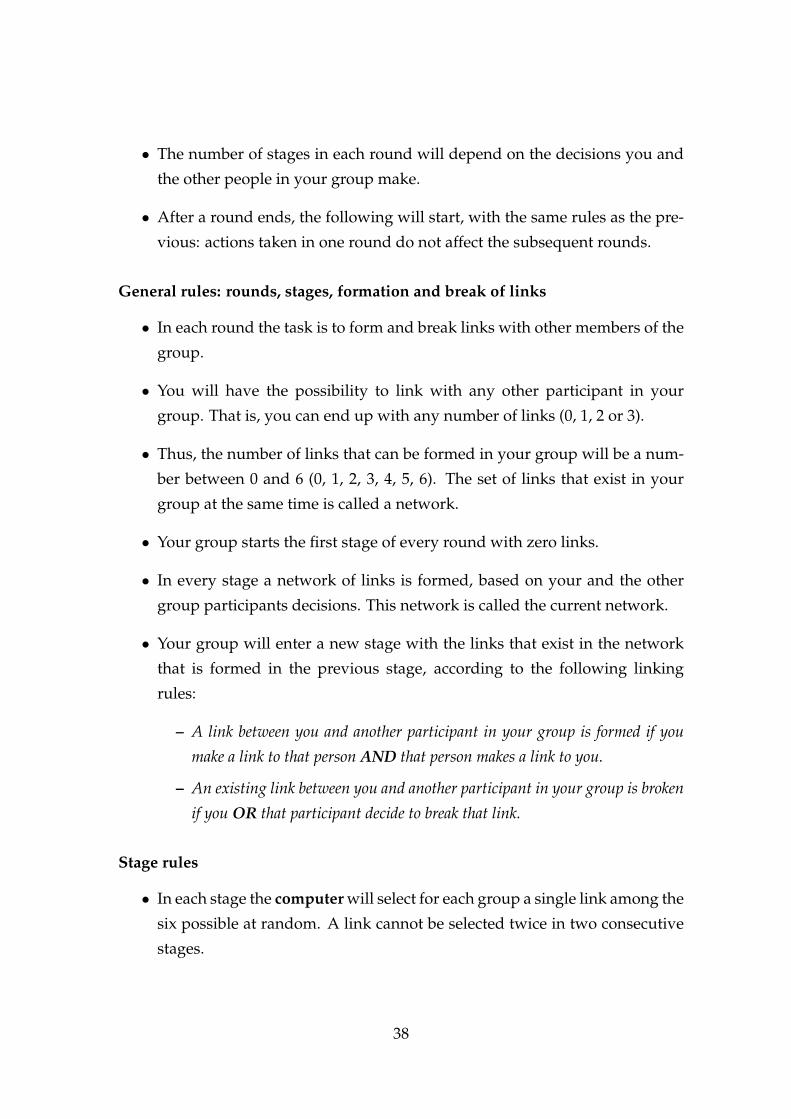
• The number of stages in each round will depend on the decisions you and
the other people in your group make.
• After a round ends, the following will start, with the same rules as the pre-
vious: actions taken in one round do not affect the subsequent rounds.
General rules: rounds, stages, formation and break of links
• In each round the task is to form and break links with other members of the
group.
• You will have the possibility to link with any other participant in your
group. That is, you can end up with any number of links (0, 1, 2 or 3).
• Thus, the number of links that can be formed in your group will be a num-
ber between 0 and 6 (0, 1, 2, 3, 4, 5, 6). The set of links that exist in your
group at the same time is called a network.
• Your group starts the first stage of every round with zero links.
• In every stage a network of links is formed, based on your and the other
group participants decisions. This network is called the current network.
• Your group will enter a new stage with the links that exist in the network
that is formed in the previous stage, according to the following linking
rules:
– A link between you and another participant in your group is formed if you
make a link to that person AND that person makes a link to you.
– An existing link between you and another participant in your group is broken
if you OR that participant decide to break that link.
Stage rules
• In each stage the computer will select for each group a single link among the
six possible at random. A link cannot be selected twice in two consecutive
stages.
38

• The participants involved in that link will be asked to take a decision in that
stage, the others will be informed about the selected link and will be asked
to wait for others’ decisions.
• If this link does not exist at the beginning of the stage, the decision will be
whether to form that link or not. If this link exists at the beginning of the
stage, the decision will be whether to keep or to break that link.
• Thus, in each stage at most one link can be formed or broken.
Stopping rules
• After every stage you and the other people in your group will be asked if
you are willing to modify the current network. You can answer YES or NO.
• If ALL the people in your group answer NO the round ends and the points
associated to the current network are considered to compute your earnings.
• If at least one person in your group answers YES, the group moves to the
next stage.
• After stage 25 a random stopping rule is added. In this case, even if you
or any of the other people in your group are willing to modify the current
network, the round will end with probability 0.2.
Earnings
• To every participant in every network is associated a number of points.
• You will receive points according to the network that exists in your group
at the end of each round.
• Your total earnings will be the sum of the earnings in each of the 3 rounds.
• Thus, the points associated to the networks you and the other people in
your group form at every stage, except for the last of each round, are not
considered for the computation of your earnings.
39

• You are always informed about the points associated to the current network
on screen. On the top of your screen, you are always informed of the points
you earned in the previous rounds.
• You can learn about the points associated to every other network through
the points sheet you find attached to the instructions. It displays the points
associated to every class of networks:
– In every network, the black dots are the participants in the group; the
lines are the existing links.
– Every class of network is characterized by the number of links each
participant has.
– The numbers close to every black dots indicate the number of points
a person with that number of links is earning in that specific class of
networks.
• An example will clarify the relation between network and points and the
developing of the experiment. You will also practice through a training
stage.
Concluding remarks
You have reached the end of the instructions. It is important that you understand
them. If anything is unclear to you or if you have questions, please raise your
hand. To ensure that you understood the instructions we ask you to answer a few
control questions. After everyone has answered these control questions correctly
the experiment will start.
40
Top Related