


Languages
Pages
Legal


Lessons from the Recession:Where Customer Service and Support Investments Yield Superior Returns for Communications and High-Tech CompaniesResearch Report

2
Executive Summary......................3About the Research......................5Key Findings.................................8Impact of the Downturn on Providers.....................................10
Service Contract Purchase and Renewal..................................12
Investments in Service and Support Capabilities...................16
The Vendor-Customer Relationship.........................................20
The Value of Loyalty and its Connection to Service..............27
Conclusion.................................33

3
To better understand the effects of the recent economic downturn on the Communications and High Tech (CHT) segment, Accenture recently launched a comprehensive study of three groups: global enterprise customers of CHT products and services, consumers of CHT products and services, and global vendors of CHT products and services.
The research has provided several illuminating insights on how CHT companies fared during the recession and what changes they made to their strategies, as well as how customers changed their buying behaviors. For example, CHT vendors and customers agreed that spending has been widely cut and demand has slowed. However, there is one notable exception: service agreements appear to have thrived during the downturn
Executive Summarybecause of proactive efforts from vendors. Our research also shows that investments in the customer experience are considered important by nearly all CHT vendors, and that many have made such investments in customer service. However, while a majority of vendors believe that the actions they have taken have improved the customer experience, customers themselves disagree. This gap is critical as our research shows that customers who believe they received an improved experience are more loyal, and more willing to spend both during the recession and in its wake. Our study also reveals that providing customers with better service and information are important steps toward boosting this loyalty.

4
The impact of the downturn
As mentioned, the recession led to softer demand for many CHT vendors. In fact, they reported that approximately one-fourth of their customers reduced their spending in the past year. Our research with customers validates this estimate: Between 20 and 26 percent of consumers and enterprise customers revealed that they had indeed cut their CHT spending. For both enterprise customers and consumers, the biggest reasons for these cuts were budget constraints or the acquisition of lower-cost replacements.
Service contracts
Despite these cuts, most CHT vendors reported either stability or growth in the purchase and renewal of service contracts among both consumers and enterprise customers. What is driving this positive outcome? Vendors attributed it to several new offers they formulated: lower prices, additional content for the same price, high-value product and service bundles, and more flexible payment options. Vendors also said they had relaxed requirements for contract commitments and had developed special price incentives (including rebates or free installation) to encourage customers to purchase or renew services. Another quarter had increased the quality of the service and support they offer, or had lowered requirements for higher customer status levels.
Investments in service and support capabilities
CHT vendors clearly believe their investments in customer service and support have been both valuable and timely. In fact, 41 percent of respondents said service and support is much more important during a downturn than during times of robust growth, and virtually all said it is important to their business to invest in service and support during a downturn. Sixty percent of respondents reported making such investments, from
purchasing or merging with another business with superior customer service operations, to building or improving Web support portals, to making business process improvements or creating better knowledge management capabilities. It follows that CHT vendors overwhelmingly reported increased costs in all key areas of service and support. However, our research also shows that just 18 percent of vendors are using advanced analytical tools to determine which cost changes would generate the greatest return on investment.
The vendor-customer relationship
Regardless of whether they increased or reduced their service and support spending, eight in 10 vendor respondents said their actions have positively impacted the overall customer service and support experience. However, an overwhelming majority of customers said they have either noticed no difference in the service and support experience delivered by their CHT vendors, or have even received worse service.
Obviously, this gap should concern vendors, especially given that a large majority of customers (92 percent of enterprises and 81 percent of consumers) who think the service and support experience delivered by their vendors has improved were more likely to keep doing business with those companies during the downturn. Along the same lines, just under 60 percent of both consumers and enterprise customers who think the service and support experience has degraded are more likely to eliminate or reduce their spending with those companies during the downturn.
In addition, our research has revealed that while 84 percent of enterprise customers thought their vendors valued their business, only about one-fourth of these customers said they were very loyal to these vendors. The situation is even more critical among consumers: Just 40 percent thought
their business was valued, and less than 20 percent said they were very loyal to their vendors.
The value of loyalty and its connection to service
With loyalty such a scarce and precious commodity, we set out to understand its connection with service. The key takeaway: More loyal customers may be so because they have received improved service and better information.
For instance, very loyal enterprise customers were much more likely than others to report that their customer service and support experiences had improved during the downturn, and to be aware of offers their vendors had made to change, simplify or reduce the cost of their relationships with customers. In addition, very loyal enterprise customers were almost five times more likely than others to say they had received extensive information from their CHT providers on how the economic downturn had affected them and what the downturn meant for customers, and were also more likely to believe vendors valued their business. A similar pattern was seen in responses among consumers.
Such loyalty has real value, especially during a downturn. For instance, we found that customers who described themselves as very loyal were less likely than those who were neutral or not at all loyal to have cut spending on CHT products and services in the past year. These loyal customers also are the ones who will help lead companies into recovery, as they were more likely to say they planned to increase spending during the coming year.

5
As the challenging economic environment caused customers to reexamine their spending on virtually everything, communications and high-tech companies—like all companies—continue to consider the actions they must take to reduce churn and hold on to their existing customers’ business, even while they are preparing once again for growth. As highlighted above, one area that can play an important role in achieving that goal is customer service and support.
In the midst of the downturn, Accenture launched a comprehensive research effort with several goals in mind. At a high level, we wanted to understand the impact the recession was having on communications and high-tech companies’ business and, more specifically, the changes
About the Researchcompanies were making to their customer service and support activities to encourage continued spending even as customers’ budgets began to shrink. We also wanted to find out what actions customers were taking in response to the downturn and the factors that were driving their decisions to either reduce or increase their spending on communications and high-tech products and services. Finally, we hoped to determine customers’ state of mind with regard to such products and services, and glean insights into whether various aspects of the customer service experience made them more loyal to their communications and high-tech providers—and, thus, more likely to maintain or even increase their spending with those companies.
Our research was based on surveys of three distinct groups: 625 global enterprise customers of communications and high-tech products and services; 1,535 consumers of communications and high-tech products and services; and 462 global vendors of communications and high-tech products and services.
Respondents from CHT vendor companies participating in the survey were primarily senior-level executives from all segments of the global CHT industry. All regions of the world were represented by these vendors (Figure 1), and in terms of segments, the largest percentage was providers of telecommunications services and computer software (Figure 2). Furthermore, more than half of vendor respondents were owners or partners, C-level executives or vice presidents or directors (Figure 3).

6
Figure 1. All regions of the world were represented by the CHT vendors in the survey.
0% 2% 4% 6% 8% 10%
Brazil
Argentina
United States
Mexico
Canada
United Kingdom
Sweden
Italy
Germany
France
Finland
South Korea
Japan
India
China
Manager level or equivalent 45%
Vice president, director or equivalent 16%
Executive vice president or equivalent 8%
C-level executive 17%
Owner or partner 14%
Asia36%
North America22%
South America18%
Europe24%
0% 5% 10% 15% 20%
Telecommunications
Computer software
Computer-relatedservices
Business equipment
Computer hardware
Communicationequipment
Semiconductorequipment
Telecom serviceprovider 5%
5%
9%
9%
9%
9%
9%
10%
9%
9%
4%
4%
5%
1%
7%
3%
3%
10%
11%
14%
17%
19%
19%
Figure 2. Respondents from CHT vendors participating in the survey were primarily senior-level executives from all segments of the CHT industry.

7
Figure 3. More than half of vendor respondents were owners or partners, C-level executives or vice presidents or directors.
0% 2% 4% 6% 8% 10%
Brazil
Argentina
United States
Mexico
Canada
United Kingdom
Sweden
Italy
Germany
France
Finland
South Korea
Japan
India
China
Manager level or equivalent 45%
Vice president, director or equivalent 16%
Executive vice president or equivalent 8%
C-level executive 17%
Owner or partner 14%
Asia36%
North America22%
South America18%
Europe24%
0% 5% 10% 15% 20%
Telecommunications
Computer software
Computer-relatedservices
Business equipment
Computer hardware
Communicationequipment
Semiconductorequipment
Telecom serviceprovider 5%
5%
9%
9%
9%
9%
9%
10%
9%
9%
4%
4%
5%
1%
7%
3%
3%
10%
11%
14%
17%
19%
19%

8
Key FindingsConsumers were almost evenly split between men and women and covered a wide spectrum of income, ages and education (Figure 4). Enterprise customer respondents were mainly senior in title (Figure 5) and represented companies covering a diverse array of industry segments (Figure 6) and revenue ranges.
55+21%
45-5417%
35-4424%
25-3424%
18-2414%
Female47%
Male53%
VP or equivalent9%
Executive VP or equivalent 5%
C-level executive20%
Owner or partner 11%
Manager or equivalent55%
0% 5% 10% 15%
Retail/consumer goods
Manufacturing/distribution
Business services
High tech
Government/non-profit
Financial services
Resources
Construction
Healthcare/medical
Telecommunications
Arts/media/entertainment
Other 11%
11%
12%
14%
3%
4%
4%
6%
6%
9%
10%
10%
Figure 4. Consumers were nearly evenly split between men and women and across age groups.

9
55+21%
45-5417%
35-4424%
25-3424%
18-2414%
Female47%
Male53%
VP or equivalent9%
Executive VP or equivalent 5%
C-level executive20%
Owner or partner 11%
Manager or equivalent55%
0% 5% 10% 15%
Retail/consumer goods
Manufacturing/distribution
Business services
High tech
Government/non-profit
Financial services
Resources
Construction
Healthcare/medical
Telecommunications
Arts/media/entertainment
Other 11%
11%
12%
14%
3%
4%
4%
6%
6%
9%
10%
10%
Figure 5. Enterprise customer respondents were manager level or above.
55+21%
45-5417%
35-4424%
25-3424%
18-2414%
Female47%
Male53%
VP or equivalent9%
Executive VP or equivalent 5%
C-level executive20%
Owner or partner 11%
Manager or equivalent55%
0% 5% 10% 15%
Retail/consumer goods
Manufacturing/distribution
Business services
High tech
Government/non-profit
Financial services
Resources
Construction
Healthcare/medical
Telecommunications
Arts/media/entertainment
Other 11%
11%
12%
14%
3%
4%
4%
6%
6%
9%
10%
10%
Figure 6. Enterprise customers represented a wide range of industries.

10
The Impact of the Downturn on Communications and High Tech Vendors
Figure 7. Vendors found customers cutting back spending in the past 12 months.
22.82%
26.20%
19.40%
23.10%
Percentage of your customer base would you estimate has reduced the amount (in terms of money spent) of business they do with you in the past 12 months
By how much, on average, would you estimate customers have reduced the amount they spend with you?
14.28%
15.60%
What percentage of your customer base would you estimate has completely stopped doing business with you in the past 12 months?
21.00% 22.00% 23.00% 24.00% 25.00% 26.00% 27.00%
Enterprises
Consumers
17% 18% 19% 20% 21% 22% 23% 24%
Enterprises
Consumers
13.5% 14.0% 14.5% 15.0% 15.5% 16.0%
Enterprises
Consumers
Percentage of their customer base that vendors estimated has reduced the amount (in terms of money spent) of business they do with them in the past 12 months.
As a result of the economic downturn, CHT vendors experienced a substantial drop in business—both with enterprise customers and with consumers. In fact, executives responding to our survey estimated that approximately one-fourth of their customers reduced their spending with them in the past 12 months, and about 15 percent stopped doing business with them completely (Figure 7). A full 53 percent of vendors said their customer churn rate increased in the past 12 months.
When asked directly, customers themselves gave similar responses: 21 percent of consumers and 26 percent of enterprise customers cut their spending on communications-related products and services in the past year. While this is a global phenomenon, there are some regional
differences: Consumers in South America (26 percent) were the most likely to cut spending, while those in Europe were the least likely (17 percent). Among enterprise customers, regional distinctions play out differently: Enterprises in Europe (31 percent) were the most likely to cut spending, while those in Asia (21 percent) and North America (22 percent) were the least likely.
This trend of reduced spending is much the same in the high-tech sector, in which 20 percent of consumers and 25 percent of enterprise customers cut spending in the past year. Similar to the regional dynamics in the communications segment, consumers in South America (29 percent) were the most likely to have cut spending on high-tech products and services,
Percentage of their customer base that vendors estimated has completely stopped doing business with them in the past 12 months.

11
while those in Europe were the least likely (16 percent). And enterprise customers in Europe (29 percent) were the most likely to have reduced spending in this area, while those in Asia (19 percent) were the least likely, also mirroring the trends observed in the communications segment.
Mobile phones and mobile phone service were cited by the largest percentage of both consumers and enterprise customers as areas in which they reduced their spending. Other areas targeted by a large percent of customers for spending cuts included Voice-over-IP phone service among consumers and a range of products among enterprise customers including television service, Web-enabled mobile phones, printers, copy machines and computers.
Why did these respondents cut their communications and high-tech spending? Both enterprise customers and consumers were most likely to cite
budget constraints or the acquisition of lower-cost replacements (Figure 8). In fact, just under half of consumers and nearly 40 percent of enterprise customers said that despite needing a product or service, they cut back or eliminated spending on it because they no longer had the budget for it.
Interestingly, enterprise customers were about twice as likely as consumers—49 percent versus 25 percent—to say they found a replacement product or service for a lower price, while consumers were twice as likely as enterprise customers to say they no longer needed the product or service. Only a small percentage of both groups of customers said they cut or eliminated spending because they were unhappy with the quality of customer support they received.
0% 20% 40% 60%
Enterprises
Consumers
I was unhappy with the quality of customer support for the product or service
I found a better quality product or service
I found a replacement product or service for a lower price
I need the product or service but no longer have the budget for the product or service
I no longer need the product or service 24%
46%
49%
38%
25%
25%
10%
10%
10%
6%
25%
22%
19%
18%
12%
29%
14%
8%
8%
11%
7%
11%
11%
11%
4%
4%
5%
3%
22%
22%
22%
21%
19%
19%
8%
3%
15%
0%
0%
10%
12%
11%
0% 10% 20% 30%
Enterprises
Consumers
It has decreased by more than 10%
It has decreased between 5% and 10%
It has decreased by less than 5%
It has increased more than 10%
It has increased between 5% and 10%
It has increased by less than 5%
It hasn’t changed
We don’t offer service contracts
0% 5% 10% 15% 20% 25%
Enterprises
Consumers
It has decreased by more than 10%
It has decreased between 5% and 10%
It has decreased by less than 5%
It has increased more than 10%
It has increased between 5% and 10%
It has increased by less than 5%
It hasn’t changed
We don’t offer service contracts
Figure 8. Budget constraints and low-cost replacements were the primary drivers of customers’ decisions to cut spending.
Reasons customers gave for having reduced or eliminated, or potentially reducing or eliminating, the amount they spend on communications and high-tech products and services
12
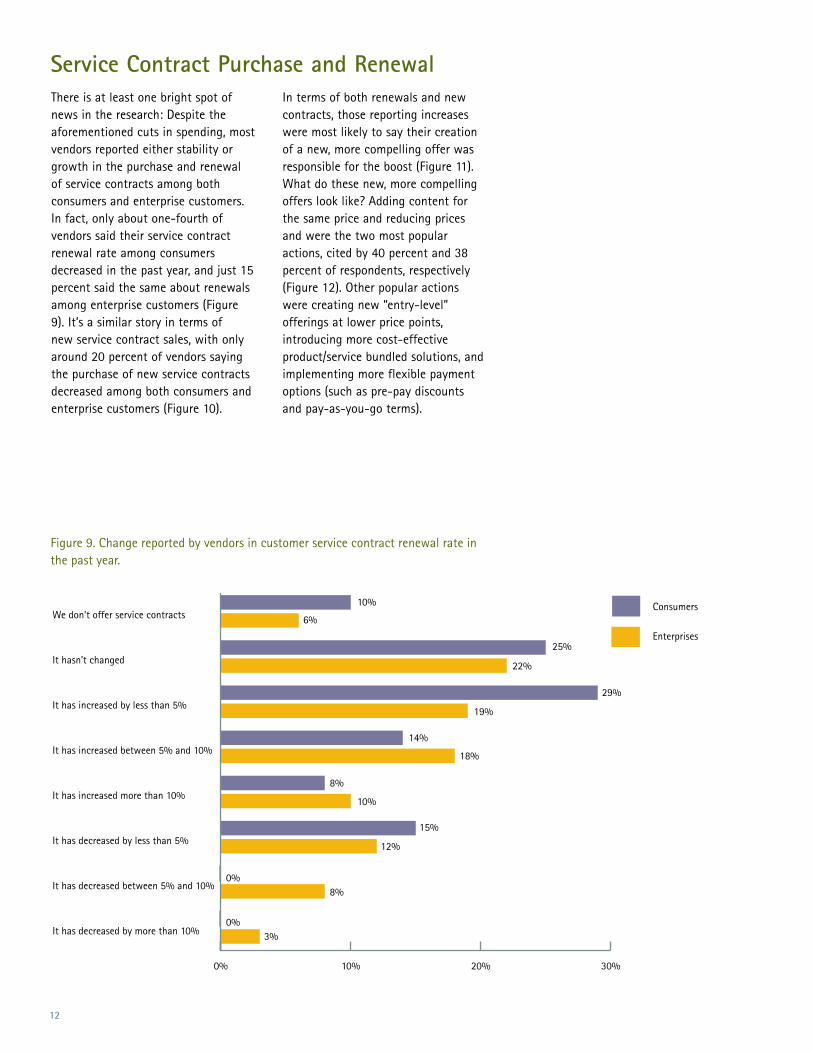
There is at least one bright spot of news in the research: Despite the aforementioned cuts in spending, most vendors reported either stability or growth in the purchase and renewal of service contracts among both consumers and enterprise customers. In fact, only about one-fourth of vendors said their service contract renewal rate among consumers decreased in the past year, and just 15 percent said the same about renewals among enterprise customers (Figure 9). It’s a similar story in terms of new service contract sales, with only around 20 percent of vendors saying the purchase of new service contracts decreased among both consumers and enterprise customers (Figure 10).
In terms of both renewals and new contracts, those reporting increases were most likely to say their creation of a new, more compelling offer was responsible for the boost (Figure 11). What do these new, more compelling offers look like? Adding content for the same price and reducing prices and were the two most popular actions, cited by 40 percent and 38 percent of respondents, respectively (Figure 12). Other popular actions were creating new “entry-level” offerings at lower price points, introducing more cost-effective product/service bundled solutions, and implementing more flexible payment options (such as pre-pay discounts and pay-as-you-go terms).
Service Contract Purchase and Renewal
Figure 9. Change reported by vendors in customer service contract renewal rate in the past year.
0% 20% 40% 60%
Enterprises
Consumers
I was unhappy with the quality of customer support for the product or service
I found a better quality product or service
I found a replacement product or service for a lower price
I need the product or service but no longer have the budget for the product or service
I no longer need the product or service 24%
46%
49%
38%
25%
25%
10%
10%
10%
6%
25%
22%
19%
18%
12%
29%
14%
8%
8%
11%
7%
11%
11%
11%
4%
4%
5%
3%
22%
22%
22%
21%
19%
19%
8%
3%
15%
0%
0%
10%
12%
11%
0% 10% 20% 30%
Enterprises
Consumers
It has decreased by more than 10%
It has decreased between 5% and 10%
It has decreased by less than 5%
It has increased more than 10%
It has increased between 5% and 10%
It has increased by less than 5%
It hasn’t changed
We don’t offer service contracts
0% 5% 10% 15% 20% 25%
Enterprises
Consumers
It has decreased by more than 10%
It has decreased between 5% and 10%
It has decreased by less than 5%
It has increased more than 10%
It has increased between 5% and 10%
It has increased by less than 5%
It hasn’t changed
We don’t offer service contracts

13
Figure 10. Change reported by vendors in the sale of new customer service contracts in the past year.
0% 20% 40% 60%
Enterprises
Consumers
I was unhappy with the quality of customer support for the product or service
I found a better quality product or service
I found a replacement product or service for a lower price
I need the product or service but no longer have the budget for the product or service
I no longer need the product or service 24%
46%
49%
38%
25%
25%
10%
10%
10%
6%
25%
22%
19%
18%
12%
29%
14%
8%
8%
11%
7%
11%
11%
11%
4%
4%
5%
3%
22%
22%
22%
21%
19%
19%
8%
3%
15%
0%
0%
10%
12%
11%
0% 10% 20% 30%
Enterprises
Consumers
It has decreased by more than 10%
It has decreased between 5% and 10%
It has decreased by less than 5%
It has increased more than 10%
It has increased between 5% and 10%
It has increased by less than 5%
It hasn’t changed
We don’t offer service contracts
0% 5% 10% 15% 20% 25%
Enterprises
Consumers
It has decreased by more than 10%
It has decreased between 5% and 10%
It has decreased by less than 5%
It has increased more than 10%
It has increased between 5% and 10%
It has increased by less than 5%
It hasn’t changed
We don’t offer service contracts
In addition, just under 30 percent of vendors said they eliminated or relaxed requirements for contract commitments or developed special price incentives (such as offering rebates or waiving installation fees) to encourage customers to purchase or renew services. Another one-quarter of respondents reported increasing the quality of the service and support they offer, or lowering requirements to achieve higher levels of customer status, thus enhancing service and support. In contrast, only 15 percent said they tried to boost sales of service contracts by changing their marketing messages or the image of their services.
Conversely, vendors reporting decreases in contract sales and renewals cited different causes for these outcomes: Most often, they said that although customers needed the service contracts, they no longer could afford them. An additional 20 percent of vendors said their rates dropped because customers found a replacement service for a lower price.

14
Figure 11. The creation of a new, more compelling offer was the leading reason why customers opted to buy or renew service contracts.
0% 10% 20% 30% 40%
We created a new, more compelling offer
Customers need the service but no longer have the budget for the service
Customers found a replacement service for a lower price
Customers found a better quality service
Customers no longer need the service
Customers were unhappy with the quality of customer support for the product or service
Customers decided to take ownership of service activities themselves
0% 10% 20% 30% 40%
We created a new, more compelling offer
Customers need the service but no longerhave the budget for the service
Customers found a replacement service for a lower price
Customers found a better quality service
Customers no longer need the service
Customers were unhappy with the quality ofcustomer support for the product or service
Customers decided to take ownership of service activities themselves
3%
2%
3%
4%
10%
20%
28%
31%
5%
5%
9%
16%
27%
33%
0% 10% 20% 30% 40%
We created a new, more compelling offer
Customers need the service but no longer have the budget for the service
Customers found a replacement service for a lower price
Customers found a better quality service
Customers no longer need the service
Customers were unhappy with the quality of customer support for the product or service
Customers decided to take ownership of service activities themselves
0% 10% 20% 30% 40%
We created a new, more compelling offer
Customers need the service but no longerhave the budget for the service
Customers found a replacement service for a lower price
Customers found a better quality service
Customers no longer need the service
Customers were unhappy with the quality ofcustomer support for the product or service
Customers decided to take ownership of service activities themselves
3%
2%
3%
4%
10%
20%
28%
31%
5%
5%
9%
16%
27%
33%
Reasons vendors cited for their change in service contract renewal rate
Reasons vendors cited for the change in their new service contract sales

15
Figure 12. Actions vendors said they took to maintain or increase their service contract sales during the downturn.
0% 10% 20% 30% 40%
Added content to existing services for the same price
Reduced prices on existing services
Created new “entry-level” offerings at a lower price point
Introduced more cost-effective product/service bundled solutions
Implemented more flexible payment options (e.g., pre-pay discounts, pay-as-you-go, etc.)
Eliminated or relaxed requirements for contract commitments
Developed price incentives (e.g., rebates, waiving of installation fees) to encourage customers to purchase or renew services
Increased quality of service and support across the board
Lowered requirements to achieve higher levels of customer status for enhanced service and support
Changed marketing messages / image of services 15%
22%
26%
28%
28%
31%
33%
35%
38%
40%
They’re somewhat less important - 3%
They’re much less important - 0%
They’re much more important41%
They’re somewhat more important28%
They’re equally important in a downturn and during times of growth 28%
Extremely important46%
Somewhat important50%
Not at all important 4%

16
Vendors believe not only that service and support is more important during a downturn, but also that they needed to continue to invest in service and support capabilities even in difficult times to encourage customers to continue to do business with them.
In fact, a plurality—41 percent—of vendor executives said service and support is much more important during a downturn than in times of robust growth, and no respondents believed service and support is much less important (Figure 13). Given this, it’s not surprising that virtually all respondents said it is important to their business to invest in service and support during a downturn. Of those, 46 percent indicated it is extremely important (Figure 13).
Vendors also appear to be “walking the talk,” making a variety of investments or acquisitions during the downturn to improve their service
and support capabilities. In fact, six in 10 respondents said they took such action (Figure 14). The most common type of investment or acquisition involved purchasing or merging with another business that has superior customer service operations, cited by about two in 10 respondents. The second-most common action was investing to build or improve the company’s Web support portal, while just under 15 percent of companies reported they made business process improvements or created better knowledge management capabilities to improve service and support. Surprisingly, only 3 percent of respondents invested in service analytics or operational reporting—capabilities that can enable a deeper understanding of service quality and more tailored interactions that match the preferences of specific customers or customer segments (Figure 14).
Investments in Service and Support Capabilities
Figure 13. Vendors believe in the value of customer service and support, especially during a downturn.
0% 10% 20% 30% 40%
Added content to existing services for the same price
Reduced prices on existing services
Created new “entry-level” offerings at a lower price point
Introduced more cost-effective product/service bundled solutions
Implemented more flexible payment options (e.g., pre-pay discounts, pay-as-you-go, etc.)
Eliminated or relaxed requirements for contract commitments
Developed price incentives (e.g., rebates, waiving of installation fees) to encourage customers to purchase or renew services
Increased quality of service and support across the board
Lowered requirements to achieve higher levels of customer status for enhanced service and support
Changed marketing messages / image of services 15%
22%
26%
28%
28%
31%
33%
35%
38%
40%
They’re somewhat less important - 3%
They’re much less important - 0%
They’re much more important41%
They’re somewhat more important28%
They’re equally important in a downturn and during times of growth 28%
Extremely important46%
Somewhat important50%
Not at all important 4%
Percentage of vendors saying superior customer service and support capabilities are more critical in a downturn than in times of robust growth
Percentage of vendors indicating how important it is to their business to invest in customer service and support capabilities in the downturn

17
Figure 14. Vendors made a variety of investments or acquisitions during the downturn to improve their service and support capabilities.
0% 10% 20% 30% 40% 50% 60% 70% 80%
Increased
Decreased
Knowledge management
Online service portal
Contact center
Warranty management
Field service workforce
Spare parts inventory management
Don't know7%
No
32%Yes
61%
0% 5% 10% 15% 20%
Merging with or acquiring another business with superior customer service operations
Web support portal
Business process improvements
Knowledge management
New service offers
Service organizational improvements
Case management
Service employee education
Service analytics / operational reporting
Remote monitoring / proactive services
Outsourcing of service capability 1%
40%
60%
63%
67%
70%
72%
75%
37%
30%
33%
28%
25%
3%
3%
5%
7%
10%
11%
13%
15%
19%
13%
Percentage of vendors saying they are making investments or acquisitions in the downturn to increase their customer service capability
Types of investments or acquisitions vendors are making to improve their service and support capabilities.
0% 10% 20% 30% 40% 50% 60% 70% 80%
Increased
Decreased
Knowledge management
Online service portal
Contact center
Warranty management
Field service workforce
Spare parts inventory management
Don't know7%
No
32%Yes
61%
0% 5% 10% 15% 20%
Merging with or acquiring another business with superior customer service operations
Web support portal
Business process improvements
Knowledge management
New service offers
Service organizational improvements
Case management
Service employee education
Service analytics / operational reporting
Remote monitoring / proactive services
Outsourcing of service capability 1%
40%
60%
63%
67%
70%
72%
75%
37%
30%
33%
28%
25%
3%
3%
5%
7%
10%
11%
13%
15%
19%
13%

18
Figure 15. Areas of customer service and support in which vendors said they made cost changes and the nature of the change.
0% 10% 20% 30% 40% 50% 60% 70% 80%
Increased
Decreased
Knowledge management
Online service portal
Contact center
Warranty management
Field service workforce
Spare parts inventory management
Don't know7%
No
32%Yes
61%
0% 5% 10% 15% 20%
Merging with or acquiring another business with superior customer service operations
Web support portal
Business process improvements
Knowledge management
New service offers
Service organizational improvements
Case management
Service employee education
Service analytics / operational reporting
Remote monitoring / proactive services
Outsourcing of service capability 1%
40%
60%
63%
67%
70%
72%
75%
37%
30%
33%
28%
25%
3%
3%
5%
7%
10%
11%
13%
15%
19%
13%
Such investments likely are responsible for the fact that vendors overwhelmingly reported increased costs in all key areas of service and support. Rising costs were most especially associated with companies’ knowledge management, online service portals, warranty management, and, to a lesser extent, contact center, field service workforce and spare parts inventory management (Figure 15).
Yet as they consider whether to invest or reduce costs in key areas of service and support, most companies are not using advanced analytical tools to determine which cost changes would generate the greatest rate of investment (ROI). Indeed, as shown in Figure 16, only 18 percent of respondents said they use advanced
tools that enable them to target cost changes in areas that will have the greatest return on investment for their most valuable customers. The largest percentage of vendors—36 percent—reported they typically focus cost-change efforts on areas in which the company is underspending or overspending the most. Only a very small percentage of respondents said they generally implement across-the-board changes in operating costs.

19
Figure 16. The extent to which vendors take an analytical approach to changing customer service and support costs.
0% 10% 20% 30% 40%
5 - We use advanced tools that enable us to target cost changes in areas that will have the greatest return on investment for our most valuable customers
3 - We typically focus cost-change efforts on areas in which we are underspending or overspending the most money
1 - We generally implement across-the-board changes in operating costs
2
6%
10%
36%
30%
18%
4
Don't know 1%
No impact11%
Positive80%
Negative8%
0%
10%
20%
30%
40%
50%
1- Not well at all 2 3 4 5- Extremely well
1%5%
27%
45%
22%

20
Regardless of whether they increased or reduced their spending on service and support, most vendors think the results have been positive and that they do a good job balancing cost-to-serve and the experience delivered. In fact, eight in 10 respondents said the actions they have taken resulted in a positive impact on the overall customer service and support experience, while just 8 percent believe the impact has been negative (Figure 17). At the same time, when asked how effectively they balance an attractive and relevant service experience with cost-to-serve, approximately two-thirds said well or extremely well (Figure 18).
Customers, however, don’t agree. An overwhelming majority said they either noticed no difference in the service and support experience delivered by their CHT vendors or saw degradations in that experience. In fact, just 17 percent of enterprise customers and 8 percent of consumers said they thought the
service and support experience delivered by their vendors improved somewhat during the downturn. Only 3 percent of the former and 1 percent of the latter said the experience improved considerably (Figure 19).
This gap should concern vendors, given that the quality of the service and support experience has direct implications for customers’ willingness to continue doing business with vendors during the downturn. Our survey shows that a large majority of customers (92 percent of enterprises and 81 percent of consumers) who think the service and support experience delivered by their vendors improved said they are more likely to keep doing business with those companies (Figure 20). Similarly, just under 60 percent of both consumers and enterprise customers who think the service and support experience degraded are more likely to eliminate or reduce the amount of business they do with those companies (Figure 21).
Figure 17. Vendors’ view of the nature of the impact of cost changes on the overall service and support experience they deliver to customers.
0% 10% 20% 30% 40%
5 - We use advanced tools that enable us to target cost changes in areas that will have the greatest return on investment for our most valuable customers
3 - We typically focus cost-change efforts on areas in which we are underspending or overspending the most money
1 - We generally implement across-the-board changes in operating costs
2
6%
10%
36%
30%
18%
4
Don't know 1%
No impact11%
Positive80%
Negative8%
0%
10%
20%
30%
40%
50%
1- Not well at all 2 3 4 5- Extremely well
1%5%
27%
45%
22%
The Vendor-Customer Relationship

21
Figure 18. How well vendors felt they balance providing an attractive and relevant service experience with the cost to deliver that experience.
0% 10% 20% 30% 40%
5 - We use advanced tools that enable us to target cost changes in areas that will have the greatest return on investment for our most valuable customers
3 - We typically focus cost-change efforts on areas in which we are underspending or overspending the most money
1 - We generally implement across-the-board changes in operating costs
2
6%
10%
36%
30%
18%
4
Don't know 1%
No impact11%
Positive80%
Negative8%
0%
10%
20%
30%
40%
50%
1- Not well at all 2 3 4 5- Extremely well
1%5%
27%
45%
22%
Figure 19. Customers’ perceptions of the change in the service and support experience delivered by their CHT vendors during the downturn.
0% 10% 20% 30% 40% 50% 60% 70%
Enterprises
Consumers
Improved considerably
Improved somewhat
About the same
Degraded somewhat
Degraded considerably
7%
81%
92%
19%
9%
8%
4%
3%
16%
17%
20%
67%
55%
1%
0%
20%
40%
60%
80%
100%
Enterprises
Consumers
NoYes
0%
10%
20%
30%
40%
50%
60%
Enterprises
Consumers
NoYes
59%
41% 41%
59%

22
Figure 20. A large majority of customers who think the service and support experience improved said they are more likely to keep doing business with those companies.
0% 10% 20% 30% 40% 50% 60% 70%
Enterprises
Consumers
Improved considerably
Improved somewhat
About the same
Degraded somewhat
Degraded considerably
7%
81%
92%
19%
9%
8%
4%
3%
16%
17%
20%
67%
55%
1%
0%
20%
40%
60%
80%
100%
Enterprises
Consumers
NoYes
0%
10%
20%
30%
40%
50%
60%
Enterprises
Consumers
NoYes
59%
41% 41%
59%
Another finding that should concern vendors is the extent to which customers—especially consumers—question whether their vendors appreciate them and are aware of vendors’ efforts to communicate with them. In fact, our research reveals that the relationship between communications and high-tech vendors and their customers—especially consumers—appears tenuous.
Indeed, while 84 percent of enterprise customers thought their vendors valued their business (Figure 22), only about one-fourth of these customers said they were very loyal to these vendors (Figure 23). From a geographic standpoint, North American enterprises were the most likely to feel valued (92 percent), as well as to indicate they were either very or somewhat loyal to their communications (93 percent) and high-tech (92 percent) vendors. In contrast, European enterprise customers were the least likely to
express loyalty to their vendors (66 percent of communications and 64 percent for high-tech vendors).
Among consumers, the situation is much worse. Just 40 percent thought their business was valued (and about the same percentage said they didn’t know) (Figure 22) and less than 20 percent said they were very loyal to their communications and high-tech vendors (Figure 23). Like their business counterparts, North American consumers also were the most likely to feel their communications and high-tech vendors valued their business (53 percent) and to express being somewhat or very loyal to communications (70 percent) and high-tech vendors (67 percent). European consumers were the least likely (34 percent) to believe their vendors valued their business and to express loyalty to high-tech vendors (51 percent), while Asian consumers were the least likely to feel loyal to communications providers (56 percent).

23
Figure 21. A majority of customers who think the service and support experience degraded are more likely to eliminate or reduce the amount of business they do with those companies.
0% 10% 20% 30% 40% 50% 60% 70%
Enterprises
Consumers
Improved considerably
Improved somewhat
About the same
Degraded somewhat
Degraded considerably
7%
81%
92%
19%
9%
8%
4%
3%
16%
17%
20%
67%
55%
1%
0%
20%
40%
60%
80%
100%
Enterprises
Consumers
NoYes
0%
10%
20%
30%
40%
50%
60%
Enterprises
Consumers
NoYes
59%
41% 41%
59%
Figure 22. Most consumers questioned whether their vendors truly value their business.
0% 20% 40% 60% 80% 100%
Enterprises
Consumers
Don't know
No
Yes
40%
18%
13%
25%
44%47%
36%
27%
6%
24%
42%
51%
24%
1%
1%
34%
5%
84%
6%
10%
21%
38%
0%
10%
20%
30%
40%
50%
60%
Enterprises
Consumers
Not at allNeutralSomewhatVery
0%
10%
20%
30%
40%
50%
60%
Enterprises
Consumers
Not at allNeutralSomewhatVery

24
Figure 23. Strong loyalty to providers of communications and high-tech products and services is rare among both consumers and enterprise customers.
0% 20% 40% 60% 80% 100%
Enterprises
Consumers
Don't know
No
Yes
40%
18%
13%
25%
44%47%
36%
27%
6%
24%
42%
51%
24%
1%
1%
34%
5%
84%
6%
10%
21%
38%
0%
10%
20%
30%
40%
50%
60%
Enterprises
Consumers
Not at allNeutralSomewhatVery
0%
10%
20%
30%
40%
50%
60%
Enterprises
Consumers
Not at allNeutralSomewhatVery
How loyal would you say you are to your current providers of communications products and services?
How loyal would you say you are to your current providers of high-tech products and services?

25
Part of the reason for the sense among consumers that their business is not valued could be a lack of communication from providers. We asked both groups of customers whether they had received information from their communications and high-tech providers on how the economic downturn affected them and their product/service offerings, and what the downturn meant for customers. Enterprise customers were far more likely than consumers to have been sent such information, with 83 percent saying they had received either extensive or limited information, compared with just 35 percent of consumers. In fact, a full 65 percent of consumers indicated they had not received such information from their providers (Figure 24).
This situation is less severe in Asia, where consumers were by far the most likely to have received such information from their vendors (51 percent)—either limited or extensive—while those in North America were the least likely (23 percent). Asian enterprise customers also were the most likely to say they had received such information from their vendors (91 percent), followed closely by their counterparts in North America (90 percent). Enterprises in Europe were the least likely (72 percent).
Another important piece of information is how the relationship between customers and providers must change in light of new circumstances. On a global basis, enterprise customers were more likely than consumers to be aware of offers from their vendors designed to change, simplify or reduce the cost of their relationship with them. In fact, 41 percent of the former, compared with 27 percent of the latter, said they were aware of such offers (Figure 25). Of all groups surveyed, North American consumers appeared to be the most in the dark, with just 12 percent aware of offers from their vendors (compared with 36 percent of Europeans). Among enterprise customers, Asians were the most likely to be aware of vendors’ offers (57 percent) and Europeans the least (32 percent).
Interestingly, however, customers did not appear to enthusiastically embrace the offers they did learn about. Only 29 percent of enterprise customers and just 18 percent of consumers indicated they accepted their vendors’ offers. Both Asian enterprise customers (46 percent) and consumers (27 percent) were the most likely to say they accepted vendors’ offers. North American consumers (6 percent) and European enterprise customers (18 percent) were the least likely. However, no matter their location, email and providers’ online service portals were the two most common ways all customers and consumers learned about providers’ offers.

26
Figure 24. Customers do not believe their vendors communicated extensively with them about the downturn and its impact on them.
Figure 25. Most customers said they were not aware of offers from their vendors to change, simplify or reduce the cost of their relationship with those providers.
0% 20% 40% 60% 80%
Enterprises
Consumers
No
Yes, but limited information
Yes, extensive information
12%
27%
32%
13%
12%
7%
41%
59%
73%
17%
34%
49%
23%
65%
0% 20% 40% 60% 80%
Enterprises
Consumers
No
Yes
0% 10% 20% 30% 40%
Neutral/Not Loyal Consumers
Very Loyal Consumers
Neutral/Not Loyal Enterprise Customers
Very Loyal Enterprise Customers
0% 20% 40% 60% 80%
Enterprises
Consumers
No
Yes, but limited information
Yes, extensive information
12%
27%
32%
13%
12%
7%
41%
59%
73%
17%
34%
49%
23%
65%
0% 20% 40% 60% 80%
Enterprises
Consumers
No
Yes
0% 10% 20% 30% 40%
Neutral/Not Loyal Consumers
Very Loyal Consumers
Neutral/Not Loyal Enterprise Customers
Very Loyal Enterprise Customers

27
To understand the connection between loyalty and service, we compared the responses of enterprise customers and consumers who described themselves as very loyal with responses from those who said they were either neutral or not at all loyal. This analysis resulted in some intriguing findings, which suggest more loyal customers may be so because they have received improved service and better information.
For example, very loyal enterprise customers were much more likely than their neutral or not-loyal counterparts to say the customer service and support experience delivered by their vendors improved either somewhat or considerably during the downturn
(Figure 26), and to be aware of offers their vendors had made to change, simplify or reduce the cost of their relationships with customers (Figure 27).
Furthermore, very loyal enterprise customers were nearly five times more likely to say they received extensive information from their communications and high-tech providers on how the economic downturn affected them and their product/service offerings and what the downturn means for customers (Figure 28), and were also more likely to say they believed vendors valued their business (Figure 29).
The Value of Loyalty and Its Connection to Service
Figure 26. Percentage of customers who believed the service and support experience delivered by their communications and high-tech vendors improved either somewhat or considerably during the downturn.
0% 20% 40% 60% 80%
Enterprises
Consumers
No
Yes, but limited information
Yes, extensive information
12%
27%
32%
13%
12%
7%
41%
59%
73%
17%
34%
49%
23%
65%
0% 20% 40% 60% 80%
Enterprises
Consumers
No
Yes
0% 10% 20% 30% 40%
Neutral/Not Loyal Consumers
Very Loyal Consumers
Neutral/Not Loyal Enterprise Customers
Very Loyal Enterprise Customers

28
A similar pattern was seen in responses among consumers, although the gaps between the loyal and neutral/not-loyal groups were not consistently as large (and consumers, in general, were less positive about their vendors than enterprise customers). For instance, very loyal consumers were twice as likely to be aware of offers their vendors had made to change, simplify or reduce the cost of their relationship with customers (Figure 27). They were also nearly twice as likely to say the customer service and support experience delivered by their vendors improved either somewhat or considerably during the downturn (although the percentage of very loyal consumers saying the experience improved was low) (Figure 26). In addition, very loyal consumers were five times as likely to say they received extensive information from
their communications and high-tech providers on how the economic downturn affected them and their product/service offerings and what the downturn means for customers (Figure 28). Finally, they were more than twice as likely to believe their vendors valued their business (Figure 29).
Such loyalty is vital, especially during a downturn, to keeping customers’ business—a fact that was reinforced by our research. For instance, we found that customers (especially enterprise customers) who described themselves as very loyal to providers overall were generally less likely than those who were neutral or not at all loyal to have cut spending on communications and high-tech products and services in the past 12 months—and are more likely to increase spending in the next 12 months.
Figure 27. Percentage of customers who were aware of offers their communications and high-tech vendors made to change, simplify or reduce the cost of their relationships.
0% 20% 40% 60%
Neutral/Not-Loyal Consumers
Very Loyal Consumers
Neutral/Not-Loyal Enterprise Customers
Very Loyal Enterprise Customers
0% 20% 40% 60%
Neutral/Not-Loyal Consumers
Very Loyal Consumers
Neutral/Not-Loyal Enterprise Customers
Very Loyal Enterprise Customers
0% 20% 40% 60% 80% 100%
Neutral/Not-Loyal Consumers
Very Loyal Consumers
Neutral/Not-Loyal Enterprise Customers
Very Loyal Enterprise Customers
51%
94%
67%
65%
27%
56%
40%
19%
13%
25%
25%
5%

29
Figure 29. Percentage of customers who believe their vendors value their business.
0% 20% 40% 60%
Neutral/Not-Loyal Consumers
Very Loyal Consumers
Neutral/Not-Loyal Enterprise Customers
Very Loyal Enterprise Customers
0% 20% 40% 60%
Neutral/Not-Loyal Consumers
Very Loyal Consumers
Neutral/Not-Loyal Enterprise Customers
Very Loyal Enterprise Customers
0% 20% 40% 60% 80% 100%
Neutral/Not-Loyal Consumers
Very Loyal Consumers
Neutral/Not-Loyal Enterprise Customers
Very Loyal Enterprise Customers
51%
94%
67%
65%
27%
56%
40%
19%
13%
25%
25%
5%
Figure 28. Percentage of customers who received extensive information from their communications and high-tech providers on how the economic downturn affected them and their offerings.
0% 20% 40% 60%
Neutral/Not-Loyal Consumers
Very Loyal Consumers
Neutral/Not-Loyal Enterprise Customers
Very Loyal Enterprise Customers
0% 20% 40% 60%
Neutral/Not-Loyal Consumers
Very Loyal Consumers
Neutral/Not-Loyal Enterprise Customers
Very Loyal Enterprise Customers
0% 20% 40% 60% 80% 100%
Neutral/Not-Loyal Consumers
Very Loyal Consumers
Neutral/Not-Loyal Enterprise Customers
Very Loyal Enterprise Customers
51%
94%
67%
65%
27%
56%
40%
19%
13%
25%
25%
5%

30
As Figure 30 shows, only around 15 percent of very loyal consumers and enterprise customers said they decreased spending on communications products or services in the past year. Loyalty appears to be especially influential among enterprise customers: Those describing themselves as not at all loyal were twice as likely as very loyal enterprise customers to have decreased spending. The same basic pattern holds true when it comes to spending on high-tech products and services (Figure 31).
Going forward, vendors can count on their most loyal customers to lead the way back to growth. As Figures 32 and 33 illustrate, very loyal consumers and enterprise customers are more likely—in some cases, much more likely—than their neutral/not-loyal counterparts to be planning to increase spending on communications and high-tech products and services in the near future.
We also found that loyalty appears to make customers more open to vendors’ offers (Figure 34). Indeed, when asked if they accepted their providers’ offers to change, simplify or reduce the cost of their relationship, 42 percent of very loyal enterprise customers said “yes” (compared with 20 percent of neutral/not-loyal enterprise customers). Among consumers, the gap was about the same, even though a smaller percentage of both groups said they accepted vendors’ offers.
Figure 30. Percentage of customers who have decreased their spending with communications providers in the past 12 months.
0% 5% 10% 15% 20% 25% 30%
Neutral/Not-Loyal Consumers
Very Loyal Consumers
Neutral/Not-Loyal Enterprise Customers
Very Loyal Enterprise Customers
0% 5% 10% 15% 20% 25%
Neutral/Not-Loyal Consumers
Very Loyal Consumers
Neutral/Not-Loyal Enterprise Customers
Very Loyal Enterprise Customers
0% 5% 10% 15% 20% 25% 30% 35% 40%
Neutral/Not-Loyal Consumers
Very Loyal Consumers
Neutral/Not-Loyal Enterprise Customers
Very Loyal Enterprise Customers
17%
17%
38%
17%
15%
30%
17%
16%
22%
24%
7%
21%

31
Figure 32. Percentage of customers who plan to increase their spending with communications providers in the next 12 months.
0% 5% 10% 15% 20% 25% 30%
Neutral/Not-Loyal Consumers
Very Loyal Consumers
Neutral/Not-Loyal Enterprise Customers
Very Loyal Enterprise Customers
0% 5% 10% 15% 20% 25%
Neutral/Not-Loyal Consumers
Very Loyal Consumers
Neutral/Not-Loyal Enterprise Customers
Very Loyal Enterprise Customers
0% 5% 10% 15% 20% 25% 30% 35% 40%
Neutral/Not-Loyal Consumers
Very Loyal Consumers
Neutral/Not-Loyal Enterprise Customers
Very Loyal Enterprise Customers
17%
17%
38%
17%
15%
30%
17%
16%
22%
24%
7%
21%
Figure 31. Percentage of customers who have decreased their spending with high-tech providers in the past 12 months.
0% 5% 10% 15% 20% 25% 30%
Neutral/Not-Loyal Consumers
Very Loyal Consumers
Neutral/Not-Loyal Enterprise Customers
Very Loyal Enterprise Customers
0% 5% 10% 15% 20% 25%
Neutral/Not-Loyal Consumers
Very Loyal Consumers
Neutral/Not-Loyal Enterprise Customers
Very Loyal Enterprise Customers
0% 5% 10% 15% 20% 25% 30% 35% 40%
Neutral/Not-Loyal Consumers
Very Loyal Consumers
Neutral/Not-Loyal Enterprise Customers
Very Loyal Enterprise Customers
17%
17%
38%
17%
15%
30%
17%
16%
22%
24%
7%
21%

32
Figure 33. Percentage of customers who plan to increase their spending with high-tech providers in the next 12 months.
Figure 34. Percentage of customers who accepted offers their communications and high-tech vendors made to change, simplify or reduce the cost of their relationship.
0% 10% 20% 30% 40% 50%
Neutral/Not-Loyal Consumers
Very Loyal Consumers
Neutral/Not-Loyal Enterprise Customers
Very Loyal Enterprise Customers
0% 10% 20% 30% 40% 50%
Neutral/Not-Loyal Consumers
Very Loyal Consumers
Neutral/Not-Loyal Enterprise Customers
Very Loyal Enterprise Customers 42%
30%
23%
42%
28%
6%
20%
11%
0% 10% 20% 30% 40% 50%
Neutral/Not-Loyal Consumers
Very Loyal Consumers
Neutral/Not-Loyal Enterprise Customers
Very Loyal Enterprise Customers
0% 10% 20% 30% 40% 50%
Neutral/Not-Loyal Consumers
Very Loyal Consumers
Neutral/Not-Loyal Enterprise Customers
Very Loyal Enterprise Customers 42%
30%
23%
42%
28%
6%
20%
11%

33
With the worst of the economic downturn apparently behind us, most areas of the world are beginning to turn their attention again toward growth. But as they prepare for the upturn, communications and high-tech companies should remember the lessons learned in the past 12 months, as related by Accenture’s research.
For instance, our research indicates that while enterprises and consumers were switching suppliers for the products they need, or were halting purchases of new products entirely, primarily because of affordability/budget constraints, few ceased to renew or buy new service contracts for their high-tech gear. This finding clearly demonstrates the resilience of service and the opportunity vendors have to leverage service and support as a competitive differentiator.
To their credit, vendors recognized this, and continued to invest in service transformation, often to the exclusion of much else, during the downturn. Whether they were merging with or acquiring another business with superior customer service operations, enhancing their Web support portal or making improvements in their business processes, communications and high-tech vendors were taking action to strengthen their customer service and support, even at a time when conserving cash was at the top of virtually every organization’s agenda.
Our research also highlights the value of effectively communicating with customers, especially during a downturn. While vendors said they increased the frequency of communication with customers during the downturn, most customers—especially consumers—were not aware of receiving such communications.
Conclusion

34
Perhaps as a result, many consumers questioned whether vendors really valued their business. Vendors seeking more effective communications should make social media a much bigger part of their service and support activities. By leveraging the power of these tools to intimately connect with customers—especially consumers, with whom vendors often do not have a direct relationship—they can start and maintain a dialogue that helps foster loyalty. This is especially critical because our research showed that only a small percentage of customers described themselves as very loyal to their consumer electronics and communications providers.
Our findings in this study reinforce the results of another Accenture study, which found that poor service drives consumers, especially those in emerging markets, to switch providers.1 That study was based on an online survey of more than 5,000 consumers across 12 countries. It found that 87 percent of consumers surveyed in emerging markets (and 69 percent of consumers surveyed overall) switched providers in at least one industry sector because of poor service within the 12 months prior to completing the survey. It also found that 83 percent of emerging-market consumers surveyed selected a new provider primarily based on service expectations, while 74 percent of mature-market consumers surveyed cited price. And, the study discovered that the most common reasons why consumers overall become frustrated and stop doing business with a company include being left on hold too long, having to repeat the same information to multiple representatives, encountering rude or unfriendly service representatives, and dealing with representatives who could not answer their questions.
As companies around the world begin the process of determining the short- and long-term impacts on customers’ psyches and buying behavior, one thing is clear: How a customer thinks about a company after the sale—in other words, the service and support interaction—has a major effect on whether they decide to buy from that company again in the future. Thus, as they plan their strategies for the post-recession economy, communications and high-tech companies should make creating and consistently delivering a superior service and support experience one of most critical elements of their customer agenda. In doing so, they can help greatly enhance their ability to gain market share, grow more profitably and achieve high performance in a changed world.
1 Source: 2009 Accenture Customer Satisfaction Study

35

Copyright © 2010 Accenture All rights reserved.
Accenture, its logo, and High Performance Delivered are trademarks of Accenture.
About Accenture
Accenture is a global management consulting, technology services and outsourcing company, with more than 176,000 people serving clients in more than 120 countries. Combining unparalleled experience, comprehensive capabilities across all industries and business functions, and extensive research on the world’s most successful companies, Accenture collaborates with clients to help them become high-performance businesses and governments. The company generated net revenues of US$21.58 billion for the fiscal year ended Aug. 31, 2009. Its home page is www.accenture.com.
Top Related