


Languages
Pages
Legal


LEAN Analysis and
maintenance optimisation
Improving business performance
Companies facing increasing competition or otherexternal pressures frequently implementestablished methods for improving businessperformance
Three of the most commonly applied tools are:Three of the most commonly applied tools are:
o Six Sigma
o Theory of constraints
o Lean

Why did AUTOMAIN selected Lean rather thananother or a combination of all three?
Although there are similar characteristics in these techniques,key defining differences are
o Six Sigma (6s)o problem-focused, with a view that process variation is waste.
Improved performance through statistical methods (SPC)Improved performance through statistical methods (SPC)
o Theory of Constraints (ToC)o Understanding the weakest link (bottleneck) in the process chain
o Leano Elimination of all forms of waste – over processing, time, resources etc

Lean plus innovation delivers greatestbenefit
reducedopportunity
Enteron Plan Return to
normal servicepossession
maintenance process
reduced possessionopportunityfor waste
normal service
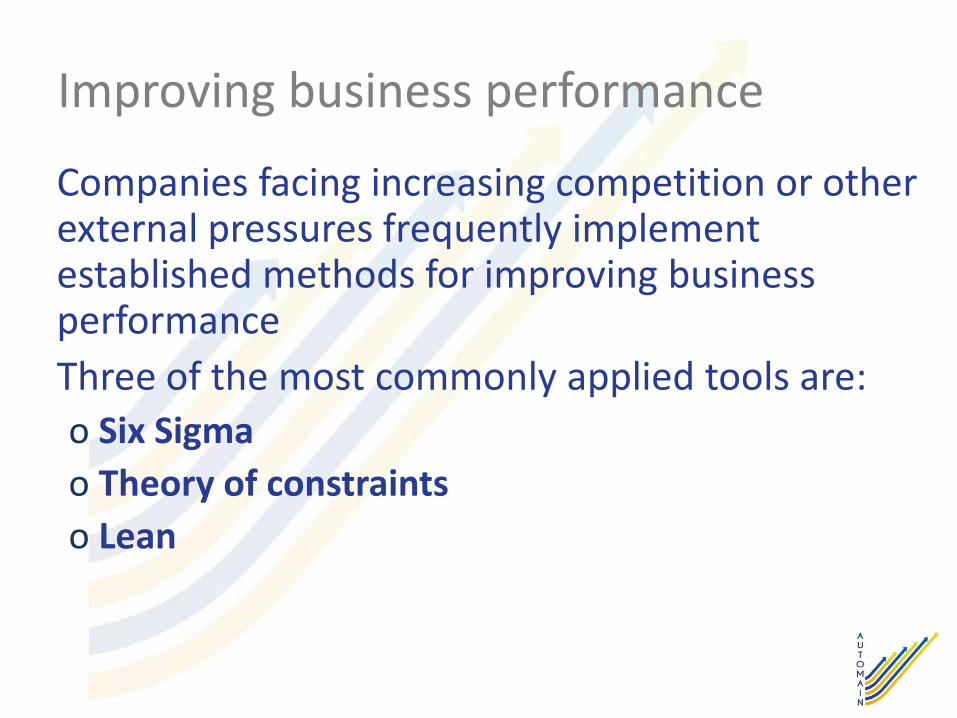
The approach
o to undertake Structured Observations of themaintenance process
o to map out the maintenance and planning processesduring Value Stream Mapping (VSM) workshops,quantification of key parameters wherever possible (theduration of the task, the manpower required, theduration of the task, the manpower required, theprobability of each step occurring right first time etc.)
o to produce a Hand Off Diagram
Lean provides an opportunity to re-connect managementwith what is happening at ground level
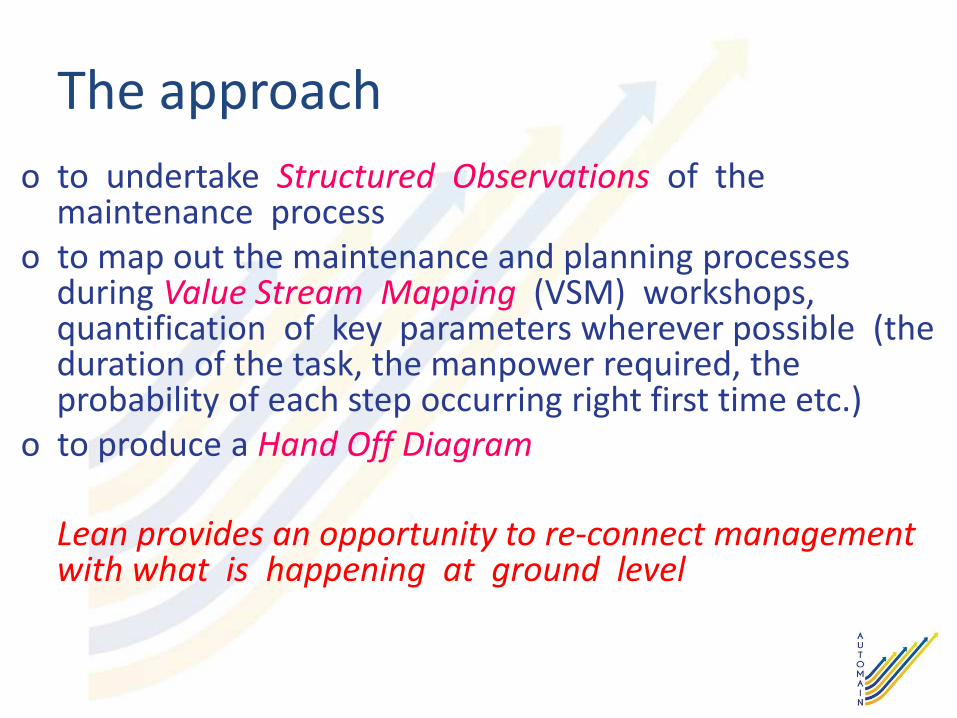
Structured Observations
Key timings and observations were recorded, and theutilisation of time was subsequently broken down into 5generic tasks:
o confirmation = confirming granting of possessiono waiting = waiting for equipment to arriveo communication = phone calls and creation of documentationo communication = phone calls and creation of documentationo tamping = carrying out the tamping activityo transportation = moving of tamping equipment to location
This information was then presented in graphical format,along with a summary of the observations made during thecourse of the visit.

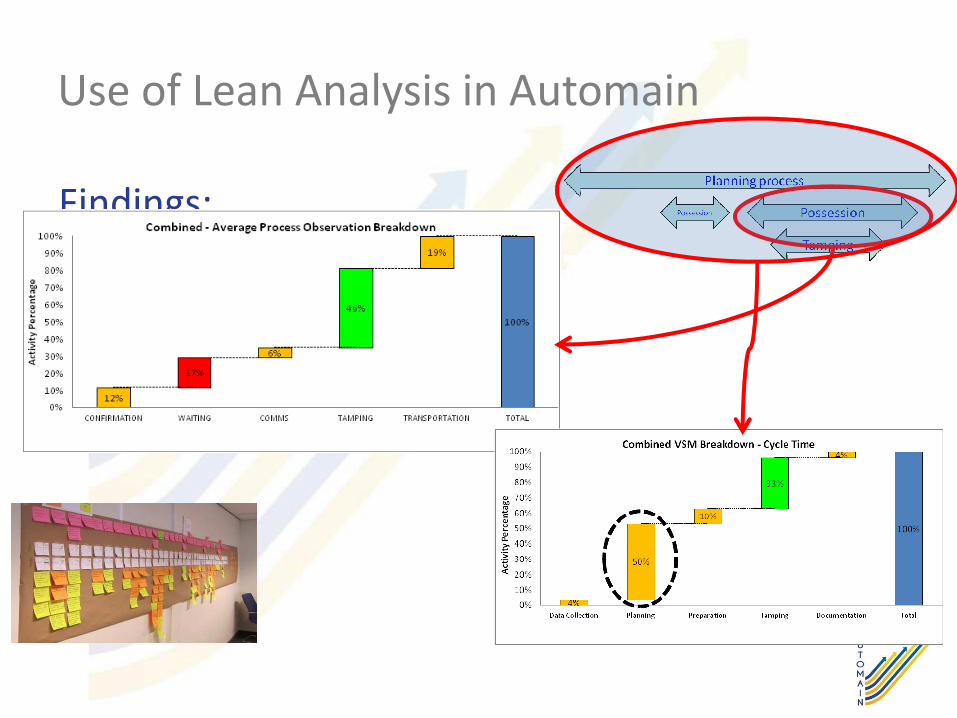
Findings – Structured Observations
Shift utilisation (how the tamping crews spent their time)o confirmation 6% to 15%o waiting 7% to 25%o communication 1% to 10%o transportation 17% to 21%o tamping 42% to 50%o tamping 42% to 50%−a recording run prior to tamping accounted for 9% of the Network Rail possession−the SNCF, Trafikverket and ProRail maintenance was targeted at specific locations within the possession, whereas the Network Railand DB maintenance was undertaken on a continuous length of track−the number of concurrent processes was different between administrations which potentially increases productivity at the cost ofextra manpower and possibility of conflicts
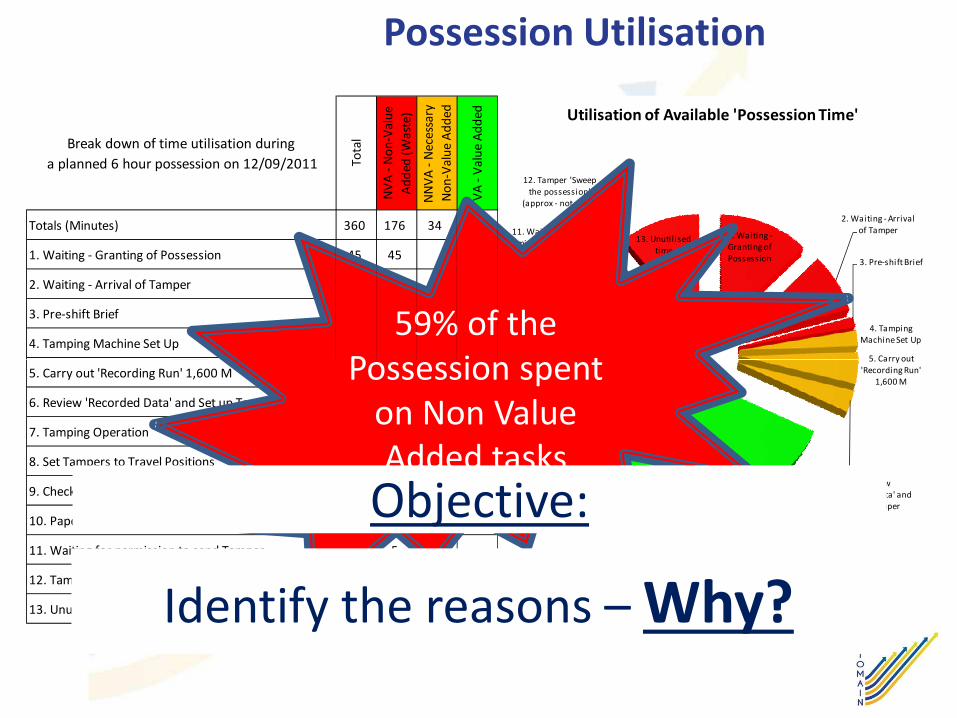
Possession Utilisation
Break down of time utilisation during
a planned 6 hour possession on 12/09/2011 Tota
l
NV
A-
No
n-V
alu
e
Ad
ded
(Was
te)
NN
VA
-N
eces
sary
No
n-V
alu
eA
dd
ed
VA
-V
alu
eA
dd
ed
Totals (Minutes) 360 176 34 150
1. Waiting - Granting of Possession 45 45
2. Waiting - Arrival of Tamper 30 30
3. Pre-shift Brief 5 5
4. Tamping Machine Set Up 8 8
1. Waiting -Granting ofPossession
2. Waiting - Arrivalof Tamper
3. Pre-shift Brief
4. TampingMachine Set Up
5. Carry out
9. Check Results ofTrack levelness
10. Paperworkand Report
Writing
11. Waiting forpermission to send
Tamper
12. Tamper 'Sweepthe possession'
(approx - not seen)
13. Unutilisedtime
Utilisation of Available 'Possession Time'
59% of thePossession spent5. Carry out 'Recording Run' 1,600 M 16 16
6. Review 'Recorded Data' and Set up Tamper 11 11
7. Tamping Operation 150 150
8. Set Tampers to Travel Positions 2 2
9. Check Results of Track levelness 'Traces' 5 5
10. Paperwork and Report Writing 13 13
11. Waiting for permission to send Tamper 5 5
12. Tamper 'Sweep the possession' (approx - not seen) 30 30
13. Unutilised time 40 40
5. Carry out'Recording Run'
1,600 M
6. Review'Recorded Data' and
Set up Tamper
7. TampingOperation
8. Set Tampers toTravel Positions
Track levelness'Traces'Possession spent
on Non ValueAdded tasks
Identify the reasons – Why?
Objective:
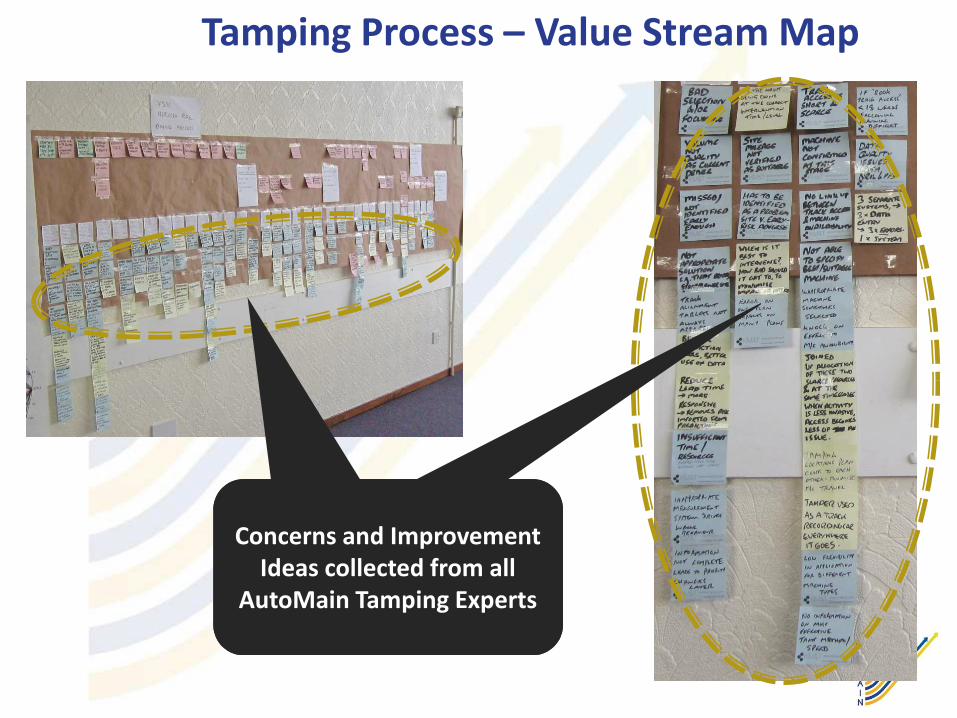
Tamping Process – Value Stream Map
Concerns and ImprovementIdeas collected from all
AutoMain Tamping Experts

Hand-Off Diagram
Tamping Process – Value Stream Map
Total 394Improvement
Value Stream Map completed for all 5Improvementopportunities
identified
Value Stream Map completed for all 5Automain Partner Organisations

Tamping Process – Opportunities Stratified
No Concern Improvement Idea Network
Rail
SNCF
Strukton
(Sweden &
Holland)
Deutsch
bahnCategory Effort Benefit Rank
114Tamper given low priority if there is an
operational incident x Standard Planning
ProceduresH L 0
115Tamper transit route sometimes blocked
by late running trains x x Problem and
CountermeasureL H 3
116Mismatched understanding of plan
between PICOP and Signaller x Training and
CommunicationL H 3
117Create access points closer to regularly
used signals x Infrastructure
DevelopmentH H 2
118Planners don't take account of location of
signals in relation to access points x Standard Planning
ProceduresL H 3
119 Auto PLB at standard blocking points x Standard OperatingL H 3OUT:119 Auto PLB at standard blocking points x Standard Operating
ProcedureL H 3
120Stop using Detonators and PLB - Use
'Signal Protection' only x Standard Operating
ProcedureL H 3
OUT:
- Categorisation- Evaluation
- Project StreamDefinition
IN:Ideas
Recorded

Tamping Process – Project Stream Definition
1. Planning Systems Development - Largest Opportunity
2. Data Systems Development
3. Standard Operations Procedures
Key Point:
Opportunities are identified:
Causation Factors
Why – 59% Non Value Added Tasks4. Training and Communications
6. Total Productive Maintenance (TPM)
7. Problem & Countermeasure Systems
5. Technical Development
7 main‘Streams’ fordevelopment
Opportunities are identified:But-
Improvements can only berealised throughImplementation
Why – 59% Non Value Added TasksStratified
7 High Level Project Streams Identified

Waste: (non) Value Added
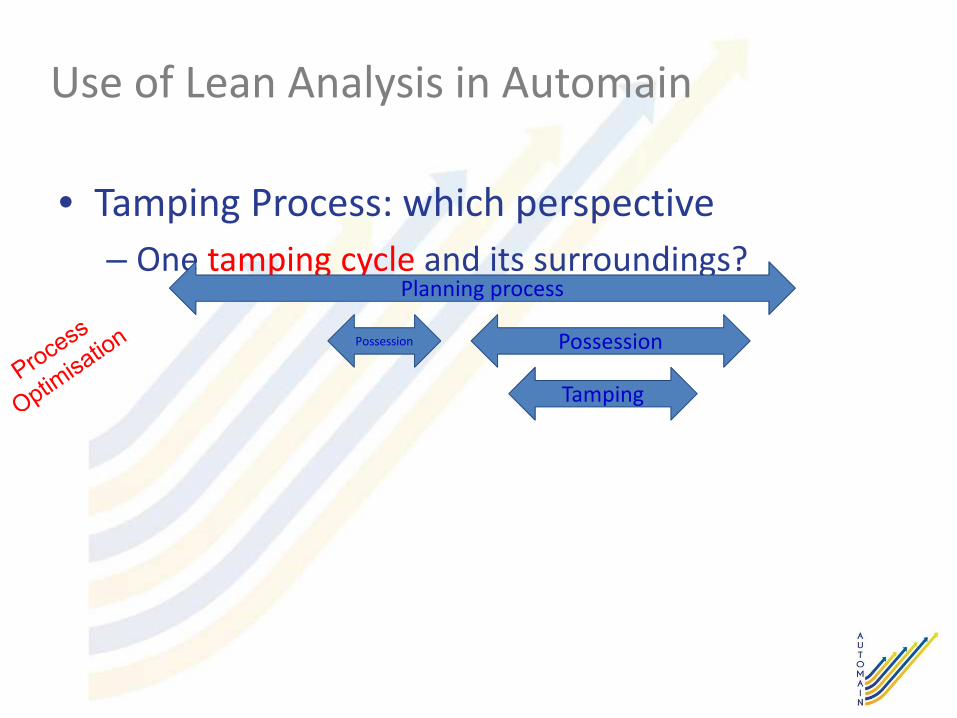
Use of Lean Analysis in Automain
• Tamping Process: which perspective
– One tamping cycle and its surroundings?
Possession
Planning process
Possession
Tamping
Use of Lean Analysis in Automain
Findings:
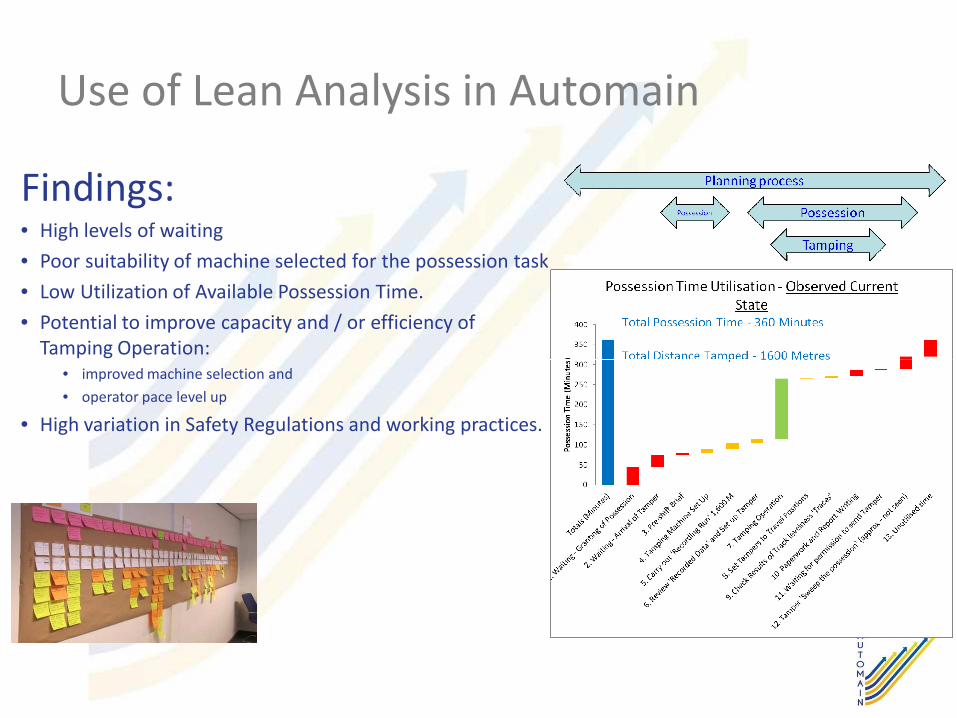
Use of Lean Analysis in Automain
Findings:• High levels of waiting
• Poor suitability of machine selected for the possession task
• Low Utilization of Available Possession Time.
• Potential to improve capacity and / or efficiency ofTamping Operation:Tamping Operation:
• improved machine selection and
• operator pace level up
• High variation in Safety Regulations and working practices.
Use of Lean Analysis in Automain
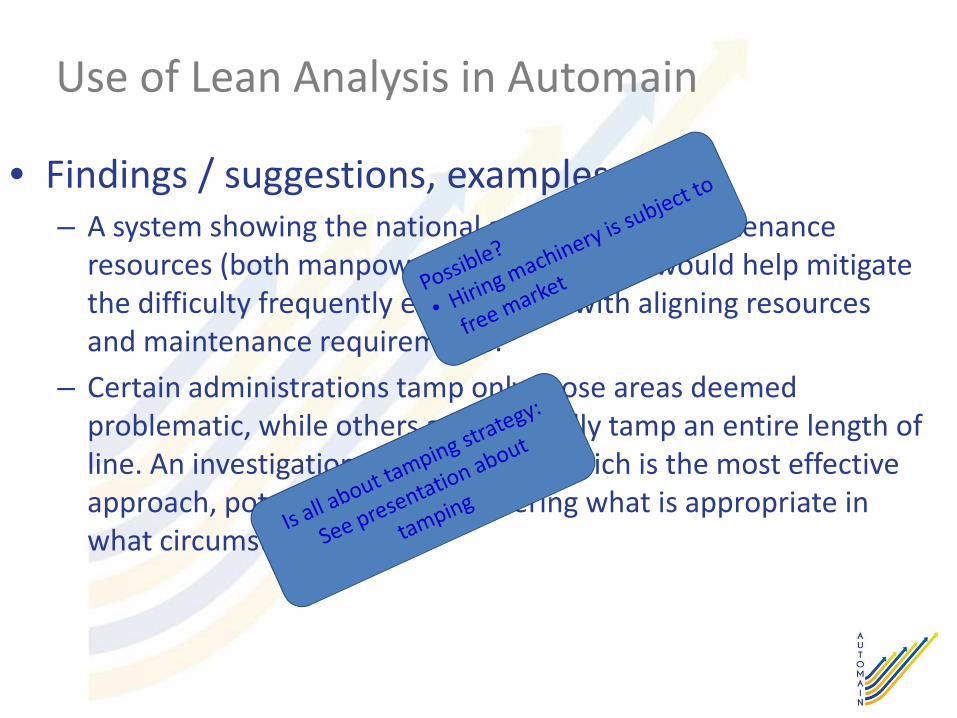
• Findings / suggestions, examples:– A system showing the national availability of maintenance
resources (both manpower and machinery) would help mitigatethe difficulty frequently encountered with aligning resourcesand maintenance requirements.and maintenance requirements.
– Certain administrations tamp only those areas deemedproblematic, while others automatically tamp an entire length ofline. An investigation is needed into which is the most effectiveapproach, potentially also considering what is appropriate inwhat circumstances.
Conclusions
• Use Lean Analysis for specific scope
– Within an organization
• Specific work methods, e.g. welding
• Hunt for waste within that specific work method• Hunt for waste within that specific work method
– With respect to the unconditioned environment
• Use Lean Analysis within sector
– With various partners involved
– Create awareness amongst partners
• for a certain subject, e.g. logistics around possessions
Top Related